Elastic Anomaly of Helium Films at a Quantum Phase Transition
Abstract
Helium films show various quantum phases that undergo quantum phase transitions by changing coverage . We found anomalous elastic phenomena in bosonic 4He and fermionic 3He films adsorbed on a glass substrate. The films stiffen under AC strain at low temperature with an excess dissipation. The onset temperature of the stiffening decreases to 0 K as approaches a critical coverage . The elastic anomaly is explained by thermal activation of helium atoms from the localized to extended states with a distributed energy gap. We determine for the first time the energy band structure of helium films from elasticity. The ground states of 4He and 3He at are identically gapped and compressible, which are possibly a sort of Mott insulator or Mott glass.
pacs:
05.30.Rt, 64.70.Tg, 67.25.bh, 67.25.dj, 67.30.ej, 68.60.BsI Introduction
Quantum phase transition (QPT) has been actively studied in condensed matter physics, because it occurs between emergent quantum phasesSachdev (2011). In particular, superfluid– and superconductor–insulator transitions in superconducting filmsDobrosavljevic et al. (2012) and ultracold atoms in optical potentialsGreiner et al. (2002); Bloch et al. (2008) are typical examples of QPTs. In superfluid–insulator QPTs, while superfluid phases are unique and well understood, there are various possibilities for insulating phases because they are determined by competition between quantum fluctuations, interparticle correlation, and external potential. In spatially periodic systems such as bosons in optical lattices, the insulating phase is Mott insulator. In disordered metals and atoms in disordered potentials, Anderson insulator and Bose glass are the candidates for insulating phases. In this paper, we propose that helium films offer a new example of QPT between a superfluid and a novel insulating phase, which has an energy gap and a finite compressibility.
Helium (bosonic 4He and fermionic 3He) films formed on solid substrates by adsorption undergo various QPTs between competing phases by changing coverage (areal density) as an external parameter. On atomically flat surface of graphite, helium films form clear layer structures from one to several atomic layersZimmerli et al. (1992). Potential corrugation provided by graphite and correlation between helium atoms produce various ordered phases such as Mott insulator, heavy Fermi fluid, nuclear magnetic phases, and coexistence of superfluid and density wave orderCasey et al. (2003); Neumann et al. (2007); Nyéki et al. (2017). On disordered substrates, such as glass and Mylar (plastic film), the situation is quite different. No clear layer structure is observed, and superfluidity emerges when exceeds a critical value , which is 6–27 mol/m2 (about 0.5–2 atomic layers) depending on substratesCsáthy et al. (2003); Crowell et al. (1995); *Crowell1997. The superfluid transition temperature increases as increases from , while films at do not exhibit superfluidity. The superfluid films undergo a well-known Berezinskii–Kosterlitz–Thouless (BKT) transition on Mylar substrateBishop and Reppy (1978); *Bishop1980, while films in porous media show both two and three-dimensional characteristics due to the macroscopic connectivity of locally two-dimensional filmsReppy (1992); Shirahama et al. (1990).
The most important feature of 4He films on disordered substrates is that there is only one “quantum critical coverage” . Films at are considered to be in an insulating phase, meaning that a superfluid–insulator QPT occurs at . We emphasize that 4He on disordered substrates realizes an ideal superfluid–insulator QPT. On graphite, 4He superfluidity and 3He magnetism are strongly influenced by corrugation from substrate. It is rather surprising that superfluid transition of 4He on Mylar shows a perfect agreement with the BKT theoryBishop and Reppy (1978); *Bishop1980, while 4He on graphite does notCrowell and Reppy (1996).
The existence of was initially explained by the so-called inert layer modelChan et al. (1974); Washburn et al. (1975). In this model, an “inert” solid layer adjacent to substrate and a superfluid layer atop the inert layer form two independent subsystems. Although this model is consistent with the fact that depends on helium–substrate potential depth, it does not explain the deviation of – relation from linearity, and the nonadditivity of heat capacityCsáthy et al. (2003). It is therefore desirable to study nature of the localized state and the QPT beyond the inert layer model.
Fisher et al. proposed that many-body effects of correlation and disorder make 4He film at localized to be a Bose glass, which is characterized by no gap and finite compressibilityFisher et al. (1989). But no evidence for the Bose glass of 4He film was found experimentally Crowell et al. (1995); *Crowell1997. We have found anomalous behavior in elasticity of helium films, an important property that is related to a compressibility of ground state. The ground state at is found to be a gapped many-body state such as Mott insulator or Mott glassGiamarchi et al. (2001), which has intermediate properties between Mott insulator and Bose glass.
Contrary to 4He, studies of 3He films on disordered substrates were few. Since 3He films show no superfluidity at currently available low temperatures and the heat capacity is dominated by a contribution from nuclear spinsGolov and Pobell (1996), critical coverage was not identified for 3He. Also in 3He films, we have observed the elastic anomaly identical to that of 4He films. The critical coverage is identified for the first time for 3He.
II Experimental method
II.1 Torsional oscillator and porous glass
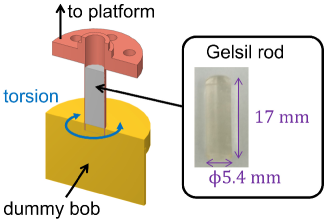
We have measured elasticity of helium films using a torsional oscillator (TO) shown in Fig. 1. Contrary to TO conventionally used in studies of superfluid helium, in which space for helium is located in the bob to measure mass decoupling, our present TO consists of a beryllium copper (BeCu) torsion rod containing a porous Gelsil glass sample and a brass dummy bob, which also acts as an electrode for torsional oscillation. Gelsil is a nanoporous silica glass manufactured by sol-gel method, and has nanopores that are randomly connected. Its structure is similar to that of porous Vycor glass, which was typically used in many superfluid helium studies. Adsorbed helium atoms form a film on the pore wall, and the atoms in fluid state can move along the wall. The Gelsil sample we used is cylindrical shape, 17 mm in length, and 5.4 mm in diameter. Before the construction of the TO, the Gelsil sample was baked at 150 ∘C in vacuum for 3 hours to eliminate adsorbed molecules, especially water. The sample mass after the baking was g. Then we took a nitrogen adsorption–desorption isotherm at 77 K for surface characterization. A surface area analyzed with Brunauer–Emmett–Teller methodBrunauer et al. (1938) is (447 ). A pore diameter distribution, analyzed with Barrett–Joyner–HalendaBarrett et al. (1951) method, has a peak at 3.9 nm. This peak pore size is larger than the nominal pore diameter 2.5 nm, which was determined by manufacturer. The Gelsil was again baked for 6 hours, and glued into the BeCu tube (6.0 and 5.5 mm in outer and inner diameter, respectively) with Stycast 1266 epoxy in a 4He atmosphere. The TO was mounted on a torsional vibration isolator consisting of a massive copper platform with large rotational moment of inertia (70 mm, 30 mm thick) and a copper torsion rod (5 mm, 30 mm long). Two brass electrodes, which are for driving and detecting the torsional oscillation, are located on the platform so as to form two parallel plate capacitors with the flat faces of the dummy bob.
The whole TO setup was attached to a cold plate under a mixing chamber of a Joule–Thomson cooled dilution refrigerator (Cryoconcept Inc.). Sample temperature was measured using a RuO2 thermometer (below 43 mK) and a calibrated germanium thermometer (43 mK–5 K) on the platform. The temperature was controlled with a Manganin twisted wire heater and the RuO2 thermometer.
II.2 Finite element method
For the present TO, the resonant frequency of the torsion mode is simply given by , where is a torsion constant (stiffness) of the rod and is a moment of inertia of the dummy bob. As is constant, an increase in by changing the coverage indicates stiffening of adsorbed film. Rigorously, however, adsorption of helium on the porous Gelsil glass may slightly contribute to the moment of inertia of the bob, therefore the effects of both stiffening and mass loading should be investigated.
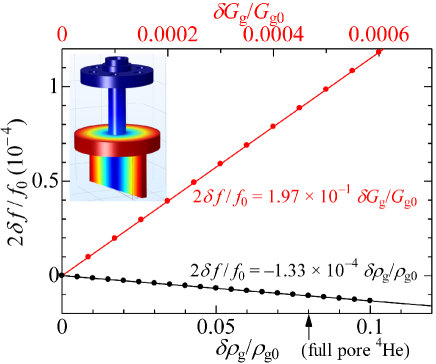
We performed simulations with finite element method (FEM) to compute how much the resonant frequency of the current TO changes by effective stiffening and mass loading of the Gelsil sample after helium adsorption. We treat the Gelsil rod as a continuous material with a Young’s modulus GPa and a Poisson’s ratio , measured by an ultrasound measurementNeg . The calculated resonant frequency by FEM was 962 Hz for the present TO, which is about 10 percent larger than the measured value 860 Hz at low temperatures. The origin of this difference in is not known. One possible reason is that the inhomogeneity of silica structure in the porous glass sample, which is not taken into account in the FEM but might affect the resonant frequency in reality. The reduced resonant frequency shift , however, is a good quantity to compare the measured value to the FEM result.
If the adsorbed helium film stiffens, the apparent shear modulus of Gelsil substrate will increase, i.e. . Helium adsorption also increases the apparent density of Gelsil, i.e. . The frequency changes for small and are well fitted by linear functions as shown in Fig. 2. The results are
| (1) |
and
| (2) |
The effect of elasticity is larger than that of mass loading by a factor of in the present TO.
The effective density change in the Gelsil due to helium adsorption is
| (3) |
where is mass of a helium atom, the coverage, Avogadro’s constant, and the density of bulk liquid helium. , g, , and are the surface area, the mass, the porosity, and the density of the Gelsil sample, respectively. For example, of 4He film gives and . Even if the pores are filled with liquid 4He, it gives , hence . Therefore, if we measure a frequency increment greater than ( mHz) for any coverage of 4He or 3He, it is explained by changes in elasticity. Mass decoupling by the superfluid and “supersolid” transitions and by slippage phenomenon Hieda et al. (2000) is excluded from the origin.
II.3 Experimental procedure
We first performed the measurement for 4He films. Then the TO was warmed up to room temperature to get rid of 4He, and the measurement for 3He was made. For each run, the resonant frequency and energy dissipation of the TO without helium film were measured at first.
The TO was forced to oscillate electrostatically at the resonant frequency using a loop circuit. The driving was made by applying a pulsed voltage of 1.5 V and a width of 50 , with dc bias voltage 200 Vdc, which was applied to the dummy bob electrode. In this condition, the strain applied to Gelsil rod is estimated to be , and the maximal velocity at the Gelsil rim near the dummy bob is 15 m/s. We confirmed that the oscillation amplitude is linear to the drive voltage around this condition. The resonant frequency was measured by a frequency counter stabilized by a rubidium frequency standard.
The dissipation was taken from the current due to capacitive change measured by a lock-in amplifier. After the drive voltage is stopped, decreases exponentially with time; , where is a relaxation time. The inverse of the dissipation gives Q factor of oscillation, which is . The Q factor is proportional to the current at a drive, , and the constant was measured before the warming and after the cooling at the lowest temperature for each coverage. We confirmed that does not change during a run. For the 4He run, , and for the 3He run, . The dissipation at each temperature is obtained from the corresponding current .
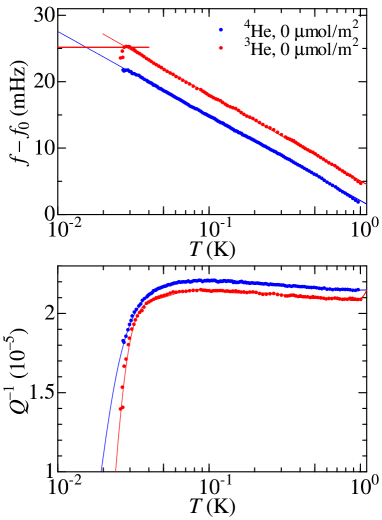
We refer to the temperature dependencies of and without helium (, empty cell) as the background. The resonant frequencies of the TO at and at 1.0 K were Hz for 4He and Hz for 3He run. The slight difference between two runs was by a thermal cycle. Fig. 3 shows the resonant frequency from which a constant is subtracted and the energy dissipation of for the 4He and 3He runs as a function of temperature. The frequency was found to be linear in at mK. We fit by
| (4) |
The fitting results are shown in Fig. 3. For the 3He run, takes a maximum at about 30 mK and decrease with further lowering , probably by the effect of tunneling two-level systems (TLS) in the glass sampleEnss and Hunklinger (2005). We assume that is constant below 30 mK because the number of data are not sufficient to fit the dependence.
The dissipation slightly increases as decreases from 1 K to 80 mK, followed by a sudden drop below 50 mK. We fit by polynomial
| (5) |
For preparing an adsorbed helium film, a known amount of helium gas was admitted from a room temperature gas-handling system with 1 L standard volume to the TO at mK. We have used commercial G1 grade 4He gas with impurity concentration less than , and 3He gas with nominal purity 99.95 %. After adsorbing helium gas at low temperature, the TO was warmed up at sufficiently high temperature, typically 1–5 K, for several hours to uniformly spread out in the Gelsil. The TO was again cooled to 10–30 mK and then warmed up to 1.1 K to measure the temperature dependence of the resonant frequency and the dissipation . Data shown in this paper were taken during the warming. The warming was done with PID control of the heater power while the dilution refrigerator was properly operated. After the warming, the heater was turned off and the TO was cooled, and adsorption for the next coverage was started. No hysteresis was observed in the data between the warming and cooling.
The annealing temperature and duration were selected so that the frequency and the amplitude become stable. For 4He films of coverage mol/m2, the annealing was done at 5 K for 5 hours. At mol/m2, it was done at 1.1 K for more than 14 hours. For 3He films, we annealed at 5 K for 5 hours for all coverages. For 16 mol/m2 of 3He, we first annealed at 1.1 K for 12 hours as in the case of 4He film. However, this condition was not sufficient because the frequency and dissipation were almost the same as those of previous mol/m2 data. This indicates that 3He atoms in the extended state (see later section) are less mobile than 4He atoms. We finally found that the annealing at 5 K for 5 hours was sufficient for 3He.
III Results and Discussion
III.1 Raw data

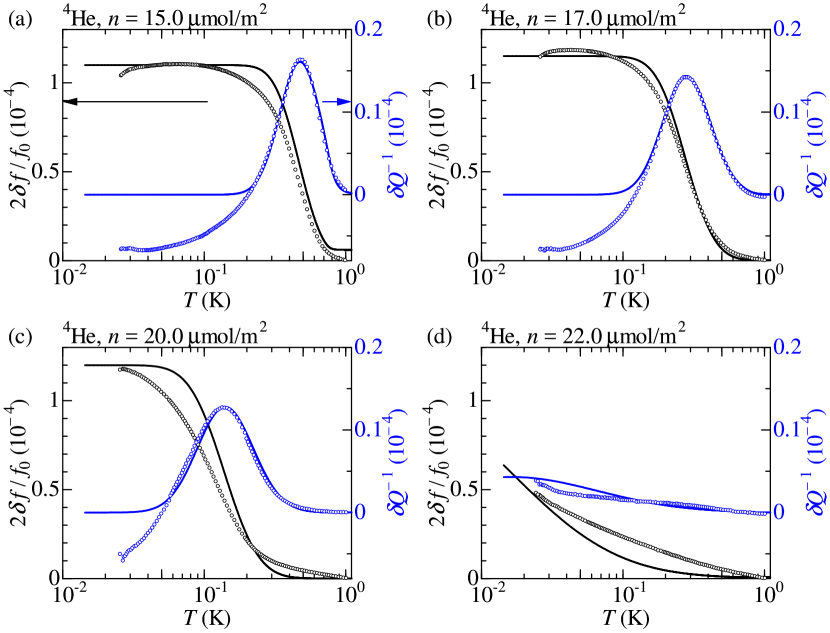
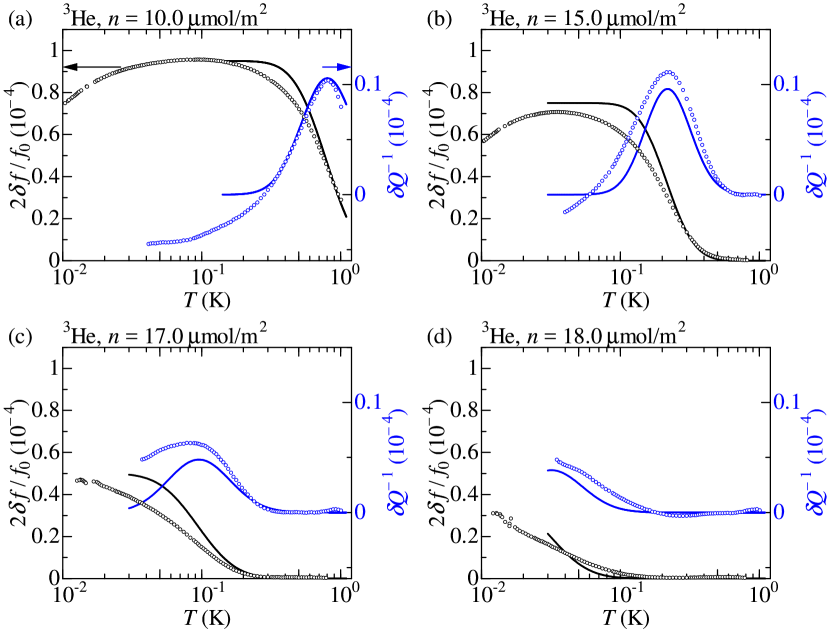
In Fig. 4, we show raw data for the coverage from 0 to 23 mol/m2 for 4He, and to 20 mol/m2 for 3He, respectively. The dots in black are the background (). Helium adsorption () increases in the entire temperature range from the background.
At each coverage, increases as decreases more rapidly than the background does. By comparing the data with FEM simulations, we find that the observed increase in is originated from change in elasticity of helium adatoms. The FEM simulation shows that if 15 of 4He were decoupled from the oscillation, would increase by 1.5 mHz, which is nearly two orders of magnitude smaller than the observed increment at lowest , mHz. Therefore, the increase in TO frequency is not due to the change in mass loading, i.e. superfluidity, supersolidity and slippage of helium films, but is originated from stiffening of helium films.
The dissipation has a peak at a temperature where the slope of is the largest, and its position decreases with increasing . As decreases further, tends to saturate and decreases. These behaviors of and are qualitatively the same for 4He and 3He films. We call these phenomena elastic anomaly. The elastic anomaly vanishes at and 20 for 4He and 3He, respectively. We can regard these coverages as the critical coverage . We will discuss later that determined from the elastic anomaly in 4He is identical to for the onset of superfluidity within the experimental accuracy. At coverages , both and are almost identical to those of the background, except for small upward shift in at all temperatures ( and mHz for 4He and 3He, respectively). Therefore, in the superfluid phase of 4He and liquid phase of 3He, no prominent elastic anomaly is observed. It is remarkable that at the TO behaves as if there were no adsorbed helium except the temperature-independent shift.
The gradual increase in suggests a crossover of helium film from a soft to a stiff state, not a first order phase transition such as solidification.
Comparing the resonant frequencies at 15 and 23 of 4He, for instance, we see that is larger than in the entire temperature range. This means that the thinner film has a larger elastic constant than the thicker film does. Such a coverage dependence of elastic anomaly can never be explained by the inert layer model. We show below that a two-band model considering gapped excitation in the localized state explains qualitatively the observed elastic anomaly.
III.2 Anelastic model and energy gap
The temperature dependencies of and are typical of a relaxational crossover between a soft state at high and a stiff state at low under AC stress applied to a substrate-He system. Assuming that the relaxation is caused essentially by adsorbed helium, the relaxational contribution to and is obtained by subtraction of the background from the raw data. We define the frequency shift by
| (6) |
By this definition, we have omitted the background and the small constant frequency increments which were seen for all coverages (see at high temperatures), so as to set at 1.0 K. The temperature-independent extra background is attributed to adsorption of atoms in particularly deep potential sites on the disordered substrate, and this omission was necessary for the fitting of data to the response function given later. We also define the excess energy dissipation by
| (7) |
This definition was sufficient for the data of 4He, but we have added a small constant to set for the data of 3He.
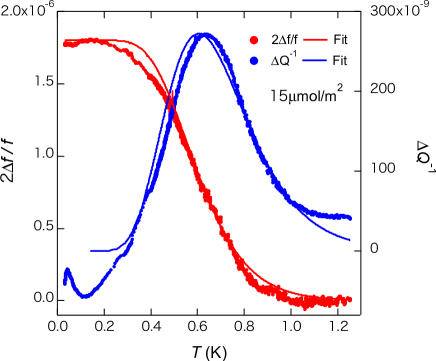
Figure 5 shows a normalized frequency shift and an excess dissipation for 4He at mol/m2. Other data, including 3He data, are presented in Figs. 9 and 10 in Appendix. The dissipation becomes negative below 0.1 K, meaning that helium adsorption decreases the internal loss of the glass. The physical origin of this apparently negative dissipation has not been elucidated.
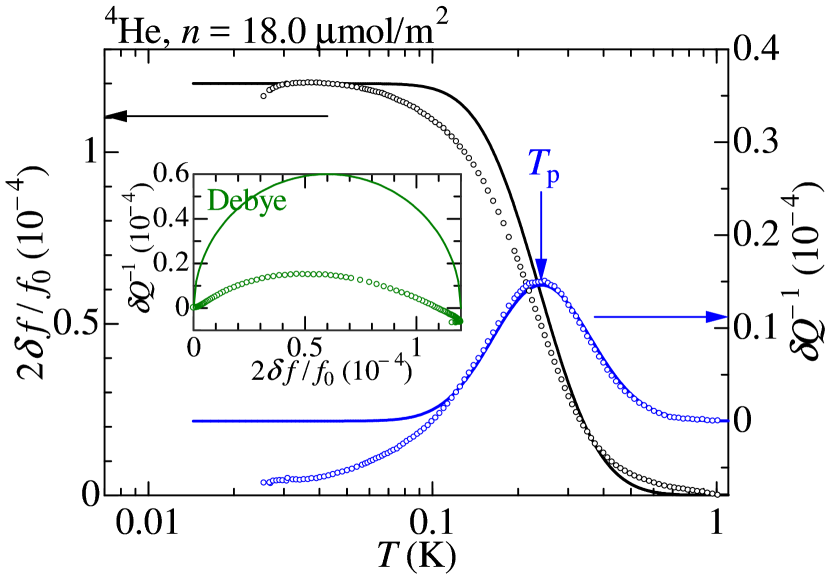
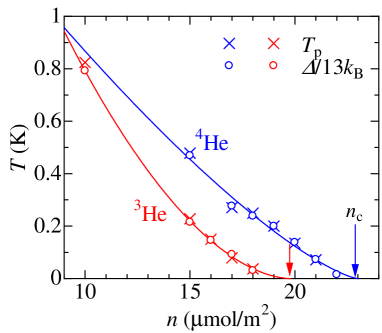
The dissipation-peak temperature is indicated by an arrow in Fig. 5. It can be recognized as a crossover temperature between the stiff and the soft state. The coverage dependence of is shown in Fig. 6. approaches 0 K at with a concave curvature.
The relaxational crossover is explained by a thermal activation process of helium adatoms between two discrete energy bandsTait and Reppy (1979); Crowell et al. (1995). At , helium atoms are localized and forms an energy band. At finite temperatures, the localized atoms are thermally excited to another band of extended states separated by an energy gap. The excited atoms move freely along the substrate and act as a normal fluid. We analyze and by dynamic response functions for anelastic relaxation, according to similar anelasticity analysis for bulk solidsNowick and Berry (1972)
| (8) | |||
| (9) |
where and are a relaxed shear modulus and a shear modulus of TO rod respectively, and . The dissipation has a peak at . The thermal relaxation time is given by , where is an energy gap (an activation energy) and is an attempt frequency. Now it becomes clear that the dissipation-peak temperature is the temperature which holds .
If were single valued, the relaxation would be a Debye type and the plot of versus would be a semicircle shown in the inset of Fig. 5. The plot is, however, a deformed semicircle, meaning that has a distribution.
We assume a log-normal distribution for
| (10) |
where is the median (a value separating the higher half of the population from the lower half). We hereafter regard as the energy gap. The selection of a log-normal distribution is reasonable because is almost symmetric for scale as shown in Fig. 5. We obtain a complex form of the dynamic response function as
| (11) |
We perform fittings of Eq. (11) to the data. The results are shown with solid curves in Fig. 5, and Figs. 9 and 10 in Appendix. Equation (11) fits well to the data, and the negative below 0.1 K does not give much influence to the quality of the fittings.
We find a remarkable relation between and , , for both 4He and 3He, as clearly shown in Fig. 6. This relation between and reinforces the validity of the fittings. Other fitting parameters, , and , have no systematic dependencies on . The inverse attempt frequency is ranged from 0.4 to 0.6 ns, which holds the aforementioned relation .
Figure 6 shows that and monotonically decrease with some scatters. The gap is fitted by a power law
| (12) |
Nonlinear fittings give , and for 4He, and , and for 3He, respectively.
III.3 Energy band and compressibility
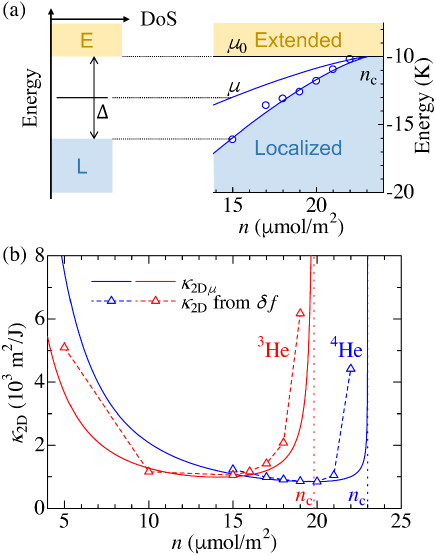
The fact that smoothly decreases to zero as indicates that the energy band also smoothly changes with . We propose an energy band in Fig. 7(a). The localized states are completely filled at , and its uppermost edge is determined by . Atoms in the localized states contribute to the elasticity. On the other hand, the extended states are empty at , and their lowermost edge, , has no or negligible dependence on . At high , helium atoms are thermally excited from the localized to the extended states, resulting a softening. At , the gap is closed, and helium atoms can enter the extended states even at . 4He atoms condensed in the extended states show superfluidity. This scenario was first discussed by Crowell et al. in a heat capacity study of 4He filmsCrowell et al. (1995); *Crowell1997.
The band for each is analogous to that of intrinsic semiconductor. The chemical potential at is a function of and is located at the middle of the gap, so that
| (13) |
The 2D compressibility is, by definition,
| (14) |
where is the Avogadro constant ( is a 2D number density of atoms). We refer to the 2D compressibility obtained from as . From Eqs. (12), (13) and (14), we get
| (15) |
The results are drawn in Fig. 7(b) with solid curves.
The 2D compressibility is also obtained by directly comparing the observed frequency increment with Eq. (1), the FEM result. Here is frequency increment from at the lowest temperature. We use , not , as the reference value because contains the elastic contribution from atoms in deep potential sites which we want to exclude from the calculation. The shear modulus of Gelsil is GPa from an ultrasound studyNeg . With a general relation , where is a bulk modulus and is a Láme constant, an effective 3D compressibility of helium film is . It is converted to the 2D compressibility by , where is mean film thickness and is molar volume of helium film. Since is unknown, we employ of liquid helium at 0 bar, which might be larger than . Combining these equations, we have
| (16) |
In Fig. 7(b), we plot obtained from Eq. (16). The overall agreement between and from definitely assures the proposed band. In both 4He and 3He, first decreases, then makes a plateau, and finally shows divergent behavior as approaches .
III.4 Phase diagram
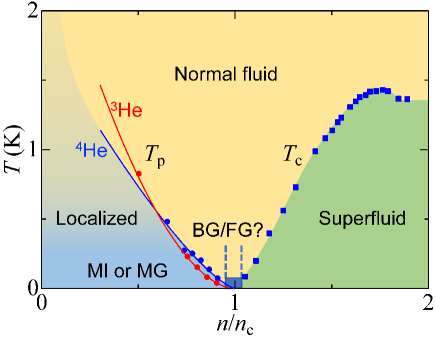
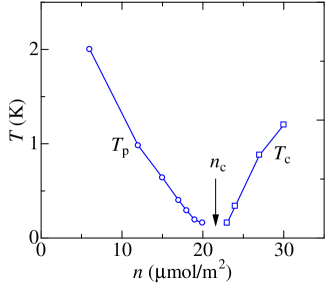
The universality in 4He and 3He films is revealed by constructing a “unified” phase diagram shown in Fig. 8. The peak temperatures ’s of 4He and 3He as a function of nearly collapse onto each other, except that the curvatures differ. The difference of the zero-point energy, hence the binding energy from the substrate, between 4He and 3He does not affect the magnitude of the characteristic temperatures of the elastic anomaly.
Superfluid transition temperatures ’s of 4He on Gelsil in a previous TO studyYamamoto et al. (2004) are also plotted in Fig. 8. The critical coverage for it was inferred to be , which is slightly smaller than 23 for the elastic anomaly. The nominal pore diameters were 2.5 nm for both porous Gelsil samples, but they were provided by different manufacturers. The discrepancy in might be originated from differences in some characteristics such as residual impurities, pore size and its distribution between two samples.
In a previous TO study, a TO with a Gelsil in the bob (named TO1, see Appendix B) has detected both the superfluid transition and the elastic anomaly, the latter is confirmed by the present study. The two characteristic temperatures, and , meet at the same critical coverage in the experimental resolution (see Fig. 13 in Appendix B). A heat capacity study by Crowell et al.Crowell et al. (1997) may also suggests the common critical coverage for “” and , though the physical meaning of , a crossover temperature of the heat capacity at , is not clear. Further experimental studies in the vicinity of is necessary to conclude that the ’s of the superfluidity and the elastic anomaly are exactly identical or slightly different.
Figures 6 and 8 show that and obey a power law with . A symmetry may exist between the critical exponent of and that of superfluid of 4He films, in which with in all previous resultsCsáthy et al. (2003); Crowell et al. (1997).
Our finding is that 4He and 3He films at are identically gapped and compressible irrespectively of quantum statistics. These features do not strictly agree with the properties of Bose glass (gapped, compressible, for 4He)Fisher et al. (1989), Mott insulator (gapped, incompressible) or Mott glass (single-particle gap, incompressible)Giamarchi et al. (2001).
We propose, however, that the localized helium film is a sort of Mott insulator or Mott glass in a realistic situation. One may consider the following model: Helium atoms are first adsorbed on some particularly deep adsorption sites, so as to weaken randomness. Additional helium atoms are adsorbed on the weakened potential surface, and self-organize a nearly spatially periodic 2D Mott insulator or Mott glass with an -dependent lattice spacing. The self-organization of sites allows a finite compressibility. The gap is finite because “sites are fully occupied” and an atom needs a finite energy to move.
Tackling this problem is important because it is related the nature of the onset of superfluidity, the quantum critical phenomena and the boson and fermion localization. Theoretical, numerical, and more experimental works are desired.
The gapped localized state which terminates at a certain coverage () has been observed in helium films on various substrates, such as VycorTait and Reppy (1979); Crowell et al. (1997), Hectorite (2D flat substrate), FSM (1D pores), and zeolitesWada et al. (2009). This suggests that the gapped localized Mott insulator or Mott glass ubiquitously exists, irrespectively of substrate randomness and dimensionality.
As to the 4He films, our result does not reject possibility of Bose glass in the vicinity of , where the gap is almost closed and the compressibility significantly increases. Theories predict Bose glass emerging between Mott insulator and superfluid in the presence of moderate disorderFisher et al. (1989). The previous experiment discussed a quantum critical behavior of possible Bose glass near Crowell et al. (1997). In our system, Bose glass can exist at about mol/m2, and a corresponding Fermi glass can occur in 3He at mol/m2. Recently, QPTs among Mott insulator, Mott glass, Bose glass and Bose-Einstein condensate are realized in a quantum magnetYu et al. (2012). Helium films in disordered substrates can open a new perspective of QPTs for advantage of variable correlation and quantum statistics.
IV Conclusions
We have discovered that the localized 4He and 3He films on a porous glass show an identical elastic anomaly. The elastic anomaly is explained by thermal activation of helium atoms from the localized to extended states with a distributed energy gap, which decreases as the film approaches the critical coverage . The two-dimensional compressibility showed divergent behavior near , which was deduced from the power low behavior of the gap and the energy band. The divergent behavior of the compressibility was confirmed from the direct calculation of the observed frequencies. Both the localized 4He and 3He are gapped and compressible, suggesting that the ground state is a sort of Mott insulator or Mott glass. Future studies in the vicinity of at lower temperatures will unveil the nature of the QPT.
Acknowledgements.
We thank M. Kobayashi, T. Ohtsuki and A. J. Beekman for useful discussions, and T. Kogure, H. Yoshimura, R. Higashino and Y. Shibayama for the previous torsional oscillator study using TO1 in Appendix. This work was supported by JSPS KAKENHI Grant Number JP17H02925. TM was supported by Grant-in-Aid for JSPS Research Fellow 18J13209, Research Grant of Keio Leading-edge Laboratory of Science and Technology, and Keio University Doctorate Student Grant-in-Aid Program.Appendix A Additional data for the fittings
We show in Figs. 9 and 10 additional data from which the background is subtracted. The results of fittings to Eq. (11) are also shown.
Appendix B Interpretation of standard torsional oscillator experiments
Our direct elasticity measurement was motivated by the observation of frequency shift and excess dissipation in a torsional oscillator for the study of superfluid properties of 4He films in porous Gelsil glass. Here we briefly discuss the results and interpretation in the previous TO studies.
Two TOs, which we refer to as TO1 and TO2, were employed as shown in Fig. 11. Each TO contained a disk sample of porous Gelsil glass inside the torsion bob. In TO1, we glued all the faces of the glass sample to the wall by Stycast 1266 epoxy. The epoxy penetrated to the hole of the torsion rod was carefully removed by inserting a drill bit. On the other hand, in TO2, there was an open space between the porous glass and one side of the wall of the bob, at which the torsion rod is attached.
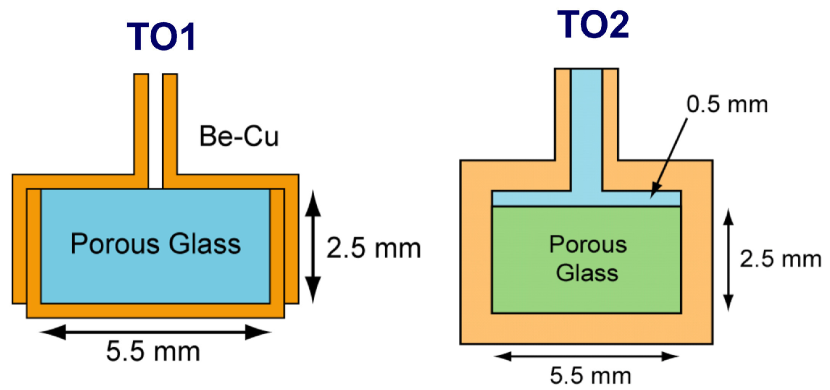
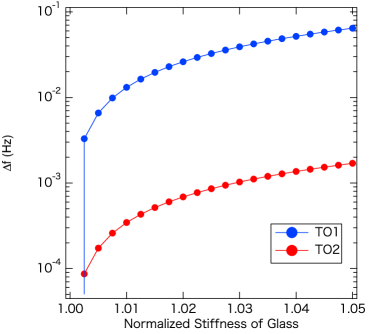
We performed measurements of and of TO1 and TO2 with adsorbed 4He at mol/m2. In TO1, we observed an increase in accompanied by a dissipation peak at mol/m2, as in the case of the present work. Figure 12 shows a result of fitting to the observation, which are converted to the normalized frequency shift and excess dissipation . We see that the overall dependencies of TO1 are identical to the results of the present TO, in which the Gelsil sample is located in torsion rod. The fitting of the data to the complex response functions described in the main text works well. We confirmed that in TO1 the dependence of the behaviors on and the obtained fitting parameters such as energy gap are also identical to the present TO. At , ordinary superfluid transitions were observed as an increase in below . The dissipation-peak temperature and the superfluid transition temperature are plotted in Fig. 13. The critical coverages determined from the dependencies of and are identical within the accuracy of the data.
In TO2, however, such an elastic anomaly below was not observed, while the superfluid transition was seen at as in TO1. The superfluid transition temperature in Fig. 8 is from TO2 Yamamoto et al. (2004). We have found that the absence of the elastic anomaly in TO2 is originated from the existence of open space between a face of porous glass disk and the wall of the TO cell near the torsion rod. We calculated the change in resonant frequency when the shear modulus of glass inside the TO bob increases, assuming the structures of TO1 and TO2 in FEM simulations. The results are shown in Fig. 14. When the shear modulus of glass inside TO1 increases 5 percent, increases about 60 mHz, while it increases only 2 mHz in TO2.
We interpret these results as follows: In a realistic TO made of metal for superfluid studies, the torsion bob is not rigid, and the resonant frequency of the fundamental torsion mode is determined not only by the shear modulus of the torsion rod but also by the shear modulus of the torsion bob, which consists of porous glass, BeCu enclosure and adsorbed helium in our experiments. This non-ideal nature of TO has been established by studies of apparent supersolidity of bulk solid 4He using TOs with many different designsKim and Chan (2004); Aoki et al. (2014); Kim and Chan (2012). In particular, it has been realized as the Maris effect that the stiffness of the part of TO near the torsion rod has a large contribution to resonant frequencyMaris (2012). The presence of the elastic anomaly in TO1 and its absence in TO2 may be a manifestation of the Maris effect. In TO2, the stiffening of porous glass sample by helium adsorption will hardly contribute to the total torsion constant by the existence of open space inside the bob. We emphasize that this effect would be revealed only by FEM simulations, because it is difficult to calculate analytically the resonant frequency of a realistic TO with complicated structure and composites of different materials.
References
- Sachdev (2011) S. Sachdev, Quantum Phase Transitions, 2nd ed. (Cambridge University Press, 2011).
- Dobrosavljevic et al. (2012) V. Dobrosavljevic, N. Trivedi, and J. V. James M., eds., “Conductor-insulator quantum phase transitions,” (Oxford University Press, 2012).
- Greiner et al. (2002) M. Greiner, O. Mandel, T. Esslinger, T. W. Hänsch, and I. Bloch, Nature 415, 39 (2002).
- Bloch et al. (2008) I. Bloch, J. Dalibard, and W. Zwerger, Rev. Mod. Phys. 80, 885 (2008).
- Zimmerli et al. (1992) G. Zimmerli, G. Mistura, and M. H. W. Chan, Phys. Rev. Lett. 68, 60 (1992).
- Casey et al. (2003) A. Casey, H. Patel, J. Nyéki, B. P. Cowan, and J. Saunders, Phys. Rev. Lett. 90, 115301 (2003).
- Neumann et al. (2007) M. Neumann, J. Nyéki, B. Cowan, and J. Saunders, Science 317, 1356 (2007).
- Nyéki et al. (2017) J. Nyéki, A. Phillis, A. Ho, D. Lee, P. Coleman, J. Parpia, B. Cowan, and J. Saunders, Nature Physics 13, 455 (2017).
- Csáthy et al. (2003) G. A. Csáthy, J. D. Reppy, and M. H. W. Chan, Phys. Rev. Lett. 91, 235301 (2003).
- Crowell et al. (1995) P. A. Crowell, F. W. Van Keuls, and J. D. Reppy, Phys. Rev. Lett. 75, 1106 (1995).
- Crowell et al. (1997) P. A. Crowell, F. W. Van Keuls, and J. D. Reppy, Phys. Rev. B 55, 12620 (1997).
- Bishop and Reppy (1978) D. J. Bishop and J. D. Reppy, Phys. Rev. Lett. 40, 1727 (1978).
- Bishop and Reppy (1980) D. J. Bishop and J. D. Reppy, Phys. Rev. B 22, 5171 (1980).
- Reppy (1992) J. D. Reppy, J. Low Temp. Phys. 87, 205 (1992).
- Shirahama et al. (1990) K. Shirahama, M. Kubota, S. Ogawa, N. Wada, and T. Watanabe, Phys. Rev. Let. 64, 1541 (1990).
- Crowell and Reppy (1996) P. A. Crowell and J. D. Reppy, Physical Review B 53, 2701 (1996).
- Chan et al. (1974) M. H. W. Chan, A. W. Yanof, and J. D. Reppy, Phys. Rev. Lett. 32, 1347 (1974).
- Washburn et al. (1975) T. E. Washburn, J. E. Rutledge, and J. M. Mochel, Phys. Rev. Lett. 34, 183 (1975).
- Fisher et al. (1989) M. P. A. Fisher, P. B. Weichman, G. Grinstein, and D. S. Fisher, Phys. Rev. B 40, 546 (1989).
- Giamarchi et al. (2001) T. Giamarchi, P. L. Doussal, and E. Orignac, Phys. Rev. B 64, 245119 (2001).
- Golov and Pobell (1996) A. Golov and F. Pobell, Phys. Rev. B 53, 12647 (1996).
- Brunauer et al. (1938) S. Brunauer, P. H. Emmett, and E. Teller, J. Am. Chem. Soc. 60, 309 (1938).
- Barrett et al. (1951) E. P. Barrett, L. G. Joyner, and P. P. Halenda, J. Am. Chem. Soc. 73, 373 (1951).
- (24) Y. Negishi, and K. Shirahama, unpublished.
- Hieda et al. (2000) M. Hieda, T. Nishino, M. Suzuki, N. Wada, and K. Torii, Phys. Rev. Lett. 85, 5142 (2000).
- Enss and Hunklinger (2005) C. Enss and S. Hunklinger, Low-Temperature Physics (Springer, 2005).
- Tait and Reppy (1979) R. H. Tait and J. D. Reppy, Phys. Rev. B 20, 997 (1979).
- Nowick and Berry (1972) A. S. Nowick and B. S. Berry, Anelastic Relaxation in Crystalline Solids (Academic Press, New York and London, 1972).
- Boninsegni (2010) M. Boninsegni, J. Low Temp. Phys. 159, 441 (2010).
- Yamamoto et al. (2004) K. Yamamoto, H. Nakashima, Y. Shibayama, and K. Shirahama, Phys. Rev. Lett. 93, 075302 (2004).
- Wada et al. (2009) N. Wada, T. Matsushita, M. Hieda, and R. Toda, Journal of Low Temperature Physics 157, 324 (2009).
- Yu et al. (2012) R. Yu, L. Yin, N. S. Sullivan, J. S. Xia, C. Huan, A. Paduan-Filho, N. F. Oliveira Jr, S. Haas, A. Steppke, C. F. Miclea, F. Weickert, R. Movshovich, E.-D. Mun, B. L. Scott, V. S. Zapf, and T. Roscilde, Nature 489, 379 (2012).
- Kim and Chan (2004) E. Kim and M. H. W. Chan, Science 305, 1941 (2004).
- Aoki et al. (2014) Y. Aoki, I. Iwasa, T. Miura, D. Takahashi, A. Yamaguchi, S. Murakawa, and Y. Okuda, J. Phys. Soc. Jpn. 83, 084604 (2014).
- Kim and Chan (2012) D. Y. Kim and M. H. W. Chan, Phys. Rev. Lett. 109, 155301 (2012).
- Maris (2012) H. J. Maris, Phys. Rev. B 86, 020502 (2012).