Gas outflows from the z= 7.54 quasar: predictions from the BlueTides Simulation.
Abstract
Many theoretical models predict that quasar driven outflows account for the observed quenching of star formation in massive galaxies. There is growing observational evidence for quasar-launched massive outflows at z>6, while the details of outflow-host galaxy interaction remain obscure. In this paper, we study the feedback around the highest redshift quasar in the BlueTides simulation, the largest volume cosmological hydrodynamic simulation so far carried out. We present predictions for gas outflows around the brightest quasar which hosts the most massive black hole in the simulation volume, which has grown to black hole mass consistent with the current record holder for high-z quasars. We introduce a method to identify and trace the gas outflowing from the halo. We find that the total mass of the outflow gas is about , constituting 6% of the total gas in the halo. The outflow gas contains a cold, dense molecular component with mass about , that originates from the inner region of the halo, within a few kpc of the central black hole. The velocities of the outflow gas reach thousands of km/s, within which the molecular component has mass averaged outward radial velocity of km/s, consistent with observations. The averaged outflow rate is about , with the outflowing gas mainly in a hotter ( K) and lower density state than the average of the host halo gas.
keywords:
methods: numerical - galaxies: evolution - quasars: supermassive black holes1 Introduction
High redshift quasars are powerful tracers of black hole growth and galaxy formation in the early Universe. Surrounded by gas of high density, the accretion rate of a quasar can reach near Eddington levels, leading to extremely high luminosity. Observed scaling relation between SMBH mass and properties (e.g, the bulge mass, the central velocity dispersion) of the host galaxy indicate a strong connection between the supermassive black hole in the center of the galaxy and the evolution of its host (Silk & Rees, 1998; Kormendy & Ho, 2013). The feedback from AGN appears to be essential for galaxy evolution, being a good candidate to quench star formation in early galaxies (Fabian, 2012; Cheung et al., 2016). The high radiation output of quasars can couple to the surrounding gas, heating up and launching powerful hot gas outflows. A giant outflow may halt the global inflow of cooling halo gas from filamentary accretion and thus restrict the fuel for star formation. Outflow gas may also couple to cold dense molecular gas in the galactic disk and quench the star formation by directly expelling a fraction of the star forming gas from the host galaxy.
Discovery of old, passive and massive galaxies at (e.g. Cimatti et al., 2004; Saracco et al., 2005) implies that the quasar driven feedback quenching mechanism must have been at work at high-z. Observational evidence for massive quasar-driven outflows at high redshifts(z>6) has already been found. In the host galaxy of SDSS J1148+5251 at z=6.4, a powerful gas outflow has been detected (Maiolino et al., 2012) through the presence of extremely broad wings of the [C \@slowromancapii@] emission line extending from km/s to km/s from the systemic velocity, resolved on scale of kpc. Cicone et al. (2015) further indicated that the outflow has a complex morphology in cold dense molecular gas, which is distributed up to kpc from the center of the host galaxy, and revised the lower limit of the mass outflow rate to /yr.
The details of the interaction between outflow and host galaxy, and how the cold, molecular component couples to the hot outflow gas still remains unclear. Recent simulation studies (e.g. Costa et al., 2015; Curtis & Sijacki, 2016; Biernacki & Teyssier, 2018; Barai et al., 2018) show that dense and cold gas can emerge from galaxies at high velocity, but so far do not include direct prescriptions for the molecular gas component in the simulation. The claim is made that the powerful outflows of dense, cold gas only occur when supernova and AGN driven outflows work in tandem. Costa et al. (2015) deduced that the cold gas comes from radiative cooling of the hot AGN-driven outflow when propagating through a clumpy medium pre-enriched with metals from SN. Biernacki & Teyssier (2018) inferred that the cold gas in outflow originates from the metal-enriched SN-driven galactic fountain, and is then further accelerated by the hot AGN-driven outflow so that it sweeps through the full extent of halo.
Observations of quasar J1342+0928 with black hole mass at z=7.54 have been reported in Bañados et al. (2017). This is the highest redshift quasar yet observed, residing in a crucial stage of reionization epoch. Venemans et al. (2017) further reported the detection of copious amounts of dust and [C II] emission from the interstellar medium (ISM) of its host galaxy.
The outflow of a quasar at this high redshift () has not yet been detected. In this paper we present prediction on the gas outflow in the host halo of the most massive quasar in BlueTides simulation, covering the epoch from z=8 to z=7.54. The mass of the central blackhole has grown to by z=7.54, quite close to the value for the newly observed earliest quasar. We study the gas outflow with large radial velocity in the simulation at this (currently unexplored) high redshift and directly track the cold molecular phase in the outflow.
The paper is organized as follows: we introduce the Bluetides simulation code and our method to determine which are the outflowing gas particles in section 2, present our results for outflow properties in section 3, and give summary of our findings in section 4.
2 Methods
2.1 BlueTides simulation
The BlueTides cosmological simulation (Feng et al., 2016) uses the Pressure Entropy Smoothed Particle Hydrodynamics code MP-Gadget to follow the evolution of a cubical volume containing particles. The initial conditions are at and the run has reached below . The large volume and high resolution of BlueTides, almost 200 times larger than either the Illustris (Vogelsberger et al., 2014), or EAGLE (Schaye et al., 2015), simulations, makes it ideally suited to study rare objects at high-redshift, along with the detailed structure and physical properties of their internal and surrounding gas.
BlueTides implements a variety of sub-grid models for physical processes so that their effects on galaxy formation can be studied. Star formation is based on a multi-phase star formation model (Springel & Hernquist, 2003) with modifications following Vogelsberger et al. (2013). Gas is allowed to cool through both radiative processes (Katz et al., 1999) and metal cooling (Vogelsberger et al., 2014). Type II supernova wind feedback (the model used in Illustris (Nelson et al., 2015)) is included, assuming wind speeds proportional to the local one dimensional dark matter velocity dispersion. The large volume of BlueTides also allows to include a model of "patchy reionization" (Battaglia et al., 2013), yielding a mean reionization redshift , and incorporating the UV background estimated by Faucher-Giguère et al. (2009).
The feedback from AGN is modeled in the same way as for the MassiveBlack I and II simulations, which results in self-regulated super-massive black hole accretion following (Di Matteo et al., 2005). Super-massive black holes are seeded with an initial mass of in halos more massive than . The bolometric luminosity of AGN is , with being the mass-to-light conversion efficiency in the accretion process. 5% of the radiation energy is thermally coupled to the surrounding gas as feedback energy, deposited in a sphere of twice the radius of the SPH smoothing kernel of the black hole. The AGN feedback energy only appears in the kinetic form through this thermal energy deposition, and no other coupling (e.g., radiation presssure) is included.
We model the formation of molecular hydrogen and its effect on star formation at low metallicities following the prescription of Krumholz & Gnedin (2011). Since our work directly predicts the molecular gas component in the outflow, we briefly review the sub-grid physics used in the simulation for estimating the mass fraction here. The approach starts with a spherical gas cloud immersed in a uniform Lyman-Werner band radiation field and assumes the cloud is in steady state to solve the radiative transfer and formation-dissociation balance equations. After some approximations, McKee & Krumholz (2010) found the result
| (1) |
where is the mass fraction of molecular hydrogen. The parameter represents the size of the atomic-molecular complex that can be calculated to be
| (2) |
where is the dust optical depth of the atomic-molecular cloud and can be thought as an estimate of the local radiation field. These two parameters can be calculated to be
| (3) |
Here, is the local hydrogen column density determined using a Sobolev-like approximation, is the dust cross section per hydrogen nucleus and g is the mean mass per H nucleus. The dust cross section is taken to be , and is the gas metallicity of the solar neighborhood. With these equations we are able to calculate the fraction of each gas particle.
In the BlueTides simulation, we identify the halos using the Friends-of-Friends algorithm with a linking length of 0.2 times the mean particle separation.
With the large volume and high resolution of BlueTides, we are able to model the formation of bright quasars that arise in extremely rare high-density peaks in the very early universe. The most massive black hole formed in the BlueTides simulation has gone through extremely rapid growth at early epochs and has reached a mass that is within 20% of that powering the recently discovered quasar with the highest redshift () (Bañados et al., 2017). Work on an earlier stage () of the BlueTides simulation has been done to understand what leads to this vigorous growth of the massive quasar in early universe and probe the environment of the host galaxy (Di Matteo et al., 2017). In this paper we focus on the feedback effect of this quasar and we investigate whether outflows are already self-regulating the growth of these extreme black holes/quasars at these early epochs. In particular we will study the gas outflows from redshifts to .
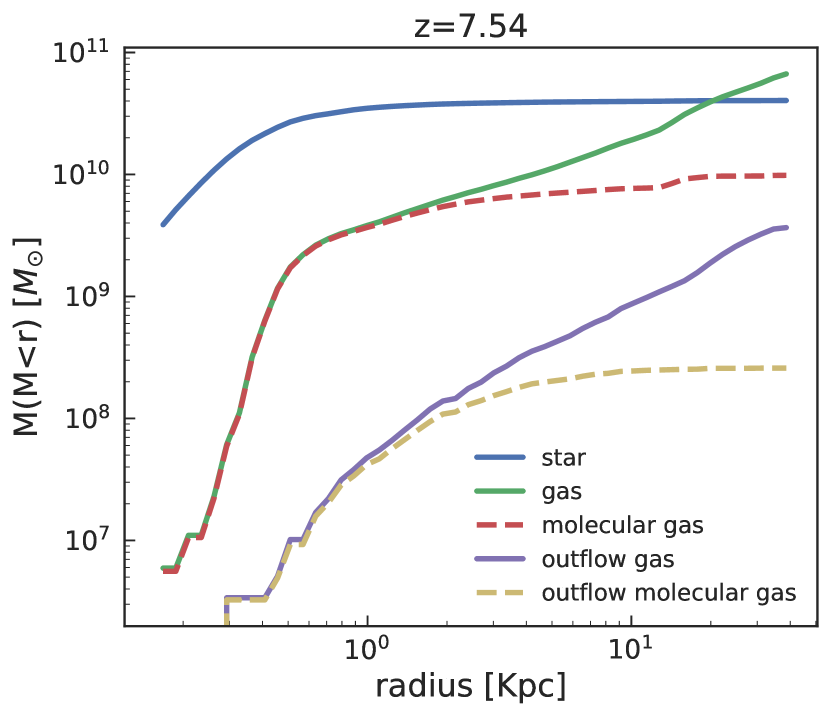
Figure 1 shows the cumulative mass profile of stars and gas, and also the molecular component of the gas of the host galaxies for the quasar.
At z=7.54, the mass of the halo is , with the virial radius being kpc. The mass of the central blackhole is . The total mass of the gas in the halo is (this is the total gas mass out to ). More detailed predictions for the host galaxy of this quasar are given in an associated paper (Tenneti et al., 2018, see also Table 1).
2.2 Gas Outflows
We introduce a way to identify the outflowing component from among all the gas particles in the halo. Our definition is based on whether gas has enough kinetic energy to escape from the gravitational potential of the halo. Traveling from the inner part of the halo, the kinetic energy of the gas should satisfy the criteria below:
| (4) |
Here is the virial radius of the halo, is mass of all types of particle enclosed within radius of the halo center. The first term accounts for the gravitation potential within the halo (as a gas particle move from out to ) while the the second term the standard component to escape from the "surface" of the halo.
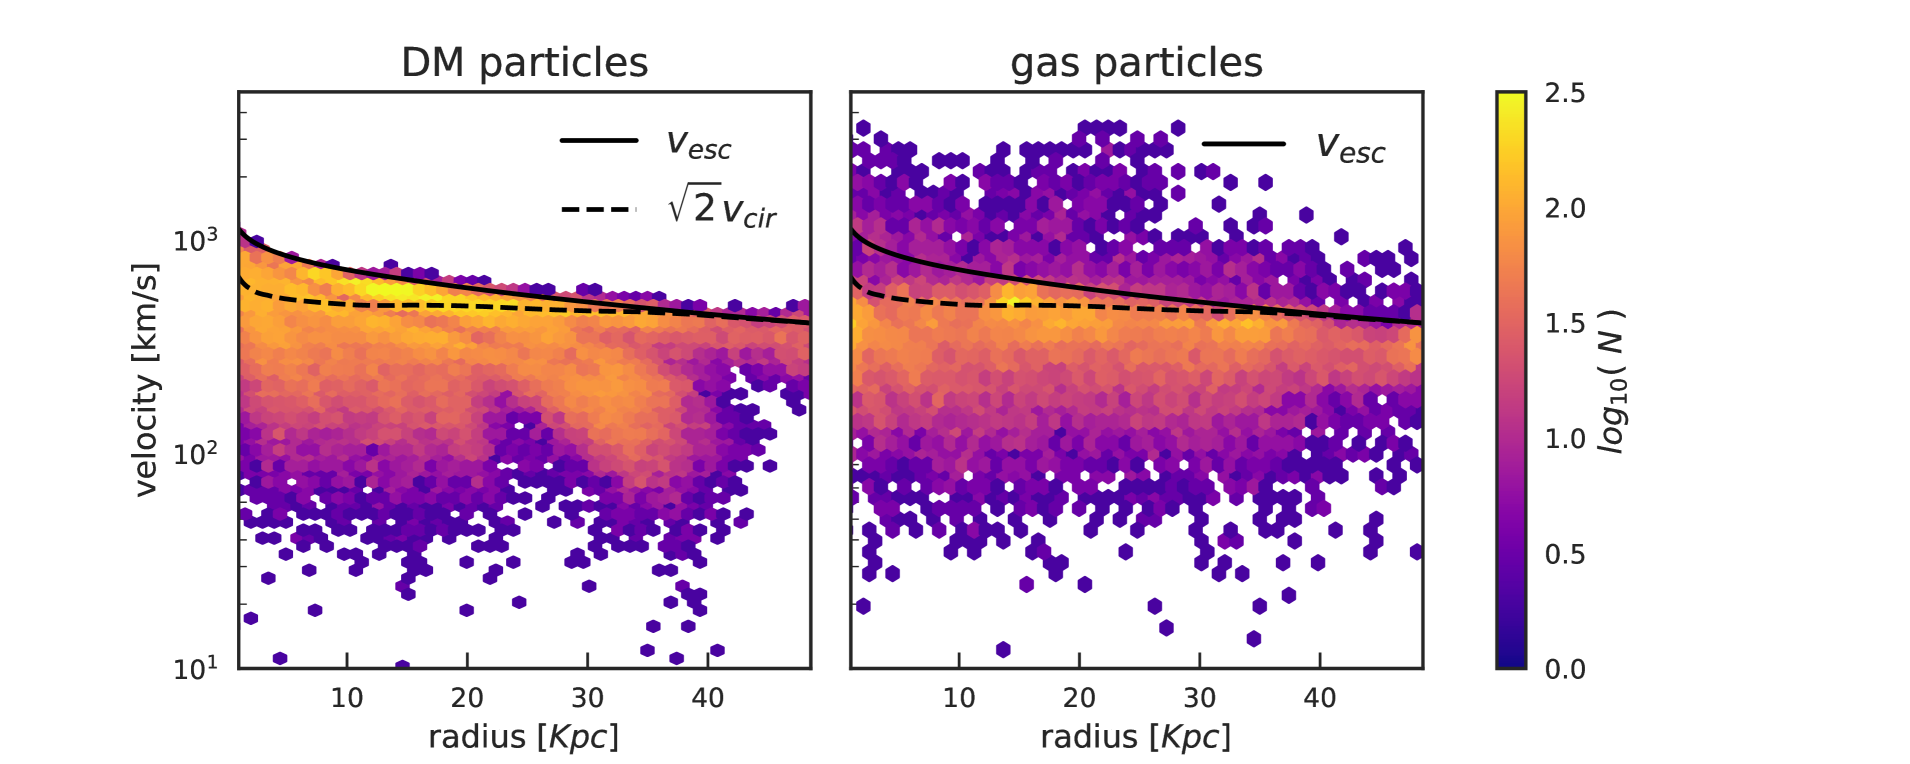
The resulting escape velocity considers the fact that the gas from the inner region, in order to escape, needs to climb out the gravitational potential contributed by the rest of the mass within the halo, thus it is harder for it to escape than for the gas in outer region. This profile is hence different than simpler estimate of as shown in Figure 2. The black dashed line represents , which is clearly below our defined in the inner region of the halo. Making this approximation (as was done by e.g., Barai et al. (2018)) may yield a higher estimate of the outflow gas (from the inner regions).


| Redshift | z=7.95 | z=7.85 | z=7.54 |
|---|---|---|---|
| in halo | 1.09 | 1.02 | 0.98 |
| in outflow | 0.022 | 0.013 | 0.026 |
| in halo | 7.2 | 6.9 | 6.4 |
| in outflow | 0.23 | 0.39 | 0.36 |
3 Results
3.1 Radial Velocities
Figure 2 shows the calculated escape velocity profile (solid line) along with the velocities the gas and dark matter particles as a function of radius (left and right panel respectively). Here we include only particles which are in the FOF halo. As expected, dark matter particles (in the left panel), populate the part of the plot below the escape velocity profile perfectly. If we compare this with the distribution of gas particles (in the right panel) we can see that there are many with velocities which exceed the escape velocity. Their high speeds are likely due to the effects of AGN feedback, which leads to gas particles that can escape from the gravitational potential of the halo. (Costa et al., 2015; Biernacki & Teyssier, 2018; Barai et al., 2018)
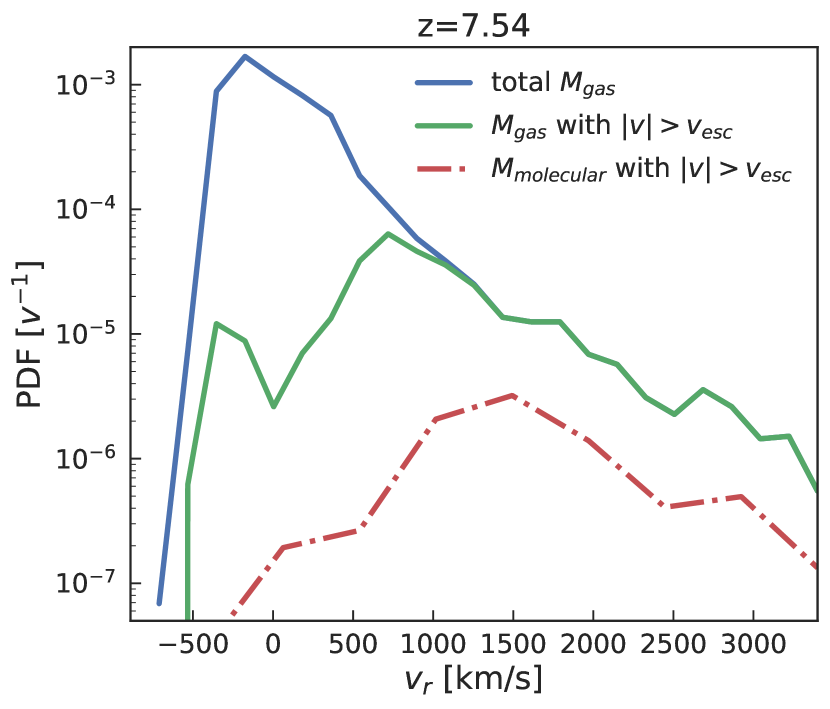
Figure 3 shows the radial velocity histogram of gas particles in the halo. Each curve shows the mass fraction of gas per velocity bin, and the histogram is normalized to the total gas mass within the plotted region. The gas with velocity magnitude (where includes the tangential component of velocity) is shown with a green solid line in Figure 3. The red dashed line represents the molecular component in the gas with . We define the outflow gas with radial velocity (), corresponding to the region under the green solid line and to the right of . We see that this outflow gas in the halo can have large outward radial velocity of over 3000 km/s.
The mass of gas participating in the outflow constitutes about 6% of the total mass of gas in the halo, which is about at z=7.54 (see also Figure 1 and Table 1). In particular, up 7% of the gas in the outflow is in the molecular phase. This molecular gas typically has higher velocities (the peak of red histogram is at 1500 km/s) than the rest of the outflowing gas. This is consistent with the observations of quasar outflows by (Maiolino et al., 2012; Cicone et al., 2015), where the cold gas traced by [CII] is moving with km/s. We return to the molecular outflow component in §3.3.
3.2 Outflow properties and their evolution
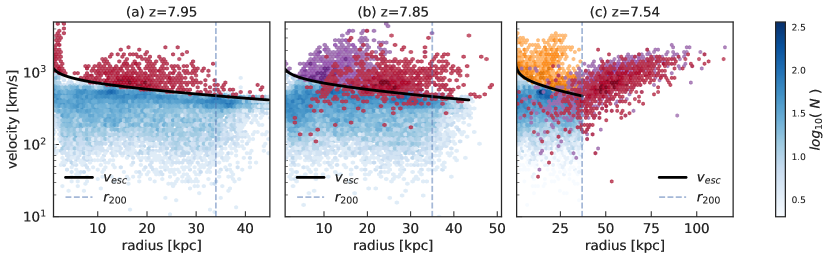
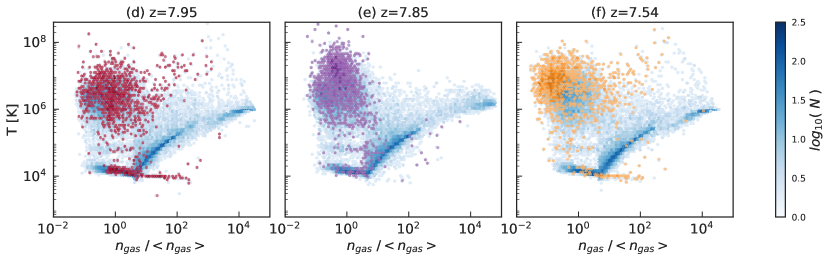
In Figure 4 we examine the formation, evolution and properties of the outflows over the redshift range from to . In the top row we show the fate of the escaping gas particles and whether the outflow extends outside the halo. To do this we track the outflow gas particles through 3 snapshots of the simulation at and .
Figure 4(a) shows the gas particles in the halo at , with the escaping, outflow component shown in red. At z=7.85, we find that about 55% of the outflow gas from z=7.95 has escaped from the halo. The outflow particles retained in the halo are again shown in red while the new outflow is shown in purple. 70% of the total outflow gas at z=7.85 is due to newly escaping gas particles. At we extend the radial distance probed and in (c), we show that indeed most of the outflow gas has escaped from the halo: Only 7% of outflow gas at z=7.95 and 10% of outflow gas at z=7.85 still remains in the halo at z=7.54. Again, newly formed outflow (shown in orange) dominates the net outflow within the halo. The net outflowing gas is shown in the images in Figure 5.
The bottom row panels of Figure 4 show the phase space diagrams for the gas at the corresponding redshifts. We identify the outflowing gas using the same color coding as in the panels above. In each panel we show the temperature and density of the total outflowing gas within the halo at the specified redshift. It is evident that the majority of the outflowing gas occupies the low density and high temperature part of the diagram. However there is also a small fraction of colder and denser phase in the outflowing gas (we discuss this further in §3.3).
In Figure 6 we show the averaged temperature and density profiles of the halo gas and of the outflow at those redshifts. As seen in phase space, the temperature profile of outflow is higher on average than the rest of the gas. The density profile of the outflow gas is steeper than the total gas in the halo, partly corresponding to the fact that the dense component in the outflow mainly resides in the inner region of the halo. Note also, that at the outflow gas in the inner parts of the halo is quite suppressed yet predominantly colder, (while the dominant component, warmer component is still in the outer region of the halos, see also §3.4).
3.2.1 Morphology of the Outflows
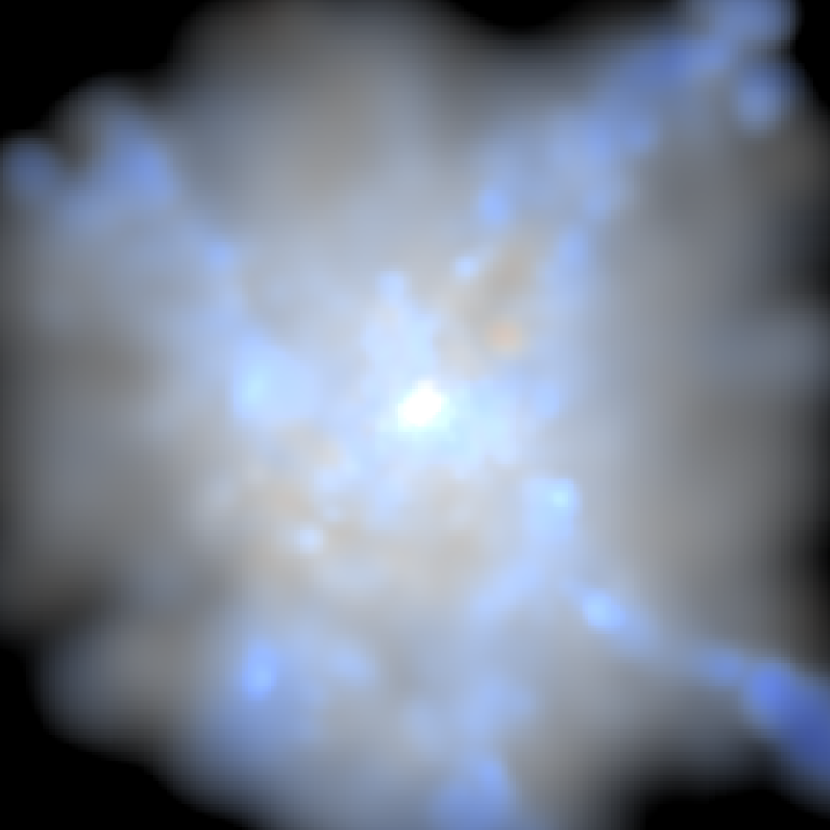
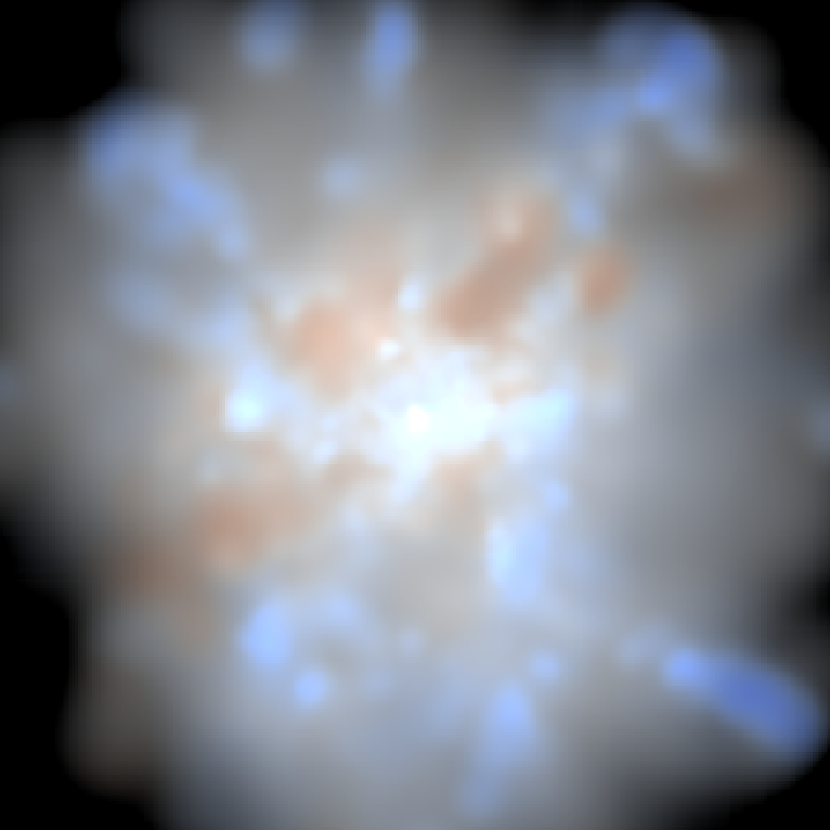
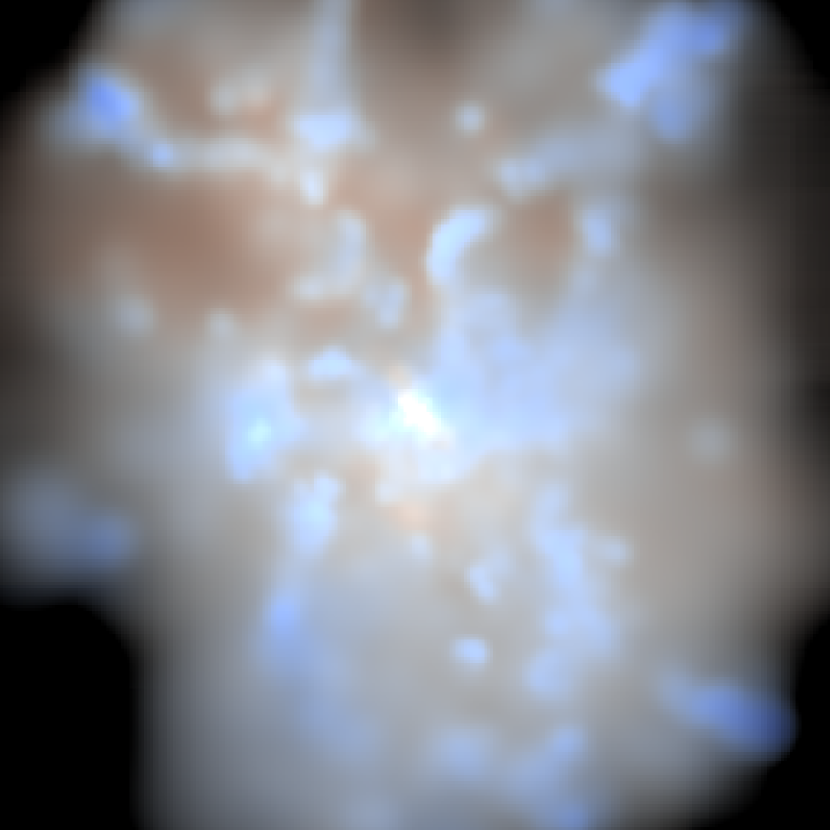
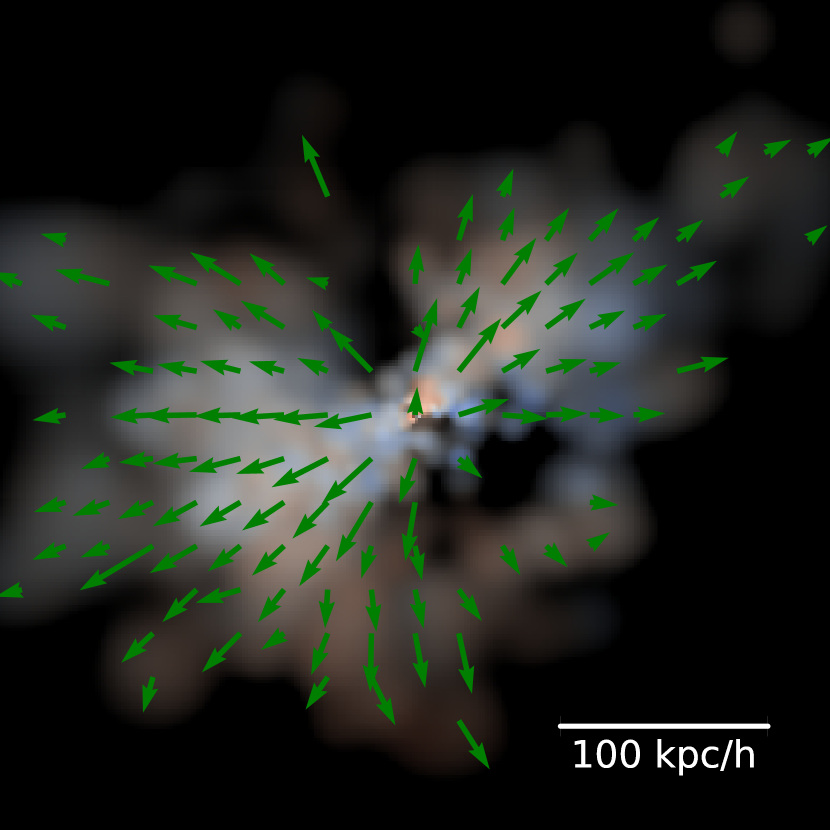
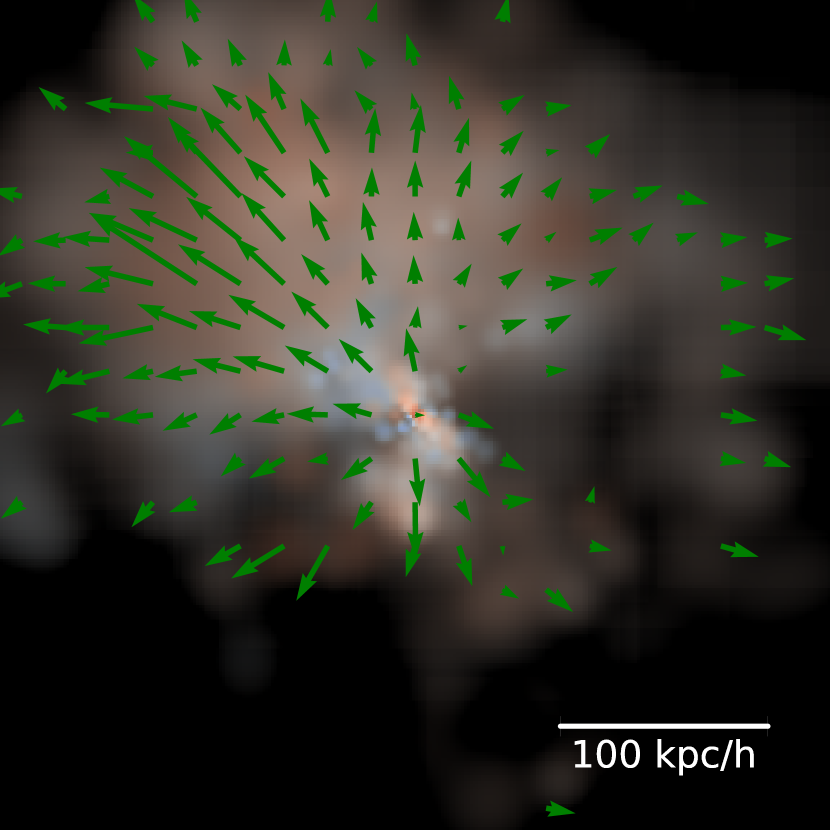
Figure 5 shows the morphology of halo gas and the outflow at and . The top panels plot the gas particles in the FOF halo. The bottom panels represent the outflow component of the gas, showing both the density and the projected velocity field. The pictures are of a kpc side (co-moving coordinate) box centered on the black hole. All figures show the projection from the same direction.
In all panels of Figure 5, the gas is coloured using the same scale which shows the density and mass averaged temperature. The yellow tint represents the warmer phase. We can see from the figure that the outflow gas is mainly composed of the hot phase together with a still small fraction of the colder and denser component. It is especially obvious in the plots of and that the outflow is closely tracing the morphology of the hot gas in the halo,
In the BlueTides simulation, the feedback energy from AGN is deposited in a sphere of surrounding gas. However, we can see from the bottom panels of Figure 5 that the shape of the outflow can be highly anisotropic. The outflow has a bipolar shape at , and can be more irregular as seen in the later redshifts, with the shape potentially varying a lot. One should remember that the outflow gas in each snapshot is physically distinct from the gas in the other snapshots (as shown in Figure 4 and discussed in §3.2), most of the outflow gas in the previous snapshot will have escaped from the halo by the next plotted redshift.
3.3 Molecular gas component in the outflow
The gas cooling process in MP-Gadget is modeled based on radiative cooling and metal cooling. We include the molecular phase in the cold gas, which is mainly hydrogen. The formation of hydrogen and its effect on star formation uses a semi-numeric model based on Krumholz & Gnedin (2011), as described in §2.1.
The feedback processes in BlueTides include both SN wind and AGN feedback. As studied in Biernacki & Teyssier (2018), SN feedback creates a galactic fountain with dense gas clumps, enriching the metal component and boosts the cooling process. Meanwhile AGN feedback launches a low-density, hot outflow that sweeps through the extent of halo, pushing the dense clumps to large distances.
Figure 2 presents the cumulative mass profile of stars and gas, and also the molecular component of the gas. At z=7.54, the mass of the molecular hydrogen in our halo is , consistent with ALMA observation of the host of the quasar at z=7.54 (Venemans et al., 2017), which give an upper limit for the molecular gas mass of . Table 1 also provides the total gas and molecular gas mass within the halo at the three redshifts. The molecular gas fraction decreases slightly with decreasing redshift. Note that the molecular phase constitutes about 75% of the mass fraction in the inner region of the halo within a radius of 3.3 kpc from the quasar, (corresponding to 20 kpc in co-moving coordinate). This is the part of the halo where most of the stars reside. The cumulative mass profiles of both stars and molecular component are nearly flat in the outer region of the halo, corresponding to the fact that star-forming gas mainly resides in the inner region of the halo.
We see from Figure 2 that most of the molecular component in the outflow gas is contributed by the outflow from the inner part of the halo. At z=7.54, the total mass of the outflow gas is , of which is molecular hydrogen.
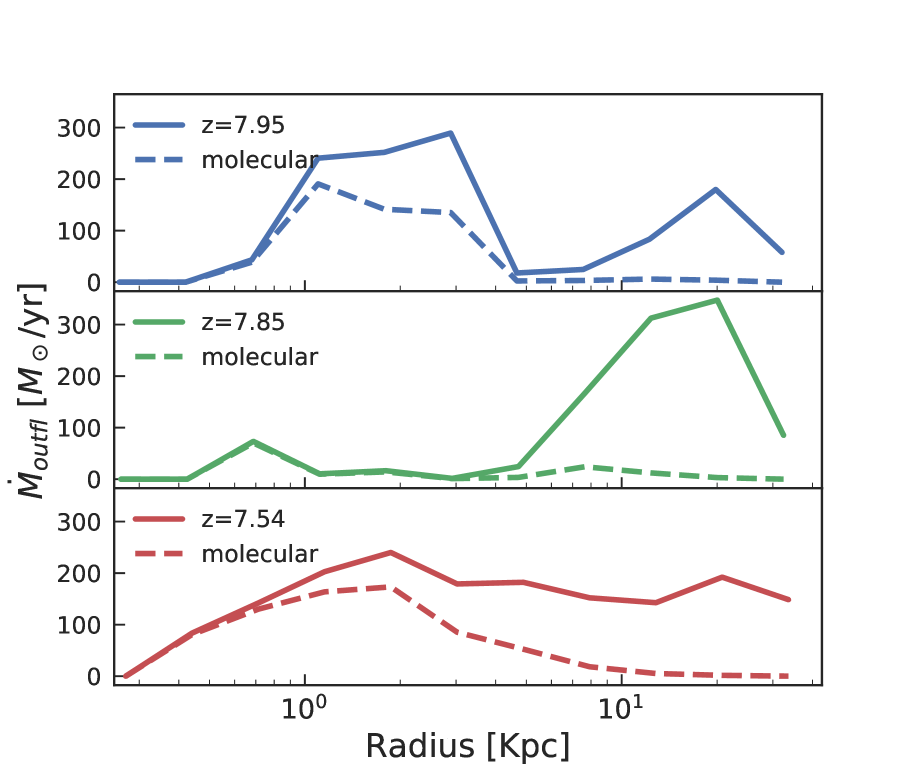
3.4 Outflow rate
Figure 7 shows the outflow rate profile at different redshifts, using the outflow gas particles in our criteria. We calculate the outflow rate shell by shell to give the profile, using , with the radial velocity, and the volume averaged being the average density of the shell. We note that our criteria for outflow are much stricter than the use of or , see Figure 2. This makes our outflow rate quite conservative. Also, we note that the outflow rate becomes small when approaching the edge of halo( kpc) because we only count the gas particles "bounded" by the halo defined using the Friend of Friend algorithm based on dark matter particles. This will exclude some high velocity gas in the outer regions of the halo.
As shown in Figure 7, the molecular component in the outflow extends into the region about 6 kpc from the halo center. This is consistent with the result of Biernacki & Teyssier (2018) (see their Fig.9 middle column at 750Myr (), noting that their plot is in co-moving coordinates while ours is in physical coordinates.) Their peak outflow rate for the dense gas component at kpc is about , smaller than ours in the same region. However, our mass outflow rate varies over time. At z=7.85, the outflow is quenched in the inner region, probably corresponding to a quiescent state of the quasar.
4 Conclusion
We have studied the properties of the outflow gas driven by the most massive quasar in the BlueTides Simulation in order to predict the outflow properties of the record holder recently discovered quasar.
The epoch we have focused on is earlier than the studied by previous simulated work in this area (e.g. Costa et al., 2015; Curtis & Sijacki, 2016; Biernacki & Teyssier, 2018; Barai et al., 2018). Using our self defined escape velocity profile to select the outflow gas that can escape the gravitational potential of the halo, we find the total mass of the outflow gas to be , constituting 6% of the total gas in the halo. Furthermore, the outflow gas contains a cold, dense molecular component with mass about . The molecular phase of the gas mainly resides in the inner region of the halo, in the star forming region within a few kpc of the central black hole.
The outward radial velocity of the gas particles in the halo can reach upwards of km/s, within which the molecular component typically has velocities higher than the rest of the outflow gas, with mass averaged km/s. These values are consistent with the observations of Cicone et al. (2015), who detect a cold dense molecular gas outflow with km/s in a quasar at implying that the properties of the outflows around quasars at may be rather similar to the population of quasars.
The outflow gas can escape from the halo in a short period of time. More than 90% of the outflow at z=7.85 has escaped from the host halo at the later redshift of z=7.54 (40 Myr later). Based on our criteria for outflow, the average mass outflow rate is typically .
The outflow gas is mainly composed of a hot and sparse phase. However we find that there is indeed a small fraction (%) of outflow gas in a cold (molecular) and dense phase. On average, the outflow has higher temperature(K) and lower density compared to rest of the gas in the host halo, and has a steeper density profile. The dense molecular fraction resides in the inner halo. In a companion paper Tenneti et al. (2018) studying the host galaxy of this simulated quasar, we show that is likely to contain large amounts of dust. Already in Di Matteo et al. (2017) we saw that this galaxy had a major episode of star formation at (reaching , see the green line in Figure of that paper). Both of these features are consistent with the observations of Venemans et al. (2017), and we predict that the outflows we have seen in the simulated galaxy are likely to be present in the observed quasar. In addition, the presence of such signicant quasar driven outflows may help explain the significant metal enrichment that the quasar at host have been observed to have. The quasar outflows can easily spread the metal enriched gas over and beyond the scale of the halo.
Acknowledgments
We acknowledge funding from NSF ACI-1614853, NSF AST-1517593, NSF AST-1616168, NASA ATP NNX17AK56G and NASA ATP 17-0123 and the BlueWaters PAID program. The BLUETIDES simulation was run on the BlueWaters facility at the National Center for Supercomputing Applications
References
- Bañados et al. (2017) Bañados E., et al., 2017, preprint, (arXiv:1712.01860)
- Barai et al. (2018) Barai P., Gallerani S., Pallottini A., Ferrara A., Marconi A., Cicone C., Maiolino R., Carniani S., 2018, MNRAS, 473, 4003
- Battaglia et al. (2013) Battaglia N., Trac H., Cen R., Loeb A., 2013, ApJ, 776, 81
- Biernacki & Teyssier (2018) Biernacki P., Teyssier R., 2018, MNRAS, 475, 5688
- Cheung et al. (2016) Cheung E., et al., 2016, Nature, 533, 504
- Cicone et al. (2015) Cicone C., et al., 2015, A&A, 574, A14
- Cimatti et al. (2004) Cimatti A., et al., 2004, Nature, 430, 184
- Costa et al. (2015) Costa T., Sijacki D., Haehnelt M. G., 2015, MNRAS, 448, L30
- Curtis & Sijacki (2016) Curtis M., Sijacki D., 2016, MNRAS, 457, L34
- Di Matteo et al. (2005) Di Matteo T., Springel V., Hernquist L., 2005, Nature, 433, 604
- Di Matteo et al. (2017) Di Matteo T., Croft R. A. C., Feng Y., Waters D., Wilkins S., 2017, MNRAS, 467, 4243
- Fabian (2012) Fabian A. C., 2012, ARA&A, 50, 455
- Faucher-Giguère et al. (2009) Faucher-Giguère C.-A., Lidz A., Zaldarriaga M., Hernquist L., 2009, ApJ, 703, 1416
- Feng et al. (2016) Feng Y., Di-Matteo T., Croft R. A., Bird S., Battaglia N., Wilkins S., 2016, MNRAS, 455, 2778
- Katz et al. (1999) Katz N., Hernquist L., Weinberg D. H., 1999, ApJ, 523, 463
- Kormendy & Ho (2013) Kormendy J., Ho L. C., 2013, ARA&A, 51, 511
- Krumholz & Gnedin (2011) Krumholz M. R., Gnedin N. Y., 2011, ApJ, 729, 36
- Maiolino et al. (2012) Maiolino R., et al., 2012, MNRAS, 425, L66
- McKee & Krumholz (2010) McKee C. F., Krumholz M. R., 2010, ApJ, 709, 308
- Nelson et al. (2015) Nelson D., et al., 2015, Astronomy and Computing, 13, 12
- Saracco et al. (2005) Saracco P., et al., 2005, MNRAS, 357, L40
- Schaye et al. (2015) Schaye J., et al., 2015, MNRAS, 446, 521
- Silk & Rees (1998) Silk J., Rees M. J., 1998, A&A, 331, L1
- Springel & Hernquist (2003) Springel V., Hernquist L., 2003, MNRAS, 339, 289
- Tenneti et al. (2018) Tenneti A., Wilkins S. M., Di-Matteo T., Croft R. A., Feng Y., 2018, submitted to MNRAS
- Venemans et al. (2017) Venemans B. P., et al., 2017, ApJ, 851, L8
- Vogelsberger et al. (2013) Vogelsberger M., Genel S., Sijacki D., Torrey P., Springel V., Hernquist L., 2013, MNRAS, 436, 3031
- Vogelsberger et al. (2014) Vogelsberger M., et al., 2014, MNRAS, 444, 1518