Brain networks reveal the effects of antipsychotic drugs on schizophrenia patients and controls
Emma K. Towlson1,2, Petra E. Vértes3, Ulrich Müller4,5, and Sebastian E. Ahnert6,7
-
1.
Center for Complex Network Research and Department of Physics, Northeastern University, Boston, Massachusetts 02115, USA
-
2.
Media Laboratory, Massachusetts Institute of Technology, Cambridge, MA 02139, USA
-
3.
Department of Psychiatry, Behavioural and Clinical Neuroscience Institute, University of Cambridge, Cambridge CB2 0SZ, UK
-
4.
Department of Psychology, University of Cambridge, Downing Street, Cambridge, CB2 3EB, UK
-
5.
Barnet Enfield Haringey NNHS Mental Health Trust, Block B2, St. Ann’s Hospital, St Ann’s Rd, London N15 3TH, UK
-
6.
Theory of Condensed Matter Group, Department of Physics, Cavendish Laboratory, University of Cambridge, JJ Thomson Avenue, Cambridge, CB3 0HE, UK
-
7.
Sainsbury Laboratory, Cambridge University, Bateman Street, Cambridge, CB2 1LR, UK
Correspondence:
Emma Towlson. Center for Complex Network Research and Department of Physics, Northeastern University, Boston, Massachusetts 02115, USA.
Email: ektowlson@gmail.com
Acknowledgements:
EKT was supported by an Engineering & Physical Sciences Research Council (UK) PhD studentship, and is now supported by NSF award number 1734821. PEV was supported by the Medical Research Council (MR/K020706/1), and is now a Fellow of MQ: Transforming Mental Health, grant number MQF17_24. The Behavioural & Clinical Neuroscience Institute is supported by the Medical Research Council (UK) and the Wellcome Trust. SEA was supported by a Royal Society University Research Fellowship, and is currently supported by a Gatsby Career Development Fellowship. Data collection was supported by a grant from Bristol Myers Squibb to the late Robert Kerwin at King’s College London. We thank Ameera Patel for discussions about pre-processing the raw fMRI data.
Authors’ contributions:
EKT and SEA conceived of the analysis. UM designed the clinical trials, recruited the subjects, and gathered the data. EKT did the analysis, SEA oversaw it, and EKT, SEA, and PEV interpreted the results. EKT, PEV, and SEA wrote the manuscript.
Conflict of interest:
UM has received honoraria for advisory board participation, consultancy and educational talks, travel expenses and/or support for educational conferences from Astra Zeneca, Bristol Myers Squibb, Eli Lily, Heptares, Lundbeck, Flynn Pharma/Medice, Janssen-Cilag, Shire and/or Sunovion.
Abstract
The study of brain networks, including derived from functional neuroimaging data, attracts broad interest and represents a rapidly growing interdisciplinary field. Comparing networks of healthy volunteers with those of patients can potentially offer new, quantitative diagnostic methods, and a framework for better understanding brain and mind disorders. We explore resting state fMRI data through network measures, and demonstrate that not only is there a distinctive network architecture in the healthy brain that is disrupted in schizophrenia, but also that both networks respond to medication. We construct networks representing 15 healthy individuals and 12 schizophrenia patients (males and females), all of whom are administered three drug treatments: (i) a placebo; and two antipsychotic medications (ii) aripiprazole and; (iii) sulpiride. We first reproduce the established finding that brain networks of schizophrenia patients exhibit increased efficiency and reduced clustering compared to controls. Our data then reveals that the antipsychotic medications mitigate this effect, shifting the metrics towards those observed in healthy volunteers, with a marked difference in efficacy between the two drugs. Additionally, we find that aripiprazole considerably alters the network statistics of healthy controls. Using a test of cognitive ability, we establish that aripiprazole also adversely affects their performance. This provides evidence that changes to macroscopic brain network architecture result in measurable behavioural differences. This is the first time different medications have been assessed in this way. Our results lay the groundwork for an objective methodology with which to calculate and compare the efficacy of different treatments of mind and brain disorders.
Introduction
In recent years neuroimaging data and graph theory have allowed for the description of the topological properties of large-scale brain networks (Bullmore and Vértes, 2013; Bullmore and Sporns, 2009; van den Heuvel and Hulshoff Pol, 2010). Disorders of the brain have long been thought to be due to abnormal connectivity patterns, and these networks allow for a quantitative measure of this disruption (Rubinov and Bullmore, 2013; Bullmore and Sporns, 2012). Schizophrenia is a debilitating psychiatric condition with a range of symptoms including auditory and visual hallucinations, delusions, disorganised thinking, and cognitive impairment. Various network-based studies have associated schizophrenia with a subtle randomisation of connections (Fornito, 2012; Alexander-Bloch et al., 2013; van den Heuvel et al., 2013; Lynall et al., 2010; Rubinov and Bullmore, 2013; Yu et al., 2011). Antipsychotic medications are employed to treat symptoms with varying degrees of success and side-effect. Sulpiride is a selective dopamine antagonist most commonly used in Europe and Japan for schizophrenia treatment. Aripiprazole is an atypical third generation antipsychotic introduced for the treatment of schizophrenia in the USA in 2002 and Europe in 2004 (Bolstad et al., 2015). It acts as a dopamine receptor partial agonist, whereas typical antipsychotics used to combat the symptoms of schizophrenia are pure dopamine antagonists. Partial agonists have long been of interest (Lieberman, 2004) in order to avoid the extrapyramidal and endocrine side effects caused by typical antipsychotics.
To date, very few studies have been conducted to understand if and how medication alters an individual’s brain network (Achard and Bullmore, 2007; Hadley et al., 2016; Flanagan, 2018). We hypothesised that an effective medication would act to make the functional brain networks of patients more similar to those of healthy volunteers. We set out to test this in the context of three drug treatments: (i) placebo; (ii) aripiprazole, and (iii) sulpiride. We used resting state fMRI data to analyse the functional connectivity, and a working memory task to assess the cognitive abilities, of 15 healthy volunteers and 12 patients with chronic schizophrenia.
Our results show that schizophrenia patients and healthy controls exhibit different network topologies, in agreement with the existing literature (Alexander-Bloch et al., 2013; Lynall et al., 2010). Further, the drug treatments alter the topology of the brain network in a measurable way, both in healthy individuals and patients. In the brain networks of patients we found evidence that the drugs lead to network topologies that are closer to those of healthy individuals. This correlates with improved cognitive performance. In healthy individuals, treatment with aripiprazole leads to a significantly altered network as well as lower cognitive performance.
Materials and Methods
Experimental Design and Statistical Analysis
Sample
Twelve people with chronic schizophrenia and 15 healthy, nonpsychotic volunteers were recruited for participation in this study. The patients were diagnosed according to standard operational criteria in the DSM-IV (American Psychiatric Association, 2000) and were clinically stable during their involvement (i.e. exhibiting low symptom ratings and undergoing no change of medication in the preceding four weeks). All were receiving antipsychotic drugs, and four were receiving additional psychotropic medication, but were not treated with their usual medication on the days of scanning to avoid effects on the fMRI data. Healthy volunteers were selected to match the patient group in terms of age, gender, premorbid IQ, years of education and handedness, and screened for major psychiatric disorders using the Mini International Neuropsychiatric Interview (Sheehan et al., 1998). All subjects provided informed consent in writing and the protocol was approved by the Addenbrooke’s NHS Trust Local Research Ethics Committee.
Every subject attended three scanning sessions, each one to two weeks apart, for collection of functional MRI data and completion of working memory tests (see below). At each visit they were administered one of three drug treatments: (i) an oral placebo 180 and 90 mins before scanning; (ii) oral aripiprazole 15mg 180 mins before scanning and oral placebo 90 mins before; (iii) oral placebo 180 mins before scanning and oral sulpiride 400 mg 90 mins before. We used a double dummy design with dosing of aripiprazole 180 mins and sulpiride 90 mins before the start of fMRI scanning. At both time points (-180 mins and -90 mins) we co-administered 10mg of Domperidone to minimise side effects (nausea). Both aripiprazole and sulpiride are antipsychotic medications designed to alleviate the symptoms of schizophrenia. The order of drug administration and the playlists of the working memory paradigm were counterbalanced across one group and repeated for the other.
Working memory tests
At each session, the subjects were required to complete an “N-back” task to assess their verbal working memory (Baddeley, 2003; Koshino, 2005). The task demanded that subjects maintain a series of visually presented letters in their working memory such that each stimulus could be compared to the letter presented N letters earlier in the series (i.e. N-back) - see Figure 2(a). For example, if the sequence of letters was F-B-A-C, the subject could be expected to indicate on presentation of the last letter in the series that B was presented two letters previously (2-back). Difficulty was manipulated to 4 levels (0-back to 3-back) by varying the number of letters back in the series that the subject had to compare to the current letter. All subjects completed a practice version and three playlists matched for difficulty and distraction, which were allocated across sessions such that each subject would complete each playlist once across their three visits (for placebo, aripiprazole, and sulpiride). An individual’s performance at this cognitive task was assessed by recording their hit rate, defined as the proportion of times they were able to successfully present a correct answer. In each session, there were 10 correct targets for each N-back level. Data for the performance of patients 11 and 12 administered sulpiride were missing so analyses were carried out without them.
Acquisition and preprocessing of fMRI data
A General Electric (GE) Signa system scanner operating at 1.5 T at the BUPA Lea Hospital (Cambridge, UK)) was used to acquire functional MRI data over 17 min 12s, during which time subjects were asked to lie quietly with their eyes closed. In each session, 516 gradient-echo T2*-weighted echo planar images depicting blood oxygenation level-dependent (BOLD) contrast were generated from 16 noncontiguous near-axial planes: repetition time 2 s, echo time 40 ms, flip angle , voxel size 3.05 3.05 7.00 mm, section skip 0.7 mm, matrix size 64 64, field of view (FOV) 240 240 123 mm. 4 volumes were discarded to allow for T1 equilibration effects, leaving 512 volumes per dataset (Lynall et al., 2010).
Control 2 was missing an anatomical image so was discarded from the study, and patient 11 was missing data for the aripiprazole treatment. Each dataset was analysed for effects of head motion within the scanner (Power et al., 2012; Van Dijk et al., 2012; Satterthwaite et al., 2012), resulting in the further rejection of patient 3 on aripiprazole and sulpiride, control 10 on placebo and sulpiride, control 8 on sulpiride, and patient 5 on placebo, all of which were deemed to have too many motion related artefacts to be reliable. The remaining datasets were corrected for motion through realignment and wavelet despiking (Suckling et al., 2006; Patel et el, 2014). We used a 12 parameter affine transformation to register the data to MNI stereotactic standard space and a 6mm Gaussian kernal for spatial smoothing. Finally, the voxel timeseries were high- and low-pass filtered with cutoff frequencies of 0.01 Hz and 0.08 Hz respectively.
Kolmogorov-Smirnov test
The two-sample Kolmogorov-Smirnov test is a non-parametric test to compare two sets of data. The Kolmogorov-Smirnov statistic is a measure of the distance between the empirical distribution functions of the two samples and is calculated under the null hypothesis that both samples are taken from the same continuous probability distribution. The statistic can then be used to assign a p-value to the likelihood that the null hypothesis may be rejected. We used this method to assess the distribution of the global network measures for each of the 6 groups: controls ( - aripiprazole, placebo, sulpiride) and patients ( - aripiprazole, placebo, sulpiride). A p-value of was taken to indicate a significant result.
Analysis of variance (ANOVA)
To examine the effects of the drugs, volunteer type and task difficulty on cognitive performance, we performed a 3 way ANOVA with 2 repeated measures (Cohen, 2007) in various combinations on the hit rates of the subjects. A p-value of was taken to indicate a significant result.
Anatomical parcellation and wavelet decomposition
For each individual dataset, voxel time series were averaged within each of the 325 equally sized anatomical regions in a random driven atlas (see (Zalesky et al., 2010) for approach). 28 regions lacked good quality fMRI timeseries for some subjects so were discarded from our analysis, leaving datasets for 297 brain regions for all subjects. The maximal overlap discrete wavelet transform (Percival and Walden, 2000) was used to decompose each individual regional mean fMRI time series into the frequency interval 0.030 - 0.060 Hz (scale 3). This frequency range was selected as it is has been shown that frequencies of 0.1 Hz exhibit the most prominent salient neuronal fMRI dynamics (Achard et al., 2006).
Topological network construction
Undirected weighted networks were generated for each individual based on correlating scale 3 wavelet coefficients. The resulting correlation coefficients form the weight of the edges connecting regions and . A simple thresholding procedure was then applied to eliminate edges with weights smaller than ; all remaining edges are then given a weight of , providing an undirected, unweighted network. The threshold can be varied to generate networks with any desired percentage of possible connections. Following the example of (Lynall et al., 2010), which studies a subset of this particular dataset, we choose to focus on connectivity. Firstly, this ensures that all graphs are connected, and secondly, it avoids the increasing randomness associated with higher connection densities (Humphries et al., 2006). All results given for the unweighted networks are averages across this range.
Global network measures
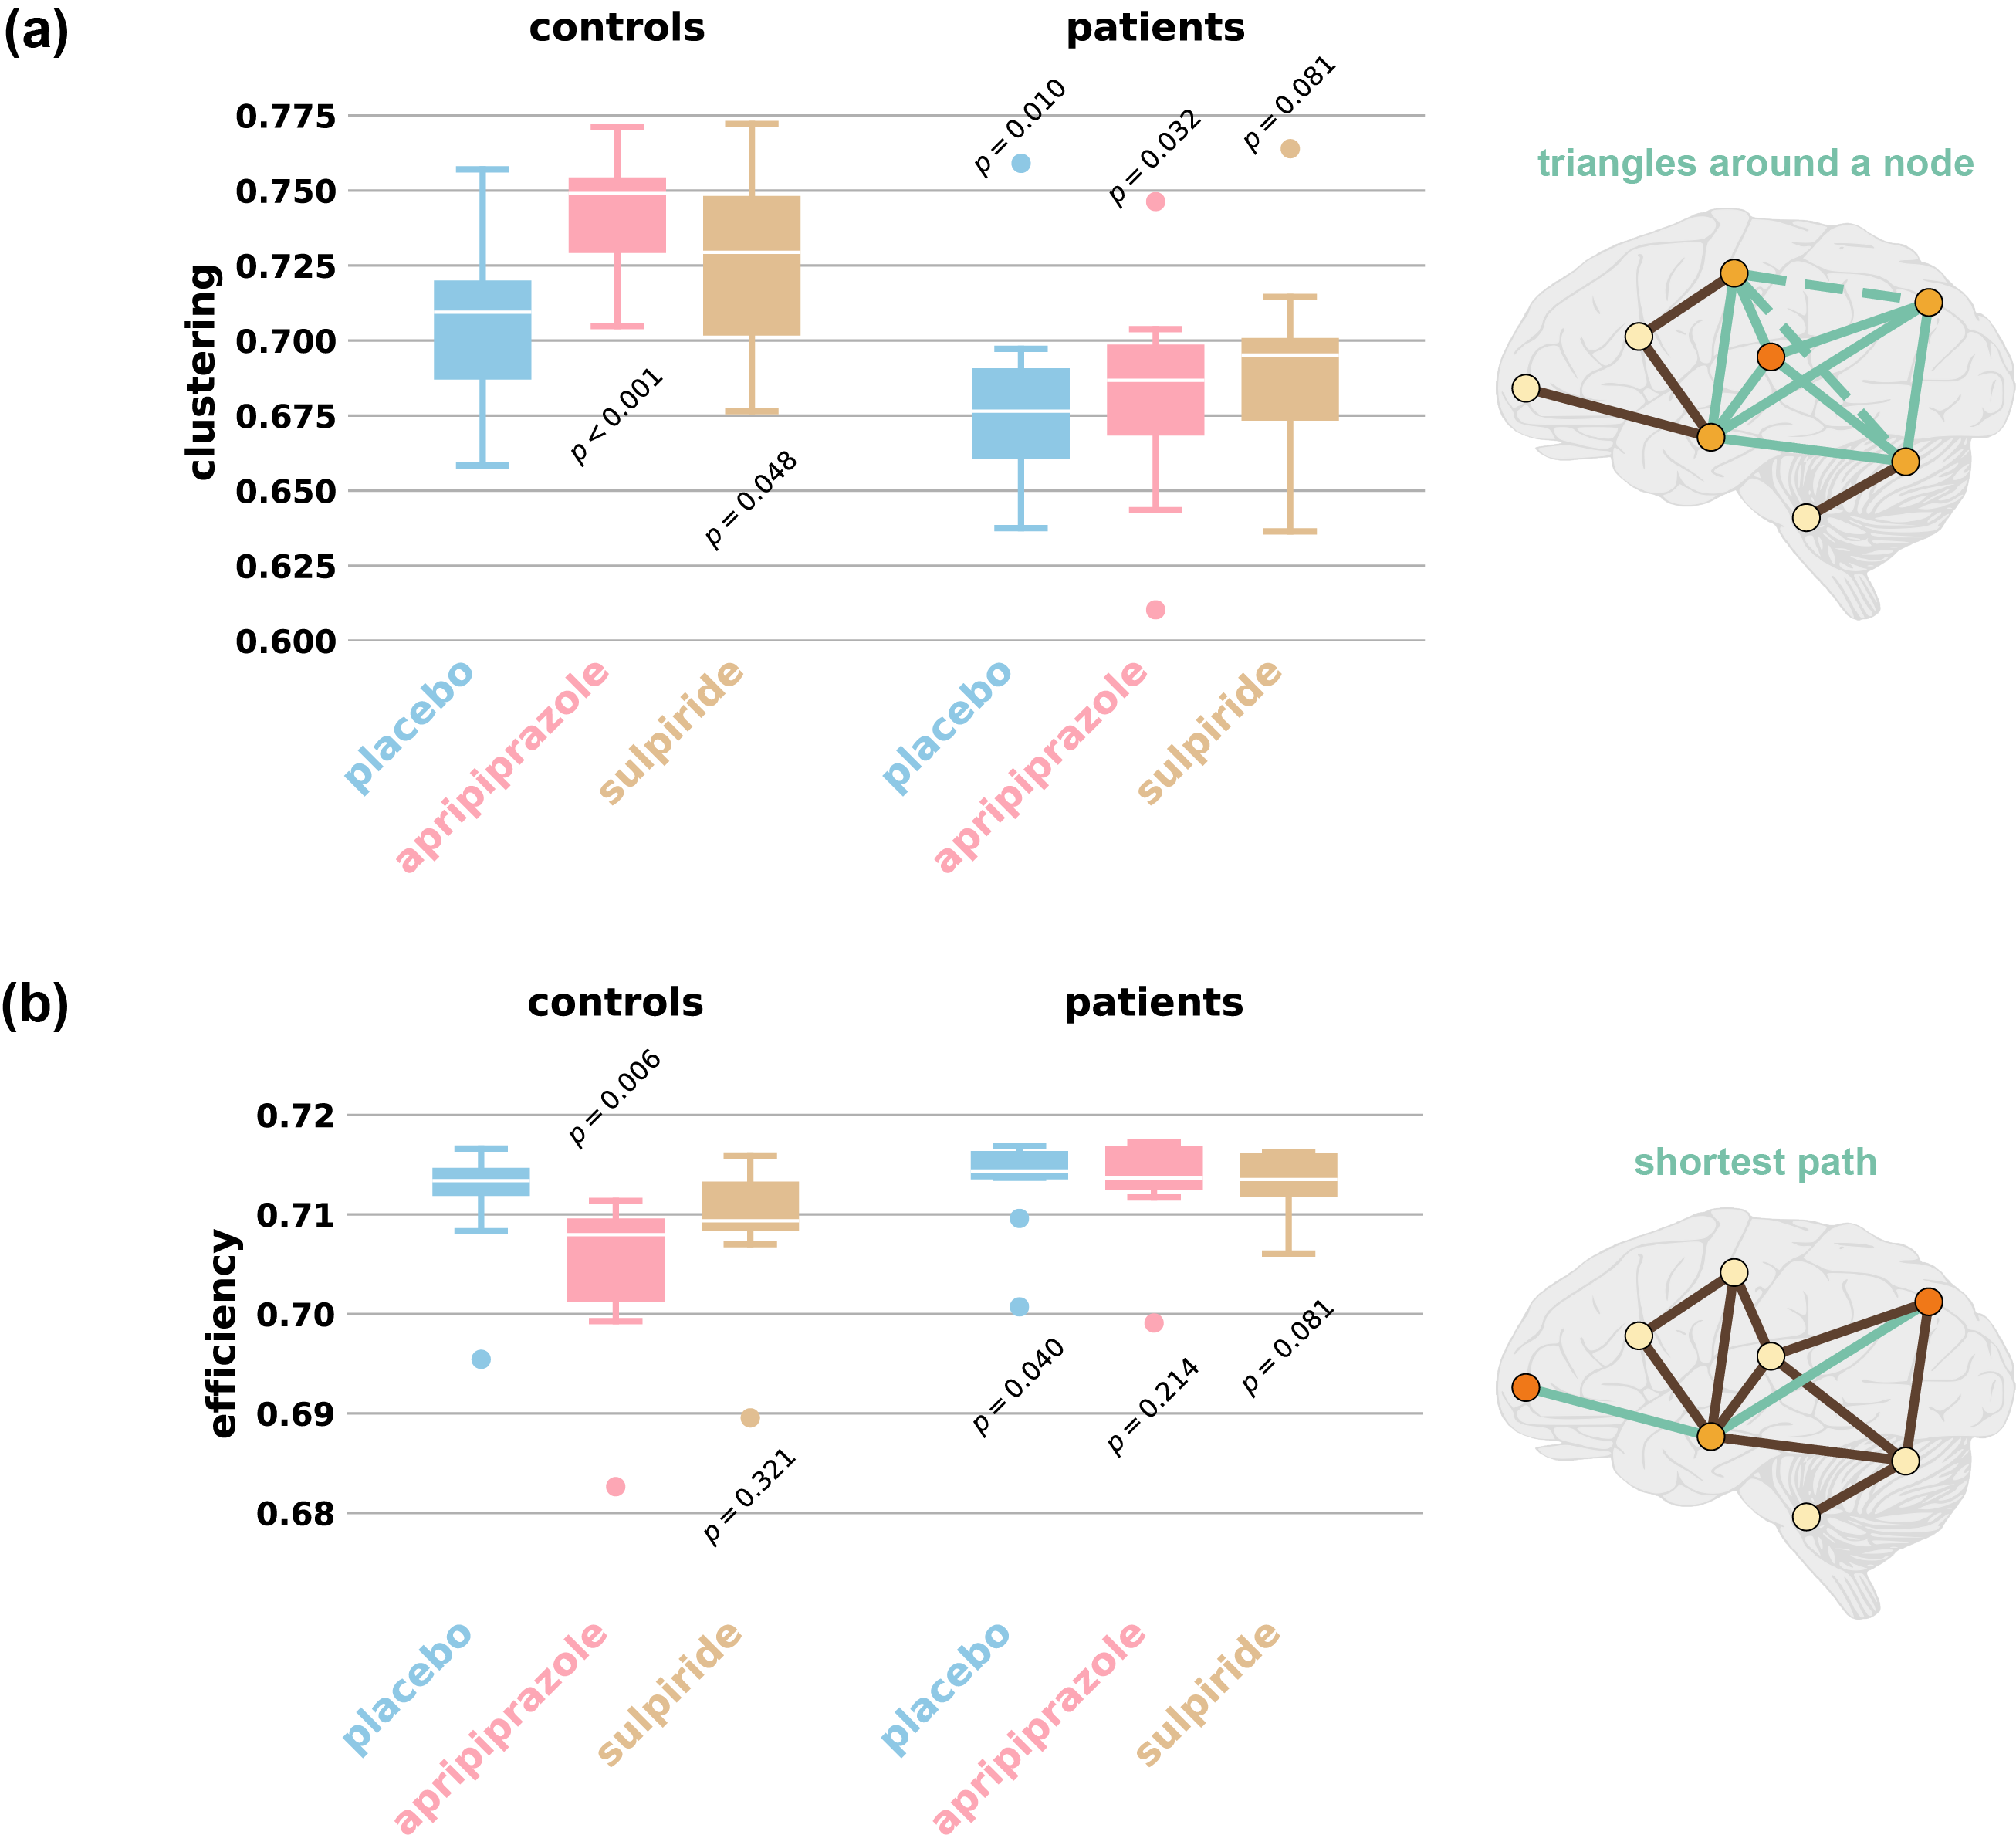
Clustering
The clustering coefficient, , for a node can be defined as (Watts and Strogatz, 1998):
| (1) |
where is the number of triangles containing node , and is the degree of - see Figure 1(a).
The average clustering then provides a global network measure of clustering, and is simply the average of all values of nodal clustering, or:
| (2) |
Characteristic path length
If the shortest path lengths, , between all existing node pairs and , are identified, then the characteristic path length of the network, , is simply given by the mean of their sum:
| (3) |
Efficiency
A measure of the global efficiency of a network, , is given by the mean of the sum of the inverse shortest path lengths, , between all existing node pairs and (Achard and Bullmore, 2007; Latora and Marchiori, 2001):
| (4) |
where is the number of nodes in the graph . Networks for which the average path length is small can thus be said to have high global efficiency (Achard and Bullmore, 2007) (see Figure 1(a)).
This is equivalent to averaging the nodal efficiencies for all nodes in the network.
Assortativity
The assortativity of a network is a measure of the preference of its nodes to connect to other nodes of similar degree. Let be the joint probability distribution (or mixing matrix) of the degrees. Then if and are, respectively, the fraction of edges that start and end at vertices with values and and further that (the case of no assortative mixing), the assortativity coefficient can be defined simply by calculating the Pearson correlation coefficient (Newman, 2003):
| (5) |
where and are the standard deviations of the distributions and . has a value in the range , where would correspond to a perfect correlation between and , ie perfect assortativity, and similarly would indicate perfect disassortativity.
Software
Motion diagnostics, preprocessing and parcellation of the functional MRI data were completed using the preprocessing pipeline with temporal despiking from (Patel et el, 2014; Kundu et al., 2012). Metric calculations and network manipulations were carried out using the Python networkx library (Hagberg et al., 2008) and Matlab. We used IBM SPSS Statistics for all ANOVA calculations (IBM Corp., 2012).
Results
The effects of schizophrenia on global efficiency and clustering are mitigated by medication
We first compared the functional brain networks derived from schizophrenia patients and healthy volunteers on placebo treatments, and as expected, (Alexander-Bloch et al., 2013; Lynall et al., 2010) find distinct differences. In agreement with the existing literature, the schizophrenia networks have increased efficiency (average compared to , ) and reduced clustering (average compared to , ) - see Figure 1.
We next employed an ANOVA (two-way, one repeated measure) to examine any differences in network measures between groups, and the factors underlying them. This confirmed group differences due to subject type on both efficiency and clustering ( and respectively), and also indicated group differences due to drug effect ( and respectively) - see Tables 1 and 2. Our hypothesis was that the antipsychotic medications would aim to make the brain connectivities of patients more similar to those of healthy individuals. In the light of the observed differences between the control and patient placebo groups, this hypothesis translates to an expectation that aripiprazole and sulpiride will reduce efficiency and increase clustering. We do indeed find this, both for patients and for healthy volunteers (Figure 1), with the only exception of when patients were treated with sulpiride, for which there was no effect on global efficiency. Moreover, after each drug treatment the brain networks of people with schizophrenia had global efficiencies which were no longer statistically different from the healthy brain networks (average , for aripiprazole and , for sulpiride). Both drugs also led to average clustering coefficients that were much closer to those of healthy brain networks (average , for aripiprazole, , for sulpiride).
| Source | SS | df | MS | F | p |
|---|---|---|---|---|---|
| Between groups | |||||
| Subject type | 0.026 | 1 | 0.026 | 12.208 | 0.002 |
| Error | 0.040 | 19 | 0.002 | ||
| Within groups | |||||
| Drug | 0.004 | 2 | 0.002 | 6.023 | 0.005 |
| Drug*Subject type | 0.004 | 2 | 0.002 | 5.997 | 0.005 |
| Error | 0.012 | 38 |
| Source | SS | df | MS | F | p |
| Between groups | |||||
| Subject type | 1 | 8.093 | 0.010 | ||
| Error | 0.001 | 19 | |||
| Within groups | |||||
| Drug | 2 | 3.480 | 0.041 | ||
| Drug*Subject type | 2 | 0.0001 | 1.005 | 0.376 | |
| Error | 0.0010 | 38 |
Aripiprazole significantly changes healthy brain networks
We found that aripiprazole has a dramatic effect on healthy individuals, with a large variation across individuals. We observe significantly reduced global efficiencies (average , , ), and a considerable increase in clustering (, ). Sulpiride increased clustering in healthy networks (average , ), but had no significant effect on global efficiency (average , ). Almost all metrics examined are greatly altered in the healthy volunteers administered aripiprazole, indicating considerable restructuring of functional connectivity: see Figure 1). These results are consistent with observations in the brain networks of people with schizophrenia: the drug treatments reduce efficiency and increase clustering.
Cognitive performance of healthy individuals is impaired after taking aripiprazole
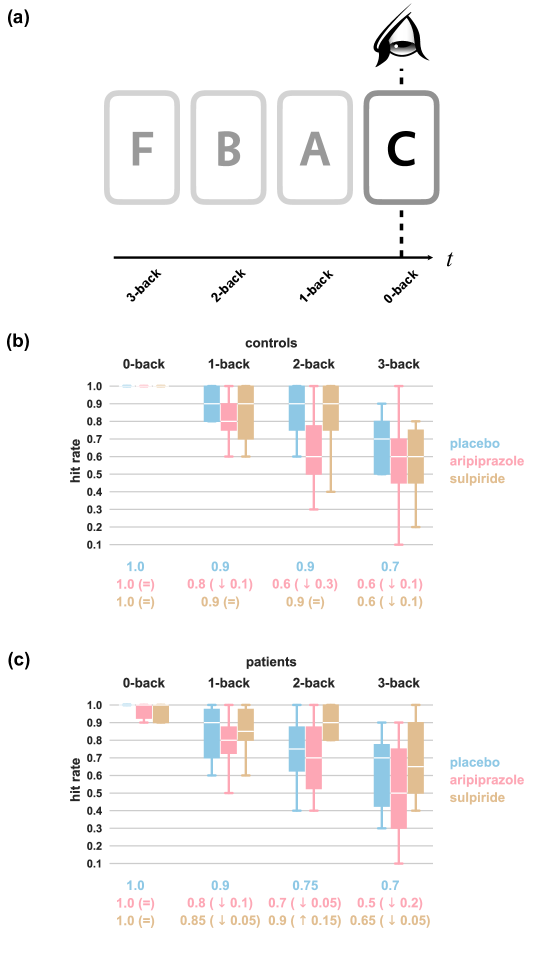
All subjects score consistently highly on the very easy 0-back task, but their performance deteriorates considerably with increasing difficulty of the task, with subjects experiencing profound difficulty with the 3-back version (see Figure 2). In the healthy cohort, aripiprazole has a detrimental effect on performance, whereas the impact of sulpiride is negligible - see Figure 2(b). In the challenging 2-back version of the task, the disparity is most clear - aripiprazole has a negative impact on cognitive performance, giving rise to an average hit rate of (compared to on placebo). Sulpiride, however, has no noticeable impact, with subjects achieving an average hit rate of .
An ANOVA (three-way, two repeated measures) revealed that, naturally, the predominant factor in determining success at the working memory tests was the difficulty of the task () - see Table 3. However, it also demonstrated that the drug treatments have a significant effect (). We then separated out the drug treatments into placebo-aripiprazole and placebo-sulpiride groups and repeated the ANOVA on controls and patients separately. This shows that the effect is only observed in the healthy volunteers, and that aripiprazole is the medication responsible ( for the placebo-aripiprazole groups and for the placebo-sulpiride groups). Thus, amongst healthy volunteers, we find that aripiprazole results in poorer performance at the N-back working memory task as compared to placebo, and that sulpiride has no noticeable effect.
| Source | SS | df | MS | F | p |
|---|---|---|---|---|---|
| Between groups | |||||
| Subject type | 0.007 | 1 | 0.007 | 0.044 | 0.836 |
| Error | 3.762 | 23 | 0.164 | ||
| Within groups | |||||
| Drug | 0.386 | 2 | 0.193 | 5.489 | 0.007 |
| Drug*Subject type | 0.011 | 2 | 0.006 | 0.160 | 0.853 |
| Error | 1.618 | 46 | 0.035 | ||
| Cog. difficulty | 4.828 | 3 | 1.609 | 42.779 | <0.0001 |
| Cog. difficulty*Subject type | 0.045 | 3 | 0.015 | 0.403 | 0.751 |
| Error | 2.596 | 69 | 0.038 | ||
| Drug*Cog. difficulty | 0.120 | 6 | 0.020 | 1.160 | 0.331 |
| Subject type*Drug*Cog. difficulty | 0.162 | 6 | 0.027 | 1.160 | 0.331 |
| Error | 2.384 | 138 | 0.017 |
Cognitive tests show worse performance of patients but do not capture drug effects
Patients scored worse than controls in the N-back working memory task, but not significantly so, with an average hit rate of for patients and for controls for the placebo 2-back task. Aripiprazole and sulpiride do not change the performance of patients much (average hit rates of and respectively for the 2-back task) with an ANOVA showing no significant drug effect () - see 2(c).
Discussion
Network topology, illness, and medication
It has been known for some time that the functional brain network organisation of people with schizophrenia differs from that of healthy volunteers (Alexander-Bloch et al., 2013; Lynall et al., 2010). However, very few studies have been conducted into the effect of antipsychotic medication, or indeed any drug for any brain disorder, on this network organisation. The ones that have been conducted found measurable drug effects (Achard and Bullmore, 2007; Schmidt et el., 2013; Yang et al., 2014; Flanagan, 2018) (including, converse to treatment, inducing psychosis (Lahti et al., 2001)). We hypothesised that a drug designed to treat schizophrenia would modify the brain connectivities of patients, making them more similar to those of healthy individuals. The result for global efficiency and clustering in Figure 1 clearly demonstrate this principle - sulpiride and aripiprazole act to reduce efficiency in both controls and patients. This leaves the patients with network efficiencies and clustering comparable to those of the unmedicated controls, and the controls with lower efficiency and higher clustering than before. In addition we also observed a strong effect of aripiprazole on healthy controls (see Figure 1 and Tables 1 and 2. This finding is consistent with our result in patients, as the drug seemingly tries to ‘correct’ for schizophrenia network characteristics - in the absence of schizophrenia - by altering the network metrics to decrease efficiency and increase clustering..
Network topology and cognitive ability
Our results suggest that there is an optimal configuration for a brain network in terms of maximising cognitive ability: performance worsens given any change (increase or decrease) in the examined metrics. We saw that as well as having a characteristically different brain network structure, schizophrenia patients perform less well at tests of cognitive ability than their healthy counterparts, as has been previously demonstrated (Bullmore and Sporns, 2012). Further, we showed that the group who performed most differently on medication (healthy volunteers having been administered aripiprazole) was also the group who had the most changes to the topology of their brain networks. This supports the notion that one’s cognitive ability is intrinsically linked to the structure of the brain’s functional network (Basset et al., 2009). For example, to integrate and process information quickly, a network requires some level of efficiency. The control group on aripiprazole had diminished efficiency and performed significantly worse at the N-back tasks than when on placebo. No such impaired performance is seen for sulpiride, for which the reduction in efficiency was negligible. On the other hand, the schizophrenia brain networks appear to have too high an efficiency, perhaps leading to disordered or overwhelming information integration, and they too perform worse. The drugs do decrease efficiency in patients a little and their performance is slightly improved at the 1- and 2-back tasks. A previous study on MEG derived networks using the N-back working memory paradigm (Kitzbichler et al., 2011) demonstrated a shift towards a more random network configuration (with a decrease in modularity and clustering, and an increase in global efficiency) as the cognitive demands of the task increased. The authors also note significant differences from purely random networks and argue that global sychronisation is important in higher cognition, which is reflected in the network architecture.
Brain networks as a means to assess medication
This quite unique dataset allowed for an investigation into the effects of antipsychotic drugs on both the large-scale functional brain networks and the cognitive performance of people diagnosed with chronic schizophrenia and healthy volunteers. Despite its limitations, clear drug effects were observed on the network topology and performance at the N-back working memory task. We find a restoration of the healthy network properties in the patient networks, and that aripiprazole impairs cognitive ability and radically rewires the brain networks of healthy volunteers. It would be highly beneficial for future studies to use state of the art functional MRI data to further investigate the links between disrupted networks in people with brain disorders, how medication influences these, and an “ideal” network topology for the brain (which should be identified by association with an optimal behavioural parameter, such as the best cognitive performance). There is potential for not just diagnosis of the original brain disorder, but also for the quantification of the effectiveness of a drug in treating the illness, and even guidance on its optimal dosage. This would then allow for a systematic comparison between alternative treatments.
References
- Achard et al. (2006) Achard S, Salvador R, Whitcher B, Suckling J and Bullmore E (2006) A Resilient, Low-Frequency, Small-World Human Brain Functional Network with Highly Connected Association Cortical Hubs. Journal of Neuroscience 26(1):63-72.
- Achard and Bullmore (2007) Achard S and Bullmore E (2007) Efficiency and cost of economical brain functional networks. PLoS Computational Biology 3:e17.
- Alexander-Bloch et al. (2013) Alexander-Bloch AF, Vértes PE, Stidd R, Lalonde F, Clasen L, Rapoport J, Giedd J, Bullmore ET and Gogtay N (2013) The Anatomical Distance of Functional Connections Predicts Brain Network Topology in Health and Schizophrenia. Cerebral Cortex 23(1):127-138.
- American Psychiatric Association (2000) American Psychiatric Association (2000) Diagnostic and statistical manual of mental disorders. Ed 4, text revision. Washington, DC: American Psychiatric Association.
- Baddeley (2003) Baddeley A (2003) Working memory: looking back and looking forward. Nature Reviews Neuroscience 4:829-839.
- Basset et al. (2009) Bassett DS, Bullmore ET, Meyer-Lindenberg A, Apud JA, Weinberger DR, and Coppola R (2009) Cognitive fitness of cost-efficient brain functional networks. Proc Natl Acad Sci U.S.A. 106(28):11747-52.
- Bolstad et al. (2015) Bolstad I, Andreassen OA, Groote IR, Haatveit B, Server A, and Jensen J (2015). No difference in frontal cortical activity during an executive functioning task after acute doses of aripiprazole and haloperidol. Front Hum Neurosci. 9(296).
- Bullmore and Vértes (2013) Bullmore ET and Vértes P (2013) From Lichtheim to Rich Club; Brain Networks and Psychiatry. JAMA Psychiatry 70(8):780-782.
- Bullmore and Sporns (2012) Bullmore ET and Sporns O (2012) The economy of brain network organization. Nature Reviews Neuroscience 13:336-349.
- Bullmore and Sporns (2009) Bullmore ET and Sporns O (2009) Complex brain networks: graph theoretical analysis of structural and functional systems. Nature Reviews Neuroscience 10:186-198.
- Cohen (2007) Cohen BH (2007) Explaining Psychological Statistics. Ed 3. John Wiley & Sons, Inc., Hoboken, New Jersey.
- Flanagan (2018) Flanagan F, Lacasa L, Towlson EK, Lee SH, and Porter MA (2018) Effect of antipsychotics on community structure in brain functional networks. ArXiv:1806.00080.
- Fornito (2012) Fornito A, Zalesky A, Pantelis C, and Bullmore ET (2012) Schizophrenia, neuroimaging and connectomics. Neuroimage 62(4): mbox2296-2314.
- Hadley et al. (2016) Hadley JA, Kraguljac NV, White DM, Ver Hoef L, Tabora J, and Lahti AC (2016) Change in brain network topology as a function of treatment response in schizophrenia: a longitudinal resting-state fMRI study using graph theory. npj Schizophrenia 2:16014.
- Hagberg et al. (2008) Hagberg AA, Schult SA, and Swart PJ (2008) Exploring network structure, dynamics, and function using networkx. Proceedings of the 7th Python in Science Conference (SciPy2008): p. 11-15.
- van den Heuvel et al. (2013) van den Heuvel MP, Sporns O, Collin G, Scheewe T, Mandl RC, Cahn W, Goñi J, Hulshoff Pol HE, and Kahn RS (2013) Abnormal rich club organization and functional brain dynamics in schizophrenia. JAMA Psychiatry 70(8):783-92.
- van den Heuvel and Hulshoff Pol (2010) van den Heuvel MP and Hulshoff Pol HE (2010) Exploring the brain network: A review on resting-state fMRI functional connectivity. European Neuropsychopharmacology 20(8):519-534.
- Humphries et al. (2006) Humphries MD, Gurney K, and Prescott TJ The brainstem reticular formation is a small-world, not scale-free, network. Proc. Biol. Sci. 273:503-511.
- IBM Corp. (2012) IBM Corp. (2012) IBM SPSS Statistics for Windows, Version 21.0. Armonk, NY: IBM Corp.
- Kitzbichler et al. (2011) Kitzbichler MG, Henson RNA, Smith ML, Nathan PJ, Bullmore ET (2011) Cognitive Effort Drives Workspace Configuration of Human Brain Functional Networks. The Journal of Neuroscience 31(22):8259–8270.
- Koshino (2005) Koshino H, Carpenter PA, Minshew NJ, Cherkassky VL, Keller TA, MA Just (2005) Functional connectivity in an fMRI working memory task in high-functioning autism. Neuroimage 24(3):810-821.
- Kundu et al. (2012) Kundu P, Inati SJ, Evans JW, Luh WM. and Bandettini PA (2012) Differentiating BOLD and non-BOLD signals in fMRI time series using multi-echo EPI. Neuroimage 60(3):1759-70.
- Lahti et al. (2001) Lahti AC, Weiler MA, Michaelidis BT, Parwani A, and Tamminga CA (2001) Effects of ketamine in normal and schizophrenic volunteers. Neuropsychopharmacology 25(4):455-67.
- Latora and Marchiori (2001) Latora V and Marchiori M (2001) Efficient behavior of small-world networks. Physical Review Letters 87:198701.
- Lieberman (2004) Lieberman, JA. (2004) Dopamine partial agonists: A new class of antipsychotic. CNS Drugs 18:251-267.
- Lynall et al. (2010) Lynall ME, Bassett DS, Kerwin R, McKenna PJ, Kitzbichler M, Muller U and Bullmore ET (2010) Functional Connectivity and Brain Networks in Schizophrenia. The Journal of Neuroscience 30(28):9477-9487.
- Newman (2003) Newman MEJ (2003) Mixing patterns in networks. Physical Review E 68:026126.
- Opsahl et al (2010) Opsahl T, Agneessens F and Skvoretz J (2010) Node centrality in weighted networks: Generalizing degree and shortest paths. Social Networks 32(3):245–251.
- Patel et el (2014) Patel AX, Kundu P, Rubinov M, Jones PS, Vértes PE, Ersche KD, Suckling J and Bullmore (2014) A wavelet method for modeling and despiking motion artifacts from resting-state fMRI time series. Neuroimage 95:287-304.
- Percival and Walden (2000) Percival D and Walden A (2000) Wavelet methods for time series analysis. Cambridge, UK: Cambridge UP.
- Power et al. (2012) Power JD, Barnes KA, Snyder AZ, Schlaggar BL and Petersen SE (2012) Spurious but systematic correlations in functional connectivity MRI networks arise from subject motion. Neuroimage 59(3):2142-54.
- Rubinov and Bullmore (2013) Rubinov M and Bullmore ET (2013) Schizophrenia and abnormal brain network hubs. Dialogues in Clinical Neuroscience 15(3):339-49.
- Rubinov and Bullmore (2013) Rubinov M and Bullmore ET (2013) Fledgling pathoconnectomics of psychiatric disorders. Trends in Cognitive Sciences 17(12):641-647.
- Saramäki (2007) Saramäki J, Kivelä M, Onnela JP, Kaski K, and Kertész J (2007) Generalizations of the clustering coefficient to weighted complex networks. Physical Review E 75:027105.
- Satterthwaite et al. (2012) Satterthwaite TD, Wolf DH, Loughead J, Ruparel K, Elliott MA, Hakonarson H, Gur RC and Gur RE (2012) Impact of in-scanner head motion on multiple measures of functional connectivity: relevance for studies of neurodevelopment in youth. Neuroimage 60(1):623-32.
- Schmidt et el. (2013) Schmidt A, Smieskova R, Aston J, et al (2013) Brain Connectivity Abnormalities Predating the Onset of Psychosis: Correlation With the Effect of Medication. JAMA Psychiatry 70(9):903-912.
- Sheehan et al. (1998) Sheehan DV, Lecrubier Y, Sheehan KH, Amorim P, Janavs J, Weiller E, Hergueta T, Baker R and Dunbar GC (1998) The Mini-International Neuropsychiatric Interview (M.I.N.I.): the development and validation of a structured diagnostic psychiatric interview for DSM-IV and ICD-10. The journal of clinical psychiatry 59:Suppl 20:22-33.
- Suckling et al. (2006) Suckling J, Long C, Triantafyllou C, Brammer M, Bullmore ET (2006) Variable precision registration via wavelets: Optimal spatial scales for inter-subject registration of functional MRI. Neuroimage 31(1):197- 208
- Van Dijk et al. (2012) Van Dijk KR, Sabuncu MR and Buckner RL (2012) The influence of head motion on intrinsic functional connectivity MRI. Neuroimage 59(1):431-8.
- Watts and Strogatz (1998) Watts DJ and Strogatz S (1998) Collective dynamics of ‘small-world’ networks. Nature 393(6684):440-442.
- Yang et al. (2014) Yang R, Zhang H, Wu X, et al (2014) Hypothalamus-Anchored Resting Brain Network Changes before and after Sertraline Treatment in Major Depression. BioMed Research International 2014..
- Yu et al. (2011) Yu Q, Sui J, Rachakonda S, He H, Gruner W, Pearlson G, Kiehl KA, Calhoun VD (2011) Altered Topological Properties of Functional Network Connectivity in Schizophrenia during Resting State: A Small-World Brain Network Study. PLoS one :e25423.
- Zalesky et al. (2010) Zalesky A, Fornito A, Harding IH, Cocchi L, Yöcel M, Pantellis C and Bullmore ET (2010) Whole-brain anatomical networks: does the choice of nodes matter? Neuroimage 50(3):(970-83).