LOFAR observations of the mode-switching pulsar B0943+10
Abstract
PSR B0943+10 is an old non-recycled pulsar which for decades has been mostly known for its rapid and spontaneous radio mode switching. Recently, [Hermsen et al. (2013)] discovered correlated changes in the thermal X-ray emission from the polar cap, thus demonstrating that radio modes are not just a product of the local changes in the radio emission region, but a sign of some global magnetospheric transformation. At about the same time, owing to the commissioning of the new generation of low-frequency radio arrays, the broadband observations at the lowest edge of ionospheric transparency window became available. At these radio frequencies profile morphology and the single-pulse properties of PSR B0943+10’s emission become very dynamic, providing details not only about the emission itself, but also about the conditions in the polar gap. Here, I will present the recent results of the LOFAR observations of PSR B0943+10 and discuss their contribution to the multiwavelength picture.
keywords:
pulsars: individual (B0943+10), telescopes: LOFAR1 Introduction
PSR B0943+10 (hereafter B0943) is a relatively old, non-recycled pulsar. Once in a few hours, B0943 switches abruptly between so-called “Bright” and “Quiet” modes (hereafter B and Q). At radio frequencies, the pulsar is a few times brighter in B-mode and its single pulses form regular drifting patterns within the on-pulse phase window. With the start of Q-mode the drift disappears, the flux density drops and the shape of the average profile alters. Mode transitions affect the properties of pulsar’s high-energy emission as well [Hermsen et al. (2013), (Hermsen et al. 2013)]. In X-rays, the pulsar is times brighter in the radio-Quiet mode and the emission has somewhat different spectral shape than in B-mode. X-ray emission from both modes has a pulsed thermal component coming from a hot polar cap [Mereghetti et al. (2016), (Mereghetti et al. 2016)]. The broadband nature of the mode-switching phenomenon may point to some global-scale magnetospheric transformation during the mode transition, making B0943 a useful laboratory to study the complex interplay between various physical processes in the pulsar magnetosphere. However, the exact mechanism of mode switching remains unclear.
Observing B0943 with the new generation of sensitive low-frequency radio telescopes with large fractional bandwidths may provide valuable input to solving the mode switching puzzle. At the frequencies below 200 MHz the average profile morphology starts evolving rapidly both in B- and Q-modes. Within the framework of radius-to-frequency mapping theory (RFM), it means that below 200 MHz a relatively larger range of emission heights can be observed at once. At the same time, the pulsar is quite bright in this frequency range, so it is possible to track the changes in the average profile shape on the time scales of few minutes and also to observe the individual pulses directly.
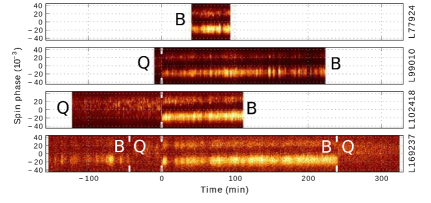
In 2012–2013, B0943 was observed with the LOFAR (LOw FRequency ARray) core stations, with several full emission modes being recorded in the broad 25–80 MHz frequency range (Fig. 1, left). Here I present a summary of the results, originally published in [Bilous et al. (2014)] and [Bilous (2017)].
2 Lessons learned
Revisiting geometry and the number of sparks in the carousel. Based on the analysis of the frequency-dependent separation between B-mode average profile components at the frequencies below 300 MHz and the brief presence of a 37-period modulation in the amplitudes of drifting subpulses, [Deshpande & Rankin (2001)] concluded that B0943 is an almost aligned rotator, with the inclination angle within –, and the line-of-sight LOS passing between the spin and magnetic axes (yielding the impact angle of about –). The time-integrated part of the geometry derivation was successfully reproduced using LOFAR observations. However, it must be stressed that the exact values of geometry angles depend heavily on the assumed opening angle of the emission cone at 1 GHz, , namely and . Taking the distribution of from the work of [Mitra & Deshpande (1999)] yields an of – and, in principle, the current geometry derivation scheme allows for almost any value of . The weaker constraints on geometry angles have to be taken into account while explaining the unexpectedly large fractional amplitude of the thermal X-ray emission from B0943’s polar caps [Mereghetti et al. (2016), (Mereghetti et al. 2016)]. Another interesting constraint on B0943’s geometry may come from the direct modelling of the light curve of X-ray pulsations.
In the work of [Deshpande & Rankin (2001)], the orientation of the line-of-sight vector with respect to magnetic and spin axes was set by the presence of periodic amplitude modulation of drifting subpulses (so-called “tertiary modulation”). So far, only two more brief detections of tertiary modulation are known, both of them above 300 MHz [Backus et al.(2010), (Backus et al. 2010)]. Despite the dedicated searches and relatively large volume of B-mode observations, no sign of tertiary modulation was detected in the LOFAR data. Since tertiary modulation is a vital argument for constraining several other important system parameters: (e.g. the degree of subpulse drift aliasing, the angular velocity of the carousel, and thus, the gradient of the accelerating potential in the polar gap), obtaining strong independent confirmation of it is of utmost importance.
Emission height and fiducial longitude. The midpoint between profile components in the LBA B-mode data appeared to follow the dispersion law down to 25 MHz, allowing us to measure DM independently of the profile evolution. This implies that the position of midpoint is frequency-independent and, thus, is well suited for the role of fiducial longitude, . The absence of aberration and retardation signatures in the profile midpoint placed the emission region (at a height ) much closer to the stellar surface than to the light cylinder (): .
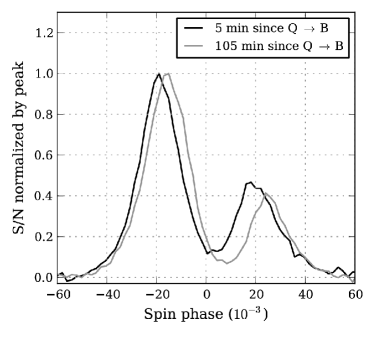
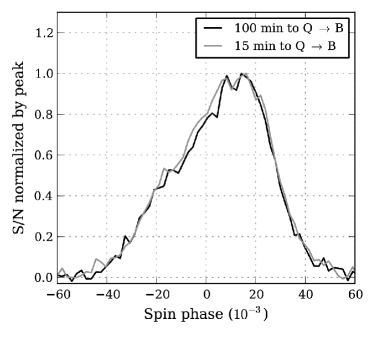
Systematic delay of fiducial longitude. It is well known that in the B-mode both the average profile and single pulses evolve systematically during a mode instance. LOFAR observations discover one more feature of the B-mode profile evolution: the frequency-independent midpoint between B-mode profile components is systematically shifting towards later spin phases with the time from the start of the mode. The observed lag asymptotically changes towards a stable value of 4 ms, much too high to be due to a changing spin-down rate. Similar results have been obtained by [Suleymanova & Rodin (2014)] around 100 MHz. At the B-to-Q transition the profile midpoint jumps back to the earlier spin phase and remains constant throughout Q-mode until the next Q-to-B transition (Fig. 2). An interesting explanation of the midpoint lag involves the variation of accelerating potential between the surface of the pulsar and the start of the plasma-filled magnetosphere above the polar gap, which is responsible for the departure of corotation in the plasma-filled magnetosphere [Melrose & Yuen (2014), (Melrose & Yuen 2014)]. This explanation connects the observed midpoint lag to the gradually evolving subpulse drift rate, which is determined by the gradient of potential in orthogonal direction – across the field lines in the polar cap.
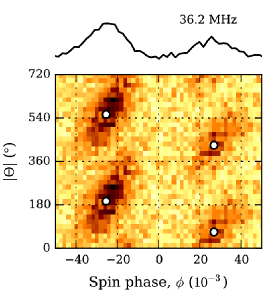
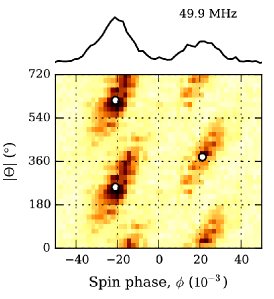
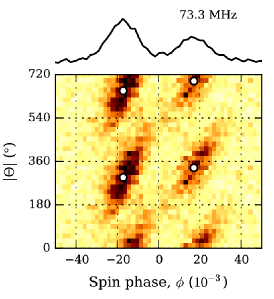
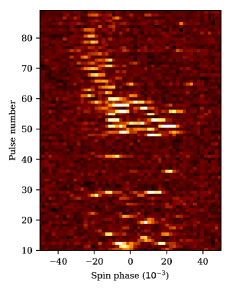
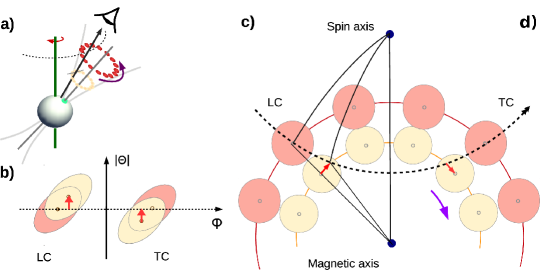
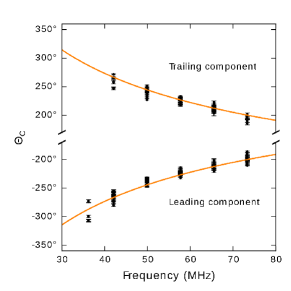
Frequency-dependent drift phase delay. A common technique of visualizing the tracks of drifting subpulses is folding them modulo drift period . In 2013, Hassall et al. discovered that the centres of driftbands for PSR B0809+74 evolve with radio frequency. A similar effect was observed for B0943 (Fig. 3). It can be shown that this delay can be quantitatively modelled within the rotating carousel model in the RFM convention (see also Fig. 4):
| (1) |
where subscript C marks the centre of driftband, , is the number of sparks in the carousel, is the pulsar period, is the subpulse drift period, and . Similar quantitative explanation can be also applied to PSR B0809+74.
References
- [Backus et al.(2010)] Backus, I., Mitra, D., & Rankin, J. M. 2010, MNRAS, 41, 30
- [Bilous et al. (2014)] Bilous, A. V., Hessels, J. W. T., Kondratiev, V. I., et al. 2014, A&A, 572, A52
- [Bilous (2017)] Bilous, A. V. 2017, submitted to A&A, ArXiv Astrophysics e-prints, 2017arXiv171005621B
- [Deshpande & Rankin (2001)] Deshpande, A. A. & Rankin, J. M. 2001, MNRAS, 322, 438
- [Hassall et al.(2013)] Hassall, T. E., Stappers, B. W., Weltevrede, P., et al. 2013, A&A, 552, A61
- [Hermsen et al. (2013)] Hermsen, W., Hessels, J. W. T., Kuiper, L., et al. 2013, Science, 339, 436
- [Melrose & Yuen (2014)] Melrose, D. B. & Yuen, R. 2014, MNRAS, 437, 262
- [Mereghetti et al. (2016)] Mereghetti, S., Kuiper, L., Tiengo, A., et al. 2016, ApJ, 831, 21
- [Mitra & Deshpande (1999)] Mitra, D. & Deshpande, A. A. 1999, A&A, 346, 906
- [Suleymanova & Rodin (2014)] Suleymanova, S. & Rodin, A. 2014, Astron. Rep., 58, 11, 796-807