The intrinsic three-dimensional shape of galactic bars
Abstract
We present the first statistical study on the intrinsic three-dimensional (3D) shape of a sample of 83 galactic bars extracted from the CALIFA survey. We use the galaXYZ code to derive the bar intrinsic shape with a statistical approach. The method uses only the geometric information (ellipticities and position angles) of bars and discs obtained from a multi-component photometric decomposition of the galaxy surface-brightness distributions. We find that bars are predominantly prolate-triaxial ellipsoids (68%), with a small fraction of oblate-triaxial ellipsoids (32%). The typical flattening (intrinsic semiaxis ratio) of the bars in our sample is 0.34, which matches well the typical intrinsic flattening of stellar discs at these galaxy masses. We demonstrate that, for prolate-triaxial bars, the intrinsic shape of bars depends on the galaxy Hubble type and stellar mass (bars in massive S0 galaxies are thicker and more circular than those in less massive spirals). The bar intrinsic shape correlates with bulge, disc, and bar parameters. In particular with the bulge-to-total () luminosity ratio, disc color, and central surface brightness of the bar, confirming the tight link between bars and their host galaxies. Combining the probability distributions of the intrinsic shape of bulges and bars in our sample we show that 52% (16%) of bulges are thicker (flatter) than the surrounding bar at 1 level. We suggest that these percentages might be representative of the fraction of classical and disc-like bulges in our sample, respectively.
keywords:
galaxies: bars - galaxies: evolution - galaxies: formation - galaxies: structure - galaxies: photometry1 Introduction
Stellar bars are common structures in disc galaxies in the nearby Universe (Marinova & Jogee, 2007; Barazza et al., 2008; Aguerri et al., 2009) and they are considered the main internal mechanism driving the dynamical and secular evolution of disc galaxies (Kormendy & Kennicutt, 2004). The presence of a bar is able to modify the external appeareance of a galaxy, changing its structure and morphology within the central 10 kpc. Numerical simulations have found that stellar bars redistribute the angular momentum between the baryonic and dark matter components (Debattista & Sellwood, 1998, 2000). The relative amount of exchanged angular momentum is related to specific properties of the galaxies, such as the bar mass, halo density, and halo velocity dispersion (Athanassoula, 2003; Sellwood & Debattista, 2006; Athanassoula et al., 2013). In addition, bars are able to funnel material toward the galaxy center where starbursts can ignite (Sheth et al., 2005; Shlosman et al., 1990), and they have been proposed as an efficient mechanism to create new structures in the galaxy centers such as disc-like bulges (Kormendy & Kennicutt, 2004), inner star-forming rings (Buta et al., 2003; Muñoz-Tuñón et al., 2004), and inner bars (Erwin, 2004; Debattista & Shen, 2007; de Lorenzo-Cáceres et al., 2013). Therefore, understanding the mechanisms leading to the formation of bars is key to understand galaxy evolution in general.
The observed properties of stellar bars, and their relation with the characteristics of the host galaxies have been extensively reviewed in the literature. It is now established that the main driver for the presence of a bar is the galaxy mass (Méndez-Abreu et al., 2010; Nair & Abraham, 2010; Erwin, 2017), with the bar frequency reaching a peak at (Méndez-Abreu et al., 2012) and quickly declining towards both lower and higher masses. Many observational and theoretical studies have also investigated other internal and external galaxy properties to understand which galaxies are more or less likely to host bars obtaining some contradictory results (Barazza et al., 2009; Athanassoula et al., 2013; Díaz-García et al., 2016; Martinez-Valpuesta et al., 2017). In Aguerri et al. (2009), we found that red, massive, gas-poor galaxies host less and shorter bars than blue, low-mass, and gas-rich galaxies. These results were similar to those presented in Barazza et al. (2008) and Nair & Abraham (2010). However, other authors obtained completely opposite results (Masters et al., 2011; Skibba et al., 2012; Consolandi, 2016). In Méndez-Abreu et al. (2012) we discussed that most of these discrepancies might be solved if galaxy samples would have been carefully selected in both stellar mass and environment to avoid biases when dealing with bar statistics. Recently, Erwin (2017) confirmed this argumentation and he also pointed out the problems of dealing with poor spatial resolution when analysing galaxy bars.
Despite the tremendous progress in the field, an important piece of information is still hidden in the intrinsic three-dimensional (3D) structure of stellar bars, and how the bar shape is related to the different galaxy properties. -body simulations have demonstrated how the 3D structure of stellar bars is strongly dependent on the time since bar formation. Bars form spontaneously in self-gravitating rotating galactic discs (Combes et al., 1990; Debattista & Sellwood, 2000; Athanassoula, 2003); initially they have a thin vertical density profile similar to that of the disc, i.e., bars are formed by the re-arrangement of disc material (Athanassoula et al., 2013). This scenario have been confirmed by orbital analysis where planar and circular orbits become more elongated and material gets trapped around the stable periodic orbits of the x1 family (Contopoulos & Papayannopoulos, 1980; Athanassoula et al., 1983; Athanassoula, 1992). However, this configuration quickly changes due to the bar buckling out of the disc plane, which modifies the vertical structure of the bar inner regions and it creates a substantially thicker component than the surrounding disc (Combes & Sanders, 1981; Raha et al., 1991; Martinez-Valpuesta et al., 2006). This vertical structure, which appears as boxy- or peanut-shaped when the galaxy is seen edge-on, has also been demonstrated to be part of the bar through 3D orbital analysis (Skokos et al., 2002). In summary, numerical simulations suggest that, on the long term, most bars should be formed by an inner thick component and an outer part thinner than the inner region (Athanassoula, 2005).
Observationally, boxy/peanut (B/P) shaped bars have been detected in many studies of edge-on and, indirectly, also in face-on galaxies (Lütticke et al., 2000; Yoshino & Yamauchi, 2015; Méndez-Abreu et al., 2008; Erwin & Debattista, 2013; Ciambur & Graham, 2016). However, they have not been generally included as a separate component in either photometric decompositions (but see Laurikainen & Salo, 2016, and references therein) or bar deprojection schemes (Martin, 1995; Gadotti et al., 2007). In fact, Zou et al. (2014) using numerical simulations to test their 2D bar deprojection method concluded that, to first order approximation, one-ellipsoid models could represent the 3D structure of the bar reasonably well. This was also pointed out in early hydrodnamical simulations of barred galaxies (Hunter et al., 1988; England, 1989; Aguerri et al., 2001a). In addition, the peanut shape generally does not encompass the full extent of the bar, i.e., there is some flat bar outside the buckled inner part (Lütticke et al., 2000; Méndez-Abreu et al., 2008). Erwin & Debattista (2013) also argue that not every bar thickens vertically and estimated that at least 13% of bars in galaxies have not buckled.
In this paper, we present the first statistical study of the intrinsic shape of stellar bars using the observed sample of the Calar Alto Legacy Integral Field Area survey Data Release 3 (CALIFA-DR3 Sánchez et al., 2016). We use the galaXYZ code described in Méndez-Abreu et al. (2010) and Costantin et al. (2018) and compare the bar intrinsic shape with other observed galaxy properties to shed light on the formation of these structures. To this aim, we consider bars to be, at first order, single triaxial ellipsoids. Despite the limitations of such a description, it is an appropriate starting point to study in a quantitative way the 3D shape of bars with respect to galaxy properties. The paper is organised as follows: Sect. 2 describes the sample of galaxies used in this work. Sect. 3 details the methodology to derive the intrinsic shape of stellar bars from their projected photometric properties. Sect. 4 describes the main results of this paper about the intrinsic shape of bars and its relation with other galaxy properties. The discussion of the results in the context of bar formation is also done in Sect. 4. The conclusions are given in Sect. 5. Throughout the paper we assume a flat cosmology with = 0.3, = 0.7, and a Hubble constant = 70 km s-1 Mpc-1.
2 CALIFA sample of barred galaxies
The sample of barred galaxies was selected from Méndez-Abreu et al. (2017). They present a two-dimensional multi-component photometric decomposition of 404 galaxies from the CALIFA-DR3 (Sánchez et al., 2016). They represent all galaxies with either no clear signs of interaction or not strongly inclined within the 667 galaxies observed in the final CALIFA data release. They found 162 barred galaxies out of 404 galaxies. Following Costantin et al. (2018), we impose an inclination constraint to galaxies with . This assures the robustness of our method to derive the intrinsic shape of our bar sample. We ended up with 125 barred galaxies meeting this criteria. We further discarded 42 galaxies for the following reasons: i) galaxies with complex morphology in the outer parts of the discs, e.g., strong spiral arms or asymmetric discs, that make it difficult to deriving their geometric (ellipticity and position angle) properties (14 galaxies), ii) galaxies with very low surface brightness discs ( mag/arcsec2) or bars ( mag/arcsec2) making it difficult to measuring their geometry (8 galaxies), iii) galaxy discs for which the ellipticity and/or position angle from the photometric decomposition does not match the outer values of the corresponding radial profiles derived from the isophotal analysis (9 galaxies), iv) galaxies with an offcentered bar (3 galaxies), and v) galaxies for which the uncertainties in the derived intrinsic shape ( or ) are larger than 1 (8 galaxies). The final sample amounts to 83 galaxies.
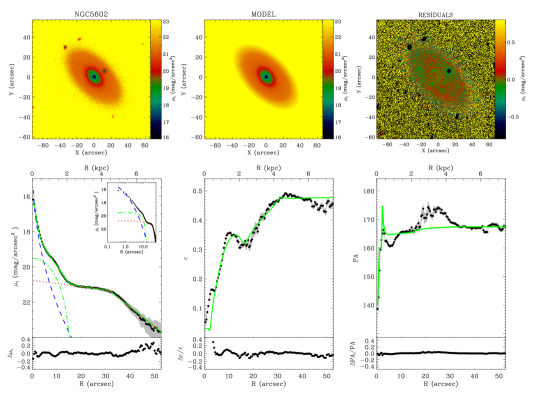
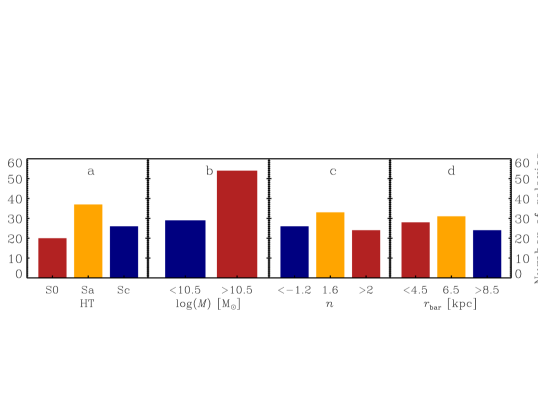
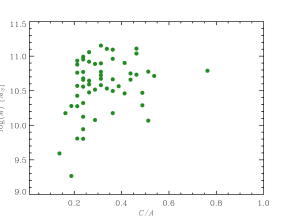
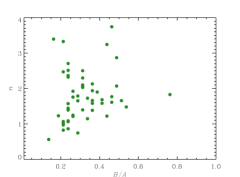
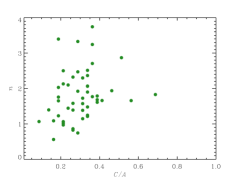
Méndez-Abreu et al. (2017) carried out the photometric decomposition analysis using the , , and band images. In this work we have used the results from the band images to better resolve the bar component minimising the dust effects with respect to the other SDSS passbands. The average band point spread function (PSF) full width at half maximum (FWHM) of the images is 1.10.2 arcsec with a typical depth of 26 mag arcsec-2. An example of the 2D photometric decomposition for NGC5602 is shown in Fig. 1. The galaxies main properties (i.e., Hubble type , stellar mass , Sérsic index parameter , and bar radius ) from Méndez-Abreu et al. (2017) and Walcher et al. (2014) are shown in Fig. 2.
3 Bars intrinsic shape
The derivation of the intrinsic shape of the individual bars in our sample was performed using the galaXYZ code. This method has previously been applied to the analysis of the intrinsic 3D shape of galactic bulges (Méndez-Abreu et al., 2010; Costantin et al., 2018). However, it is worth noticing that our statistical approach is applicable to any galactic structure if the initial assumptions are fulfilled.
For the sake of clarity, we describe here the main hypotheses of our method. In order to characterise the intrinsic shape of a bar, we first assumed that it can be successfully modelled by a triaxial ellipsoid that shares the same equatorial plane as the disc. Secondly, the galaxy disc is considered to be an oblate ellipsoid with an intrinsic thickness given by a normal distribution function with mean intrinsic axial ratio = 0.267 and standard deviation = 0.102 (Rodríguez & Padilla, 2013). Moreover, a third condition imposes that the bar and disc share the same center, which coincides with the galaxy center. This condition is also imposed in the photometric decomposition where all components are forced to share the same center. We also visually checked the individual galaxies to look for offcentered bars such as those presented in Kruk et al. (2017) finding only 3 out of 125. This low fraction of offcentered bars is in agreement with the findings of Kruk et al. (2017) that most of these systems are located in low-mass galaxies. They were removed from the sample (see Sect. 2).
Regarding the first hypothesis, we discussed in Sect. 1 about the possibility of bars being composed by both an inner vertically thick component (usually associated to the presence of a B/P structure) and another more extended and thinner bar. In our photometric decomposition, the inner B/P structure is not included as a different analytical component, and we visually checked all the fits to assure the external bar is fitted. We thus consider our intrinsic shape results to be representative of the outer extended bar. However, the presence of a B/P structure might still be affecting the measurements of the geometric parameters involved in our analysis of the 3D shape, i.e., the bar and disc ellipticities and position angles. To better quantify the effect of possible B/P structures in our sample we carried out a visual classification of our sample galaxies in order to detect the possible presence of inner B/P structures. We followed the criteria established in a series of papers by Laurikainen et al. (2011); Athanassoula et al. (2015); Laurikainen & Salo (2017): a potential B/P is detected based on the presence of a close to circular isophotal contour in the central part of the bar with smaller ellipticity compared to the outer bar. In addition, we also used the criteria proposed by Erwin & Debattista (2013, 2017) to detect B/P structures. This is based on the presence of boxy isophotes in the inner part of the bar, accompanied by narrow, and offset with respect to the major axis, isophotes in the outer bar. These features are called spurs. A good example of the two types of projections expected for B/P structures is given in Fig. 1 of Li et al. (2017). Using this classification scheme we found that 22 and 8 galaxies were classified as barlenses or possible barlenses (barlens?), respectively. Similarly, we found that 3 and 3 galaxies were classified as B/P or possible B/P (B/P?), respectively. Finally, we classified 47 galaxies as not presenting any characteristic of an inner B/P structure. The classification for each galaxy is shown in Table LABEL:tab:results. Separating our sample into low- () < 10.5) and high-mass () > 10.5) galaxies we found 31% and 52% of our bars are buckled, respectively. This result is in agreement with previous result from Li et al. (2017) and Erwin & Debattista (2017) showing an increase on the fraction of B/P structures with galaxy mass.
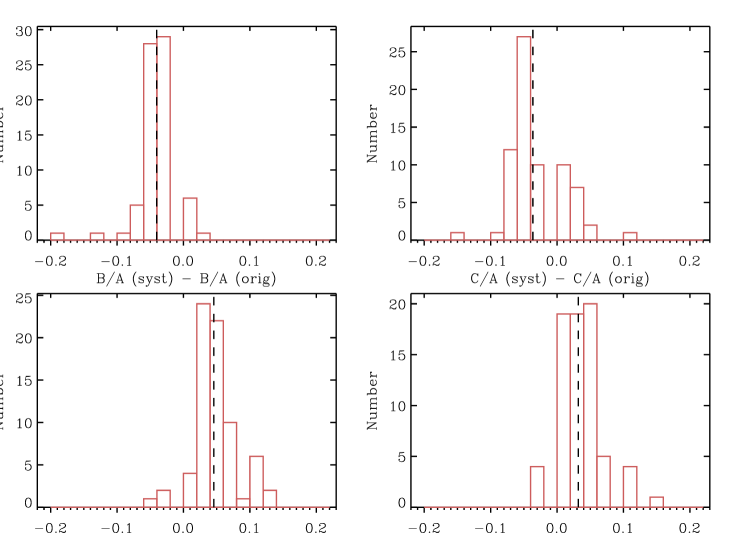
We also studied the typical effect that a missing B/P structure would have in our results. We extensively describe the methodology and results of this test in Appendix B. We found that the values of the bar intrinsic semiaxis ratios and would be both systematically overestimated by 0.04 when dismissing the B/P. Similarly, the uncertainties in the intrinsic shape derived by our method (see Table LABEL:tab:results) would be underestimated by 0.05 and 0.03 in and , respectively. These small biases could be affecting our galaxies previously classified as hosting a boxy/peanut structure.
The methodology and equations used to derive the intrinsic shape of our bars are extensively discussed in Méndez-Abreu et al. (2010) and Costantin et al. (2018). We refer the readers to those papers for a full description of the problem. Here, we just remind that the scope of our method is to derive, starting from a set of projected geometric parameters for the bar (ellipticity and position angle ) and the disc (ellipticity and position angle ), the intrinsic semiaxes (, , ) of the three-dimensional triaxial ellipsoid describing our bars. The solution to this inversion problem is not unique since we are missing one observable, i.e., the angle subtended by the major axis of the bar and the major axis of the disc in the galaxy plane (Euler angle). Therefore, our methodology propose a statistical approach to this problem.
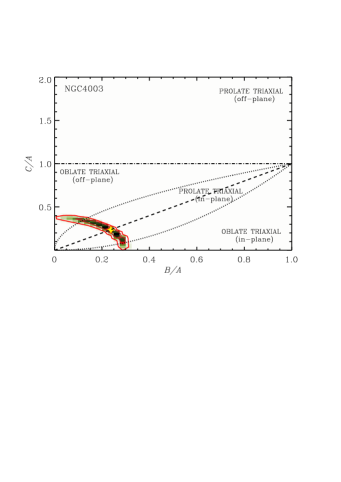
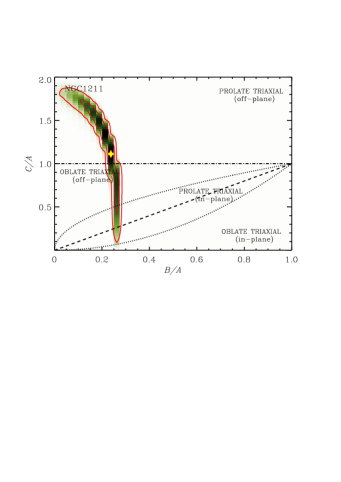
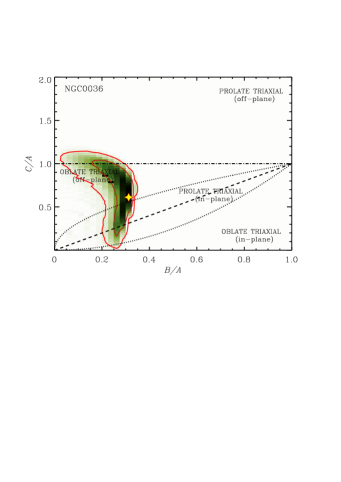
Figure 3 shows an example of the probability distribution function (PDF) for the intrinsic semiaxis ratios and of some example galaxies in our sample. It is worth noting that the width of the distribution in either and does not only depend on the photometric decomposition errors, but mostly on the lack of knowledge of the Euler angle. Nevertheless, Fig. 3 shows how our statistical analysis is able to produce important constraints on the shape of our sample bars.

4 Results and Discussion
4.1 The intrinsic shape of bars in the CALIFA sample
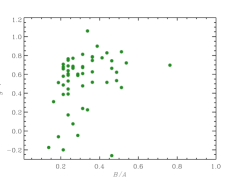
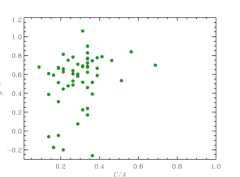
Figure 4 shows the distribution of the intrinsic axial ratios derived for our sample of bars. The uncertainties in each galaxy are omitted for the sake of clarity in the figure, but they can be found in Table LABEL:tab:results. We defined four different regions in this diagram. They represent the expected position for bars with different intrinsic shapes. Following Franx et al. (1991) we assume that the three-dimensional galaxy density is structured as a set of coaligned ellipsoids. Therefore, general cases include the oblate-triaxial and prolate-triaxial ellipsoids. Since we do not impose any limitation on the relative size of the ellipsoid semiaxes , , and , they can be defined in-plane (when they are flattened with respect to the disc equatorial plane) and off-plane (when they are elongated along the polar axis). Special cases of this model include the oblate axisymmetric ( = ) and prolate axisymmetric ( = ) spheroids. Then, we classify bars in four categories: oblate-triaxial (or axisymmetric) ellipsoids in-plane ( < ) or off-plane ( > and < 1), and prolate-triaxial (or axisymmetric) ellipsoids in-plane ( < and > ) or elongated along the polar axis off-plane (>1). Figure 4 shows the values of the bar intrinsic semiaxis ratios, and , as obtained from the peak of their 2D probability distribution function (yellow star in Fig. 3). However, the final classification for each bar is performed by integrating the 2D PDF of semiaxes ratio within each region of the diagram and finding the region with a higher probability to be occupied by the bar. Different colors in Fig. 4 represent the results of our bar classification. The probabilities for a given bar to have a particular shape are given in Table LABEL:tab:results. We found that 68% and 14% of our bars can be classified as prolate-triaxial (or axisymmetric) in-plane and oblate-triaxial (or axisymmetric) in-plane, respectively. Fig. 5 show the distribution of semiaxis ratios and for our sample of prolate-triaxial in-plane and oblate-triaxial in-plane bars, respectively. Prolate-triaxial bars close to can be considered as axisymmetric prolate spheroids whereas oblate-triaxial bars close to can be considered axisymmetric oblate bars. Therefore, our analysis reveals that most of the bars in the nearby Universe are, to first order, prolate-triaxial (or axisymmetric) in the plane of the disc with different degrees of flattening. In addition, we found that bars span a wide range of both [0.1,1] and [0.1,0.8] values, with median values of 0.31 and 0.34.
We also found a subclass of oblate-triaxial bars off-plane corresponding to 18% of our sample. It is worth noting that our methodology does not impose a given axial ratio trend such as , but they are allowed to be free. This particularity of our approach allowed us, for instance, to detect and quantify the polar bulge of NGC 4698 (Corsini et al., 2012). These galaxies present the largest uncertainties in the semiaxis among the full sample due to the galaxy/bar orientation with respect to the observer. Therefore, their measurements are also compatible with a less exotic configuration in the galactic plane (see NGC 0036 in Fig. 3 for an example). Other interesting cases in our sample are the four bars with a flattened oblate axisymmetric structure, namely UGC 02134, NGC 4185, NGC 5520, and NGC 5602. We speculate that these might be examples of lenses that were photometrically fitted as normal bars.
The intrinsic shape of galactic bars has been rarely constrained observationally. Kormendy (1982) suggested that bars are generally triaxial ellipsoids and used an isophotal analysis to estimate their typical semiaxes ratios to be and , with extreme cases such as and . Aguerri et al. (2001b) used the photometric approach described in Varela (1992) to derive the intrinsic shape of the bar in NGC 5850. They found a best solution with a triaxial ellipsoid with and . More recently, Compère et al. (2014) used a new 3D photometric decomposition approach to derive the intrinsic shape of a sample of six bars in nearby galaxies. Similarly to us, they found that the semiaxis is more difficult to constrain due to projection problems, and that 5 out of 6 bars are compatible with our definition of prolate-triaxial ellipsoids, with the remaining being oblate-triaxial off-plane. They obtain mean values of and in reasonable good agreement with our findings.
The analysis of the projected, or deprojected, values of the observed bar ellipticity are more common in the literature since they are generally associated with the bar strength (Abraham & Merrifield, 2000). Martin (1995) used a 2D deprojection method considering the bar to be infinitesimally thin to derive the deprojected values of the ellipticity. He found that bars cover from with a . A similar result () was recently found by Díaz-García et al. (2016) using a sample of barred galaxies from the S4G survey (Sheth et al., 2010) and the deprojection technique developed by Gadotti et al. (2007). Both results show slightly larger values of than those found in this paper. The uncertainties in the derivation of the deprojected values of the bar axis ratio were estimated using mock galaxies in Zou et al. (2014). They found that considering bars as 2D thin ellipsoids, the deprojected ellipticity of the bar can be recovered within a 10% error.
Our analysis of the intrinsic shape of bars suggests that they are generally prolate-triaxial ellipsoids with an intrinsic flattening (), which corresponds to the typical intrinsic flattening of galactic discs at this range of masses (Sánchez-Janssen et al., 2010; Rodríguez & Padilla, 2013). This is in good agreement with the idea that bars form out of disc material, therefore keeping their vertical shape (Sparke & Sellwood, 1987). However, numerical simulations have shown how buckling instabilities can quickly change this vertical structure producing a thicker boxy/peanut shaped component that sticks out of the disc (Combes & Sanders, 1981; Pfenniger & Friedli, 1991; Debattista et al., 2006). Still, the peanut shape generally does not encompass the full extent of the bar, i.e., there is some flat bar outside the buckled inner part (Lütticke et al., 2000; Athanassoula, 2005; Méndez-Abreu et al., 2008; Erwin & Debattista, 2013), as has also been claimed for the Milky Way (Martinez-Valpuesta & Gerhard, 2011). We discussed extensively the effect of thick B/P structures in the derived shape of our bars in Sect 3 and Appendix B. We found that not accounting for the presence of these structures (as it happens in 43% of our galaxies) produces the net effect of overestimating and . A rough correction assuming all our galaxies host a boxy/peanut would produce median values of 0.27 and 0.30, i.e., still prolate-triaxial ellipsoids with flattening even closer to that of stellar discs.
The results described in this section provide new constraints for future detailed orbital analyses on barred potentials. Historically, 2D analysis used a thin prolate potential to describe the bars (Papayannopoulos & Petrou, 1983; Athanassoula et al., 1983; Kaufmann & Patsis, 2005; Sellwood & Wilkinson, 1993). With the advent of 3D models (somehow promoted by the observational evidence of B/P structures) triaxial potentials with typical axes ratios and , similar to those observationally found by by Kormendy (1982), became common (Pfenniger, 1984; Skokos et al., 2002; Patsis et al., 2003). However, our results suggest that bars generally have larger values of both and . Using 3D -body simulations, Pfenniger & Friedli (1991) found that soon after the bar is formed, it has a thin structure with and , with a later thickening up to and when the evolution seems to have ceased. This result is in good agreement with our findings and suggests that some of the orbital analysis potential might be revisited.
Hydrodynamical simulations have also used triaxial ellipsoids to model the bar potential in 3D. Hunter et al. (1988) found a best model for NGC 3992 with a bar potential with semiaxis ratios and and England (1989) shows that NGC 1300 can be modelled using a potential with a prolate bar with . These results are in agreement with the semiaxis ratios derived for the bars in our sample.
4.2 The relation of the intrinsic shape of bars with galaxy properties
Figure 6 shows the distribution of the bar intrinsic shapes with the Hubble type of the host galaxies obtained from Walcher et al. (2014). We found a slight trend in the fraction of both oblate-triaxial and prolate-triaxial bars with Hubble type. Oblate-triaxial bars represent 40%, 27%, and 34% of S0, Sa-Sb, and Sbc-Sdm galaxies, respectively. On the other hand, the fraction of prolate-triaxial bars is larger in spirals than S0 galaxies with 60%, 73%, and 66% of the bars in S0, Sa-Sb, and Sbc-Sdm galaxies, respectively. Uncertainties were computed using binomial 68% confidence intervals. Figure 6 also shows a slight trend towards bars in S0 galaxies having larger values of and than spirals. After discarding the four oblate axisymmetric bars discussed in the previous section, we found mean values for bars in S0s of = 0.360.07 and = 0.340.07 whereas for bars in spirals bar we derived = 0.300.10 and = 0.280.08.
As suggested in the previous section, the flattening of our bars is similar to that expected for discs of similar masses. The dependence of intrinsic semiaxis ratios with the Hubble type is also supportive of this scenario, adding the fact that bars formed in early-type galaxies (S0) or spirals (Sa-Sdm), which statistically have different intrinsic thickening (Ryden, 2006), also follow the same trend. This result suggests a strong relation between the flattening of the disc and that of the outer thin bar formed out of it.
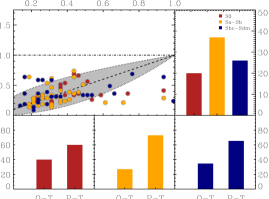
Figure 7 shows the distribution of and for our sample of prolate-triaxial bars as a function of the galaxy stellar mass. A trend is present such as bars in less massive galaxies are intrinsically more flattened (less ) and more elliptical (less ) than in high mass systems. In fact, it seems that high-mass galaxies (10.5) can have large values of both and whereas low-mass galaxies (10.5) are confined to low values of and . The Spearman correlation coefficients and p-values are =0.3 ( = 0.02) and =0.2 (=0.2) for and , respectively. Thus, the correlation with cannot be considered as statistically significative. In Méndez-Abreu et al. (2017) we discussed the relation between Hubble type and galaxy mass for the CALIFA sample, with later types being systematically less massive galaxies. We found a similar, but less strong trend for our limited sample of 83 barred galaxies (S0 10.70.2; Sa-Sb 10.60.3; Sbc-Sdm 10.10.6). Table 1 shows the mean values of the intrinsic flattening of our sample of prolate bars with both stellar mass and Hubble type. The relation with the Hubble type is still present for the low mass bin, but it is not clear for the high mass one. However, the low number statistics makes difficult to extract further conclusions on whether is the mass or the Hubble type driving our correlations.
| S0 | Sa-Sb | Sbc-Sdm | |
|---|---|---|---|
| ; | 0.310.07 | 0.280.12 | 0.290.13 |
| ; | 0.400.09 | 0.290.13 | 0.240.07 |
| ; | 0.370.10 | 0.300.08 | 0.380.20 |
| ; | 0.330.10 | 0.280.08 | 0.360.18 |

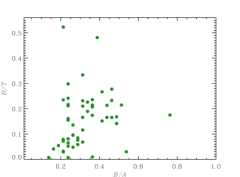
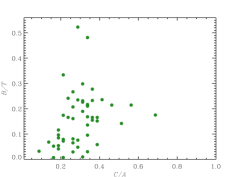
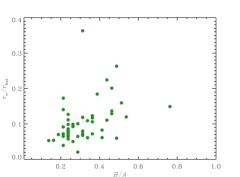
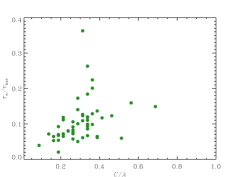
We also look for correlations between the intrinsic shape of our prolate-triaxial bars with the properties of the individual structures shaping our galaxies, i.e., bulges, discs, and the bars themselves. Fig. 8 shows the most significant trends. Regarding the bulge properties, we found that either and correlates with the Sérsic index and ratio. The relation is stronger with the ratio (Fig. 8) where we found a Spearman correlation coefficient =0.35 (=0.009) and =0.41 (=0.002) for and , respectively. These correlations indicate that more prominent (larger ) and more concentrated (larger ) bulges are related with thicker (larger ) and more circular bars (larger ). Despite the fact that we did not find any correlation with the effective radii of the bulges (), we did find a strong correlation when normalised by the bar radius (). Our analysis shows =0.47 (=0.0004) and =0.52 (=8e-5) for the relation between vs. and , respectively (see Fig. 8). Regarding disc parameters, we only found a weak correlation of the bars intrinsic shape with the color of the disc. Fig. 8 shows these results where we find a Spearman coefficient of =0.34 (=0.02) and =0.25 (=0.08) for and , respectively. Therefore, redder discs have thicker and more circular bars (but notice that the relation with is not statistically significant). Finally, we explored the photometric properties of the bars. We found that correlates with all bar parameters: (= -0.46, =0.0003), (= -0.33, =0.01), and ratio (= -0.32, =0.02). On the other hand, did not correlate with any bar parameter. These relations point towards more prominent (larger ), brighter (larger ), and shorter (smaller ) bars being thicker (larger ).
The presence of correlations between the intrinsic shape of the bars and the properties of the different structures composing disc galaxies is not surprising since bars are formed by internal secular mechanisms out of disc material (Hohl, 1971; Kalnajs, 1972; Athanassoula & Misiriotis, 2002), and their evolution is strongly related to the bulge-disc-halo interaction (Weinberg & Katz, 2007; Debattista & Sellwood, 2000; Athanassoula et al., 2013; Long et al., 2014). Some observational studies found that bulges influence the size, strength, and incidence of bars (Laurikainen et al., 2009; Aguerri et al., 2009; Cheung et al., 2013), since bulges contribute significantly to the radial force in discs, bulge masses and sizes can affect bar formation (Hohl, 1976; Efstathiou et al., 1982). However, most of these earlier studies considered the spheroidal component as a halo, not as a bulge, and more recent studies focus mainly in the formation of the bar and not in their properties (Scannapieco & Athanassoula, 2012; Kataria & Das, 2018). Therefore, more numerical simulations focused on the bar properties are needed to understand the dependence of the bar intrinsic shape with the bulge properties that we find in this paper.
4.3 Bars vs bulges: the connection with bulge growth
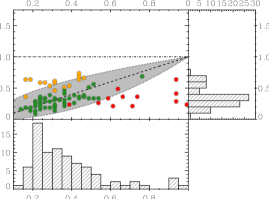
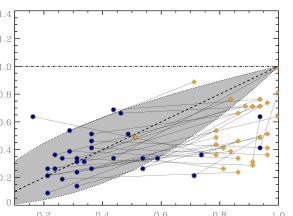
In Costantin et al. (2018) we derived the intrinsic shape of the bulges present in the CALIFA sample of galaxies. We followed a similar methodology as the one used in this paper and we found that, contrary to galactic bars, bulges tend to be nearly oblate systems (66%), with a smaller fraction of prolate spheroids (19%) and triaxial ellipsoids (15%). We also found that those bulges sharing potential with a galactic bar represented the majority of our triaxial bulges (75%). Fig. 9 shows the relation between the intrinsic axial ratios of both bars and bulges for the 31 galaxies in common with Costantin et al. (2018). We can distinguish two main behaviours in this diagram: i) bulges that are thicker than their surrounding bars and ii) bulges that are thinner than the surrounding bar. We computed the differences between the intrinsic flattening of both bulges and bars using the marginal distribution obtained from the PDF for each structure. Since both distributions are independent, for each galaxy we randomly sampled the PDF of the bar and bulge (see Fig. 3 for examples) and computed for every pair of values whether the bulge has a larger or smaller than the bar. We derived that 52% and 13% of our bulges are more vertically prominent than their surrounding bars at 1 and 3 levels, respectively. Similarly, we found that 16% of our bulges are more flattened that their bars at 1 level. In general, those bulges with and close to one, i.e., with a nearly spherical shape, are surrounded by a prolate thinner bar. On the other hand, oblate-triaxial (or axisimmetric) bulges which are flattened in the vertical direction have an intrinsic flattening similar to that of the bar.
The intrinsic shape of bulges has been proposed as a way to distinguish between bulges formed at early stages of the Universe by dissipative processes (classical bulges; Athanassoula, 2005; Brooks & Christensen, 2016) and those formed by secular processes within the galaxy (disc-like bulges Kormendy & Kennicutt, 2004). Recent works by Costantin et al. (2018) and Costantin et al. (in prep.) have shown that oblate-triaxial bulges which are intrinsically flattened in-plane might be considered as disc-like bulges whereas oblate-triaxial non-flattened bulges show properties of classical bulges. The main internal mechanism to form a disc-like bulge is gas flowing inwards to the galaxy center thank to the torque exerted by a bar structure (Pfenniger & Norman, 1990; Friedli & Benz, 1995). This gas then accumulates in the center forming a new rotationally-supported bulge (Kormendy & Kennicutt, 2004; Boone et al., 2007; Wozniak & Michel-Dansac, 2009). We have demonstrated how the intrinsic flattening of the majority of our long bars is strongly related to vertical extension of the host disc, therefore, the results shown in Fig. 9, with 16% of the bulges having lower intrinsic flattening than the corresponding bar (and also similar to the disc) make these bulges the perfect candidates to be disc-like bulges. On the other hand, spherical bulges hosted within thinner bars (and thinner discs) might have been created by different (not internal secular) processes and therefore they could represent a population of classical bulges. The presence of classical bulges, and their coexistence with both disc-like bulges and boxy/peanuts structures, in barred galaxies has been studied in the literature (de Lorenzo-Cáceres et al., 2012; Méndez-Abreu et al., 2014; Erwin et al., 2015). However, their identification generally requires the use of photometric and spectroscopic information. The results of this paper reinforce the idea that the intrinsic shape of bulges provides key information on their classification, specially in barred galaxies where it can be directly compared with that of the bar (similar to that of the disc). Furthermore, the 3D structure of the bulge is derived using only photometric information so it could be applied to larger samples of galaxies.
5 Conclusions
We present the first statistical study on the 3D intrinsic shape of galactic bars in the nearby Universe. We analysed a sample of 83 barred galaxies extracted from the CALIFA-DR3 survey with the galaXYZ code (Méndez-Abreu et al., 2010; Costantin et al., 2018). This method is purely based on photometric information and uses the projected geometric parameters (ellipticities and position angles) of both bars and discs obtained from a careful multi-component photometric decomposition (Méndez-Abreu et al., 2017).
Our analysis consider galactic bars as single triaxial ellipsoidal structures. We discuss that our results are representative of the outer thin bar due to the way photometric decompositions of the galaxies were performed. Using mock galaxy simulations we derive that the possible presence of a vertically thick components in the bar inner regions (boxy/peanut structure) would produce an overestimation of 0.04 in both and intrinsic semiaxes. Our main results on the intrinsic shape of outer thin bars are:
-
•
Bars are mainly prolate-triaxial (or axisymmetric) in-plane ellipsoids (67%), with another 14% of bars characterised as oblate-triaxial (or axisymmetric) in-plane ellipsoids. They have a typical intrinsic intrinsic flattening C/A = 0.34, which matches the intrinsic flattening of galactic discs of similar stellar masses (Sánchez-Janssen et al., 2010).
-
•
The intrinsic flattening of our prolate-triaxial bars is dependent of the galaxy Hubble type and galaxy stellar mass. In our sample, the Hubble type is related to the galaxy mass, but due to low number statistics it is difficult to separate which galaxy property is driving the vertical growth of the outer bar. We also found correlations of the bar flattening with bulge (, ), disc (color ), and bar (, , ) properties, suggesting that bar evolution is tightly related with the structures of the host galaxy.
-
•
We compared the relative flattening of bars and bulges for a subsample of 31 galaxies in common with the sample of Costantin et al. (2018). We found that 52% and 16% of bulges are either more or less vertically extended than their surrounding bar at 1 sigma level, respectively. Assuming that (as we demonstrate in this paper) the intrinsic flattening of bars and discs are similar, we suggest that these percentages might be representative of the fraction of classical and disc-like bulges in our sample.
This paper represents our first attempt to extend our methodology to derive the intrinsic shape of galactic structure in individual galaxies beyond the properties of bulges. The study of the evolution of the intrinsic shape of bars contains important information about both the evolution of these systems and the creation of inner structures, since the axis ratio of the bar has been recognised as an important quantity which drives, for instance, the amount of gas that is driven to the galaxy center by the bar torques (Friedli & Benz, 1993). Further studies on the evolution of the intrinsic shape of bars with both cosmic time and dynamical properties of the galaxies will be presented in forthcoming papers, providing further constraints for numerical simulations.
Acknowledgements
We thank the anonymous referee for her/his many valuable comments which helped to improve this paper. JMA and JALA acknowledge support from the Spanish Ministerio de Economia y Competitividad (MINECO) by the grant AYA2013-43188-P. AdLC acknowledges support from the Spanish Ministry of Economy and Competitiveness (MINECO) grant AYA2011-24728. EMC is supported by Padua University through grants 60A02-5857/13, 60A02-5833/14, 60A02-4434/15, and CPDA133894. This paper is based on data from the Calar Alto Legacy Integral Field Area Survey, CALIFA (http://califa.caha.es), funded by the Spanish Ministery of Science under grant ICTS-2009-10, and the Centro Astronómico Hispano-Alemán.
Based on observations collected at the Centro Astronómico Hispano Alemán (CAHA) at Calar Alto, operated jointly by the Max-Planck Institut für Astronomie and the Instituto de Astrofísica de Andalucía (CSIC).
References
- Abraham & Merrifield (2000) Abraham R. G., Merrifield M. R., 2000, AJ, 120, 2835
- Aguerri et al. (2001a) Aguerri J. A. L., Balcells M., Peletier R. F., 2001a, A&A, 367, 428
- Aguerri et al. (2001b) Aguerri J. A. L., Hunter J. H., Prieto M., Varela A. M., Gottesman S. T., Muñoz-Tuñón C., 2001b, A&A, 373, 786
- Aguerri et al. (2009) Aguerri J. A. L., Méndez-Abreu J., Corsini E. M., 2009, A&A, 495, 491
- Athanassoula (1992) Athanassoula E., 1992, MNRAS, 259, 328
- Athanassoula (2003) Athanassoula E., 2003, MNRAS, 341, 1179
- Athanassoula (2005) Athanassoula E., 2005, MNRAS, 358, 1477
- Athanassoula & Misiriotis (2002) Athanassoula E., Misiriotis A., 2002, MNRAS, 330, 35
- Athanassoula et al. (1983) Athanassoula E., Bienayme O., Martinet L., Pfenniger D., 1983, A&A, 127, 349
- Athanassoula et al. (2013) Athanassoula E., Machado R. E. G., Rodionov S. A., 2013, MNRAS, 429, 1949
- Athanassoula et al. (2015) Athanassoula E., Laurikainen E., Salo H., Bosma A., 2015, MNRAS, 454, 3843
- Barazza et al. (2008) Barazza F. D., Jogee S., Marinova I., 2008, ApJ, 675, 1194
- Barazza et al. (2009) Barazza F. D., et al., 2009, A&A, 497, 713
- Boone et al. (2007) Boone F., et al., 2007, A&A, 471, 113
- Brooks & Christensen (2016) Brooks A., Christensen C., 2016, Galactic Bulges, 418, 317
- Buta et al. (2003) Buta R. J., Byrd G. G., Freeman T., 2003, AJ, 125, 634
- Cheung et al. (2013) Cheung E., et al., 2013, ApJ, 779, 162
- Ciambur & Graham (2016) Ciambur B. C., Graham A. W., 2016, MNRAS, 459, 1276
- Combes & Sanders (1981) Combes F., Sanders R. H., 1981, A&A, 96, 164
- Combes et al. (1990) Combes F., Debbasch F., Friedli D., Pfenniger D., 1990, A&A, 233, 82
- Compère et al. (2014) Compère P., López-Corredoira M., Garzón F., 2014, A&A, 571, A98
- Consolandi (2016) Consolandi G., 2016, A&A, 595, A67
- Contopoulos & Papayannopoulos (1980) Contopoulos G., Papayannopoulos T., 1980, A&A, 92, 33
- Corsini et al. (2012) Corsini E. M., Méndez-Abreu J., Pastorello N., Dalla Bontà E., Morelli L., Beifiori A., Pizzella A., Bertola F., 2012, MNRAS, 423, L79
- Costantin et al. (2018) Costantin L., Méndez-Abreu J., Corsini E. M., Eliche-Moral M. C., Tapia T., Morelli L., Dalla Bontà E., Pizzella A., 2018, A&A, 609, A132
- Debattista & Sellwood (1998) Debattista V. P., Sellwood J. A., 1998, ApJ, 493, L5
- Debattista & Sellwood (2000) Debattista V. P., Sellwood J. A., 2000, ApJ, 543, 704
- Debattista & Shen (2007) Debattista V. P., Shen J., 2007, ApJ, 654, L127
- Debattista et al. (2006) Debattista V. P., Mayer L., Carollo C. M., Moore B., Wadsley J., Quinn T., 2006, ApJ, 645, 209
- Díaz-García et al. (2016) Díaz-García S., Salo H., Laurikainen E., Herrera-Endoqui M., 2016, A&A, 587, A160
- Efstathiou et al. (1982) Efstathiou G., Lake G., Negroponte J., 1982, MNRAS, 199, 1069
- England (1989) England M. N., 1989, ApJ, 344, 669
- Erwin (2004) Erwin P., 2004, A&A, 415, 941
- Erwin (2017) Erwin P., 2017, preprint, (arXiv:1711.04867)
- Erwin & Debattista (2013) Erwin P., Debattista V. P., 2013, MNRAS, 431, 3060
- Erwin & Debattista (2017) Erwin P., Debattista V. P., 2017, MNRAS, 468, 2058
- Erwin et al. (2015) Erwin P., et al., 2015, MNRAS, 446, 4039
- Franx et al. (1991) Franx M., Illingworth G., de Zeeuw T., 1991, ApJ, 383, 112
- Friedli & Benz (1993) Friedli D., Benz W., 1993, A&A, 268, 65
- Friedli & Benz (1995) Friedli D., Benz W., 1995, A&A, 301, 649
- Gadotti et al. (2007) Gadotti D. A., Athanassoula E., Carrasco L., Bosma A., de Souza R. E., Recillas E., 2007, MNRAS, 381, 943
- Hohl (1971) Hohl F., 1971, ApJ, 168, 343
- Hohl (1976) Hohl F., 1976, AJ, 81, 30
- Hunter et al. (1988) Hunter Jr. J. H., England M. N., Gottesman S. T., Ball R., Huntley J. M., 1988, ApJ, 324, 721
- Kalnajs (1972) Kalnajs A. J., 1972, ApJ, 175, 63
- Kataria & Das (2018) Kataria S. K., Das M., 2018, MNRAS, 475, 1653
- Kaufmann & Patsis (2005) Kaufmann D. E., Patsis P. A., 2005, ApJ, 624, 693
- Kormendy (1982) Kormendy J., 1982, Morphology and dynamics of galaxies; Proceedings of the Twelfth Advanced Course, Saas-Fee, Switzerland, March 29-April 3, 1982 (A84-15502 04-90). Sauverny, Switzerland, Observatoire de Geneve, 1983, p. 113-288., 12, 113
- Kormendy & Kennicutt (2004) Kormendy J., Kennicutt Jr. R. C., 2004, ARA&A, 42, 603
- Kruk et al. (2017) Kruk S. J., et al., 2017, MNRAS, 469, 3363
- Laurikainen & Salo (2016) Laurikainen E., Salo H., 2016, in Laurikainen E., Peletier R., Gadotti D., eds, Astrophysics and Space Science Library Vol. 418, Galactic Bulges. p. 77, doi:10.1007/978-3-319-19378-6_4
- Laurikainen & Salo (2017) Laurikainen E., Salo H., 2017, A&A, 598, A10
- Laurikainen et al. (2009) Laurikainen E., Salo H., Buta R., Knapen J. H., 2009, ApJ, 692, L34
- Laurikainen et al. (2011) Laurikainen E., Salo H., Buta R., Knapen J. H., 2011, MNRAS, 418, 1452
- Laurikainen et al. (2013) Laurikainen E., Salo H., Athanassoula E., Bosma A., Buta R., Janz J., 2013, MNRAS, 430, 3489
- Li et al. (2017) Li Z.-Y., Ho L. C., Barth A. J., 2017, ApJ, 845, 87
- Long et al. (2014) Long S., Shlosman I., Heller C., 2014, ApJ, 783, L18
- Lütticke et al. (2000) Lütticke R., Dettmar R.-J., Pohlen M., 2000, A&AS, 145, 405
- Marinova & Jogee (2007) Marinova I., Jogee S., 2007, ApJ, 659, 1176
- Martin (1995) Martin P., 1995, AJ, 109, 2428
- Martinez-Valpuesta & Gerhard (2011) Martinez-Valpuesta I., Gerhard O., 2011, ApJ, 734, L20
- Martinez-Valpuesta et al. (2006) Martinez-Valpuesta I., Shlosman I., Heller C., 2006, ApJ, 637, 214
- Martinez-Valpuesta et al. (2017) Martinez-Valpuesta I., Aguerri J. A. L., González-García A. C., Dalla Vecchia C., Stringer M., 2017, MNRAS, 464, 1502
- Masters et al. (2011) Masters K. L., et al., 2011, MNRAS, 411, 2026
- Méndez-Abreu et al. (2008) Méndez-Abreu J., Corsini E. M., Debattista V. P., De Rijcke S., Aguerri J. A. L., Pizzella A., 2008, ApJ, 679, L73
- Méndez-Abreu et al. (2010) Méndez-Abreu J., Simonneau E., Aguerri J. A. L., Corsini E. M., 2010, A&A, 521, A71+
- Méndez-Abreu et al. (2012) Méndez-Abreu J., Sánchez-Janssen R., Aguerri J. A. L., Corsini E. M., Zarattini S., 2012, ApJ, 761, L6
- Méndez-Abreu et al. (2014) Méndez-Abreu J., Debattista V. P., Corsini E. M., Aguerri J. A. L., 2014, A&A, 572, A25
- Méndez-Abreu et al. (2017) Méndez-Abreu J., et al., 2017, A&A, 598, A32
- Muñoz-Tuñón et al. (2004) Muñoz-Tuñón C., Caon N., Aguerri J. A. L., 2004, AJ, 127, 58
- Nair & Abraham (2010) Nair P. B., Abraham R. G., 2010, ApJ, 714, L260
- Papayannopoulos & Petrou (1983) Papayannopoulos T., Petrou M., 1983, A&A, 119, 21
- Patsis et al. (2003) Patsis P. A., Skokos C., Athanassoula E., 2003, MNRAS, 342, 69
- Pfenniger (1984) Pfenniger D., 1984, A&A, 134, 373
- Pfenniger & Friedli (1991) Pfenniger D., Friedli D., 1991, A&A, 252, 75
- Pfenniger & Norman (1990) Pfenniger D., Norman C., 1990, ApJ, 363, 391
- Raha et al. (1991) Raha N., Sellwood J. A., James R. A., Kahn F. D., 1991, Nature, 352, 411
- Rodríguez & Padilla (2013) Rodríguez S., Padilla N. D., 2013, MNRAS, 434, 2153
- Ryden (2006) Ryden B. S., 2006, ApJ, 641, 773
- Sánchez-Janssen et al. (2010) Sánchez-Janssen R., Méndez-Abreu J., Aguerri J. A. L., 2010, MNRAS, 406, L65
- Sánchez et al. (2016) Sánchez S. F., et al., 2016, A&A, 594, A36
- Scannapieco & Athanassoula (2012) Scannapieco C., Athanassoula E., 2012, MNRAS, 425, L10
- Sellwood & Debattista (2006) Sellwood J. A., Debattista V. P., 2006, ApJ, 639, 868
- Sellwood & Wilkinson (1993) Sellwood J. A., Wilkinson A., 1993, Reports on Progress in Physics, 56, 173
- Sheth et al. (2005) Sheth K., Vogel S. N., Regan M. W., Thornley M. D., Teuben P. J., 2005, ApJ, 632, 217
- Sheth et al. (2010) Sheth K., et al., 2010, PASP, 122, 1397
- Shlosman et al. (1990) Shlosman I., Begelman M. C., Frank J., 1990, Nature, 345, 679
- Skibba et al. (2012) Skibba R. A., et al., 2012, MNRAS, 423, 1485
- Skokos et al. (2002) Skokos C., Patsis P. A., Athanassoula E., 2002, MNRAS, 333, 847
- Sparke & Sellwood (1987) Sparke L. S., Sellwood J. A., 1987, MNRAS, 225, 653
- Varela (1992) Varela A. M., 1992, PhD thesis, PhD thesis, Instituto de Astrofísica de Canarias , (1992)
- Walcher et al. (2014) Walcher C. J., et al., 2014, A&A, 569, A1
- Weinberg & Katz (2007) Weinberg M. D., Katz N., 2007, MNRAS, 375, 425
- Wozniak & Michel-Dansac (2009) Wozniak H., Michel-Dansac L., 2009, A&A, 494, 11
- Yoshino & Yamauchi (2015) Yoshino A., Yamauchi C., 2015, MNRAS, 446, 3749
- Zou et al. (2014) Zou Y., Shen J., Li Z.-Y., 2014, ApJ, 791, 11
- de Lorenzo-Cáceres et al. (2012) de Lorenzo-Cáceres A., Vazdekis A., Aguerri J. A. L., Corsini E. M., Debattista V. P., 2012, MNRAS, 420, 1092
- de Lorenzo-Cáceres et al. (2013) de Lorenzo-Cáceres A., Falcón-Barroso J., Vazdekis A., 2013, MNRAS, 431, 2397
Appendix A Structural parameters of the galaxy sample
| Galaxy | Redshift | log() | HT | (disc) | P(pro. o) | P(pro. i) | P(obl. o) | P(obl. i) | V. class | |||||||||
|---|---|---|---|---|---|---|---|---|---|---|---|---|---|---|---|---|---|---|
| (1) | (2) | (3) | (4) | (5) | (6) | (7) | (8) | (9) | (10) | (11) | (12) | (13) | (14) | (15) | (16) | (17) | (18) | (19) |
| UGC00036 | 0.0206 | 10.764 | Sab | 0.78 | 19.1 | 1.52 | 0.54 | 0.470.01 | 0.6680.007 | 17.90.7 | 133.30.4 | 0.44 | 0.64 | 0.01 | 0.44 | 0.55 | 0.00 | Barlens? |
| NGC0036 | 0.0197 | 10.746 | Sb | 0.69 | 20.2 | 4.93 | 2.46 | 0.570.01 | 0.4650.007 | 16.70.7 | 124.10.4 | 0.31 | 0.62 | 0.07 | 0.26 | 0.66 | 0.01 | Barlens |
| NGC0165 | 0.0192 | 10.482 | Sb | 0.60 | 20.3 | 0.74 | 0.78 | 0.810.01 | 0.2950.007 | 83.30.7 | 62.60.4 | 0.29 | 0.29 | 0.00 | 0.66 | 0.27 | 0.07 | Barlens? |
| NGC0180 | 0.0172 | 10.597 | Sb | 0.59 | 20.2 | 1.09 | 0.67 | 0.6820.007 | 0.2270.006 | 165.80.3 | 141.90.2 | 0.24 | 0.16 | 0.00 | 0.82 | 0.10 | 0.08 | Barlens |
| NGC0214 | 0.0148 | 10.467 | Sbc | 0.60 | 19.0 | 1.10 | 0.56 | 0.7050.007 | 0.5640.006 | 57.40.3 | 60.10.2 | 0.64 | 0.49 | 0.00 | 0.27 | 0.09 | 0.64 | None |
| NGC0364 | 0.0166 | 10.647 | E7 | 0.83 | 19.9 | 1.55 | 0.58 | 0.730.01 | 0.5480.007 | 33.30.7 | 91.90.4 | 0.44 | 0.69 | 0.19 | 0.32 | 0.46 | 0.03 | Barlens |
| NGC0447 | 0.0183 | 10.901 | Sa | 0.76 | 21.2 | 2.37 | 1.25 | 0.8580.007 | 0.2700.006 | 28.20.3 | 17.50.2 | 0.24 | 0.34 | 0.00 | 0.66 | 0.30 | 0.04 | Barlens |
| IC1683 | 0.0159 | 10.461 | Sb | 0.72 | 20.8 | 1.68 | 0.53 | 0.590.01 | 0.5090.007 | 13.50.7 | 157.00.4 | 0.41 | 0.39 | 0.00 | 0.66 | 0.22 | 0.12 | None |
| NGC0551 | 0.0170 | 10.528 | Sbc | 0.68 | 19.5 | 1.07 | 0.43 | 0.440.01 | 0.1940.007 | 135.90.7 | 160.20.4 | 0.21 | 0.09 | 0.00 | 0.83 | 0.02 | 0.15 | None |
| NGC0570 | 0.0178 | 10.879 | Sb | 0.75 | 20.4 | 1.86 | 1.00 | 0.900.01 | 0.3350.007 | 138.00.7 | 94.00.4 | 0.29 | 0.54 | 0.02 | 0.29 | 0.68 | 0.02 | Barlens |
| UGC01271 | 0.0164 | 10.532 | S0a | 1.06 | 20.0 | 1.73 | 0.68 | 0.630.01 | 0.4270.007 | 93.90.7 | 52.10.4 | 0.34 | 0.31 | 0.00 | 0.68 | 0.26 | 0.06 | Barlens |
| NGC0716 | 0.0147 | 10.555 | Sb | 0.69 | 18.9 | — | — | 0.480.01 | 0.4690.006 | 621.0 | 13.20.5 | 0.26 | 0.34 | 0.00 | 0.75 | 0.22 | 0.03 | None |
| NGC0776 | 0.0159 | 10.597 | Sb | 0.74 | 20.3 | 1.36 | 0.59 | 0.900.01 | 0.3490.007 | 146.40.7 | 130.90.4 | 0.31 | 0.46 | 0.00 | 0.43 | 0.53 | 0.04 | None |
| NGC0842 | 0.0124 | 10.460 | S0 | 0.73 | 19.8 | 2.60 | 0.57 | 0.5250.004 | 0.5400.003 | 145.10.3 | 155.60.2 | 0.74 | 0.36 | 0.00 | 0.28 | 0.04 | 0.68 | None |
| UGC01918 | 0.0165 | 10.551 | Sb | 0.76 | 20.2 | 1.14 | 0.31 | 0.450.01 | 0.620.02 | 117.30.9 | 13.70.8 | 0.44 | 0.74 | 0.27 | 0.25 | 0.48 | 0.00 | None |
| NGC0976 | 0.0139 | 10.774 | Sbc | 0.70 | 19.1 | 1.83 | 0.77 | 0.7860.007 | 0.7770.006 | 159.60.3 | 10.60.2 | 0.76 | 0.69 | 0.19 | 0.31 | 0.18 | 0.31 | None |
| UGC02134 | 0.0149 | 10.479 | Sb | 0.74 | 19.7 | 2.61 | 0.93 | 0.4410.009 | 0.4700.007 | 105.50.5 | 103.90.4 | 0.94 | 0.29 | 0.00 | 0.04 | 0.00 | 0.96 | BP? |
| NGC1093 | 0.0172 | 10.392 | Sbc | 0.62 | 20.0 | 2.07 | 1.70 | 0.670.01 | 0.4480.007 | 96.50.7 | 116.50.4 | 0.49 | 0.34 | 0.00 | 0.59 | 0.14 | 0.27 | Barlens |
| UGC02403 | 0.0133 | 10.422 | Sb | 0.86 | 20.7 | 1.04 | 0.62 | 0.460.01 | 0.2860.007 | 148.40.7 | 140.80.4 | 0.39 | 0.24 | 0.00 | 0.36 | 0.01 | 0.63 | None |
| NGC1645 | 0.0160 | 10.673 | S0a | 0.12 | 19.6 | 0.95 | 0.60 | 0.480.01 | 0.6180.007 | 86.50.7 | 22.90.4 | 0.39 | 0.54 | 0.00 | 0.47 | 0.52 | 0.01 | Barlens |
| NGC1666 | 0.0090 | 10.496 | S0a | 0.74 | 19.7 | 1.94 | 0.31 | 0.8790.004 | 0.3890.003 | 147.50.3 | 141.50.2 | 0.36 | 0.46 | 0.00 | 0.47 | 0.46 | 0.08 | None |
| NGC1667 | 0.0149 | 10.620 | Sbc | 0.72 | 18.4 | 1.48 | 0.29 | 0.6870.007 | 0.4830.006 | 172.10.3 | 11.80.2 | 0.54 | 0.34 | 0.00 | 0.51 | 0.17 | 0.32 | None |
| UGC03253 | 0.0145 | 10.390 | Sb | 0.66 | 19.7 | 1.02 | 0.42 | 0.600.01 | 0.2950.007 | 78.40.7 | 35.80.4 | 0.21 | 0.21 | 0.00 | 0.80 | 0.15 | 0.05 | Barlens |
| UGC03995 | 0.0164 | 10.773 | Sb | 0.67 | 20.0 | 2.03 | 0.67 | 0.5260.007 | 0.3130.006 | 93.60.3 | 119.60.2 | 0.31 | 0.19 | 0.00 | 0.78 | 0.05 | 0.17 | Barlens |
| NGC2486 | 0.0161 | 10.483 | Sab | 0.24 | 20.7 | 2.06 | 0.55 | 0.5910.009 | 0.4250.007 | 90.70.5 | 49.80.4 | 0.31 | 0.34 | 0.00 | 0.72 | 0.21 | 0.06 | Barlens |
| UGC04145 | 0.0161 | 10.548 | Sa | 0.70 | 20.3 | 1.09 | 0.42 | 0.500.01 | 0.4180.007 | 138.20.7 | 130.40.4 | 0.71 | 0.21 | 0.00 | 0.25 | 0.02 | 0.73 | None |
| UGC04195 | 0.0170 | 10.186 | Sb | 0.51 | 20.4 | 1.23 | 0.53 | 0.5900.009 | 0.2590.007 | 13.20.5 | 151.00.4 | 0.19 | 0.19 | 0.00 | 0.83 | 0.13 | 0.04 | Barlens |
| NGC2530 | 0.0174 | 9.988 | Sd | 0.30 | 20.6 | 1.86 | 1.03 | 0.840.01 | 0.330.01 | 156.30.7 | 38.90.4 | 0.26 | 0.59 | 0.10 | 0.24 | 0.65 | 0.01 | None |
| NGC2543 | 0.0091 | 10.036 | Sbc | 0.61 | 20.1 | 1.39 | 0.38 | 0.5830.007 | 0.3480.006 | 46.00.3 | 91.80.2 | 0.24 | 0.26 | 0.00 | 0.77 | 0.18 | 0.04 | Barlens? |
| UGC04308 | 0.0127 | 10.081 | Sc | 0.31 | 20.5 | 3.40 | 0.57 | 0.7400.009 | 0.1900.007 | 126.60.5 | 96.80.4 | 0.16 | 0.19 | 0.00 | 0.84 | 0.12 | 0.03 | None |
| NGC2553 | 0.0165 | 10.665 | Sb | 0.79 | 20.2 | 1.66 | 0.72 | 0.590.01 | 0.5110.007 | 59.50.7 | 11.30.4 | 0.36 | 0.41 | 0.00 | 0.61 | 0.34 | 0.04 | Barlens |
| NGC2558 | 0.0174 | 10.722 | Sb | 0.66 | 20.1 | 1.61 | 0.65 | 0.670.01 | 0.4290.007 | 157.40.7 | 167.80.4 | 0.46 | 0.39 | 0.00 | 0.49 | 0.10 | 0.41 | None |
| NGC2565 | 0.0127 | 10.605 | Sb | 0.63 | 19.5 | 1.49 | 0.46 | 0.5010.007 | 0.3860.006 | 166.30.3 | 176.80.2 | 0.61 | 0.21 | 0.00 | 0.35 | 0.03 | 0.62 | BP? |
| NGC2880 | 0.0066 | 10.308 | E7 | 0.72 | 19.9 | 2.86 | 1.06 | 0.5710.003 | 0.5410.003 | 143.20.1 | 81.50.1 | 0.36 | 0.51 | 0.00 | 0.43 | 0.55 | 0.02 | None |
| NGC3300 | 0.0117 | 10.475 | S0a | 0.77 | 19.1 | 1.25 | 0.40 | 0.5510.007 | 0.4200.006 | 174.60.3 | 43.70.2 | 0.26 | 0.34 | 0.00 | 0.71 | 0.25 | 0.04 | Barlens |
| NGC3811 | 0.0119 | 10.321 | Sbc | 0.57 | 19.4 | 0.73 | 0.29 | 0.6680.007 | 0.5700.006 | 12.90.3 | 30.30.2 | 0.66 | 0.36 | 0.00 | 0.42 | 0.14 | 0.45 | None |
| NGC4003 | 0.0235 | 10.946 | S0a | 0.75 | 20.8 | 1.44 | 1.51 | 0.700.01 | 0.2710.007 | 175.40.7 | 143.60.4 | 0.24 | 0.24 | 0.00 | 0.78 | 0.15 | 0.08 | Barlens |
| NGC4185 | 0.0148 | 10.427 | Sbc | -0.43 | 20.2 | 1.01 | 0.66 | 0.6660.004 | 0.7960.003 | 166.90.3 | 172.10.2 | 0.94 | 0.64 | 0.00 | 0.09 | 0.04 | 0.88 | None |
| NGC4210 | 0.0105 | 10.153 | Sb | 0.49 | 19.9 | 0.82 | 0.32 | 0.7310.004 | 0.2740.003 | 94.090.3 | 47.40.23 | 0.21 | 0.26 | 0.00 | 0.68 | 0.29 | 0.03 | Barlens |
| NGC5157 | 0.0263 | 11.021 | Sab | 0.68 | 20.2 | 1.21 | 1.61 | 0.780.01 | 0.3200.007 | 105.70.7 | 144.10.4 | 0.26 | 0.34 | 0.00 | 0.61 | 0.35 | 0.04 | None |
| NGC5205 | 0.0075 | 9.8618 | Sbc | 0.53 | 19.6 | 0.86 | 0.28 | 0.630.01 | 0.3350.007 | 152.60.7 | 104.70.4 | 0.24 | 0.26 | 0.00 | 0.72 | 0.24 | 0.03 | BP |
| UGC08781 | 0.0274 | 10.871 | Sb | 0.63 | 20.2 | 2.13 | 0.99 | 0.600.01 | 0.2740.007 | 165.90.7 | 172.60.4 | 0.36 | 0.21 | 0.00 | 0.62 | 0.04 | 0.34 | None |
| NGC5378 | 0.0121 | 10.140 | Sb | 0.17 | 20.9 | 2.51 | 0.82 | 0.740.03 | 0.310.03 | 802.3 | 40.01.7 | 0.24 | 0.34 | 0.00 | 0.67 | 0.29 | 0.04 | Barlens |
| NGC5406 | 0.0192 | 11.017 | Sb | 0.40 | 19.9 | 1.30 | 0.63 | 0.7710.004 | 0.2930.003 | 120.00.3 | 53.50.3 | 0.19 | 0.64 | 0.00 | 0.27 | 0.73 | 0.01 | None |
| NGC5520 | 0.0081 | 9.7922 | Sbc | 0.44 | 19.5 | — | — | 0.560.01 | 0.5310.006 | 651.0 | 65.30.5 | 1.00 | 0.24 | 0.00 | 0.02 | 0.00 | 0.98 | None |
| NGC5519 | 0.0271 | 10.660 | Sb | 0.49 | 20.3 | 3.24 | 2.12 | 0.710.02 | 0.460.02 | 75.90.9 | 105.90.8 | 0.44 | 0.36 | 0.00 | 0.58 | 0.26 | 0.16 | None |
| IC0994 | 0.0269 | 11.072 | S0a | 0.80 | 19.8 | 2.16 | 0.87 | 0.510.01 | 0.4810.007 | 14.60.7 | 29.20.4 | 0.59 | 0.34 | 0.00 | 0.41 | 0.05 | 0.54 | None |
| NGC5602 | 0.0092 | 10.322 | S0a | 4.92 | 20.8 | 2.39 | 0.46 | 0.520.03 | 0.590.03 | 1672.3 | 165.11.7 | 0.94 | 0.41 | 0.00 | 0.05 | 0.01 | 0.94 | None |
| UGC09291 | 0.0116 | 9.6661 | Scd | 0.44 | 20.4 | 1.06 | 0.41 | 0.5140.009 | 0.3190.007 | 107.20.5 | 73.00.4 | 0.24 | 0.21 | 0.00 | 0.82 | 0.08 | 0.10 | None |
| NGC5735 | 0.0145 | 10.127 | Sbc | 0.45 | 20.3 | 1.20 | 0.42 | 0.900.01 | 0.2230.007 | 32.60.7 | 94.90.4 | 0.16 | 0.64 | 0.02 | 0.19 | 0.79 | 0.00 | None |
| UGC09492 | 0.0299 | 11.082 | Sab | 0.78 | 20.1 | 1.58 | 1.37 | 0.450.01 | 0.4200.007 | 54.20.7 | 80.80.4 | 0.36 | 0.26 | 0.00 | 0.77 | 0.06 | 0.17 | Barlens? |
| IC4534 | 0.0185 | 10.723 | S0a | 0.48 | 20.0 | 2.10 | 0.85 | 0.5640.009 | 0.2930.007 | 162.90.5 | 179.10.4 | 0.31 | 0.24 | 0.00 | 0.68 | 0.04 | 0.28 | BP |
| NGC5876 | 0.0126 | 10.678 | S0a | 0.69 | 20.6 | 1.57 | 0.72 | 0.4330.004 | 0.4830.003 | 52.40.3 | 179.40.2 | 0.24 | 0.31 | 0.00 | 0.76 | 0.22 | 0.02 | Barlens |
| NGC5888 | 0.0308 | 11.135 | Sb | 0.61 | 19.8 | 1.40 | 1.06 | 0.5960.009 | 0.2430.007 | 153.20.5 | 170.50.4 | 0.31 | 0.14 | 0.00 | 0.75 | 0.05 | 0.20 | BP |
| NGC6154 | 0.0216 | 10.744 | Sab | 0.64 | 20.5 | 2.32 | 1.15 | 0.790.01 | 0.2500.007 | 135.90.7 | 135.40.4 | 0.24 | 0.26 | 0.00 | 0.79 | 0.14 | 0.08 | Barlens? |
| NGC6278 | 0.0111 | 10.719 | S0a | 0.69 | 20.0 | 2.31 | 0.64 | 0.5300.004 | 0.3790.003 | 126.80.3 | 116.00.2 | 0.54 | 0.26 | 0.00 | 0.42 | 0.03 | 0.55 | None |
| NGC6497 | 0.0217 | 10.865 | Sab | 0.58 | 20.1 | 3.33 | 1.11 | 0.4950.009 | 0.3920.007 | 111.20.5 | 160.80.4 | 0.21 | 0.29 | 0.00 | 0.79 | 0.18 | 0.03 | Barlens |
| UGC11228 | 0.0206 | 10.867 | S0 | 0.81 | 20.3 | 2.50 | 1.14 | 0.670.01 | 0.2860.007 | 176.20.7 | 157.50.4 | 0.31 | 0.21 | 0.00 | 0.77 | 0.08 | 0.14 | None |
| NGC6941 | 0.0216 | 10.885 | Sb | 0.66 | 20.2 | 1.76 | 0.85 | 0.720.01 | 0.2480.007 | 130.50.7 | 109.10.4 | 0.26 | 0.19 | 0.00 | 0.79 | 0.12 | 0.09 | BP? |
| NGC6945 | 0.0136 | 10.946 | S0 | 0.74 | 19.9 | 3.74 | 1.09 | 0.6490.007 | 0.5070.006 | 120.20.3 | 86.70.2 | 0.46 | 0.36 | 0.00 | 0.60 | 0.24 | 0.16 | Barlens? |
| NGC7321 | 0.0238 | 10.691 | Sbc | 0.59 | 19.3 | 1.79 | 0.53 | 0.650.01 | 0.4120.007 | 22.20.7 | 71.70.4 | 0.29 | 0.39 | 0.00 | 0.60 | 0.36 | 0.04 | Barlens |
| NGC7563 | 0.0139 | 10.720 | Sa | 0.71 | 21.5 | 2.47 | 1.21 | 0.5130.009 | 0.3920.007 | 151.50.5 | 91.90.4 | 0.21 | 0.29 | 0.00 | 0.66 | 0.33 | 0.01 | Barlens |
| NGC7591 | 0.0164 | 10.610 | Sbc | 0.68 | 20.3 | 2.30 | 2.00 | 0.480.01 | 0.4840.007 | 148.40.7 | 10.50.4 | 0.31 | 0.31 | 0.00 | 0.78 | 0.17 | 0.05 | None |
| NGC7611 | 0.0109 | 10.721 | S0 | 0.84 | 18.8 | 1.66 | 0.28 | 0.4870.007 | 0.7110.006 | 137.00.3 | 1.70.2 | 0.51 | 0.56 | 0.00 | 0.63 | 0.33 | 0.04 | None |
| NGC7623 | 0.0125 | 10.565 | S0 | 0.90 | 20.6 | 1.90 | 1.02 | 0.7190.009 | 0.4000.007 | 7.00.5 | 161.10.4 | 0.39 | 0.34 | 0.00 | 0.64 | 0.21 | 0.15 | None |
| NGC7671 | 0.0137 | 10.655 | S0 | 0.88 | 18.8 | 1.76 | 0.48 | 0.5960.004 | 0.6170.003 | 135.10.3 | 24.00.2 | 0.46 | 0.66 | 0.31 | 0.26 | 0.41 | 0.01 | None |
| NGC7691 | 0.0134 | 10.176 | Sbc | 0.52 | 20.5 | 1.38 | 0.56 | 0.780.01 | 0.3610.007 | 160.00.7 | 2.70.4 | 0.36 | 0.31 | 0.00 | 0.62 | 0.27 | 0.11 | None |
| NGC7716 | 0.0087 | 10.289 | Sb | 0.52 | 19.7 | 2.87 | 0.31 | 0.8220.008 | 0.5140.002 | 39.40.4 | 15.70.2 | 0.49 | 0.51 | 0.00 | 0.45 | 0.39 | 0.16 | None |
| UGC04455 | 0.0310 | 10.878 | Sb | -0.20 | 20.3 | 0.97 | 0.81 | 0.740.03 | 0.230.03 | 112.3 | 1651.7 | 0.21 | 0.21 | 0.00 | 0.80 | 0.14 | 0.06 | Barlens? |
| UGC05187 | 0.0049 | 8.7767 | Sdm | 0.05 | 20.6 | — | — | 0.8250.008 | 0.3920.008 | 133.81.6 | 79.90.7 | 0.31 | 0.59 | 0.01 | 0.32 | 0.65 | 0.02 | None |
| UGC05377 | 0.0071 | 8.8268 | Sdm | 0.39 | 21.1 | — | — | 0.8350.008 | 0.3210.006 | 77.61.5 | 135.10.7 | 0.24 | 0.59 | 0.00 | 0.32 | 0.67 | 0.01 | None |
| UGC07129 | 0.0040 | 9.2663 | Sab | -0.06 | 19.6 | — | — | 0.640.01 | 0.1640.006 | 731.0 | 61.60.5 | 0.19 | 0.14 | 0.00 | 0.82 | 0.04 | 0.14 | None |
| NGC0495 | 0.0135 | 10.902 | Sab | -0.81 | 19.8 | 1.58 | 0.67 | 0.730.01 | 0.3450.007 | 10.40.7 | 10.50.4 | 0.41 | 0.26 | 0.00 | 0.63 | 0.13 | 0.23 | None |
| KUG1349+143 | 0.0247 | 10.076 | Sbc | -0.05 | 20.9 | 1.65 | 0.26 | 0.630.03 | 0.230.04 | 962.3 | 961.3 | 0.29 | 0.19 | 0.00 | 0.71 | 0.04 | 0.24 | None |
| IC1078 | 0.0287 | 10.645 | Sb | 0.08 | 20.7 | 1.92 | 0.60 | 0.820.02 | 0.270.02 | 99.50.9 | 100.10.8 | 0.26 | 0.29 | 0.00 | 0.72 | 0.21 | 0.07 | None |
| NGC0515 | 0.0170 | 11.038 | E7 | -0.25 | 19.9 | 1.77 | 0.54 | 0.770.01 | 0.4660.007 | 103.90.7 | 131.90.4 | 0.46 | 0.36 | 0.00 | 0.54 | 0.32 | 0.15 | Barlens? |
| NGC2780 | 0.0068 | 9.5927 | Sbc | -0.17 | 20.2 | 0.56 | 0.16 | 0.7210.009 | 0.1660.007 | 143.70.5 | 113.90.4 | 0.14 | 0.16 | 0.00 | 0.85 | 0.10 | 0.05 | None |
| UGC06517 | 0.0084 | 9.3464 | Sc | 0.16 | 19.5 | — | — | 0.600.01 | 0.2870.008 | 34.41.5 | 105.60.8 | 0.16 | 0.36 | 0.00 | 0.39 | 0.61 | 0.00 | None |
| UGC12250 | 0.0240 | 11.106 | Sbc | 0.22 | 20.7 | 1.15 | 0.71 | 0.6260.009 | 0.3200.007 | 12.70.5 | 13.30.4 | 0.34 | 0.31 | 0.00 | 0.55 | 0.05 | 0.40 | None |
| NGC5947 | 0.0198 | 10.559 | Sbc | 0.39 | 20.6 | 2.71 | 0.61 | 0.8110.009 | 0.2940.007 | 63.70.5 | 25.70.4 | 0.24 | 0.36 | 0.00 | 0.59 | 0.38 | 0.04 | Barlens |
| UGC03552 | 0.0160 | 10.067 | Sd | 0.46 | 20.3 | — | — | 0.460.01 | 0.4750.008 | 78.31.5 | 96.30.8 | 0.51 | 0.34 | 0.00 | 0.57 | 0.05 | 0.38 | None |
| NGC3323 | 0.0173 | 9.8078 | Scd | 0.39 | 19.3 | — | — | 0.4950.008 | 0.1610.006 | 157.11.5 | 163.90.7 | 0.21 | 0.14 | 0.00 | 0.63 | 0.01 | 0.36 | None |
| NGC2767 | 0.0165 | 10.750 | S0 | 0.83 | 18.9 | 1.22 | 0.33 | 0.7330.009 | 0.4170.007 | 169.60.5 | 150.70.4 | 0.44 | 0.34 | 0.00 | 0.59 | 0.19 | 0.22 | None |
| Note. (1) Galaxy name; (2), (3), and (4) redshift, galaxy stellar mass, and galaxy Hubble type from Walcher et al. (2014); (5), (6) integrated disc color and central surface brightness of the disc; (7) and (8) Sérsic index and effective radius (in kpc) of the bulge; (9) and (10) apparent axial ratios of the disc and the bar, (11) and (12) position angle of the disc and the bar, (13) and (14) most probable intrinsic axial ratios and of the bar, the 1 probability values for each case are also shown; (15), (16), (17) and (18) probability for a given bar to prolate off-plane (pro. o), prolate in-plane (pro. i) , oblate off-plane (obl. o), and oblate in-plane (obl. i), respectively; (19) visual classification to detect inner boxy/peanuts structures (see text for an explanation of the different classes). Columns (5, 6, 7, 8, 9, 10, 11, 12) are from (Méndez-Abreu et al., 2017). |
Appendix B Influence of boxy/peanut structures in the photometric decomposition of bars
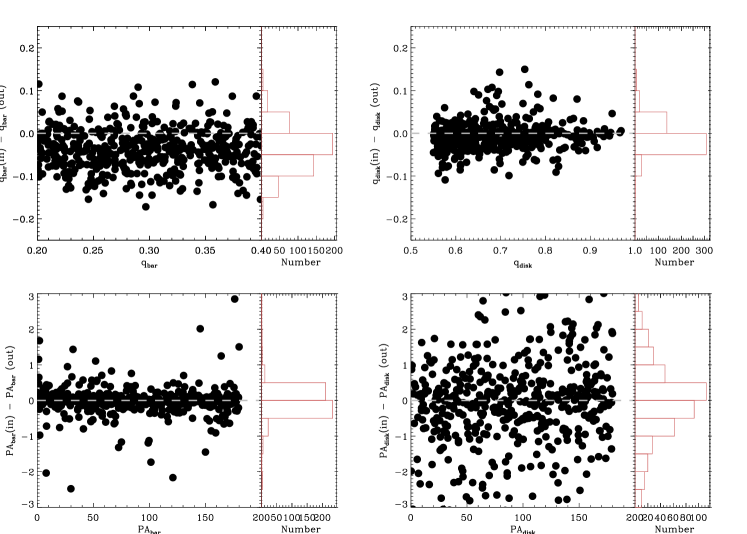
We devised a set of galaxy image simulations to derive the influence of a boxy/peanut inner component in the geometric parameters of the bars obtained from our photometric decomposition. To this aim, we used a similar approach to that described in Sect. 5.2 of Méndez-Abreu et al. (2017). We generated 500 mock galaxies composed by a bulge (described using a Sérsic distribution), a disc (exponential), an outer bar (Ferrers), and an inner boxy/peanut structure modelled with another Ferrers profile. We considered the inner boxy/peanut structure to be the same structure as the barlenses described in Laurikainen et al. (2011, 2013). The use of either a Ferrers or Sérsic profile to describe the barlens surface brigthness distribution was mentioned by Athanassoula et al. (2015) as giving similar results. We opted for a Ferrers profile since it was more directly comparable with the available observational constraints for barlenses, in particular to create a model with given ratios between the length of the outer and inner regions of the bar. The range of values used to build the bulge, disc, and bar components were taken from Méndez-Abreu et al. (2017), including = [0.55,1] and . They are representative of the structural parameters in the band for barred galaxies present in the CALIFA survey. The values of the Ferrers profile used to describe the barlens structure were extracted from Athanassoula et al. (2015) and Laurikainen & Salo (2017). We used random values between the following ranges: , , , PAbl=PAbar.
The mock galaxies were analysed as if they were pure barred galaxies without any inner boxy/peanut component, i.e., only a bulge, a disc, and the outer parts of the bar were considered to model the galaxy light. This allowed us to quantify the effect of the boxy/peanut surface brightness distribution on the photometric decomposition of our barred galaxies, in particular, the effect of the ellipticities and position angles. Fig. 10 shows the differences in the four structural parameters involved in our analysis (, , PAbar, PAdisc) due to the addition of a barlens structure in the galaxy centre. We compute the mean (systematic) and rms (statistical) errors between the input and output values of the mock galaxies obtaining that: (in) - (out) = -0.037 0.048, (in) - (out) = -0.007 0.031 , PAbar (in) - PAbar (out) = -0.03 0.51, PAdisc (in) - PAdisc (out) = 0.14 2.25. Despite the fact that the statistical errors are always larger than any possible systematic, we found a weak bias of the bar axis ratio towards larger values when including the barlens component. This can be expected if part of the barlens surface brightness, which is always rounder than the outer bar, is incoporated into the bar component.
At this point, we study how the previous errors in the observational measurements propagate into the derived intrinsic shape of bulges. We used both the systematic and statistical errors to understand their effect into the intrinsic and semiaxis ratios. First, we recomputed the bar intrinsic shape (using the methodology described in Sect. 3) correcting for the mean deviations (systematic) in the observational parameters obtained previosuly. This will provide us with the typical difference in the and values assuming that all galaxies host a barlens structure. Second, we recomputed the typical uncertainty in the bar intrinsic shape by assuming the photometric errors in the observational parameters to be the statistical errors computed using the barlens simulations. This help us to quantify how the uncertainties in the intrinsic and semiaxes are affected by the presence of a barlens structure. Fig. 11 show the results of this analysis. We found that, if a galaxy have a barlens structure that has not been included in the photometric decomposition procedure, both and would be systematically overestimated by 0.04 and 0.04, respectively. Similarly, the uncertainties in the intrinsic shape derived by our method (Sect. 3) would be understimated by 0.05 and 0.03 in and , respectively. Therefore, even if the results presented in this paper are not affected by the possible presence of an inner boxy/peanut structure (characterised here as a barlens), small variations can be found.