Collimation, acceleration and recollimation shock in the jet of gamma-ray emitting radio-loud narrow-line Seyfert 1 galaxy 1H 0323+342
Abstract
We investigated the detailed radio structure of the jet of 1H 0323+342 using high-resolution multi-frequency Very Long Baseline Array observations. This source is known as the nearest -ray emitting radio-loud narrow line Seyfert 1 (NLS1) galaxy. We discovered that the morphology of the inner jet is well characterized by a parabolic shape, indicating the jet being continuously collimated near the jet base. On the other hand, we found that the jet expands more rapidly at larger scales, resulting in a conical-like shape. The location of the “collimation break” is coincident with a bright quasi-stationary feature at 7 mas from core (corresponding to a deprojected distance of the order of 100 pc), where the jet width locally contracts together with highly polarized signals, suggesting a recollimation shock. We found that the collimation region is coincident with the region where the jet speed gradually accelerates, suggesting the coexistence of the jet acceleration and collimation zone, ending up with the recollimation shock, which could be a potential site of high-energy -ray flares detected by the -LAT. Remarkably, these observational features of the 1H 0323+342 jet are overall very similar to those of the nearby radio galaxy M87 and HST-1 as well as some blazars, suggesting that a common jet formation mechanism might be at work. Based on the similarity of the jet profile between the two sources, we also briefly discuss the mass of the central black hole of 1H 0323+342, which is also still highly controversial on this source and NLS1s in general.
1 Introduction
Narrow-line Seyfert 1 (NLS1) galaxies are a subclass of active galactic nuclei (AGN) that is defined by its optical properties, i.e., narrow permitted lines FWHM ( km s-1), [O III]/H, and a bump due to Fe II emission lines (Osterbrock & Pogge, 1985). Based on these peculiar optical characteristics along with the large soft X-ray excess (e.g., Boller et al., 1996), NLS1s are suggested to have small black hole masses () and high accretion rates (close to or above the Eddington limit), making this population a possible candidate for studying the physics of rapidly evolving supermassive black holes (SMBHs).
In recent years, this class of objects attracts a great deal of attention in the high-energy astrophysical community; the discovery of -ray emission by the satellite from some radio-loud NLS1s suggested the presence of a possible third class of AGN with relativistic jets, in addition to blazars and radio galaxies (Abdo et al., 2009a, b). The -ray emission from NLS1s is surprising and poses a challenge to our current understanding of jet formation, since NLS1s are generally thought to be hosted by spiral galaxies, which are not expected to produce high-power jets. To date, -ray emission has been detected in a dozen of radio-loud NLS1s (D’Ammando et al., 2016; Paliya et al., 2018), and the ejection of superluminal features is detected in a few of them (D’Ammando et al., 2013; Lister et al., 2016). This further confirms that relativistic jets constitute an essential channel of energy release at least in these active NLS1 nuclei.
Some pioneering VLBI studies on radio-loud NLS1s (Doi et al., 2006, 2007, 2011; Giroletti et al., 2011; Foschini et al., 2011; Orienti et al., 2012, 2015; Lister et al., 2016) revealed that the pc-scale morphologies of radio-loud NLS1s are reminiscent of blazars, i.e., consisting of a bright compact core and one-sided jet. This implies that similar processes may be at work in producing -rays between blazars and -ray detected NLS1s, such as the Doppler boosting effect with small jet viewing angles. However, due to the lack of sufficient VLBI studies so far, detailed pc-scale structures of the NLS1s jets are still poorly understood. Direct constraints on the innermost jet properties from VLBI are complementary to what can be inferred from radio-to--ray broadband SED modeling (Abdo et al., 2009b; Foschini et al., 2011; D’Ammando et al., 2012, 2013, 2015a, 2015b, 2016). Moreover, dedicated high-resolution studies of NLS1 jets may help understand the mechanisms of relativistic jet launching, collimation and acceleration in a possible distinct (, ) domain from blazars/radio galaxies which have been intensively investigated (e.g., Marscher et al., 2008; Asada & Nakamura, 2012; Hada et al., 2013; Nagai et al., 2014; Boccardi et al., 2016; Gómez et al., 2016; Mertens et al., 2016; Nakahara et al., 2018; Giovannini et al., 2018).
In this paper we focus on a famous NLS1 galaxy 1H 0323+342. This source is known as the nearest (a redshift of 0.063) -ray detected NLS1 (Abdo et al., 2009b), and is one of the few NLS1s where the host galaxy is imaged (Zhao et al., 2007) along with FBQS J1644+2619 (D’Ammando et al., 2017) and PKS 2004–447 (Kotilainen et al., 2017). Thus 1H 0323+342 is a unique target that allows us to probe the vicinity of the central engine at the highest linear resolution among -ray active NLS1s (i.e., 1 mas = 1.2 pc). The pc-scale structure of the source was first examined by Wajima et al. (2014) with the Japanese VLBI Network and the Very-Long-Baseline-Array (VLBA) at 2, 8 and 15 GHz, revealing a blazar-like one-sided core-jet structure toward the southeast direction. Kinematic properties of the pc-scale jet were investigated by several authors (Wajima et al., 2014; Fuhrmann et al., 2016; Lister et al., 2016; Doi et al., 2018). The latter three papers reported highly superluminal features up to 9 . In addition, Wajima et al. (2014), Fuhrmann et al. (2016) and Doi et al. (2018) found one or two quasi-stationary features at parsec scales that might be associated with standing shocks. Detailed radio-to--ray broadband properties of the source are studied by Paliya et al. (2014), Yao et al. (2015) and Kynoch et al. (2018). Regarding the mass of the central BH, several independent measurements suggest (Zhao et al., 2007; Yao et al., 2015; Landt et al., 2017; Wang et al., 2016), although this is still under active debate and some authors suggest a much larger black hole mass (a few times of ; León Tavares et al., 2014).
In this paper, we report the result from our multi-frequency VLBA observation of 1H 0323+342, which aims to better understand the pc-to-subpc-scale structures of this jet. In the next section we describe our observation and data reduction. In Sections 3 and 4, our results are presented and discussed. In the final section we will summarize the paper. Throughout the paper we adopt cosmological parameters km s-1 Mpc-1, and . This corresponds to 1 mas = 1.2 pc at = 0.063. Spectral index is defined as .
2 Observations and Data Reduction
We observed 1H 0323+342 with VLBA on January 2nd 2016. The observations were made at nine frequencies of 1.4/1.7 GHz (L-band), 2.3/8.4 GHz (S/X bands), 5 GHz (C-band), 12/15 GHz (U-band), 24 GHz (K-band) and 43 GHz (Q-band) in a 11-hr continuous run. The receiver at each frequency band was alternated in turn every 10–30 minutes. The observation involved rapid switching between the target and the nearby radio source 0329+3510 (separated by 1.36 deg on the sky) to allow phase-referencing and relative astrometry between the two sources. Some short scans on the bright source 3C 84 were also inserted as a fringe finder and bandpass calibrator. The observation was made in dual (left/right-hand circular) polarization mode. The received signals were sampled with 2-bit quantization and recorded at an aggregate rate of 2 Gbps (a total bandwidth of 512 MHz) using the digital-down-converter-4 (DDC-4) wideband recording mode. The down-converted signals were divided into four 64 MHz sub-bands in each polarization.
The initial data calibration was performed using the National Radio Astronomy Observatory Astronomical Image Processing System (AIPS) based on the standard VLBI data reduction procedures. The amplitude calibration was made with opacity corrections using the measured system noise temperature and the elevation-gain curve of each antenna. We next performed a priori corrections for the visibility phases; antenna parallactic angle differences between 1H 0323+342 and 0329+3510, ionospheric dispersive delays using the ionospheric model provided by the Jet Propulsion Laboratory, and instrumental delays/phases using a scan of 3C 84 were corrected. Then, to create images of these sources, we performed a fringe-fitting on each source separately and removed residual delays, rates, and phases assuming a point source model. Images were created in the DIFMAP software (Shepherd, 1997) with iterative phase/amplitude self-calibration.
In this paper, we primarily focus total-intensity results. Our dedicated multi-frequency polarimetric study based on these data will be presented in a forthcoming paper.
| Frequency | Beam size | ||
| (GHz) | (masmas, deg.) | (mJy/bm) | (mJy/bm) |
| (a) | (b) | (c) | |
| 1.44 | 9.92 5.69, | 135 | 0.085 |
| 1.70 | 8.58 4.84, | 124 | 0.134 |
| 2.32 | 6.80 3.61, | 146 | 0.193 |
| 5.00 | 3.09 1.64, | 155 | 0.056 |
| 8.68 | 1.78 0.94, | 177 | 0.141 |
| 12.5 | 1.14 0.64, | 277 | 0.118 |
| 15.5 | 0.96 0.53, | 283 | 0.144 |
| 23.9 | 0.61 0.32, | 280 | 0.224 |
| 43.3 | 0.36 0.18, | 242 | 0.318 |
Notes: (a) synthesized beam with naturally-weighted scheme: (b) peak intensity of self-calibrated images of 1H 0323+342 under naturally-weighting scheme: (c) rms image noise level of 1H 0323+342 images under naturally-weighting scheme.
3 Results
3.1 Multi-frequency images
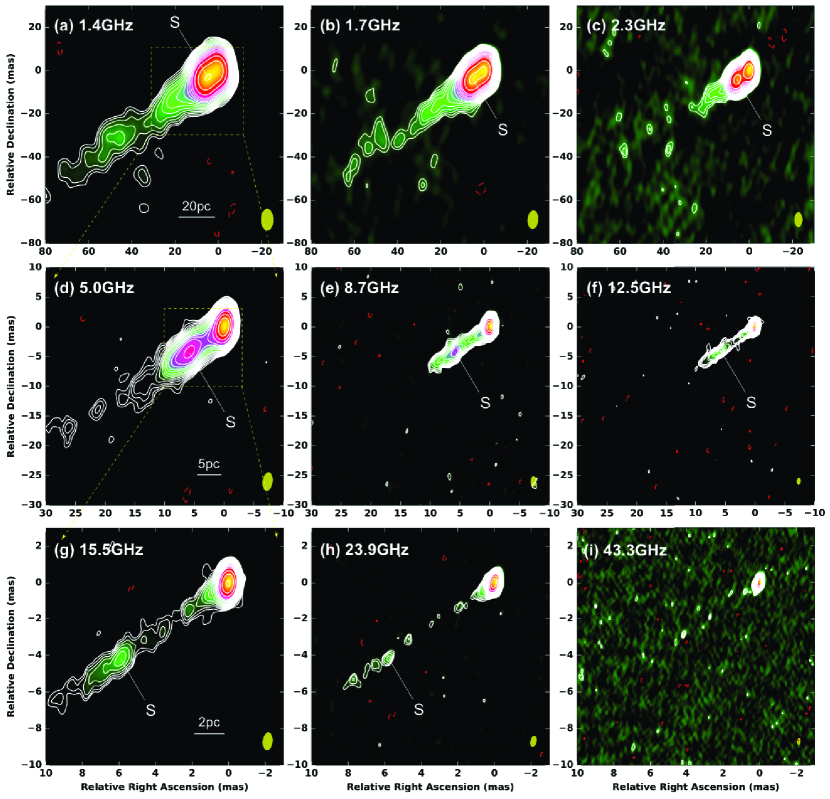
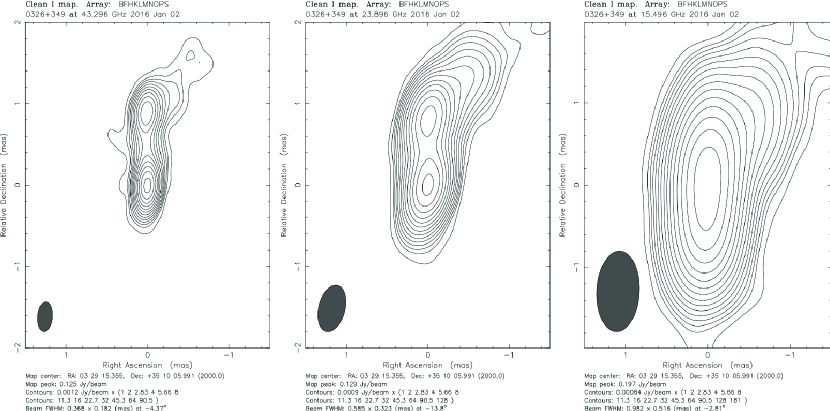
In Figure 1 we show VLBA images of 1H 0323+342 obtained at the nine frequencies. At all the frequencies a core-jet structure is seen and the one-sided jet is elongated toward the south-east direction (P.A. 125 deg). The overall jet morphology at 8/12/15 GHz is very similar to the previous VLBA 8/15 GHz images presented by Wajima et al. (2014), Fuhrmann et al. (2016) and Doi et al. (2018). Wajima et al. (2014) and Doi et al. (2018) reported a quasi-stationary bright feature at 7 mas downstream of the core. The corresponding feature consistently exists also in our 8/12/15 GHz images, indicating that the feature is still present after more than 5–10 years. In the present paper we call this feature as “S”.
At low frequencies the feature S is more prominent, becoming the brightest component in the 1.4 GHz image. The low frequency images also reveal the downstream jet emission extending 60-80 mas from the core. In contrast, the source structure at 24 and 43 GHz becomes more compact and mostly core-dominated.
We stress that this is the first VLBI result on 1H 0323+342 up to 43 GHz where the highest resolution and transparency to the jet base is attained. To quantify the innermost radio core at 43 GHz, we fit the calibrated visibility data with an elliptical Gaussian model using the DIFMAP task modelfit. Our best-fit result is summarized in Table 2. By using these values and the equation (1) in Wajima et al. (2014), the brightness temperature of the 43 GHz core is estimated to be K. The value is very similar to those reported by Wajima et al. (2014) at low frequencies.
Note that Wajima et al. (2014) and Fuhrmann et al. (2016) reported another quasi-stationary feature around 0.3-0.5 mas from the core in their multi-epoch 8/15 GHz images. Here we searched for the corresponding feature in our images at 8/12/15/24/43 GHz. However, the jet intensity profile around 0.3-0.5 mas was more or less smooth in our images and we did not find such a feature clearly.
| PA | |||
| (as) | (as) | (deg.) | (mJy) |
| (a) | (b) | (c) | (d) |
Notes: (a) major axis FWHM size of the derived elliptical Gaussian; (b) minor axis FWHM size of the derived elliptical Gaussian; (c) position angles of the major axes of the Gaussian model; (d) total flux densities of the Gaussian models; (e) combined visibility data over the two epochs. For (a), (b) and (c), a practical uncertainty of each parameter was estimated by comparing the difference of the derived results between modelfit in Difmap and JMFIT in AIPS. For (d), we adopt 10% uncertainty based on the typical amplitude calibration accuracy.
3.2 Jet width profile
Measuring the profile of jet width as a function of radial distance provides important clues to the formation and collimation mechanisms of a relativistic jet, as demonstrated in recent VLBI studies on nearby radio galaxies (Asada & Nakamura, 2012; Hada et al., 2013; Nakamura & Asada, 2013; Hada et al., 2016; Boccardi et al., 2016; Tseng et al., 2016; Nakahara et al., 2018; Giovannini et al., 2018). Our multi-frequency images on 1H 0323+342 allow us to examine on this jet in detail.
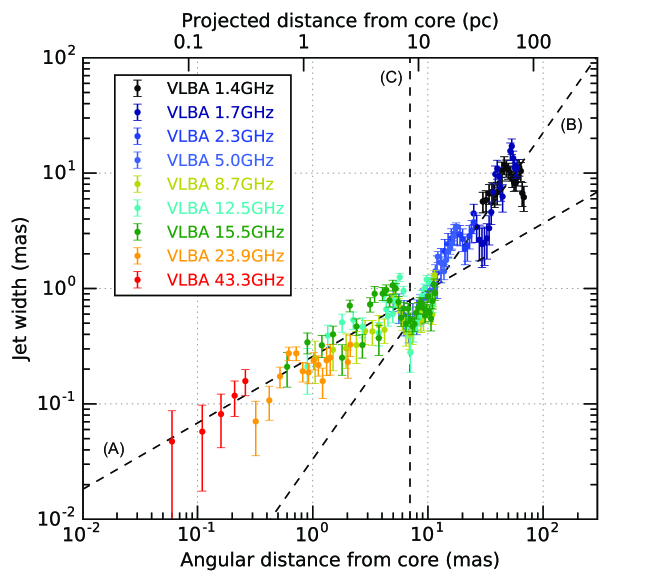
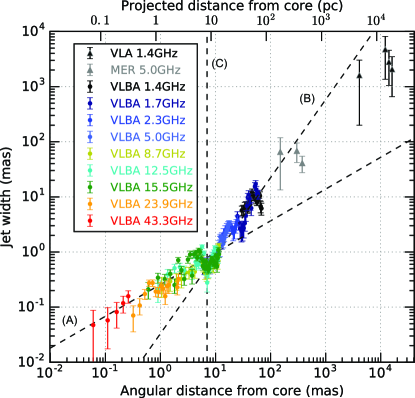
We basically followed the methodology in our previous studies on M87 (Hada et al., 2013, 2016). We made transverse slices of the 1H 0323+342 jet every 1/2–1/3 of the beam size along the jet and each slice was fit with a single Gaussian function (because the jet is single-ridged at all distances in our VLBA images111Note that Doi et al. (2018) has recently revealed a limb-brightened jet profile around S based on a detailed image analysis of VLBA archival data. This does not affect the result of our jet-width measurement presented here.). We then defined the jet width at each as a deconvolved size of the fitted Gaussian where and are FWHM of the fitted Gaussian and the projected beam size perpendicular to the jet, respectively. The result is summarized in Figure 2, where the measured jet width profile is plotted as a function of projected (angular) distance from the innermost (43 GHz) core. Thanks to the wide-frequency coverage, we could measure the jet width profile over 3 orders of magnitude in distance from mas to 80 mas.
Figure 2 revealed some very interesting features on the structure of this jet. The jet shows a clear change in the collimation slope between mas and mas. We then fit a power-law function to the inner jet data () and the outer jet data () separately (where and are free parameters). We found that the inner jet region within 7 mas is well described by a parabolic shape with , indicating the jet being continuously collimated over these distances. On the other hand, beyond 7 mas the jet starts to expand more rapidly with , suggesting a conical or hyperbolic expansion. This parabolic-to-conical/hyperbolic transition occurs exactly at 7 mas from the core, where the bright stationary component S is located. The jet width at 7 mas (on the stationary component) is locally shrinking by a factor of 2. The local contraction at S has recently been reported by Doi et al. (2018) based on MOJAVE 15 GHz data, and the present result further confirms this feature. All of the findings reported here are robust thanks to the sufficient number of dataset and consistency at different frequencies. It is notable that the observed jet collimation profile looks very similar to that seen in the nearby radio galaxy M87 and HST-1 (Asada & Nakamura, 2012). We will discuss the comparison between M87 and 1H 0323+342 in Section 4.
3.3 Core-shift
Our multi-frequency VLBA data also enable us to examine the core-shift (e.g., Lobanov, 1998; Hada et al., 2011) of 1H 0323+342. We investigated the core-shift of the source in the following way. Between 24 and 43 GHz, the core-shift of the target was measured with respect to the calibrator 0329+3510222In this case, the core-shift from the calibrator may affect the measurement of the core-shift of the target, but we confirmed that the calibrator’s core-shift between 24 and 43 GHz is negligible (see Appendix for details) by using the phase-referenced images of 0329+3510. On the other hand, between 1.4 and 24 GHz, the complex structure of the calibrator prevented us from reliable core-shift measurements (see Appendix). Instead, we performed a ’self-referencing’ method at these frequencies because 1H 0323+342 shows a well-defined optically-thin feature S at 7 mas from the core. We thus measured the core-shift between 1.4 and 24 GHz by assuming that the feature S has no frequency-dependent position shifts.
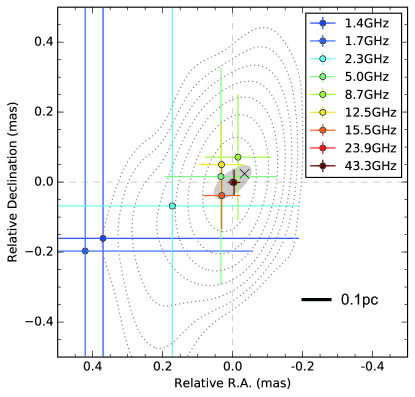
The result of our core-shift measurement is shown in Figure 3. The origin of this plot is set to be the core position at 24 GHz, at which core-shift measurements could be made with respect to all the other frequencies. The position errors for each data are one-tenth of the beam size, which is rather conservative. Interestingly, the measured core positions between 5.0 and 43 GHz were concentrated within the central 100 as area and we did not find any clear trend of core-shift among these frequencies. At 2.3 GHz and the lower frequencies, Figure 3 implies a possible trend of core-shift in the direction of the jet, but the position uncertainties of the low-frequency cores are quite large due to the poor angular resolution and the severe blending between the core and neighboring jet emission. Therefore, we conclude that the core-shift of 1H 0323+342 is very small: as between 5.0 and 43 GHz and as between 1.4 and 43 GHz.
Given that the radio core shows an optically-thick spectrum (see Section 3.4), the small core-shift suggests the jet having a small viewing angle toward our line-of-sight. This is consistent with the detection of highly superluminal components up to 9 (Lister et al., 2016) which constrains 12 deg. An even smaller viewing angle 4 deg is suggested if the time scales of radio variability are additionally considered (Fuhrmann et al., 2016).
The small core-shift and viewing angle implies that the angular separation of the central BH with respect to the radio core is rather short. Such a separation can be measured if the frequency dependence of the core-shift is accurately determined (Hada et al., 2011), while the accuracy of our core-shift measurements on 1H 0323+342 is inadequate to use this method. Instead, we can reasonably deduce the BH position by taking advantage of the observed parabolic profile of the inner jet. Assuming that the parabolic shape continues all the way down to the BH and the jet width converges to zero at the BH position, we again fit the inner jet within using the following equation (instead of ):
| (1) |
where the additional free parameter is the angular distance of the BH position from the 43 GHz core. We obtained a very similar parabolic profile together with as. As visualized in Figure 3, the derived BH position (as shown by a cross symbol) is within the ellipse of the 43 GHz core. Thus the parabolic jet shape consistently suggests a small viewing angle of this jet. For deg, the deprojected distance between the 43 GHz core and the BH position is estimated to be (0.24–0.71) pc. Note that might be an upper limit of the BH-core distance if the (parabolic) jet has a non-zero width at the BH position.
3.4 Spectra
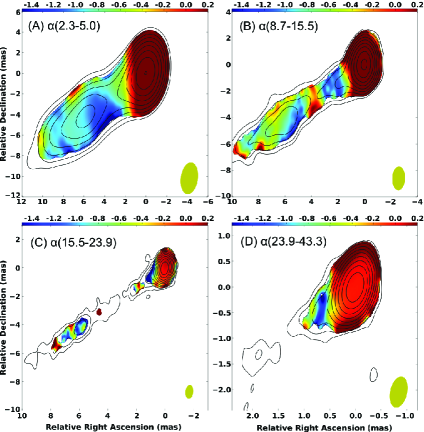
In Figure 4, we show maps of spectral index distribution of 1H 0323+342 for various frequency pairs. To create an accurate spectral index map for each frequency pair, map positions at the two frequencies were adjusted by using the astrometric results in Section 3.3. Also in Figure 4, we used the same uv range and pixel sampling for each frequency pair. Then the two maps were convolved with a synthesized beam at the lower frequency.
As seen in Figure 4, the core regions generally show flat-to-inverted (i.e., optically-thick) spectra, while the extended jet regions show steep (optically-thin) spectra, which is consistent with typical characteristics of blazar jets. Some previous studies suggest that radio spectra of NLS1 jets are similar to those in young radio galaxies (e.g., Gallo et al., 2006; Berton et al., 2016b), whose spectral turnover occurs around 1–10 GHz. However, our result indicates that the radio spectra of the 1H 0323+342 core remain flat even at 43 GHz.
Regarding the extended jet, there is a possible trend that the spectra on and right down the quasi-stationary feature S are slightly flatter than those in the upstream side of S. Although the uncertainties are still large, this might indicate re-energization of nonthermal electrons via shock in the feature S.
4 Discussion
4.1 Jet Collimation Break at the Recollimation Shock
Structural transition of jet profile has recently been discovered in some nearby radio galaxies (M87; Asada & Nakamura (2012), NGC 6251; Tseng et al. (2016), 3C 273; Akiyama et al. (2018), NGC 4261; Nakahara et al. (2018)). This has triggered active discussion about the mechanisms of jet formation and collimation. Our result presented here is the first example where such a structural transition was discovered in the jet of a NLS1 galaxy.
To check the jet collimation profile beyond the VLBI scales, we additionally analyzed a few archival data of 1H 0323+342 obtained by connected radio interferometers. We found one VLA data at 1.4 GHz (Project ID AM601, obtained in 1998 with the B configuration and an on-source time of 15 minutes) and another data with MERLIN at 5 GHz (obtained in 2006 with an on-source time of 5 minutes). At the large scales, the main jet can continuously be seen up to 10–20 arcsec from the core, while the overall source morphology shows a hint of the counter jet (see also Antón et al., 2008)333A more detailed study on the kpc-scale structure of this jet will be presented in a forthcoming paper (Doi et al. in preparation). In Figure 5 we show an extended plot of the jet width profile (for the main jet) including the VLA/MERLIN measurements. Beyond 100 mas from the core, the deviation from the inner jet parabola is more evident, and the jet width becomes a factor of 10 wider than that expected from the parabolic profile.444There is a possibility that the jet viewing angle is different between pc and kpc scales since the position angle of the kpc-scale jet is 90 deg (Antón et al., 2008) while the pc-scale jet is 125 deg. This might affect the deprojected distance of jet. However, the jet position angle at the MERLIN scales is still very similar to that in the VLBA scales, so the jet profile between VLBA and MERLIN scales should be compared in the same viewing angle. If we fit the width profile of the outer jet ( mas) together with the VLBA/MERLIN/VLA data, a best-fit slope results in , approaching a conical shape.
The observed jet width profile strongly suggests that the structural transition from parabolic to hyperbolic/conical originates in the quasi-stationary feature S. This situation is remarkably similar to the case of the jet in M87 (Asada & Nakamura, 2012), where its parabolic to conical transition occurs at the bright quasi-stationary (and possibly -ray emitting) knot HST-1 located at 120 pc from the nucleus. For HST-1, its cross section seems to be slightly smaller than that expected from the parabolic profile. This leads to an argument that HST-1 represents a recollimation shock at the end of the collimation zone (Cheung et al., 2007; Asada & Nakamura, 2012).
For 1H 0323+342, the local contraction of jet width at the transition site is more evident than HST-1. This feature was first reported by Doi et al. (2018) and the present multi-frequency study further confirmed this. While in M87 there is still no clear evidence for the “recollimation zone” between the parabolic region and HST-1, in 1H 0323+342 we can clearly see the recollimation zone just upstream of S (6-7 mas), connecting the whole sequence of parabolic zone, recollimation zone, shock and expansion. The rebrightening of jet intensity with a possible spectral flattening at S indicates the re-energization of jet particles via shock compression. Interestingly, the deprojected distance of the feature S is 40-120 pc (for deg), which is similar to that of HST-1 in pc unit. Moreover, S seems to be caused by the passage of highly superluminal components (Doi et al., 2018, see also Section 4.2), and this kind of event is repeatedly seen also in HST-1 (Biretta et al., 1999; Cheung et al., 2007; Giroletti et al., 2012; Hada et al., 2015). We therefore suggest that the feature S in 1H 0323+342 is analogous to HST-1 in M87, and might be a potential site of -ray emission (see Section 4.3).
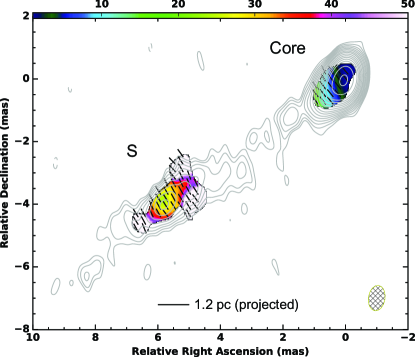
We further checked one recent VLBA polarization map taken by the MOJAVE 15 GHz program to search for any polarimetric feature associated with S (Figure 6). Interestingly, the jet exhibits strongly polarized emission exactly on S, where the values of fractional polarization reach as high as 30%, indicating the presence of highly ordered magnetic fields. This is in agreement with S being a shocked compressed feature. Note that the apparent electric-vector-polarization angles (EVPA) in both the core and S are perpendicular to the jet, but the EVPA shown are not rotation-measure (RM)-corrected ones, preventing us from discussing the intrinsic geometry of the -fields associated with the jet. A recent optical polarimetry study on this source suggests the optical EVPA being parallel to the jet axis (Itoh et al., 2014), implying the -field direction (associated with the optical emission) being perpendicular to the jet. Thus a future dedicated VLBI polarimetric study including RM measurements would be useful to better understand the -field properties associated with S.
We also note that the presence of a recollimation shock at some distances from the radio core is also suggested in some other blazars and blazar-like radio galaxies such as 3C 120 (Agudo et al., 2012), 3C 111 (Beuchert et al., 2018) and CTA 102 (Fromm et al., 2011, 2013). In particular, the latter two sources show peculiar time evolution in radio spectra (CTA 102) or in polarized emission (3C 111) when superluminal components pass through a standing component, interpreted as the interaction of moving shocks with a recollimation shock. Application of a similar multi-epoch analysis to 1H 0323+342 would help confirm the recollimation shock scenario of S and its similarity to blazars.
4.2 Coexistence of Jet Collimation and Acceleration
One of the longstanding central questions regarding relativistic jets is the physical link between collimation and acceleration of the flow. This is vital to understand the ultimate mechanisms of jet formation (e.g., McKinney, 2006; Komissarov et al., 2009) and also the origin/location of -ray emission (e.g., Marscher et al., 2008). In recent years this topic has extensively been examined for the M87 jet (Nakamura & Asada, 2013; Asada et al., 2014; Mertens et al., 2016; Hada et al., 2017), and these studies are beginning to uncover the physical link and coexistence of the acceleration and collimation zone (ACZ) in this jet, which is in agreement with magnetic collimation and acceleration models (e.g., Nakamura et al., 2018). However, hitherto very few observational evidence of ACZ is obtained for other sources.
For 1H 0323+342, Fuhrmann et al. (2016), Lister et al. (2016) and Doi et al. (2018) detected significant superluminal motions at parsec scales. Interestingly, they consistently found a trend of gradual increase of jet proper motion with distance. Also, the lower brightness temperature of the core than those of typical -ray blazars indicates a relatively mild Doppler factor in the core region, suggesting that the innermost jet region is still not fully accelerated (Wajima et al., 2014; Fuhrmann et al., 2016). Therefore, it would be of great interest to compare those velocity results and the collimation profile obtained in our study.
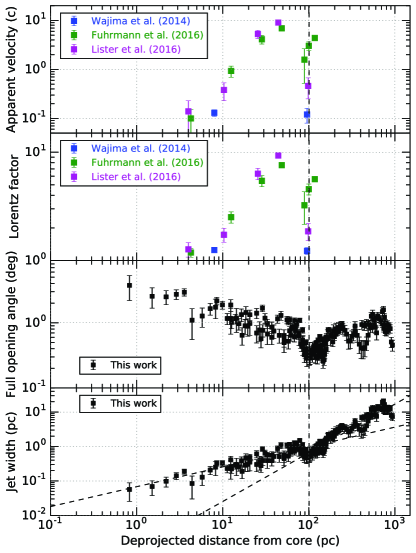
In Figure 7, we show a combined plot of the proper motions in the literature, Lorentz factors () calculated based on the proper motion results, jet collimation profile and the corresponding full opening angle profiles, as a function of deprojected distance from the core. Here we adopt deg to calculate the deprojected distance. We also assume that the proper motions traced by jet components reflect bulk flow motions in the jet.
We can indeed see an intriguing signature: the jet kinematics and global jet shape looks closely related with each other. The jet speed progressively increases with distance from a few to 100 pc, where the jet shape is parabolic and the opening angle smoothly decreases with distance. Then the jet speed becomes the highest (at 10) right before reaching 100 pc where the stationary feature S is located. Beyond this distance, the jet speed seems to be saturated and the jet expands conically. Following M87 (Nakamura & Asada, 2013; Asada et al., 2014), this is the second example where the coincidence of collimation and acceleration as well as a recollimation shock at the end of ACZ was discovered.
According to the current theoretical paradigm of powerful AGN jet formation, a jet is initially produced by strong magnetic fields amplified by a spinning black hole or/and an inner part of the accretion disk (Blandford & Znajek, 1977; Blandford & Payne, 1982). The flow is initially slow in a magnetically-dominated state, and the subsequent acceleration is realized by gradually converting the magnetic (and also thermal) energy into the kinetic one, while the ambient pressure from the external medium collimates the flow. As a consequence, an acceleration and collimation zone is co-formed over long distances from the black hole (by either magnetically (McKinney, 2006; Komissarov et al., 2007, 2009) or hydrodynamically (Gómez et al., 1997; Perucho & Martí, 2007)).
To test whether the observed collimation and acceleration zone in 1H 0323+342 is causally connected or not, it is important to examine if the product satisfies the condition , where and is half-opening angle and magnetization parameter of the jet, respectively. This condition can be derived by requiring that the opening angle of a magnetized jet must be smaller than the opening angle of the Mach cone of fast-magnetosonic waves so that the flows can communicate across the jet (Komissarov et al., 2009). If the jet far beyond the central engine is roughly in equipartition (i.e., ), the condition becomes . We calculated the product for the five components of Lister et al. (2016), and found (0.01, 0.02, 0.03, 0.04, 0.02) for components (6, 5, 4, 3, 2). This indicates that these are all well causally connected. It is also notable that the values are roughly constant from 4 to 100 pc, suggesting that the same acceleration/collimation efficiency is maintained over these distances.
We also note that statistical studies for large samples of blazars indicate 0.2–0.3 (Clausen-Brown et al., 2013; Pushkarev et al., 2017; Jorstad et al., 2017), a factor of 10 larger than those we estimated in 1H 0323+342. If is the case for 1H 0323+342, this implies that the true bulk flows may be much faster (up to ) than those suggested in the observed proper motions.
4.3 -ray Production at the End of ACZ?
1H 0323+342 exhibits one of most active -ray flares among the known -ray detected NLS1s (D’Ammando et al., 2016; Paliya et al., 2018), but the exact location of the flaring region is still under debate. In general active -ray emission from AGN jets and blazars are thought to be produced in compact regions near the central engine (subpc scales) due to the observed rapid variability time scales (e.g., Tavecchio et al., 2010). This scenario seems to be favored also for NLS1s based on the modeling of radio-to--ray SED (e.g, Abdo et al., 2009b; Paliya et al., 2014; D’Ammando et al., 2016). As for 1H 0323+342, Angelakis et al. (2015) report that the source is more variable with higher amplitude at mm frequencies than at low frequencies. Indeed, our VLBA 43 GHz image shows the mm-wave emission is dominated by the compact core, and our core-shift measurements suggest that the location of the 43 GHz core is not farther than 1 pc from the black hole. This may naturally prefer the scenario that the -ray emission from this source is associated with the mm-wave core near the black hole.
Nevertheless, our discovery of the extended ACZ with a recollimation shock might propose an alternative scenario for the high-energy site in this source. As also discussed in Doi et al. (2018), the idea is similar to that proposed for HST-1 in M87. The presence of the extended ACZ means that the cross section of the jet remains quite small even at large distances from the black hole. The cross section of S (at 100 pc, deprojected) is still within subpc (0.4 pc), with the corresponding intrinsic opening angle reaching minimum at this distance (0.3 deg). This value of is much smaller than the averaged of non--LAT-detected blazars (2.5 deg; Pushkarev et al., 2017) and close to or possibly even smaller than the averaged of LAT-detected -ray blazars (1.2 deg; Pushkarev et al., 2017). In fact, Doi et al. (2018) found that the multiple strong -ray flaring events occurred in 2016 (Paliya et al., 2014) coincided with the passage of the fastest superluminal (9 ) component through the feature S. Interestingly, during this period this source showed an enhanced power-law X-ray component that was likely from a nonthermal jet, while the thermal emission from the coronal/disk was relatively low (Paliya et al., 2014). Therefore, one may not preclude the feature S as a potential site of -ray emission in 1H 0323+342.
Note that one serious concern for this scenario is that the variability time scale based on the causality argument results in days, which cannot explain the day-scale -ray variabilities detected in the previous flares (Paliya et al., 2014). This might be reconciled if the feature S contains more compact substructures like HST-1 (Cheung et al., 2007; Giroletti et al., 2012) or turbulent cells (Marscher, 2014), or if the jet contains the faster (larger ) flows (as discussed in Section 4.2).
The production of -rays at large distances from the black hole (beyond BLR/torus) is proposed for BL Lacertae (Marscher et al., 2008), PKS 1510-089 (Marscher et al., 2010) and OJ 287 (Agudo et al., 2011) as well as M87/HST-1. These studies all suggest that a recollimation shock formed at the end of (or beyond) ACZ is a plausible site of -ray emission. Some of these studies suggest that -ray emission is generated also at another site closer to the central engine (e.g., Hada et al., 2014). In this case, one may expect different patterns of MWL correlation from different -ray events. For 1H 0323+342, Paliya et al. (2014) reported that some X-ray events were correlated with -ray while some other X-ray flares had no counterpart in -rays, suggesting the existence of multiple high-energy emission sites. A more dedicated VLBI monitoring of this jet and S along with high-energy instruments is the key to pin down the site(s) of -ray production definitively.
4.4 Jet Collimation, Confinement Medium and Black Hole Mass
The remarkable similarity of apparent jet structure between 1H 0323+342 and M87 is surprising given the different estimation and different host galaxy type. However, a striking difference occurs when the spatial scale is measured in unit instead of pc. Adopting and deg (Fuhrmann et al., 2016; Lister et al., 2016) for 1H 0323+342, the deprojected distance of the jet transition (i.e., the feature S) from the nucleus results in (2–9). This is tens to 100 times more distant than that of HST-1/M87. To maintain a collimated parabola jet shape, the pressure support from the external medium is essential (e.g., Komissarov et al., 2009). For M87 (and also NGC 6251 and NGC 4261), the structural transition occurs around , which is near the Bondi radius or the sphere of gravitational influence (SGI) of the SMBH (Asada & Nakamura, 2012; Tseng et al., 2016; Nakahara et al., 2018). This suggests that the external gas bound by the SMBH potential supports the collimation of these jets.
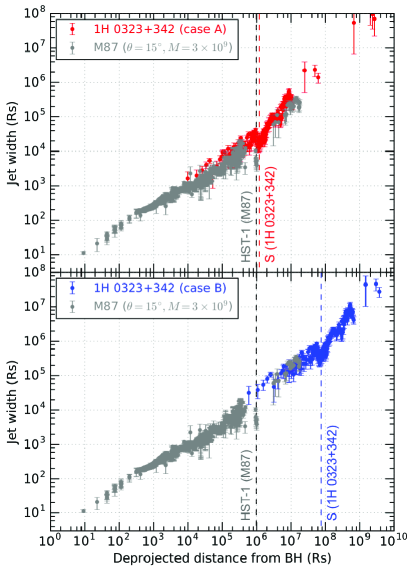
The discrepancy between 1H 0323+342 and M87 can be reduced if the true of 1H 0323+342 is larger than assumed. Indeed, the exact of this source is still highly controversial: while a small BH mass (a few ) seems to be generally preferred thanks to the consistency of various different independent methods (Zhao et al., 2007; Yao et al., 2015; Wang et al., 2016; Landt et al., 2017), there are counterarguments suggesting a factor of 10–30 larger , which is typical in blazars (León Tavares et al., 2014). A similar discrepancy of estimation has been observed also for other -ray emitting NLS1s FBQS J1644+2619 (D’Ammando et al., 2017) and PKS 2004-447 (Baldi et al., 2016). In Figure 8, we show a plot comparing the jet collimation profiles between M87 and 1H 0323+342 for different and . Interestingly, if we assume (, ) = (, 12 deg) for 1H 0323+342 and (, ) = (, 15 deg) for M87, the jet profiles of the two sources are remarkably overlapped with each other in unit. This implies a common jet collimation mechanism is at work if of 1H 0323+342 is large. In this case, 1H 0323+342 actually falls onto the famous relation (; Kormendy & Ho, 2013) along with M87. This implies that the SGI, defined by , could be expressed by . Therefore the collimation of AGN jets from might commonly break at distances around . Note that the jet profile of 1H 0323+342 shown by red color in Figure 8 is also sufficiently overlapped with those of NGC 6251 (Tseng et al., 2016; Nakamura et al., 2018) and 3C 273 (Akiyama et al., 2018).
On the other hand, if the small is correct, the observed jet collimation would require additional/alternative external support that confines the jet until far beyond the SMBH potential. A likely source of such support would be large-scale winds/outflows surrounding the radio jet. Based on recent radiation-MHD simulations there are strong indications that super-Eddington BH accretion flows drive powerful outflows due to strong radiation pressure force from the radiatively very efficient accretion flows (Ohsuga et al., 2009; Ohsuga & Mineshige, 2011). Recent systematic studies of [O III] emission lines for samples of radio-loud NLS1s have found evidence of powerful outflows (Berton et al., 2016a; Komossa et al., 2016). These outflows are associated with the narrow line region (NLR), whose spacial scales are supposed to be of the order of 1–100 pc, consistent with the observed collimation scales of 1H 0323+342. Therefore, if the small with high is true for 1H 0323+342, the observed 1–100 pc-scale collimation might be supported by the NLR outflows. Note that the observed NLR outflows in radio-loud NLS1s might also be a consequence of the propagation of relativistic jets rather than driven by the accretion flows (Berton et al., 2016a). Future VLBI polarimetric observations with RM measurements would provide more insights into the jet-surrounding interactions in this source (e.g., as performed in 3C 120; Gómez et al., 2008, 2011).
Therefore in any case, our results on 1H 0323+342 have very intriguing implications for jet collimation, black hole mass, accretion state, confinement medium/environment and their possible relationship with each other: (1) If the large expected from the relation is the case, the jet collimation may be regulated by the gas bound by the SMBH potential, just as suggested for M87 and nearby radio galaxies. In contrast, (2) if the small (and thus the higher Eddington ratio) is the case, the jet collimation may be regulated by NLR outflows that are driven by super-Eddington BH accretion flows. Solving this question will allow us to build a unified picture of AGN jet formation mechanisms as a function of and , and also might help better understand the co-evolution and feedback between SMBH and host galaxies.
5 Summary
We reported results from a detailed nine-frequency VLBA observation of the jet in the nearest -ray detected radio-loud NLS1 galaxy 1H 0323+342. We summarize our main results as follows.
-
1.
We obtained multi-frequency VLBI images of the 1H 0323+342 jet at various spatial scales from 100 mas (at 1.4 GHz) down to 0.1 mas (at 43 GHz). At high frequencies (24 GHz) the radio core at the jet base dominates the emission, while at low frequencies (2 GHz) the quasi-stationary, rebrightened feature S at 7 mas from the core becomes the brightest component. We found that S remained there over more than 10 years.
-
2.
We extensively investigated the width profile of this jet over a wide range of distance from 0.1 mas to mas using our VLBA images and supplementary MERLIN/VLA archival images. We discovered that the jet maintained a parabolic shape from the jet base to 7 mas where S is located, providing evidence of a jet collimation zone. Beyond 7 mas, the jet started to expand more rapidly, transitioning into a hyperbolic/conical shape.
-
3.
We found that the jet cross section of S (i.e., the site of jet transition) is significantly smaller (by a factor of 2) than that expected from the parabolic profile of the inner jet. Between the inner parabolic zone and the compressed S, we detected a “recollimation zone” connecting these two regions. Moreover, we found that S showed strongly polarized signals (as high as 30 %), possible spectral flattening, and passing of highly superluminal components. A set of these results suggest that the quasi-stationary feature S is a recollimation shock at the end of the collimation zone, producing highly ordered -fields and re-energizing jet particles.
-
4.
By combining the collimation profile and the jet proper motions results in the literature, we discovered the coincidence of jet collimation and acceleration between the jet base and S. The product of Lorentz factor and (half) opening angle of this jet satisfies , indicating that the observed collimation and acceleration zone (ACZ) is causally connected.
-
5.
Our discovery on ACZ showed that the intrinsic opening angle of the jet becomes minimum at S, with the Lorentz factor reaching maximum, suggesting a highly Doppler boosting jet. Together with the fact that an active -ray flaring event in 1H 0323+342 coincided with the passage of a highly superluminal component through S (Doi et al., 2018), the recollimation shock S at the end of ACZ might be a potential site of the -ray production as well as the jet base. The deprojected distance of this feature is 40-100 pc. The -ray production at such distances is much larger than those usually suggested in typical -ray blazars, while this situation is quite similar to HST-1 in the jet of M87.
-
6.
We found that the core-shift of the 1H 0323+342 jet is small between 1.4 and 43 GHz. This is consistent with the jet having a small viewing angle to our line-of-sight. We estimated a relative separation between the 43 GHz core and the central BH by using the measured parabolic collimation profile of the inner jet, and obtained a deprojected separation of (0.24–0.71) pc (or possibly shorter) for a viewing angle of 4–12 deg.
-
7.
We found various remarkable similarities in the pc-scale jet structures between 1H 0323+342 and M87 (e.g., the collimation profile and recollimation shock). If of 1H 0323+342 is and thus follows the relation, we suggest that a common jet formation mechanism is at work in M87 and 1H 0323+342, where the external gas bound by the SMBH potential plays a role in collimating the jets.
-
8.
If of 1H 0323+342 is a few times of (and thus close to or above the Eddington limit), which is proposed by several previous papers, the parabolic jet continues up to from the black hole, suggesting additional large-scale structures that confine the jet. NLR outflows, which may be driven by super-Eddington accretion flows, could be responsible for the large-scale jet confinement.
Appendix
Calibrator 0329+3510
0329+3510 is a radio source separated by 1.36 deg on the sky from 1H 0323+342. This source is among candidates of High Frequency Peakers which are a subclass of young radio galaxies (Dallacasa et al., 2000). In Figure 9 we show self-calibrated images of 0329+3510 obtained at 15, 24 and 43 GHz. The source morphology significantly changes with frequency. At 43 GHz where the highest angular resolution is available, the source is resolved into the core (the southernmost brightest region) and a strong knot. The core and the knot is also securely resolved at 24 GHz. However, the two features are mixed in a synthesized beam at 15 GHz and the lower frequencies. This is because the knot becomes brighter as frequency decreases (i.e., an optically-thin steep spectrum) while the core spectrum is relatively flat or slightly inverted (i.e., optically-thick), as well as the resolution effect. This prevents us from specifying a reliable reference position in the 0329+3510 images at 15 GHz.
Therefore, we employed relative astrometry between 1H 0323+342 and 0329+3510 only at 24 and 43 GHz. At each frequency, we measured the core position of 1H 0323+342 with respect to the core of 0329+3510. In this case, we need to know the effect of core-shift of the calibrator itself since the observed core-shift on the target image is the mixture of the core-shift from both sources. Actually, 0329+3510 has a well-defined optically-thin knot at 24/43 GHz that should be stationary with frequency, so we can measure the intrinsic core-shift of 0329+3510 based on the self-referencing method using the self-calibrated images. As a result, we found that the intrinsic core-shift of 0329+3510 between 24 and 43 GHz is virtually negligible (less than 6 as). Therefore, the observed core-shift of 1H 0323+342 with respect to the core of 0329+3510 is virtually represents the intrinsic core-shift of the target.
References
- Abdo et al. (2009a) Abdo, A. A., Ackermann, M., Ajello, M., et al. 2009a, ApJL, 699, 976
- Abdo et al. (2009b) Abdo, A. A., Ackermann, M., Ajello, M., et al. 2009b, ApJL, 707, L142
- Agudo et al. (2011) Agudo, I., Jorstad, S. G., Marscher, A. P., et al. 2011, ApJ, 726, L13
- Agudo et al. (2012) Agudo, I., Gomeź, J. L., Casadio, C., et al. 2012, ApJ, 752, 92
- Akiyama et al. (2018) Akiyama, K., Asada, K., Fish, V., et al. 2018, Galaxies, 6, 15
- Angelakis et al. (2015) Angelakis, E., Fuhrmann, L., Marchili, N., et al. 2015, A&A, 575, 55
- Antón et al. (2008) Antón, S., Browne, I. W. A., Marchã, M. J. 2008, A&A, 490, 583
- Asada & Nakamura (2012) Asada, N. & Nakamura, M. 2012, ApJ, 745, L28
- Asada et al. (2014) Asada, K., Nakamura, M., Doi, A., et al. 2014, ApJ, 781, L2
- Baldi et al. (2016) Baldi, R. D., Capetti, A., Robinson, A., et al. 2016, MNRAS, 458, L69
- Berton et al. (2016a) Berton, M., Foschini, L., Ciroi, S., et al. 2016, A&A, 591, 88
- Berton et al. (2016b) Berton, M., Caccianiga, A., Foschini, L., et al. 2016, A&A, 591, 98
- Beuchert et al. (2018) Beuchert, T., Kadler, M., Perucho, M., et al. 2018, A&A, 610, A32
- Biretta et al. (1999) Biretta, J. A., Sparks, W. B., & Macchetto, F. 1999, ApJ, 520, 621
- Blandford & Znajek (1977) Blandford, R. D., & Znajek, R. L. 1977, MNRAS, 179, 433
- Blandford & Payne (1982) Blandford, R. D., & Payne, D. G. 1982, MNRAS, 199, 883
- Boccardi et al. (2016) Boccardi, B., Krichbaum, T., Bach, U., et al. 2016, A&A, 585, 33
- Boller et al. (1996) Boller, T., Brandt, W. N., & Fink, H. 1996, A&A, 305, 53
- Cheung et al. (2007) Cheung, C. C., Harris, D. E., & Stawarz, Ł. 2007, ApJ, 663, L65
- Clausen-Brown et al. (2013) Clausen-Brown, E., Savolainen, T., Pushkarev, A. B., et al. 2013, A&A, 558, 144
- Dallacasa et al. (2000) Dallacasa, D., Stanghellini, C., Centonza, M. & Fanti, R. 2000, A&A, 363, 887
- D’Ammando et al. (2012) D’Ammando, F., Orienti, M., Finke, J., et al. 2012, MNRAS, 426, 317
- D’Ammando et al. (2013) D’Ammando, F., Orienti, M., Finke, J., et al. 2013, MNRAS, 436, 191
- D’Ammando et al. (2015a) D’Ammando, F., Larsson, J., Finke, J., et al. 2014, MNRAS, 446, 2456
- D’Ammando et al. (2015b) D’Ammando, F., Orienti, M., Tavecchio, F., et al. 2015, MNRAS, 450, 3975
- D’Ammando et al. (2016) D’Ammando, F., Orienti, M., Finke, J., et al. 2016, Galaxies, 4, 11
- D’Ammando et al. (2016) D’Ammando, F., Orienti, M., Finke, J., et al. 2016, MNRAS, 463, 4469
- D’Ammando et al. (2017) D’Ammando, F., Acosta-Pulido, J. A., Capetti, A., et al. 2017, MNRAS, 469, L11
- Deller et al. (2011) Deller, A. T., Brisken, W. F., Phillips, C. J., et al. 2011, PASP, 123, 275
- Doi et al. (2006) Doi, A., Nagai, H., Asada, K., et al. 2006, PASJ, 58, 829
- Doi et al. (2007) Doi, A., Fujisawa, K., Inoue, M., et al. 2007, PASJ, 59, 703
- Doi et al. (2011) Doi, A., Asada, K., & Nagai, H. 2011, ApJ, 738, 126
- Doi et al. (2018) Doi, A., Hada, K., Kino, M., et al. 2018, ApJL, 857, L6
- Foschini et al. (2011) Foschini, L., Ghisellini, G., Kovalev, Y. Y., et al. 2011, MNRAS, 413, 1671
- Fromm et al. (2011) Fromm, C. M., Ros, E., Perucho, M., et al. 2011, A&A, 531, 95
- Fromm et al. (2013) Fromm, C. M., Ros, E., Perucho, M., et al. 2013, A&A, 551, 32
- Fromm et al. (2016) Fromm, C. M., Perucho, M., Mimica, P., & Ros, E. 2016, A&A, 588, A101
- Fuhrmann et al. (2016) Fuhrmann, L., Karamanavis, V., Komossa, S., et al. 2016, RAA, 16, 176
- Giovannini et al. (2018) Giovannini, G., Savolainen, T., Orienti, M., et al. 2018, in press
- Giroletti et al. (2011) Giroletti, M., Paragi, Z., Bignall, H., et al. 2011, A&A, 528, L11
- Giroletti et al. (2012) Giroletti, M., Hada, K., Giovannini, G., et al. 2012, A&A, 538, L10
- Gallo et al. (2006) Gallo, L. C., Edwards, P. G., Fererro, E., et al. 2006, MNRAS, 370, 245
- Gómez et al. (1997) Gómez, J. L., Martí, J. M., Marscher, A. P., et al. 1997, ApJL, 482, L33
- Gómez et al. (2008) Gómez, J. L., Marscher, A. P., Jorstad, S. G., et al. 2008, ApJL, 681, L69
- Gómez et al. (2011) Gómez, J. L., Roca-Sogorb, M., Agudo, I., et al. 2012, ApJ, 733, 11
- Gómez et al. (2016) Gómez, J. L., Lobanov, A. P., Bruni, G., et al. 2015, ApJ, 817, 96
- Hada et al. (2011) Hada, K., Doi, A., Kino, M., et al. 2011, Nature, 477, 185 (H11)
- Hada et al. (2013) Hada, K., Kino, M., Doi, A., et al. 2013, ApJ, 775, 70
- Hada et al. (2014) Hada, K., Giroletti, M., Kino, M., et al. 2014, ApJ, 788, 165
- Hada et al. (2015) Hada, K., Giroletti, M., Giovannini, G., et al. 2015, arXiv:1504.01808
- Hada et al. (2016) Hada, K., Kino, M., Doi, A., et al. 2016, ApJ, 817, 131
- Hada et al. (2017) Hada, K., Park, J.-H., Kino, M., et al. 2017, PASJ, 69, 71
- Itoh et al. (2014) Itoh, R., Tanaka, Y. T., Akitaya, H., et al. 2014, PASJ, 66, 108
- Jorstad et al. (2017) Jorstad, S. G., Marscher, A. P., Morozova, D. A., et al. 2017, ApJ, 846, 98
- Komissarov et al. (2007) Komissarov, S. S., Barkov, M. V., Vlahakis, N., Königl, A., & 2009, MNRAS, 394, 1182
- Komissarov et al. (2009) Komissarov, S. S., Vlahakis, N., & Königl, A. 2007, MNRAS, 380, 51
- Komossa et al. (2016) Komossa, S., Xu, D. & Zensus, A. 2014, in IAU Symp. 312, Star clusters and black holes in galaxies across cosmic time, ed. Y. Meiron, S. Li, F.-K. Liu, & R. Spurzem (ASP: San Francisco, CA), 63
- Kormendy & Ho (2013) Kormendy, J. & Ho, L. 2013, ARA&A, 51, 511
- Kotilainen et al. (2017) Kotilainen, J. K., León-Tavares, J., Olguín-Iglesias, A., et al. 2017, ApJ, 832, 157
- Kynoch et al. (2018) Kynoch, D., Landt, H., Ward, M. J., et al. 2018, MNRAS, 475, 404
- Landt et al. (2017) Landt, H., Ward, M. J., Baloković, et al. 2017, MNRAS,464, 2564
- León Tavares et al. (2014) León Tavares, J., Kotilainen, J., Chavushyan, V., et al. 2014, ApJ, 795, 58
- Lister et al. (2009) Lister, M. L., Aller, H. D., Aller M. F., et al. 2009, AJ, 137, 3718
- Lister et al. (2016) Lister, M. L., Aller, M. F., Aller, H., et al. 2016, AJ, 152, 12
- Lobanov (1998) Lobanov, A. P. 1998, A&A, 330, 79
- Marscher et al. (2008) Marscher, A. P., Jorstad, S. G., D’Arcangelo, F. D., et al. 2008, Nature, 452, 966
- Marscher et al. (2010) Marscher, A. P., Jorstad, S. G., Larionov, V. M., et al. 2010, ApJL, 710, L126
- Marscher (2014) Marscher, A. P. 2014, ApJ, 780, 87
- McKinney (2006) McKinney, J. C. 2006, MNRAS, 368, 1561
- Mertens et al. (2016) Mertens, F., Lobanov, A. P., Walker, R. C., & Hardee, P. E. 2016, A&A, 595, A54
- Nagai et al. (2014) Nagai, H., Haga, T., Giovannini, G., et al. 2014, ApJ, 785, 53
- Nakahara et al. (2018) Nakahara, S., Doi, A., Murata, Y., et al. 2018, ApJ, 854, 148
- Nakamura & Asada (2013) Nakamura, M., & Asada, K. 2013, ApJ, 775, 118
- Nakamura et al. (2018) Nakamura, M., Asada, K., Hada, K., et al. 2018, submitted
- Ohsuga et al. (2009) Ohsuga, K., Mineshige, S., Mori, M., et al. 2009, PASJ, 61, L7
- Ohsuga & Mineshige (2011) Ohsuga, K. & Mineshige, S. 2011, ApJ, 736, 2
- Orienti et al. (2012) Orienti, M., D’Ammando, F., Giroletti, M., & for the Fermi-LAT Collaboration 2012, arXiv:1205.0402
- Orienti et al. (2015) Orienti, M., D’Ammando, F., Larsson, J., et al. 2015, MNRAS, 453, 4037
- Osterbrock & Pogge (1985) Osterbrock, D. E. & Pogge, R. W. 1985, ApJ, 297, 166
- Paliya et al. (2014) Paliya, V. S., Sahayanathan, S., Parker, M. L., et al. 2014, ApJ, 789, 143
- Paliya et al. (2018) Paliya, V. S., Ajello, M., Rakshit, S., et al. 2018, ApJL, 853, L2
- Perucho & Martí (2007) Perucho, M., & Martí, J. M. MNRAS, 2007, 382, 526
- Pushkarev et al. (2017) Pushlarev, A. B., Kovalev, Y. Y., Lister, M., et al. 2017, MNRAS, 468, 4992
- Tavecchio et al. (2010) Tavecchio, F., Ghisellini, G., Bonnoli, G., et al. 2010, MNRAS, 405, L94
- Tseng et al. (2016) Tseng, C.-Y., Asada, K., Nakamura, M., et al. 2016, ApJ, 833, 288
- Wajima et al. (2014) Wajima, K., Fujisawa, K., Hayashida, M., et al. 2014, ApJ, 781, 75
- Wang et al. (2016) Wang, F. Du, P. Hu, C., et al. 2016, ApJ, 824, 149
- Yao et al. (2015) Yao, S. Yuan, W. Komossa, S. et al. 2016, AJ, 150, 23
- Zhao et al. (2007) Zhou, H.-Y., Wang, T.-G., Yuan, W.-M., et al. 2007, ApJL, 658, L13
- Shepherd (1997) in ASP Conf. Ser. 125, Astronomical Data Analysis Software and Systems VI, ed. G. Hunt & H. E. Payne (San Francisco, CA: ASP), 77