Columnar structures of soft spheres: Metastability and hysteresis
Abstract
Previously we reported on the stable (i.e. minimal enthalpy) structures of soft monodisperse spheres in a long cylindrical channel. Here, we present further simulations, which significantly extend the original phase diagram up to (ratio of cylinder and sphere diameters), where the nature of densest sphere packing changes. However, macroscopic systems of this kind are not confined to the ideal equilibrium states of this diagram. Consequently, we explore some of the structural transitions to be expected as experimental conditions are varied; these are in general hysteretic. We represent these transitions in a stability diagram for a representative case. Illustrative videos are included in the Supplemental Material.
I introduction
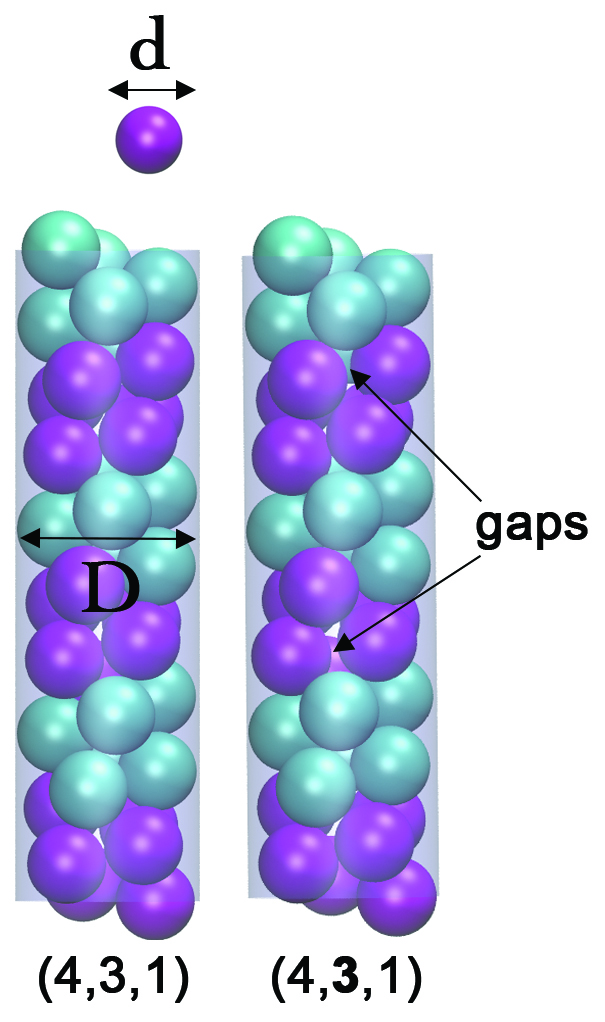
There is an increasing interest in the field of columnar structures, two examples of which are shown in Fig.1. These range from packings of bubbles winkelmann2017simulation ; meagher2015experimental ; saadatfar2008ordered ; pittet1996structural ; Tobin2011 ; boltenhagen1998giant ; boltenhagen1998structural and colloidal particles lohr2010helical ; fu2017assembly ; yin2003self ; wu2017confined in cylinders at the macroscopic level, to molecules or particles in nanotubes barzegar2015csub60 ; khlobystov2005molecules ; Troche2005 , polymer coated nanoparticles in cylinders sanwaria2014helical , as well as similar packings on cylinders Harvard2018 . Another stimulating discovery is that of tubular crystals douglass2017stabilization , which have been found in simulations: these are made up of interlocking columnar structures mughal2011phyllotactic ; mughal2012dense ; chan2011densest ; fu2017assembly ; mughal2013screw ; fu2016hard ; mughal2014theory ; wood2013self . All of the above work is informed by extensive computational studies of cylindrical dense packings and optimal packings for soft spheres and atoms interacting with pair potentials.
A recent development offers a new experimental method for the fabrication of cylindrical packings of polymer beads by the use of a lathe to induce a centripetal force Koreans2017 .
We have recently presented an analysis of equilibrium structures of soft spheres as a function of pressure and the diameter ratio of a cylinder () and the soft spheres of equal size () that are packed within it winkelmann2017simulation . These simulation results were for structures which were found to have the lowest enthalpy. It was recognised that these might be of limited value for macroscopic experiments. Accordingly we have now undertaken an exploration of metastability and hysteresis. That is, we ask the question: Given a certain structure, locally stable, and some (experimental) protocol for the continuous variation of and/or , what sequence of transitions is to be expected?
It is practically impossible to develop a fully comprehensive answer to this question, given the richness of possibilities presented in Sec. III. Indeed, this does not exhaust the possible list of structures which might conceivably arise in the present investigation. Here we give a description of the methodology used to investigate transitions between columnar structures.
Before presenting these new results in Sec.IV we will introduce the model (Sec.II) and present a now greatly expanded phase diagram in Sec.III.
II Model and Method
As described previously winkelmann2017simulation , the model that we adopt consists of spheres of diameter , whose overlap leads to an increase in energy according to
| (1) |
Here the overlap between two spheres and is defined as , where and are the centres of two contacting spheres in cylindrical polar coordinates. A harmonic energy term accounts for the overlap between the th sphere and the cylindrical boundary. The spring constant determines the softness of the spheres.
This is a generic model offering a qualitative and semi-quantitative understanding of a variety of physical systems.
We conduct simulations using a unit cell of length (volume ), containing spheres. On both ends of the unit cell we impose twisted periodic boundary conditions to represent a periodic columnar structure of soft spheres. The periodic boundaries are implemented by placing image spheres above and below the unit cell, where each sphere of the unit cell is moved in -direction by (and ) and twisted by an angle (and , respectively) in the -plane (for more details see Ref.mughal2012dense ).
Stable structures are found by minimising the enthalpy for a system of soft spheres in the unit cell, where is the internal energy due to overlaps as described before (see Ref.winkelmann2017simulation ) and is the pressure. During the minimisation, the free parameters are the sphere centres , the twist angle , and the length of the unit cell , while the pressure is kept constant. Thus, all simulations are performed at constant pressure and variable volume.
Two different types of minimisation routine are used to minimise the enthalpy . The stochastic basin-hopping algorithm basinhopping performs a general search for the global minimum and the BFGS method BFGS is used for a conjugate gradient algorithm to search for the nearest local minimum of enthalpy.
Enthalpy and pressure have to be rescaled accordingly to obtain non-dimensional quantities. We use the dimensionless enthalpy and dimensionless pressure , where is the spring constant and is the sphere diameter.
In the limit we make contact with previous results for densest packings of hard spheres mughal2012dense .
III The Phase Diagram
All the structures that we found can be classified either as being uniform structures (previously called symmetric in hard sphere packings), or line-slip structures, see Fig. 1.
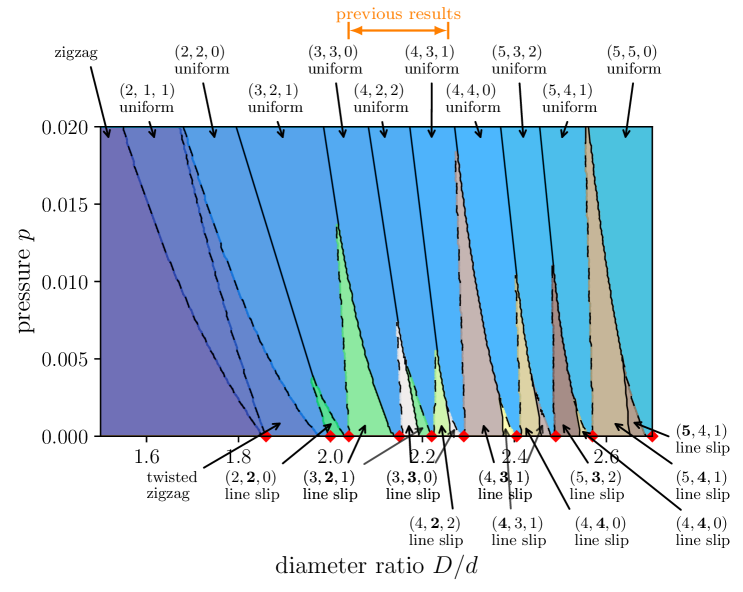
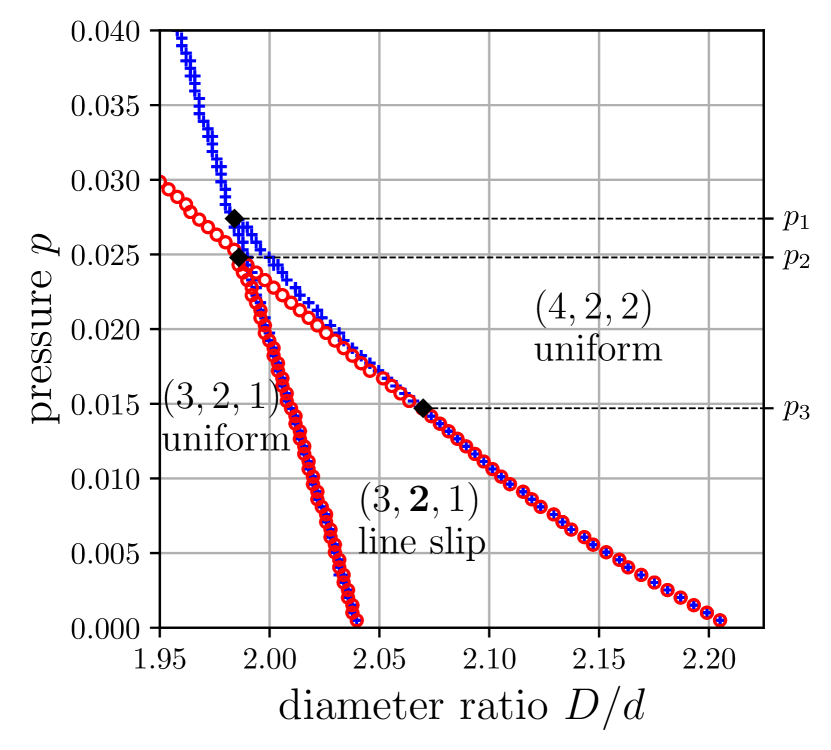
In Fig.2 we have greatly extended the range of the previously published phase diagram to (Fig.2 of Ref.winkelmann2017simulation was only ). The upper limit marks the point at which the character of the optimal structures changes radically; beyond this point the structures contain inner spheres which are not in contact with the cylindrical wall mughal2012dense .
The pressure range is limited to , beyond which line-slip structures are absent. At large pressures the model may be regarded as unrealistic. For a system of bubbles, which was the initial context for this work, one encounters the “dry limit”, as increases. At this point all liquid in a foam has been removed.
The same procedure as before was used to obtain the phase diagram: The simulations were run with spheres in the unit cell, and for a given value of pressure and diameter ratio the structure with the lowest enthalpy was selected for the phase diagram.
Above the diameter ratio of , we find 24 distinct structures. There are 10 uniform packings and the remaining 14 structures are their corresponding line slips. Below we observe the bamboo structure, the zigzag packing, the uniform arrangement, and the twisted zigzag structure [i.e., the line slip].
The transitions between different structures can be classified as follows. In continuous phase transitions (marked with dashed lines in Fig. 2) a structure transforms smoothly into another by gaining or losing a contact. This can be observed in supplemental video S0 supplemental , which shows an overview over all structures at a low pressure, together with the corresponding rolled-out contact network and the structure’s position in the phase diagram. Both the enthalpy and its first derivative are continuous functions of . This type of transition is found between a uniform structure and a line slip. The zigzag to transition is also continuous. Discontinuous transitions (solid lines in Fig. 2) are transitions where one structure changes abruptly into another, as can also be seen in video S0 supplemental .
IV Metastability and hysteresis
Whereas the computation of a phase diagram entailed a search for the global minimum, involving an algorithm that allowed radical changes of structure to be explored, here we pursue a more limited objective. Given a stable structure, possibly metastable, how does it change when the pressure and diameter ratio are continuously varied, if it is to remain in the local minimum of enthalpy?
We do this by computing trajectories in the plane, and recording boundaries where the structure changes to one of a different character. With a sufficient number of trajectories, a stability diagram is built up, i.e. a map of the location of structural transitions.
With the procedure that we adopt (the conjugate gradient method), structures of high symmetry, such as the , can get stuck on an saddle point, where the enthalpy is not minimal, but its gradient is zero. This can be avoided by applying a small random perturbation to the structure, which displaces it from the saddle point, followed by a local minimisation.
The simulation procedure was carried out for a unit cell with spheres. This choice is commensurable with structures that contain or spheres in the unit cell, and as such includes all of the known structures from the previously identified hard-sphere packings (see Table 1 in Ref.mughal2012dense for structures and the number of spheres in the unit cell). An exception to this are packings which contain spheres; however in the hard sphere case these occur only for high values of and as such are out of the range of the present simulations.
In the following example we consider transitions between the and uniform structures and the associated line slip. We begin by plotting the changes in enthalpy that occur for a structure when is held fixed and is allowed to vary steadily. We show that at a low pressures it is possible to start with any one of these structures and continuously transform one structure into another: that is, a change in can transform a uniform structure into a line-slip arrangement by the loss or formation of a contact. This is accompanied by a smooth variation in the enthalpy, or at most a change in slope for the derivative of the enthalpy when a new contact is formed. However, at higher pressures these transitions are no longer reversible and show evidence of hysteresis, such discontinuous transformations are accompanied by a discontinuity in enthalpy. From such results we eventually obtain a stability diagram (as described below in Sec.IV.2) operational for any trajectory taken in terms of and .
In order to appreciate the significance of the enthalpy curves, the reader may wish to refer forward to the relevant stability diagram, Fig.6 as well as the phase diagram Fig.2 and the Supplemental Material supplemental .
IV.1 Enthalpy curves
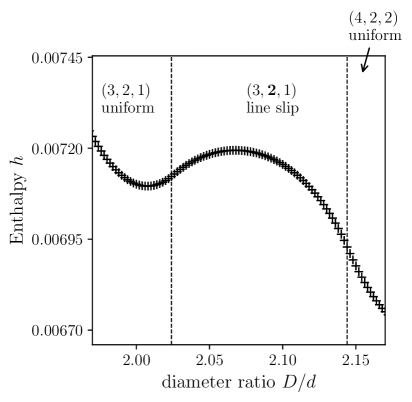
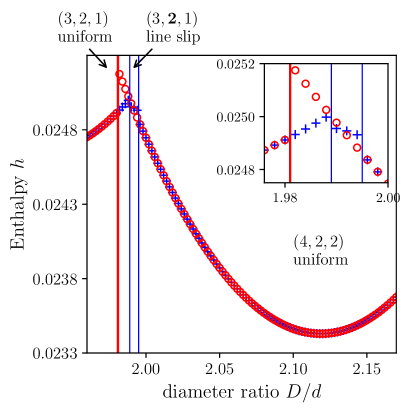
An example of a computed enthalpy curve is shown in Fig. 3. It shows the change in enthalpy as is increased and pressure is held constant at . At such a low pressure a change in allows the uniform structure to transition continuously into the line-slip arrangement (by the loss of a contact), and then continuously into the uniform structure (by the formation of a new contact), both reversibly. The values of where the changes in the nature of the structure occur are indicated by dashed vertical lines in Fig. 3. The smooth change in the enthalpy over the course of these transitions demonstrates that the process is continuous and reversible. The smooth change in structure, together with its rolled-out contact network and its position in the stability diagram, Fig 6(b), which we will explain in more detail in Sec.IVB, can be observed in video S1 supplemental .
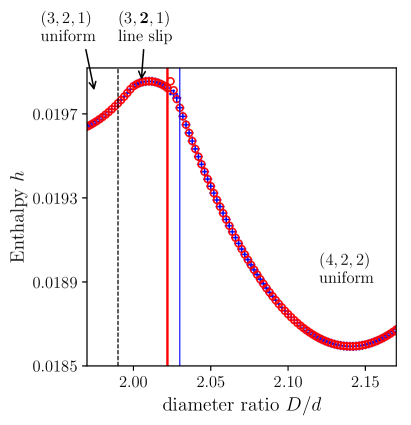
At the higher pressure of the nature of the transitions between these structures is different, as illustrated in Fig. 4. As before, and shown by the blue crosses, starting with the uniform structure, a steady increase in leads to a smooth change in the enthalpy leading to the line slip at a value of , as indicated by the vertical blue dashed line. However increasing further leads eventually to a discontinuous transition whereby the structure transforms suddenly into the uniform arrangement, as indicated by the continuous vertical blue line. At this point in the enthalpy shows a sudden drop. Video S2 supplemental shows the varying structures along this trajectory and the sudden transformation into the (4, 2, 2) uniform arrangement.
When the diameter ratio is decreased again (red circles), the transition from the uniform structure to the line slip is again discontinuous (thick red vertical line). However, the transition to the line-slip structure occurs at a lower value of on the reverse trajectory as compared to the forward trajectory and thus exemplifies the structural hysteresis present in these packings above a critical pressure.
At even greater pressures the line-slip structure disappears completely from the reverse trajectory, as shown in Fig. 5 for . Now, in the forward trajectory a discontinuous transition (vertical thin blue line) transforms the uniform packing into the line slip and then to the uniform structure by a further discontinuous transition. On the reverse trajectory the uniform structure jumps straight to the uniform structure by a discontinuous transition (vertical thick red line) - without the presence of the intervening line slip. Increasing the pressure yet higher () eliminates the line slip also on the forward trajectory so that transformations between the uniform structure and the uniform structure are accompanied only by discontinuous transitions, and the line slips are completely eliminated. We display again the structures and rolled-out contact networks along these trajectories in videos S3 and S4 supplemental .
IV.2 Stability diagrams
The stability diagram represents the boundaries at which transitions take place between a particular set of structures (starting with one of the structures listed in it). Other metastable structures must exist in the same region, but are not represented. As mentioned earlier, the stability diagram is not to be confused with the phase diagram in Fig 2.
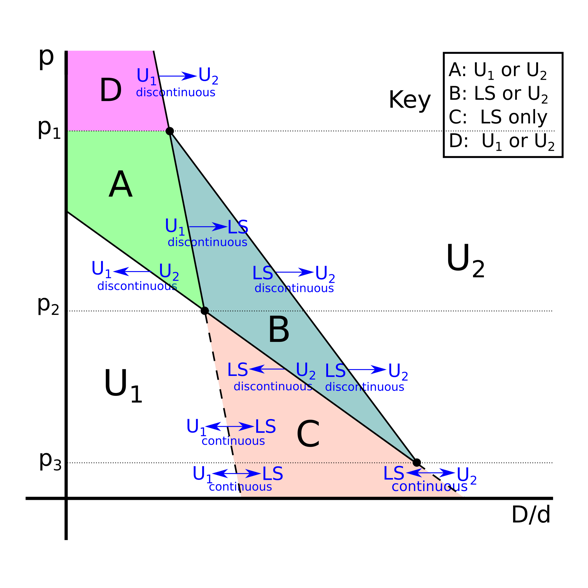
Figure 6(a) is the stability diagram representing transitions between the and uniform structures and the associated line slip . It was obtained from the calculations of enthalpy curves of the kind described in Sec.IVB. Figure 6(b) is a schematic guide to the interpretation of this stability diagram, which is correct in representing the topological features of the stability diagram but does not preserve the geometrical features. Here is to be identified with the uniform packing, is to be identified with the uniform packing and LS with the line slip.
Continuous transitions (reversible) between structures are marked by dashed lines while discontinuous transitions (irreversible) are represented by solid lines. Blue arrows indicate the directions for which such boundaries entail a transition. We also mark the nature of the boundary and the structures encountered on either side of the boundary.
The reversible boundaries are to be identified with parts of the phase boundaries of the equilibrium phase diagram, Fig. 2.
As displayed in Fig. 6, there are four qualitatively different pressure regimes, corresponding to the examples described above. These are (see Fig. 3), (see Fig. 4), (see Fig. 5) and . For the last regime, i.e. above , the metastable phase of the line slip has completely vanished. Here the enthalpy curves show discontinuities at the blue crosses for increasing and at the red crosses for decreasing . Videos S1-S4 supplemental illustrate the change in structure for all four different pressure regimes when varying at constant pressure. At the discontinuous transitions the corresponding videos reveal the sudden change in structure.
To illustrate the useful application of the schematic diagram Fig. 6(b) we describe the case in detail by choosing , which corresponds to the enthalpy curves shown in Fig. 4. The other cases can be interpreted similarly by comparing Fig.6(a) with Fig.6(b).
Starting from the uniform packing at increasing leads to a boundary [shown by the blue crosses in Fig. 6(a)] which marks the continuous transition to the line slip. In Fig. 6(b) this is marked by the dashed line indicating the continuous transition .
Increasing further a second boundary (blue crosses) is encountered, making a discontinuous transition to the uniform structure. This boundary is shown in the schematic diagram by the solid line and is labeled . The arrow indicates that this is encountered only upon increasing , transforming the line slip into the uniform structure by a discontinuous transition.
Upon decreasing the uniform structure undergoes a discontinuous transition at the boundary indicated by red dots in Fig 6(a) into the line slip. This boundary is marked by the solid line in the schematic diagram accompanied by the label .
V Conclusion
We have not attempted an exhaustive description of metastability and hysteresis in this system, as this seems impractical. Simulations in other regions of the phase diagram have resulted in further stability diagrams, most of which are qualitatively similar to Fig. 6, as might be expected from the repetitive pattern of the phase diagram , Fig. 2. Thus, Fig. 6(b), given the coordinates of about six points, where the lines meet can serve as a guide to any such case. A few others are different; all of these will be published in due course.
It is perhaps surprising that all of the simulations resulted only in the appearance of structures that are to be found in the equilibrium phase diagram, albeit over different ranges of and . This may be rationalised at or close to the hard sphere limit, but might not have been anticipated at higher pressures. It would appear that the procedure adopted here allowed the appearance of radically new structures, but none were found. More extended simulations may yet turn up surprises.
It may be interesting to extend this analysis to higher values of , for which Fu et al. fu2016hard have computed a list of equilibrium structures that are of a different character, as we noted at the outset. This is likely to be quite demanding, and should perhaps be guided by preliminary experimental investigations of that regime.
The results should provide insight for new experiments in which it is more convenient to vary for fixed , rather than the reverse. For example, ordered columnar bubble structures are readily formed by simple procedures winkelmann2017simulation , and there is a natural variation of within the column in this experiment, due to gravity. Such a system may be used to identify structures and transitions between them, for comparison with what is presented here. Diagrams such as Fig 6(b) may then serve as a guide to the practical fabrication of structures of soft spheres in tubes, for which the equilibrium phase diagram by itself, may be misleading.
Acknowledgements.
D.W. and A.M. would like to thank the Isaac Newton Institute for Mathematical Sciences for support and hospitality during the programme Growth Form and Self-Organisation when work on this paper was undertaken. This work was supported by: EPSRC Grant No. EP/K032208/1 and EP/R014604/1, as well as an Irish Research Council Postgraduate Scholarship (project ID GOIPG/2015/1998). We also acknowledge the support of the Science Foundation Ireland (SFI) under Grant No. 13/IA/1926 and MPNS COST Action MP1305 ‘Flowing Matter’ and the European Space Agency ESA MAP Metalfoam (AO-99-075) and Soft Matter Dynamics (contract: 4000115113) A.M.’s visit to the TCD Foams and Complex System Group was funded by the Visiting Professorships and Fellowships Benefaction Fund. The authors would also like to acknowledge numerous useful discussions with B. Haffner.References
- (1) J. Winkelmann, B. Haffner, D. Weaire, A. Mughal, and S. Hutzler, Phys Rev E 97, 059902(E) (2017).
- (2) A. Meagher, F. García-Moreno, J. Banhart, A. Mughal, and S. Hutzler, Colloids Surf. A 473, 55 (2015).
- (3) M. Saadatfar, J. Barry, D. Weaire, and S. Hutzler, Philos. Mag. Lett 88, 661 (2008).
- (4) N. Pittet, P. Boltenhagen, N. Rivier, and D. Weaire, EPL (Europhysics Letters) 35, 547 (1996).
- (5) S. Tobin, J. Barry, A. Meagher, B. Bulfin, C. O’Rathaille, and S. Hutzler, Colloids Surf. A 382, 24 (2011).
- (6) P. Boltenhagen, N. Pittet, and N. Rivier, EPL (Europhysics Letters) 43, 690 (1998).
- (7) P. Boltenhagen and N. Pittet, EPL (Europhysics Letters) 41, 571 (1998).
- (8) M.A. Lohr, A.M. Alsayed, B.G. Chen, Z. Zhang, R.D. Kamien, and A.G. Yodh, Phys Rev E 81, 040401 (2010).
- (9) L. Fu, C. Bian, C.W. Shields, D.F. Cruz, G.P. López, and P. Charbonneau, Soft Matter 13, 3296 (2017).
- (10) Y. Yin and Y. Xia, J. Am. Chem. Soc. 125, 2048 (2003).
- (11) G. Wu, H. Cho, D.A. Wood, A.D. Dinsmore, and S. Yang, J. Am. Chem. Soc. 139, 5095 (2017).
- (12) H.R. Barzegar, E. Gracia-Espino, A. Yan, C. Ojeda-Aristizabal, G. Dunn, T. Wågberg, and A. Zettl, Csub60/Collapsed Carbon Nanotube Hybrids: A Variant of Peapods (Open Access), Technical report, University of California, Berkeley Berkeley United States (2015).
- (13) A.N. Khlobystov, D.A. Britz, and G.A.D. Briggs, Accounts of chemical research 38, 901 (2005).
- (14) K.S Troche, V.R. Coluci, S.F. Braga, D.D. Chinellato, F. Sato, S.B. Legoas, R. Rurali, and D.S. Galãvo, Nano Letters 5, 349-355 (2005).
- (15) S. Sanwaria, A. Horechyy, D. Wolf, C.Y. Chu, H.L. Chen, P. Formanek, M. Stamm, R. Srivastava, and B. Nandan, Angewandte Chemie International Edition 53, 9090 (2014).
- (16) N. Tanjeem, D.B. H. Wilkin, C. Rycroft, and V. Manoharan, in Bull. Am. Phys. Soc (2018).
- (17) I. Douglass, H. Mayger, T. Hudson, and P. Harrowell, Soft Matter 13 1344 (2017).
- (18) A. Mughal, H.K. Chan, and D. Weaire, Phys Rev Letters 106, 115704 (2011).
- (19) A. Mughal, H.K. Chan, D. Weaire, and S. Hutzler, Phys Rev E 85, 051305 (2012).
- (20) H.K. Chan, Phys Rev E 84, 050302 (2011).
- (21) A. Mughal, Philos. Mag. 93, 4070 (2013).
- (22) L. Fu, W. Steinhardt, H. Zhao, J.E. Socolar, and P. Charbonneau, Soft Matter 12, 2505 (2016).
- (23) A. Mughal and D. Weaire, Phys Rev E 89, 042307 (2014).
- (24) D. Wood, C. Santangelo, and A. Dinsmore, Soft Matter 9, 10016 (2013).
- (25) T. Lee, K. Gizynski, and B.A. Grzybowski, Adv. Mater. 29, 1704274 (2017).
- (26) D.J. Wales and J.P.K. Doye, J. Phys. Chem. A 101, 5111 (1997).
- (27) R.H. Byrd, P. Lu, J. Nocedal, and C. Zhu, SIAM Journal on Scientific Computing 16, 1190 (1995).
- (28) See Supplemental Material on my website for supplemental videos.