-induced reactions on 115In: cross section measurements and statistical model analysis
Abstract
- Background
-
Alpha-nucleus optical potentials are basic ingredients of statistical model calculations used in nucleosynthesis simulations. While the nucleon+nucleus optical potential is fairly well known, for the +nucleus optical potential several different parameter sets exist and large deviations, reaching sometimes even an order of magnitude, are found between the cross section predictions calculated using different parameter sets.
- Purpose
-
A measurement of the radiative -capture and the -induced reaction cross sections on the nucleus 115In at low energies allows a stringent test of statistical model predictions. Since experimental data is scarce in this mass region, this measurement can be an important input to test the global applicability of +nucleus optical model potentials and further ingredients of the statistical model.
- Methods
-
The reaction cross sections were measured by means of the activation method. The produced activities were determined by off-line detection of the -rays and characteristic x-rays emitted during the electron capture decay of the produced Sb isotopes. The 115In()119Sb and 115In(,n)118Sbm reaction cross sections were measured between = 8.83 MeV - 15.58 MeV, and the 115In(,n)118Sbg reaction was studied between = 11.10 MeV - 15.58 MeV. The theoretical analysis was performed within the statistical model.
- Results
-
The simultaneous measurement of the () and (,n) cross sections allowed to determine a best-fit combination of all parameters for the statistical model. The +nucleus optical potential is identified as most important input for the statistical model. The best fit is obtained for the new Atomki-V1 potential, and good reproduction of the experimental data is also achieved for the first version of the Demetriou potentials and the simple McFadden/Satchler potential. The nucleon optical potential, the -ray strength function, and the level density parametrization are also constrained by the data although there is no unique best-fit combination.
- Conclusions
-
The best-fit calculations allow to extrapolate the low-energy (,) cross section of 115In to the astrophysical Gamow window with reasonable uncertainties. However, still further improvements of the -nucleus potential are required for a global description of elastic (,) scattering and -induced reactions in a wide range of masses and energies.
pacs:
24.10.Ht Optical and diffraction models - 25.55.-e 3H,- 3He,- and 4He-induced reactions - 26.30.+k Nucleosynthesis in novae, supernovae and other explosive environmentsI Introduction
I.1 Nucleosynthesis simulations and optical potentials
Isotopes heavier than iron are synthesized by several astrophysical processes at various sites. The bulk of these isotopes are formed by two neutron capture processes: slow neutron capture (s-process) Kap11 and rapid neutron capture process (r-process) Thie11 . However, other processes — such as i-process Cow77 ; Ham17 , p-process Fro06 ; Pru06 the weak r-process Qia07 (or sometimes it referred to as process Mey92 ), or the -process Rau13 , may also contribute to the observed abundance of the chemical elements and their isotopes. The last two processes are particularly relevant for this study, since the predicted abundances depend sensitively on the -nucleus optical potentials which are used to derive the reaction rates. In the following we briefly introduce these astrophysical scenarios.
The most recent supernova simulations showed Hud10 ; Mar12 that the neutrino-driven winds, emitted during the cooling of a neutron star born after a massive star core collapse, are only slightly neutron-rich. As long as the matter — containing mainly protons and neutrons that form particles — is relatively close to the neutron star, the high temperature maintains the abundances in nuclear statistical equilibrium Woo92 . As the wind expands, the temperature and the density decreases and the particles start to combine into heavier nuclei by (,n), (n,), (p,n), and their inverse reactions. While these reactions are in statistical equilibrium, the abundances along a given isotopic chain are determined by the neutron density and the temperature of the environment. The lifetime of the produced isotopes are long relative to the wind expansion and, therefore, decays are playing typically a marginal role only. However, as the temperature drops below about T 4 GK the reactions, that are faster than the -decay of the produced isotopes — such as (,n), (), (p,) and (p,n) — drive the matter towards heavier masses. Under these conditions the nucleosynthesis path remains relatively close to the valley of stability and light neutron-rich species between Fe and Ag can be synthesized Arc11 ; Arc14 ; Moh16 .
On the other side of the valley of stability there are about 35 nuclei separated from the path of the neutron capture processes. These mostly even-even isotopes between 74Se and 196Hg are the nuclei Rau13 . It is generally accepted that the main stellar mechanism synthesizing the nuclei – the process – involves mainly photodisintegrations, dominantly (,n) reactions on preexisting more neutron-rich s and r seed nuclei. The high energy photons – necessary for the -induced reactions – are available in explosive nucleosynthetic scenarios where temperatures around a few GK are reached, like the Ne/O rich layer in core-collapse supernovae Woo78 ; Rau02 or during the thermonuclear explosion of a white dwarf (type Ia supernova) Tra11 . Recent work favors the latter scenario Nis18 ; Tra18 . Under these conditions, consecutive (,n) reactions drive the material towards the proton rich side of the chart of isotopes. As the neutron separation energy increases along this path, (,p) and () reactions become faster and process the material towards lighter elements Rau06 ; Rap06 . Theoretical investigations agree that (,p) reactions are more important for the lighter nuclei, whereas (,) reactions are mainly important at higher masses (neutron number ) Rau13 .
The modeling of these two nucleosynthesis scenarios requires an extended reaction network calculation involving several thousand reactions on mostly unstable nuclei. However, the calculated abundances are very sensitive to the applied reaction rates Rau06 ; Rap06 ; Bli17 ; Moh16 which are derived by folding the reaction cross sections under stellar conditions with the Maxwell-Boltzmann distribution at a given temperature. The cross sections are predicted by the Hauser-Feshbach (H-F) statistical model hf which utilizes global optical model potentials (OMP). The nucleon-nucleus optical potential is in general relatively well known, deviations between predictions calculated with different parameter sets are usually within factor of two, however, the rates calculated using different -nucleus optical potential parameter sets can disagree by even up to an order of magnitude Bli17 ; Kis13 ; Net13 . Typically, the influence of the chosen level density parametrization remains minor, and the -ray strength function mainly affects the (,) cross section but has practically no impact on the (,n) cross sections rauintjmod ; rausensi . Motivated by the process nucleosynthesis, several cross section measurements, mostly on proton-rich isotopes, were carried out in recent years to test the global -nucleus optical potentials Sau11 ; Sch14 ; Gyu14 ; Kis15 (and further references therein).
The aim of the present work is to evaluate the different open-access global and regional -nucleus potentials used in the weak r-process and -process network studies. As target nucleus we choose the 115In nucleus which lies only few mass units above the termination of the weak r process path. This isotope is relatively neutron-rich and furthermore, low energy -induced cross section data on odd-even nuclei is in general scarce. The cross sections of the 115In()119Sb, 115In(,n)118Sbm and 115In(,n)118Sbg reactions were measured and results are compared to theoretical predictions calculated by the TALYS code TALYS . Moreover, the angular distributions of the 115In()115In elastic scattering were measured at energies around the Coulomb barrier recently Kis16 .
This paper is organized as follows. Details on the experimental technique are presented in Sec. II, and the experimental results summarized in Sec. II.6. The experimental data are compared to statistical model calculations in Sec. III with a detailed presentation of the global -nucleus optical potentials in Sec. III.1 and a strict -based assessment in Sec. III.2. The best-fit parameters of 115In are used to predict -induced reaction cross sections for the neighboring nucleus 113In in Sec. IV. Conclusions are drawn in Sec. V. Further details on the statistical model calculations are provided in an Appendix.
II Experimental technique and results
| Nucleus | T1/2 (hour) | Transition | x- and -ray energy (keV) | Relative intensity per decay (%) |
|---|---|---|---|---|
| 118Sbg | 0.06 0.0017 | 1229.3 | 2.5 0.3 | |
| 1267.2+ | 0.52 0.07 | |||
| 118Sbm | 5.00 0.02 | Kα2 | 25.0 | 36.4 1.2 |
| Kα1 | 25.3 | 67.4 2.2 | ||
| 40.8 | 30.2 1.9 | |||
| 253.7 | 99 6 | |||
| 1050.7∗ | 99 5 | |||
| 1229.7∗ | 99 5 | |||
| 119Sb | 38.19 0.22 | Kα2 | 25.0 | 21.0 0.5 |
| Kα1 | 25.3 | 38.9 0.9 | ||
| 23.9 | 16.5 0.2 |
The element indium has two stable isotopes: 113In and 115In, with natural abundances of 4.29 0.04 % and 95.71 0.04 %, respectively NNDC_Sb . Alpha capture and alpha-induced reactions on 115In lead to unstable Sb isotopes, therefore, the cross sections can be measured using the well-established activation method. However, the half-lives of the reaction products range from 3.6 min to 1.6 days and consequently two different counting setups were used in the present work to determine the reaction cross sections. Moreover, the (,n) reaction on 115In populates the ground (T1/2 = 3.6 min) and isomeric (T1/2 = 5.0 h) states in 118Sb. The isomeric state decays directly to 118Sn without internal transition to the ground state. The decay parameters of the reaction products are summarized in Table 1. In the following chapters a detailed overview on target production and on the counting setups will be given.
II.1 Target preparation and characterization
Altogether twelve targets were prepared by vacuum evaporation of natural isotopic composition, high chemical purity (99.99%) indium onto 2-2.5 m thick Al backings and 0.5 mm thick Ta disks. During the evaporation, the backings were fixed in a holder placed 12 cm above the Ta evaporation boat. Due to the large distance between the evaporation boat and the backing it can be assumed that the surface of the targets is uniform. This assumption was checked by measuring the absolute target thickness at several spots using the Rutherford Backscattering Spectroscopy (RBS).
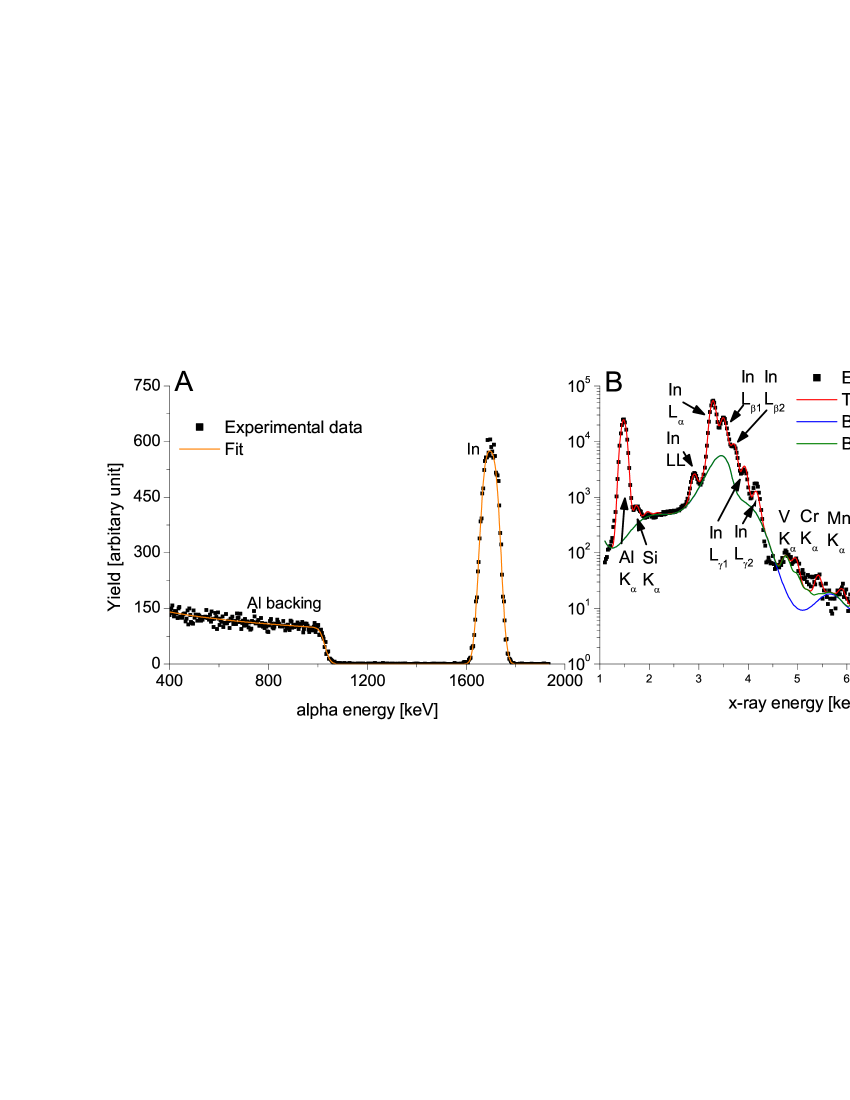
The RBS measurements were performed using the Oxford-type Nuclear Microprobe Facility at Atomki, Debrecen, Hungary Hus16 . The energy of the 4He+ beam provided by the Van de Graaff accelerator of Atomki was 1.6 MeV and 2 MeV. Two Silicon surface barrier detectors (50 mm2 sensitive area and 18 keV energy resolution) were used to measure the yield of the backscattered ions, one of them was placed at a scattering angle of 165∘ (Cornell geometry) and the other one was set to 135∘ (IBM geometry). A typical RBS spectrum can be seen in Fig. 1 A. The uncertainty of the target thickness determination carried out with the RBS technique is 3.0% Hus16 .
The precise knowledge of the target (and backing) impurities is also of crucial importance, because alpha-induced reactions on low mass impurities could poison the measured gamma spectra. To characterize the targets, the well-known particle induced x-ray emission (PIXE) technique was used pixe , too. The energy and the intensity of the proton beam provided by the Van de Graaff accelerator of Atomki was 2 MeV and 1 nA, respectively. A detailed description of the setup used can be found in Ker10 . A typical PIXE spectrum can be seen in Fig. 1 B. The following impurities were found in the targets and in the backing used for the alpha-induced cross section measurements (below 1 ppm): Si, V, Cr, Mn, Ni, Zn and Ga, and (below 10 ppm) Fe. We assigned 4.0 % uncertainty to the target thicknesses derived with the PIXE technique pixe .
The absolute target thicknesses were found to be within 4.48 x 10¹⁷ and 2.28 x 10¹⁸ atoms/cm2, the maximum deviation between the thicknesses determined by RBS and PIXE techniques were 4%. Furthermore, the uniformity of the targets was checked by measuring the backscattering alpha yield at several spots, the maximum difference was found to be less than 2.7%. Therefore, as a conservative estimate, 4.8 % has been adopted as the uncertainty of the target thickness.
II.2 Irradiations
The In targets were irradiated with beams from the MGC20 cyclotron of Atomki. The beam energies were in the range of 9.15 and 16.15 MeV, covered in steps of about 0.5-1.15 MeV. After the beam-defining aperture, the chamber was insulated and a secondary electron suppression voltage of -300 V was applied at the entrance of the chamber. The typical beam current was between 0.6 A and 0.8 A, and the length of each irradiation was between 0.25 h and 20 h, corresponding to about 1.6 x 10¹⁵ and 1.2 x 10¹⁷ total incident particles. Due to the short half-life of the produced 118Sbg isotope, shorter irradiations were used to determine the 115In(,n)118Sbg reaction cross sections and longer ones to measure the radiative alpha capture and the 115In(,n)118Sbm reaction cross sections. During the irradiation, a Si ion-implanted detector — built onto the wall of the irradiation chamber at 165∘, with respect to the beam direction — was used to monitor the targets. Several beam tests were performed to check the target stability before the experiment. These tests showed that there is no deterioration, if the beam current is less than 1 A. The current integrator counts were recorded in multichannel scaling mode to take into account the changes in the beam current. The scaler stepped channel in every 10 sec. (in the case of the short irradiations) or 1 min. (in the case of the irradiations aiming the measurement of the 115In(,n)118Sbm reaction cross sections).
II.3 Determination of the absolute detection efficiencies
Three High Purity Germanium (HPGe) detectors were used to measure the yield of the emitted rays: a 100% relative efficiency coaxial HPGe (Det1), a 100% relative efficiency HPGe placed in low background shielding (Det2) and a Low Energy Photon Spectrometer (LEPS) equipped with a 4 multi-layer shielding including an inner 4 mm thick layer of copper, a 2 mm thick layer of cadmium, and an 8 cm thick outer lead shield Szu14 . To determine the cross section of the radiative alpha capture and the 115In(,n)118Sbm reactions the LEPS and Det2 were used. Det1 was used solely to study the 115In(,n)118Sbg reaction.
The distance between the source and the detector end cap during the countings carried out with the LEPS detectors was 3 cm. To determine the efficiency the following procedure was used: first the absolute detector efficiency was measured at 15 cm distance from the surface of the LEPS detector using 57Co, 133Ba, 152Eu, and 241Am calibrated sources. At such large distance the so-called true coincidence summing effect is negligible. Then, the activity of several 115In targets — irradiated at 13 MeV, 14 MeV, 15 MeV and 16.15 MeV — were measured in both close (3 cm) and far (15 cm) geometries. Taking into account the time elapsed between the two countings, a conversion factor of the efficiencies between the two geometries could be determined and used henceforward in the analysis. To limit the possible systematic uncertainty of our data, the activity of a few irradiated samples were measured using Det2, too. These countings were performed solely in far geometry: the targets were placed 27 cm away from the end cap of the detector.
The absolute detector efficiency of Det1 and Det2 was derived in far geometry by using 60Co and the aforementioned sources. To determine the far-to-close geometry conversation factor for Det1, three 115In targets were irradiated at 16.15 MeV and the emitted yields were measured with the detector in far geometry. After 3 hours of waiting time the irradiations and countings were repeated for each target, however, this time the detector was positioned into close geometry. The waiting times and the lengths of the irradiations were the same. The difference in the number of impinging particles were below 1.4% and this factor was taken into account by using the multichannel scaling spectrum. After subtracting the contribution to the yield of the 1229.3 keV line originated from the decay of the 118Sbm, the ratio of the number of ’s measured in the same time interval at far and close distances correspond to the ratio of the far and close efficiencies. This approach was repeated for all three samples counted at both far and close geometry and an efficiency conversation factor was determined.
II.4 Gamma counting with Det1
The half-life of the produced 118Sbg is only 3.6 min, therefore, our usual approach - described e.g. in Yal09 - cannot be used. Instead, we placed Det1 in the experimental hall near the irradiation chamber and kept there for the cross section measurement. After the irradiations, 0.5 min waiting time was used in order to let short-lived activities decay which would impact the quality of the measurement. The duration of the countings were about 45 min in case of each irradiation.
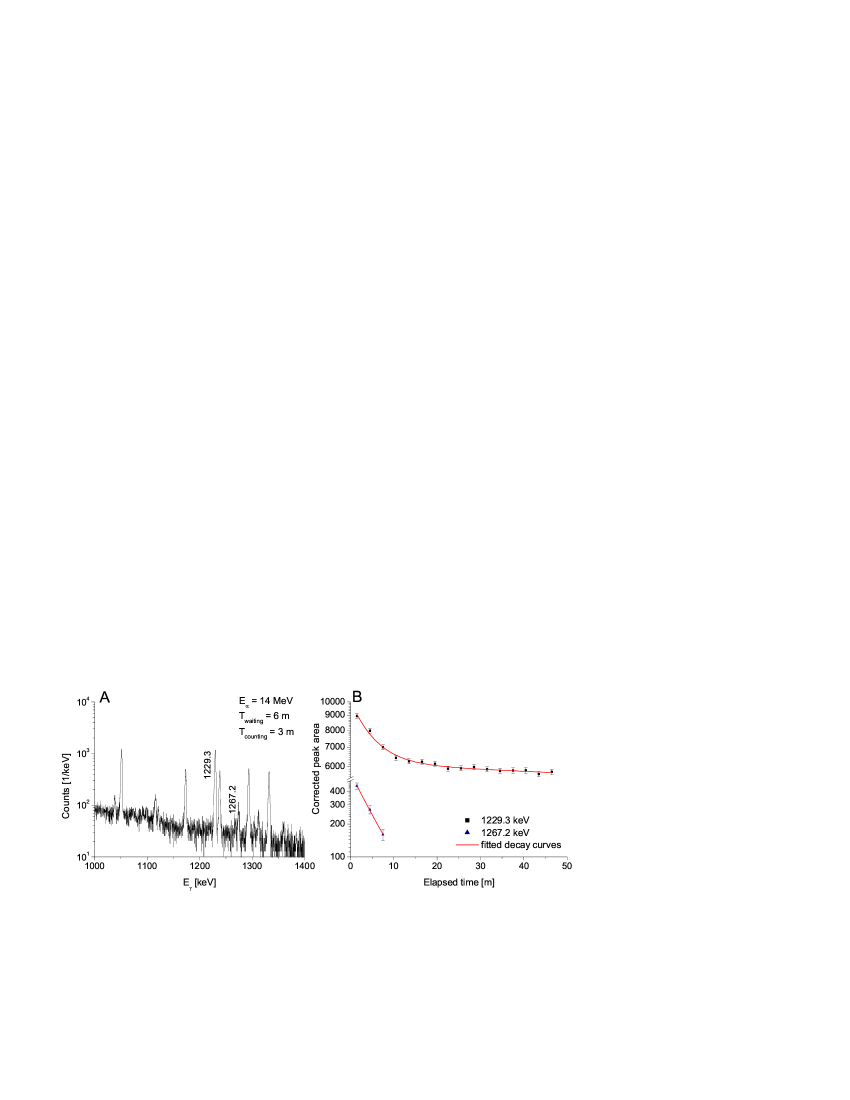
The produced 118Sbg decays via the emission of several weak -rays with relative intensities below 2.5%. To determine the reaction cross section the yield of the Eγ = 1229.3 keV -ray was measured using Det1. However, the 1229.3 keV ray does not belong solely to the decay of the 118Sbg, a similar energy (Eγ = 1229.7 keV) -ray is emitted also after the electron capture decay of the 118Sbm. Therefore, to disentangle the two different reaction channels, each counting lasted for at least 45 min (the spectra was stored in every min.) and the measured yields as the function of elapsed time was fitted with the sum of two exponential functions with known half-lives. Above Eα = 14 MeV the yield of the emitted 1267.2 keV -ray was sufficient for the cross section determination, too. Figure 2 shows a typical spectrum (A) measured with Det1 and on the right side the decay curve (B) of the transitions used to determine the 115In(,n)118Sbg reaction cross sections. It has to be mentioned that the cross sections based on the counting of the 1229.3 keV and 1267.2 keV -rays were always within their statistical uncertainties.
II.5 Gamma counting performed using the Low Energy Photon Spectrometer
The characteristic x-ray and radiation emitted during the electron-capture decay of the produced 119Sb and 118Sbm isotopes was measured using a LEPS.
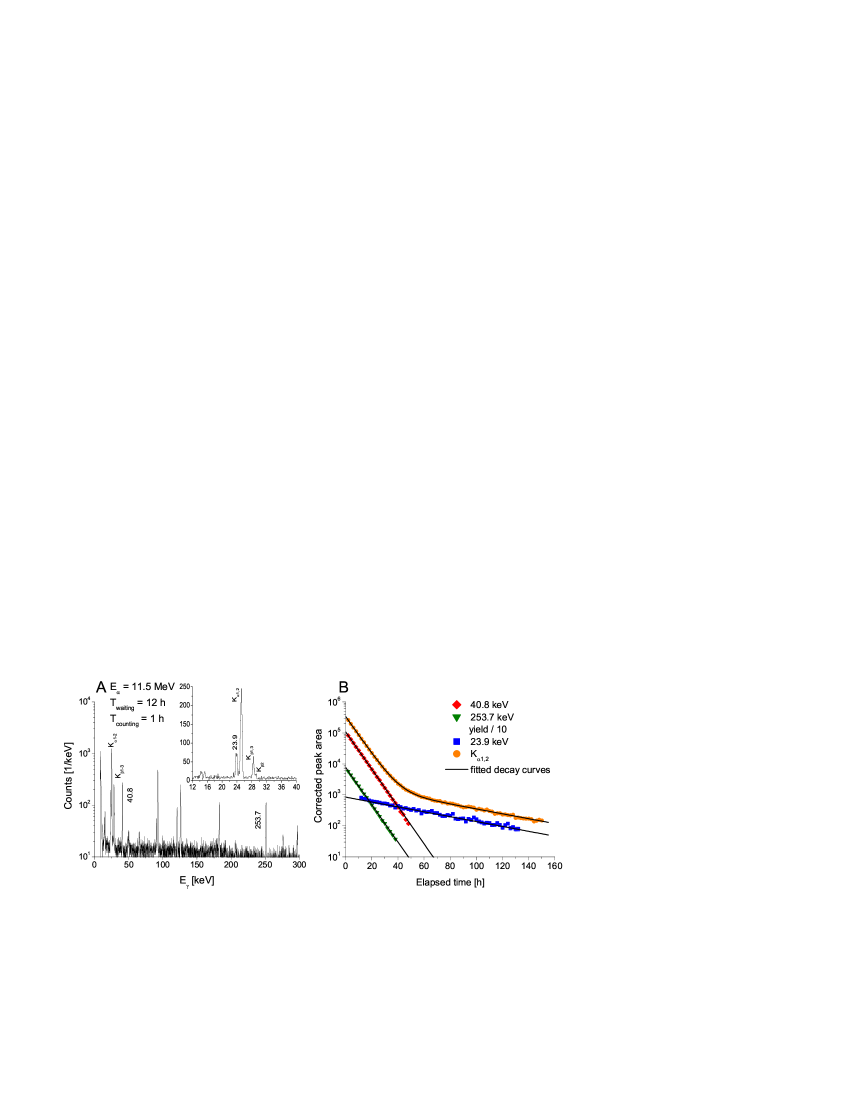
The countings were started typically 2 h after the end of the irradiation and lasted for 100 to 200 h. During the counting the spectra were stored regularly (every hour) to follow the decay of the reaction products. Figure 3 shows typical spectra measured with the LEPS detector (A) and the decay curve of the -rays emitted during the -decay of the produced Sb reaction products (B). In the case of all irradiated samples the source activities have been determined using the - and characteristic x-ray transitions listed in Table 1, consistent results were obtained and their statistical uncertainty weighted averages were adopted as the final results.
| Elab (MeV) | Ec.m. (MeV) | 115In()119Sb cross section (barn) | 115In(,n)118Sbm cross section (mbarn) | 115In(,n)118Sbg cross section (mbarn) |
|---|---|---|---|---|
| 9.15 | 8.83 0.04 | 0.89 0.11 | 0.002 0.0003 | |
| 9.63 | 9.28 0.06 | 2.36 0.25 | 0.009 0.001 | |
| 9.96 | 9.61 0.05 | 3.7 0.4 | 0.018 0.0018 | |
| 10.50 | 10.14 0.04 | 10.0 0.9 | 0.080 0.008 | |
| 11.50 | 11.10 0.05 | 37 3.5 | 0.78 0.08 | 2.57 0.57 |
| 12.00 | 11.59 0.04 | 66 6.7 | 2.22 0.23 | 7.16 1.85 |
| 13.00 | 12.54 0.06 | 145 13 | 6.85 0.66 | 31.6 5.3 |
| 14.00 | 13.49 0.07 | 295 31 | 24.1 2.3 | 91.4 15.0 |
| 15.00 | 14.48 0.08 | 431 39 | 70.2 7.1 | 165 36 |
| 16.15 | 15.58 0.08 | 470 41 | 104 10.8 | 267 44 |
To determine the cross section of the 115In()119Sb reaction, at first the 23.9 keV transition was used. In the case of the 115In(,n)118Sbm reaction, the yield of the 40.8 keV and 253.678 keV transitions were measured using the LEPS.
The activity of the samples irradiated at Ec.m. = 14.48 and 15.58 MeV was derived also using Det2. To determine the cross section of the 115In(,n)118Sbm the yield of the 1050.7 and 1229.7 keV rays were measured in far geometry. The resulted cross sections were within the statistical uncertainty compared to the ones derived using the LEPS. Furthermore, the yield of the characteristic x-ray transitions were used also to derive the cross sections using the procedure described below.
The energies of the emitted characteristic x-ray Kα1,2 lines are 25.0 and 25.3 keV, respectively. Because of the resolution of the LEPS detector is typically between 400 eV (for a 5.9 keV line) and 680 eV (for a 122 keV ray), in the x-ray spectra it is not possible to distinguish between Kα1 and Kα2 transitions. Instead, the sum of the emitted characteristic x-rays was used for the analysis. At the beginning of the counting the characteristic x-ray yield is dominated by the decay of the 118Sbm nuclei, however, after about 2 days (depending on the beam energy) in the x-ray peaks the decay of the 119Sb becomes dominant. We fitted the characteristic x-ray decay curve with a sum of two exponentials with the known half-lives to derive the number of reaction products. The agreement between the alpha-induced cross sections based on the - and x-ray counting were within 4%, better than the independent uncertainties of the two values.
II.6 Cross section results
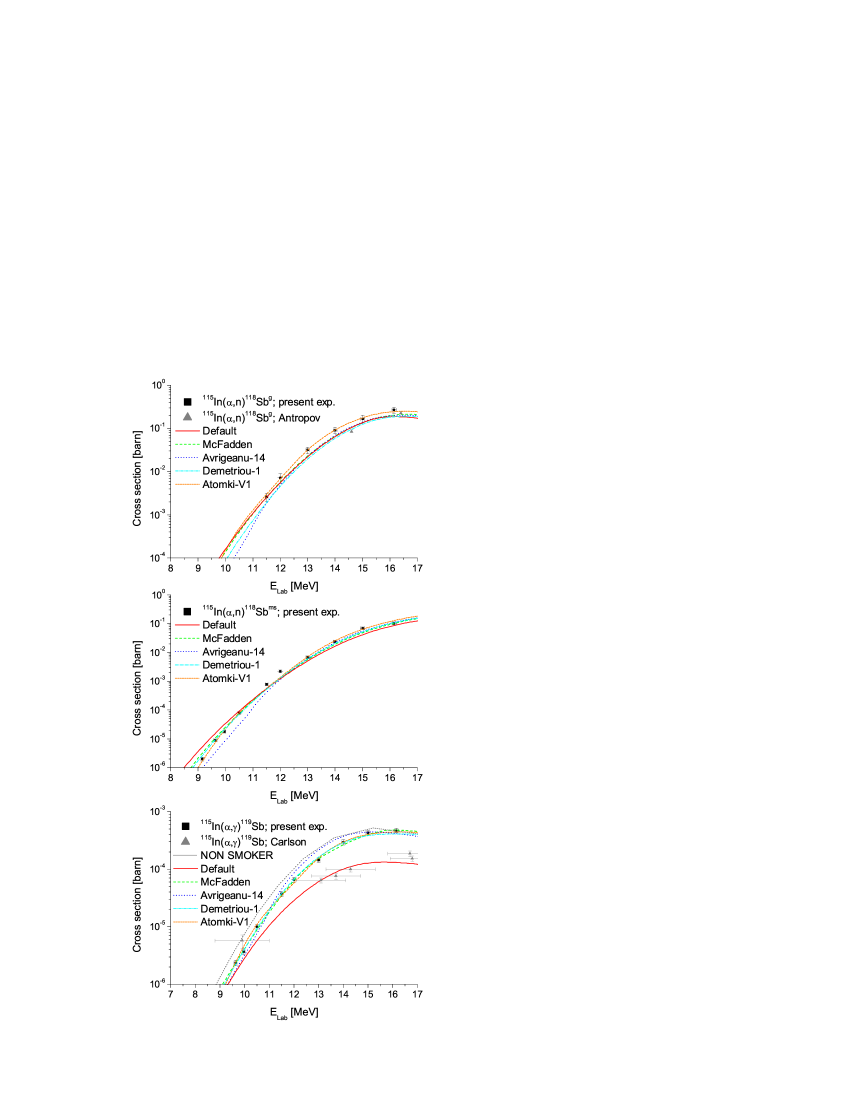
The final results of the present study are listed in Table 2, and a comparison to statistical model calculations using the codes TALYS TALYS and NON-SMOKER non is shown in Fig. 4. The quoted uncertainty in the Ec.m. values corresponds to the energy calibration of the alpha beam and to the uncertainty of the energy loss in the target, which was calculated using the SRIM code SRIM . Several irradiations were repeated, in these cases the cross sections were derived from the averaged results of the irradiations weighted by the statistical uncertainty of the measured values. The uncertainty of the cross sections is the quadratic sum of the following partial errors: efficiency of the detectors determined at far geometry (5% for all detectors), close geometry efficiency correction factor (0.8% for the LEPS and 2.2% for Det1 and Det2), number of target atoms (4.8%), current measurement (3%), uncertainty of decay parameters ( 6%), and counting statistics (0.5% - 16.8%).
II.7 Experimental data from literature
The cross section of the 115In()119Sb reaction was measured by Carlson et al., in the middle of the 1960‘s Car67 using radio-chemical techniques and NaI(Tl) detectors. The few mg/cm2 115In targets were made using the Zapon painting technique Zap52 and the thicknesses were determined with an estimated 10% accuracy by weight and area measurements. The errors of the Ec.m. — shown in Fig. 4 — are the sum of the 500 keV initial energy spread of the cyclotron beam and the energy straggling in the foil stacks. The cross section of the 115In(,n)118Sb and 115In(,2n)117Sb was measured by A. E. Antonov Ant91 between 14.6 MeV Elab. 24.1 MeV (slightly above the region covered by our experimental data) and 16.4 MeV Elab. 23.0 MeV, respectively. Unfortunately no refereed publication on the measurement is available, the data were published solely in a conference proceedings. Furthermore the cross sections were measured only at very few (7 and 5) energies and information on the Elab. uncertainties is not available in Ant91 . For completeness both the () and (,n) data of Car67 and Ant91 are shown in Fig 4, however, their precision is not at the required level and, therefore, we omit these data from the detailed analysis presented in the following chapters.
III Statistical model calculations
In general, the -nucleus OMP is identified as the most important ingredient for the statistical model calculations (see Sec. III.2 below) because it defines the total -induced reaction cross section . Therefore we start with a presentation of -OMPs which are widely used for the calculation of low-energy reaction cross sections. These potentials are included in the statistical model code TALYS (V. 1.8) except the Atomki-V1 potential Moh_ADNDT . As the source code of TALYS is available, the Atomki-V1 potential was implemented as an additional option. However, in Fig 4 for completeness the () cross section predictions, calculated with the widely used NON SMOKER code non is plotted, too. While this code provides good description at high energies, in Fig 4 it is clearly shown that toward lower energies the discrepancy between the experimental data and the predictions are increasing reaching roughly a factor of two at the lowest measured cross sections.
III.1 Global -nucleus optical potentials and the new experimental data
In the framework of the weak r process and process network calculations a large number of reactions involving — either in the entrance or in the exit channel — -particles has to be taken into account. As the path of these processes is located in a region of unstable nuclei experimental data are practically not available to adjust the parameters of the +nucleus potential. Therefore, a global +nucleus optical potential is required for the theoretical prediction of reaction cross sections. Several different parameter sets for the optical potential exist, giving very different predictions for reaction cross sections in particular at very low energies far below the Coulomb barrier Kis13 ; Bli17 . In the following we will compare the predictions calculated using well known or recent open access global potentials to the experimental results. The reaction and scattering cross section calculations were performed using the TALYS code (version 1.8) TALYS with an extension for the Atomki-V1 potential.
() The optical model potential calculations within TALYS are performed with ECIS-2006 ECIS using a default OMP based on a simplification of the folding approach of Watanabe Wat58 . (Note that this default choice for the -OMP in TALYS will change to Avr10 ; Avr14 in later versions.)
() Elastic scattering experiments at Eα=24.7 MeV on nuclei ranging from O to U were performed in the middle of the 1960’s and a consistent optical potential study was carried out. This study resulted in the widely used global -nucleus optical model potential of McFadden and Satchler Mcf . The potential itself is very simple, it consists of a 4-parameter Woods-Saxon potential with mass- and energy-independent parameters. Due to its simplicity this potential is used as default for the H-F calculations of astrophysical reaction rates in the widely used NON-SMOKER code Rau00 ; Rau01 .
() The real part of the potential of Demetriou, Grama and Goriely Dem02 is described in the framework of the double-folding model of Kobos et al. Kob84 . While the shape of the potential is directly described by the double-folding procedure, its strength is adjusted according to the available experimental data. A simple Woods-Saxon form is used to describe the imaginary part of the optical model potential, however, three different parameter sets are introduced. Namely, potential I consists of a volume term only, potential II combines a volume and surface component and finally, potential III, the “dispersive optical model” relates the real and imaginary part of the optical model potential through the dispersion relation. We found that — among the Dem02 potentials — model I provides the best description for the cross sections and angular distributions, therefore we show in Fig. 4 and Fig. 5 only the results calculated using this OMP.
() The -nucleus optical potential of M. Avrigeanu et al. Avr10 was obtained by fitting elastic particle scattering angular distributions and reaction cross sections on nuclei with masses between 45 A 209 and for E 50 MeV. The potential consists of Woods-Saxon parametrizations for both the real and the imaginary parts. The real part is characterized by three parameters (depth V0, radius RR and diffuseness aR), the imaginary part is described using the sum of volume and a surface potential, determined by 6 parameters (WV, RV, Av; WS, RS, aS) Avr10 . All of nine parameters are mass and energy dependent this way this potential provides an excellent description for both the reaction and scattering data. However, it has to be emphasized that the extrapolation of a many-parameter potential into the region of unstable nuclei may lead to additional uncertainties in the calculation of astrophysical reaction rates. An updated version of this potential was published recently Avr14 and this modified potential is used in the present study.
() Several elastic scattering experiments on the target nuclei 89Y, 92Mo, 106,110,116Cd, 113,115In, 112,124Sn, and 144Sm have been performed at Atomki in recent years Kis09 ; Ful01 ; Kis06 ; Orn15 ; Kis11 ; Kis13 ; Kis16 ; Gal05 ; Moh97 . Based solely on these high precision elastic scattering data, a new few-parameter global optical potential parametrization — so-called Atomki-V1 — has been suggested in Moh_ADNDT . The geometry of the energy-independent real part of the potential is determined using the folding procedure. The imaginary part of the potential is described by surface Woods-Saxon potential with energy-independent radius and diffuseness parameters. This potential gives a correct prediction for the total -induced reaction cross sections Moh_tot and, furthermore, the very few adjustable parameters avoid contingent problems which may appear in the extrapolation of many-parameter potentials for unstable nuclei.
III.2 -based assessment of the calculations
The cross section of an (,) reaction in the statistical model depends on the total transmission coefficients into the open channels. (Note that the total transmission and average width for a particular channel are closely related, see e.g. Eq. (64) and Eq. (65) in rauintjmod ; rausensi ):
| (1) |
with the branching ratio into the exit channel . The strict application of Eq. (1) does not take into account a preequilibrium contribution. This choice will be discussed later.
In the case of -induced reactions on 115In at energies sufficiently above the neutron-threshold, we find that and rausensi . Consequently, is essentially defined by the potential, and experimental data can be used to constrain the potential. As soon as is fixed, provides a constraint for the ratio but it is not possible to determine or individually. The experimental data close above the (,n) threshold provide some information on .
Note that the result from the sum over all energetically accessible final states in the respective channel. In practice, this sum is typically composed of the several known low-lying states which are considered explicitly plus the contributions of high-lying states which are calculated from a level density parametrization.
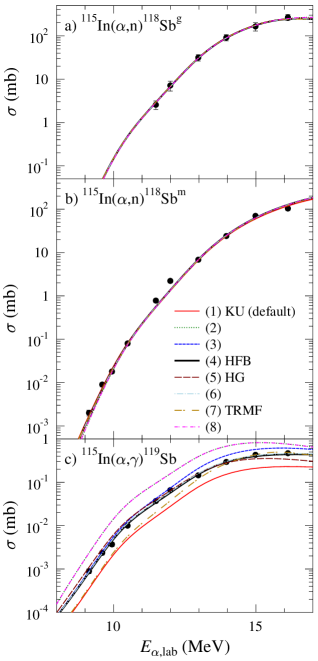
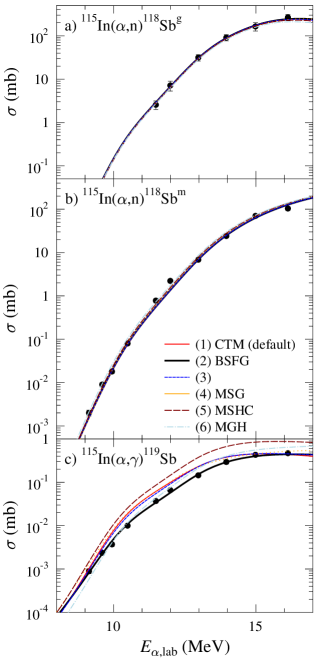
Consequently, the calculated reaction cross sections depend on four physical input parameters which are the -nucleus potential (see above), the nucleon-nucleus potential, the -ray strength function (composed of E1 and M1 components), and the level density. TALYS TALYS provides 8 different options for the -potential which is the basic ingredient for the calculation of (,) cross sections. In addition, we have implemented the Atomki-V1 potential in TALYS, and we have used scaling factors between 0.7 and 1.2 for the Demetriou potential as suggested by Sch16 .
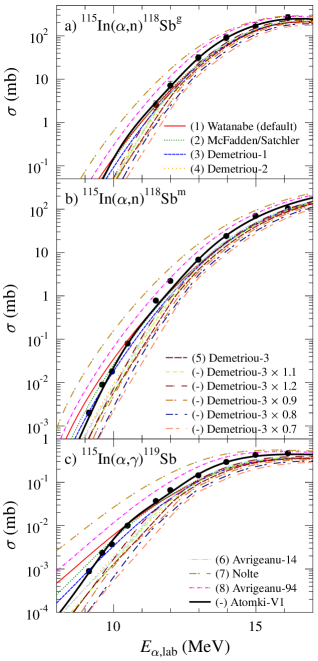
For a -based assessment of the TALYS inputs, excitation functions for the 115In()119Sb, 115In(,n)118Sbg, and 115In(,n)118Sbm reactions were calculated from all combinations of the TALYS input parameters. In total, from the 6720 combinations of input parameters values (all are given per point in the following) between 1.7 and more than 30000 were found, corresponding to average deviation factors (fdev in the following) between 1.12 in the best cases and up to a factor of about 6 in the worst cases. Details of this procedure are given in Mohr17 .
In general, the best description of all reaction cross sections is obtained with from the Atomki-V1 potentials. Slightly increased are achieved from the first version of the Demetriou potentials (Dem-1) and from the simple McFadden/Satchler potential. The other -potentials show best fits of or higher. Surprisingly, this holds also for the latest potential of Avrigeanu et al. Avr14 which provides an excellent description of the 115In(,)115In elastic scattering data (see Sec. III.3). Besides the total for all reaction channels, we now investigate also the different exit channels separately.
The 115In(,n)118Sbg data can be described very well in their restricted energy range with () using the Atomki-V1 potential. Several other potentials reach small (): these values are achieved from several versions of the Demetriou potentials, the McFadden/Satchler potential, the Avrigeanu potential, and the Watanabe potential. Contrary to the excellent reproduction of the ground state contribution, the 115In(,n)118Sbm isomer production cannot be described over the whole energy range with a similar precision: the best description with and is found for the Atomki-V1 potential; slightly worse numbers ( and ) are obtained for the Dem-1 and the McFadden/Satchler potentials.
Because of the sensitivity of the 115In()119Sb cross section to a combination of input parameters, it is not possible to constrain any particular parameter from the ,) data alone. Several combinations of parameters (including combinations with overall very poor values reaching values above 100!) are able to reproduce the (,) data alone with . The best combinations of input parameters are able to reach and ; the corresponding -nucleus potentials are the McFadden/Satchler and the Dem-2 potentials.
Obviously, it is impossible to include all 6720 excitation functions for presentation in Fig. 4. The following selection of excitation functions is labeled in Fig. 4 by the most important ingredient which is the -nucleus OMP. These examples are also summarized in Table 3.
| parameters | all reactions | (,) | (,n)-gs | (,n)-iso | |||||||
|---|---|---|---|---|---|---|---|---|---|---|---|
| -OMP | nucleon-OMP | -ray strength | level density | ||||||||
| WAT 111TALYS default | KD 11footnotemark: 1 | KU 11footnotemark: 1 | CTM 11footnotemark: 1 | 307.8 | 1.89 | 785.5 | 3.03 | 2.1 | 1.33 | 13.7 | 1.54 |
| Atomki-V1 222overall best-fit | JLM0-B 22footnotemark: 2 | HFB 22footnotemark: 2 | BSFG 22footnotemark: 2 | 1.7 | 1.12 | 0.8 | 1.08 | 0.1 | 1.07 | 3.4 | 1.19 |
| Dem-1 | JLM2-BG | HG | MGH | 2.8 | 1.23 | 0.8 | 1.07 | 3.2 | 1.50 | 4.7 | 1.24 |
| McF | JLM1-BG | TRMF | MSG | 3.3 | 1.21 | 0.8 | 1.08 | 1.7 | 1.27 | 6.8 | 1.31 |
| AVR | JLM3-BG | HG | MSHC | 9.7 | 1.45 | 6.8 | 1.25 | 2.1 | 1.38 | 17.2 | 1.75 |
| -OMPs: Watanabe: WAT Wat58 ; Atomki-V1 Moh_ADNDT ; Demetriou: Dem-1 Dem02 ; McFadden/Satchler: McF Mcf ; Avrigeanu: AVR Avr14 . | |||||||||||
| nucleon-OMPs: Koning-Delaroche: KD Kon03 ; Jeukenne-Lejeune-Mahaux-Bauge: JLM0-B Bau01 ; Jeukenne-Lejeune-Mahaux-Bauge-Goriely: JLM2-BG Bau01 ; Gor07 ; Jeukenne-Lejeune-Mahaux-Bauge-Goriely: JLM1-BG Bau01 ; Gor07 ; Jeukenne-Lejeune-Mahaux-Bauge-Goriely: JLM3-BG Bau01 ; Gor07 . | |||||||||||
| strengths: Kopecky-Uhl: KU Kop90 ; Hartree-Fock-Bogolyubov: HFB Gor04 ; Hybrid-Goriely: HG Gor98 ; Temperature-dependent Relativistic Mean Field: TRMF Cap09 . | |||||||||||
| level densities: Constant Temperature Model: CTM Gil65 ; Back-Shifted Fermi Gas: BSFG Dilg73 ; Microscopic Gogny Hilaire: MGH Hil12 ; Microscopic Skyrme Goriely: MSG Gor01 ; Microscopic Skyrme Hilaire Combinatorial: MSHC Gor08 . | |||||||||||
() The result from the TALYS default parameters is based on the early -nucleus OMP by Watanabe Wat58 . The default calculation provides reasonable description of the (,n) data, but the energy dependence of the isomer cross section is not well reproduced. This holds also for the (,) data which are significantly underestimated at higher energies. This clearly points to a deficiency of the default -OMP, the default -ray strength function and/or the default level density. Interestingly, by accident the default calculation matches the earlier ,) data of Carlson et al. Car67 which are much lower than the present results.
() The overall best-fit calculation is obtained from a combination of the Atomki-V1 -OMP Moh_ADNDT , a JLM-type (Jeukenne, Lejeune, and Mahaux, e.g. JLM ) nucleon OMP in the version of Bauge et al. Bau01 (so-called “jlmmode 0”), the microscopic Hartree-Fock Bogolyubov E1 -ray strength function of Goriely Gor04 , the M1 -ray strength normalized to the E1 strength (TALYS default), and the back-shifted Fermi gas level density Dilg73 .
() Among the different versions of the Demetriou potentials Dem02 , including scaling factors between 0.7 and 1.2 for the third version, the first version (Dem-1) shows the best agreement with the experimental data in combination with again a JLM type nucleon OMP, now of so-called “jlmmode 2” Bau01 ; Gor07 , and the microscopic level density by Hilaire Hil12 . In general, the (,n) cross sections are slightly underestimated. In the ,) channel these relatively low cross sections from the Dem-1 potential can be compensated by a larger E1 strength using Goriely’s hybrid model Gor98 .
() The best result for the McFadden/Satchler potential describes the experimental data with the same quality as the above Dem-1 potential. It is obtained in combination with a JLM-type nucleon OMP (“jlmmode 1”) Bau01 ; Gor07 , the microscopic level density from Skyrme forces Gor01 , and the temperature-dependent relativistic mean-field E1 strength Cap09 . It may be noted that a special combination of the McFadden/Satchler potential with the other parameters close to the above Atomki-V1 best-fit provides the best description of the (,) channel with and an average deviation of only 5%.
() The potential by Avrigeanu et al. Avr14 shows a stronger energy dependence than the other potentials under study. This leads to a better reproduction of the ,n) cross sections to the ground state at higher energies, but significant underestimation for the isomeric (,n) cross sections in particular at lower energies. For the (,) channel a similar behavior is found with relatively poor and an increasing underestimation towards lower energies; the E1 strength is here taken from the hybrid model Gor98 . Overall, the Avrigeanu potential is only able to reach although this potential provides the best description of the elastic scattering data (see Sec. III.3).
Summarizing the above findings and applying the criterion (as discussed in detail in Mohr17 ), the new experimental data select the Atomki-V1 potential for the -OMP, but different parameter combinations of nucleon-OMP, -ray strength function, and level density reach the above criterion. In addition, the -OMPs by Demetriou (Dem-1) and McFadden/Satchler remain very close to the above criterion. The results from these -OMPs are also taken into account in the following estimation of the (,) cross section at astrophysically relevant low energies.
A more detailed study of sensitivities to the different ingredients of the statistical model calculations is given in the Appendix A. From that study it can be concluded that the -OMPs by Avrigeanu et al. in their earlier version Avr94 and by Nolte et al. Nol87 are not able to reproduce the present experimental data for 115In with reasonable . This finding is not very surprising as these potentials have been optimized mainly at higher energies.
For the prediction of -induced reaction cross sections at lower energies and a discussion of the resulting uncertainties we select the astrophysically relevant energy range, i.e. the classical Gamow window energies for stellar temperatures of two and three billion degree ( and 3) which are and 8.47 MeV in the center-of-mass system. Table 4 lists the extrapolated cross sections calculated using the different -OMPs. At the lower energy MeV only the proton and channels are open; the neutron channel opens at about 7.2 MeV.
| potential | E0 = 6.46 MeV | E0 = 8.47 MeV | ||||||||
|---|---|---|---|---|---|---|---|---|---|---|
| (,) | (,n)-gs | (,n)-iso | (,p) | (,) | (,n)-gs | (,n)-iso | (,p) | |||
| Watanabe Wat58 333with TALYS default settings | 15.5 | 15.4 | 0.06 | 11530 | 380 | 9140 | 2000 | 7 | ||
| Atomki-V1 Moh_ADNDT | 1.3 | 1.3 | pb | 3740 | 370 | 2930 | 440 | 3.6 | ||
| Demetriou-I Dem02 | 3.5 | 3.5 | pb | 5100 | 480 | 3770 | 850 | 7.5 | ||
| McFadden Mcf | 6.5 | 6.5 | 0.01 | 7730 | 570 | 6090 | 1060 | 7.1 | ||
| Avrigeanu Avr14 | 0.8 | 0.8 | pb | 2520 | 370 | 1850 | 290 | 2.6 | ||
At the upper energy of 8.47 MeV, the total cross section is relatively well-constrained around 400 nb from the Atomki-V1 potential with the smallest overall , but also the Demetriou and McFadden/Satchler potentials provide values around 500 nb. Even the TALYS default calculation and the result from Avrigeanu lead to the same values around 400 nb. Thus, at the upper energy of 8.47 MeV, the (,) cross section is well constrained by the new experimental data with an uncertainty of about 25%.
At the lower energy of 6.46 MeV, the total cross section is constrained between 1.3 and 6.5 nb, i.e. by a factor of about 5. The total cross section is dominated by the (,) channel with very minor contributions of the order of pico-barns for the (,p) channel. The Atomki-V1 potential with its smallest predicts the small cross section of 1.3 nb whereas the Demetriou and McFadden/Satchler potentials predict higher cross sections of 3.5 nb and 6.5 nb. The TALYS default calculation clearly overestimates the cross section with 15.5 nb, but interestingly the Avrigeanu potential with its larger leads to a prediction of 0.8 nb, only slightly lower than the best-fit prediction from the Atomki-V1 potential. Combining the above findings, we recommend a cross section of about nb at 6.46 MeV.
It has to be noted that the new experimental data are the prerequisite to obtain the well-constrained cross sections of the (,) reaction of 400 nb % at 8.47 MeV and nb at 6.46 MeV. Without the -assessment of the theoretical predictions, the range of predicted cross sections is much larger. At the upper energy of 8.47 MeV, the predictions from the different TALYS input parameters vary over more than two orders of magnitude between 8 nb and 2.6 b, and at the lower energy the range is even larger with more than three orders of magnitude between 0.06 nb and 100 nb. This wide range of predictions results not only from uncertainties of the -OMP, but also from the chosen combination of the nucleon-OMP, the -ray strength function, and the level density parametrization.
Finally, the relevance of preequilibrium reactions has to be discussed. In the above calculations, the preequilibrium contribution was neglected. Including preequilibrium leads to several findings and problems. An initial assessment including the preequilibrium contribution provided values with a minimum of about 3.4, i.e. a factor of two worse than the above results without preequilibrium. Consequently, the preequilibrium contribution (as provided in TALYS) cannot be considered as reliable in the present case and was therefore neglected in the above analysis.
The preequilibrium cross sections in TALYS are taken from an exciton model. The results show a significant (,p) contribution at very low energies which can be very close to the total reaction cross section ; e.g., at 6.46 MeV about 90% of the total reaction cross section go to the (,p) channel. As a consequence, the preequilibrium calculations turned out to be numerically very delicate. Because the (,) cross section at low energies is essentially given by the difference between the total reaction cross section and the (,p) cross section, and the latter is dominated by the preequilibrium contribution, the (,) cross section becomes extremely sensitive to the calculated (,p) preequilibrium cross section. The default resolution of the TALYS energy grid had to be improved by a factor of 10 to obtain numerically stable (,) cross sections at low energies. This high sensitivity of the TALYS results on the treatment of preequilibrium may also appear for other reactions. In the present case of the 115In target, this sensitivity results from the relatively small -value of the (,p) reaction which is typically strongly negative for the recently studied even-even p-nuclei (e.g., Hal16 ; Sch16 ; Net15 ; Hal12 ; Rapp08 ; Ozk07 ; Gyu06 ; Som98 ).
Further insight into the relevance of the preequilibrium contribution could be obtained from low-energy (,p) data which are unfortunately not accessible by activation. Also the reverse 118Sn(p,)115In reaction could be used to further constrain the parameter space; however, also for the reverse reaction the data are very sparse. In the literature, only an estimate of about 1 mb is provided at MeV Chan73 which is above the most relevant energy range of the present study.
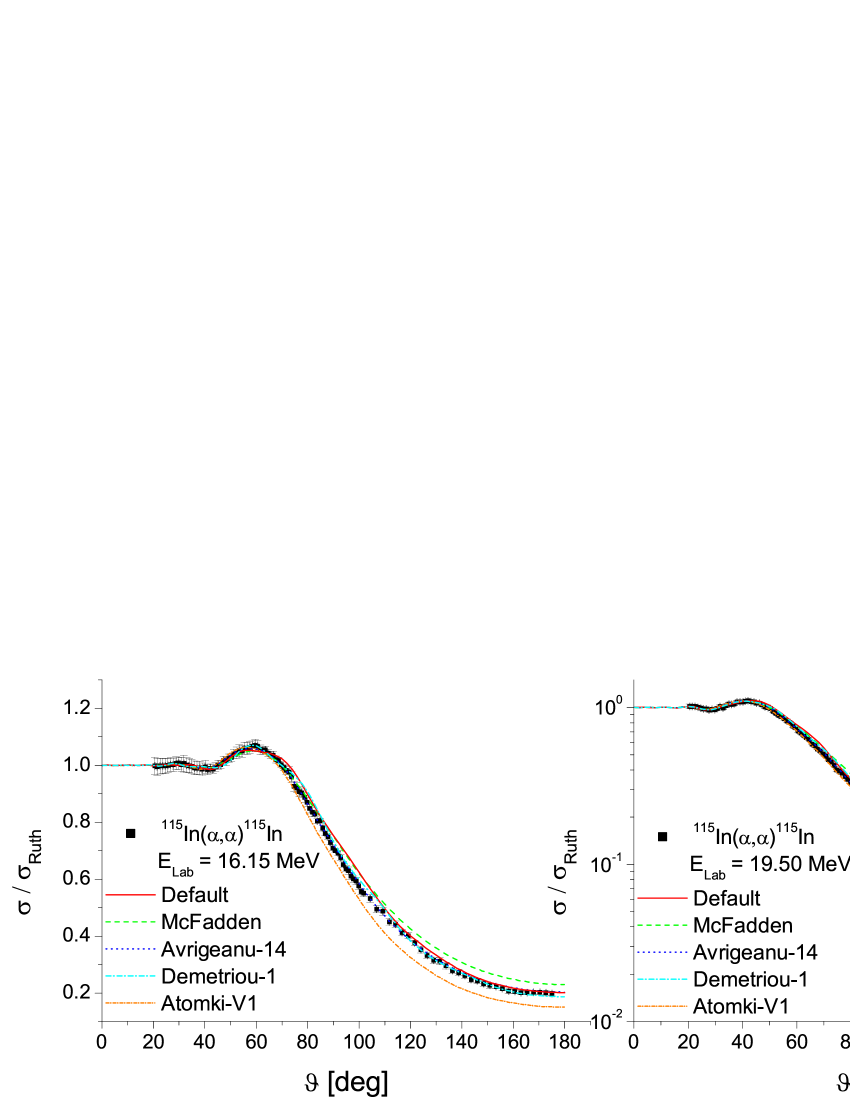
III.3 Comparison to the elastic scattering data
In the course of the present investigation, also elastic scattering cross sections of the 115In()115In reaction were studied at energies ELab = 16.15 MeV and ELab = 19.50 MeV at Atomki Kis16 . Complete angular distributions between 20∘ and 175∘ were measured at both energies in 1∘ () and 2.5∘ () steps. Total reaction cross sections were derived from the fits to the angular distributions, leading to mb ( mb) at 16.15 MeV (19.50 MeV). In general, the results of the calculations using the various -nucleus OMPs are in good agreement with the experimental results. Deviations do not exceed about 15%. The calculated elastic scattering angular distributions are compared to the experimental scattering data in Fig. 5, and the total reaction cross sections are listed in Table 5.
| potential | ELab = 16.15 MeV | ELab = 19.50 MeV |
|---|---|---|
| experiment Kis16 | ||
| Watanabe Wat58 444with TALYS default settings | 321.7 | 713.6 |
| Atomki-V1 Moh_ADNDT | 404.1 | 815.2 |
| Demetriou-I Dem02 | 335.9 | 741.5 |
| McFadden Mcf | 333.1 | 735.1 |
| Avrigeanu Avr14 | 349.6 | 763.5 |
As can be seen, at the lower energy ELab = 16.15 MeV the angular distribution is best reproduced by the potential of Avrigeanu Avr14 . The potential by Demetriou (Dem-1) Dem02 and the early potential by Watanabe Wat58 also provide very reasonable descriptions. However, the experimental elastic cross sections are slightly underestimated by the Atomki-V1 potential Moh_ADNDT and slightly overestimated by the McFadden/Satchler potential Mcf .
The picture changes a bit for the higher energy ELab = 19.50 MeV angular distribution because of the increasing deviation from the Rutherford cross section. Again, the measured data are very well reproduced by the calculation using the potential of Avrigeanu Avr14 . From about to the calculations with the potentials of McFadden Mcf , Demetriou Dem02 , and Watanabe Wat58 overestimate the elastic cross sections, leading to an underestimation of the total reaction cross section . Contrary, the calculation with the Atomki-V1 Moh_ADNDT slightly underestimates the elastic cross section and thus overestimates . The somewhat larger deviations at backward angles do not have major effects on .
Furthermore, the total reaction cross sections from the elastic scattering angular distributions (see Table 5) can be included in the search for the best-fit parameters. These two additional data points do not affect the conclusions of Sect. III.2 although the of the Atomki-V1 potential increases from about 1.7 to 2.5; the values for the Demetriou (Dem-1) potential and the McFadden/Satchler potential remain almost identical because of the better reproduction of the experimental in Table 5.
III.4 Final remarks
The comparison between the experimental data of -induced reactions and elastic scattering data to the calculations using various -nucleus OMPs leads to several unexpected findings. In general, all -OMPs show a quite reasonable agreement with the new experimental (,n) and (,) data. A similar result was found recently for -induced reactions on the lighter target 64Zn Orn16 ; Mohr17 whereas for heavier target nuclei often a significant overestimation of reaction cross sections is found, in particular for the lowest energies. However, despite the generally reasonable agreement, a strict -based assessment shows significant differences for the global -OMPs under study.
The overall best-fit to the (,) cross sections with is obtained from the Atomki-V1 potential. Slightly increased of 2.8 and 3.3 are found for the Demetriou (Dem-1) potential and the very simple McFadden/Satchler potential which otherwise has a trend to overestimate reaction data, in particular for heavy target nuclei towards lower energies. Contrary to the good description of the -induced reaction data, the Atomki-V1 potential and the McFadden/Satchler potential show a relatively poor reproduction of the elastic angular distributions. As these potentials, Atomki-V1 and McFadden/Satchler, have been derived from the analysis of elastic scattering data, one might expect better results for elastic scattering and worse reproduction of reaction cross sections.
Contrary to the aforementioned Atomki-V1 and McFadden/Satchler potentials, the potentials by Demetriou and by Avrigeanu have been derived from adjustments to low-energy elastic scattering and reaction cross sections. The Demetriou (Dem-1) potential provides a good description of the experimental reaction data with whereas the Avrigeanu potential shows a significantly increased overall . However, in particular the many-parameter potential of Avrigeanu provides an excellent reproduction of the elastic scattering angular distributions.
Furthermore, the analysis is not able to provide final conclusions on the other ingredients of the statistical model. The smallest for the Atomki-V1, Dem-1, and McFadden/Satchler -OMPs are obtained with different combinations of the nucleon OMP, -ray strength function, and level density.
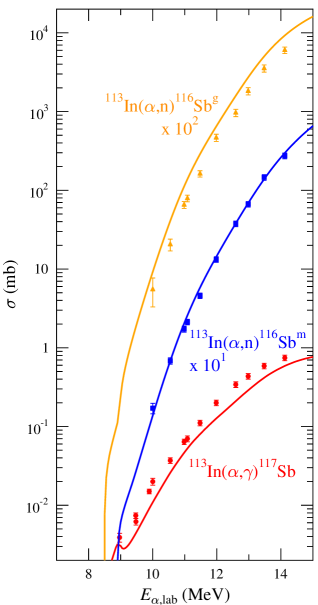
IV Application of the best-fit parameters to 113In
Recently, cross sections of -induced reactions for 113In have been measured by Yalçın et al. Yal09 , and the data have been analyzed together with elastic scattering in Kis13 . For an excellent reproduction of the experimental data, in both studies Yal09 ; Kis13 the -ray strength had to be scaled down by at least 30%.
Using the best-fit parameters of 115In from the present work, we find reasonable agreement with the experimental data for 113In without any scaling. The energy dependence of all cross sections is very well reproduced; however, there is a slight overestimation of the (,n) cross section and a slight underestimation of the (,) cross section. The agreement for the isomeric contribution to the (,n) cross section is excellent. The results for 113In are shown in Fig. 6.
V Summary and conclusions
The 115In()119Sb and 115In(,n)118Sbm reaction cross sections were measured between = 8.83 MeV - 15.58 MeV, and the 115In(,n)118Sbg reaction was studied between = 11.10 MeV - 15.58 MeV. Experimental results were compared with Hauser-Feshbach statistical model calculations aiming the evaluation of the global -nucleus optical potentials used in the weak r- and process studies.
We found reasonable agreement between the experimental (,n) data and the predictions using most global -nucleus optical potentials. The best agreement was obtained for the Atomki-V1, the Demetriou (Dem-1), and the McFadden/Satchler potentials. This fact clearly indicates that the alpha transmission coefficient is reasonably well predicted for 115In by most global potentials in the investigated energy interval. The experimental (,) cross sections are far underestimated by the TALYS default parameters, but by selection of a different -ray strength function also the (,) data could be well reproduced. The extrapolation of the (,) cross section to the astrophyiscally relevant low-energy region is nicely constrained by the new experimental data, leading to a reduction of the uncertainty of about two orders of magnitude when compared to the range of theoretical predictions within TALYS.
Surprisingly, the potential with the best description of the experimental (,) reaction cross sections shows the largest deviations for the elastic scattering angular distributions. Further efforts are needed to establish an improved global -nucleus potential which simultaneously describes elastic scattering and reaction data.
Acknowledgments
This work was supported by NKFIH (K108459, K120666).
Appendix A Further sensitivity studies
As already mentioned in Sec. III.2, it is impossible to show the results of all 6720 combinations of input parameters for the statistical model which were tested in the present study. In this Appendix we provide additional information on the sensitivity of the cross sections for the different exit channels, i.e., the (,) capture cross section and the (,n) cross sections feeding the ground state and the isomer in 118Sb.
A simple qualitative discussion of the sensitivities of the calculated cross sections was already provided at the beginning of Sec. III.2 which was based on the definition of the reaction cross section in the statistical model in Eq. (1) and the properties of the transmission coefficients into the different exit channels. In the following we use the best-fit calculation from Sec. III.2 (see also Table 3) as a reference and vary each ingredient of the statistical model separately.
It is obvious from Eq. (1) that the transmission affects all calculated cross sections. Thus, a significant sensitivity to the -OMP is expected which is confirmed by the results in Fig. 7. At higher energies above 15 MeV the differences between the various -OMPs become smaller whereas at low energies the calculated cross sections vary over more than one order of magnitude. The potential of Nolte et al. Nol87 and the earlier Avrigeanu potential Avr94 overestimate the experimental data at low energies, leading to huge for these potentials. The Demetriou potentials have a trend to underestimate the experimental data; this trend becomes more pronounced if the Demetriou potential is scaled down by factors smaller than unity.
The sensitivity of the calculated cross sections to the other ingredients of the statistical model is relatively weak. This holds in particular for the nucleon OMP, as can be seen from Fig. 8. As in Eq. (1) is much larger than the other , the branching to the neutron channel becomes close to unity (independent of the absolute value of ; see upper parts of Fig. 8). The ,) cross section is slightly influenced because the (,) cross section scales approximately with above the neutron threshold (lower part of Fig. 8).
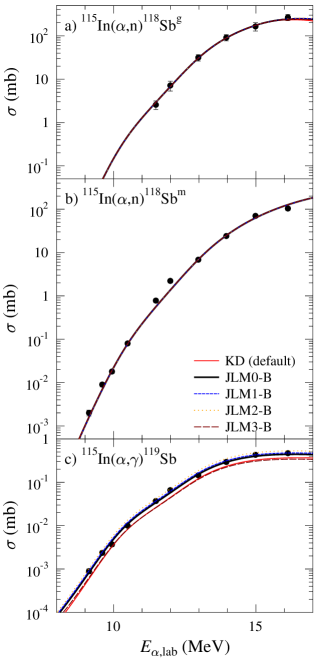
As is much smaller than above the neutron threshold, a variation of the -ray strength does practically not affect the cross section in the dominating neutron channel. However, the (,) cross section scales with . This is illustrated in Fig. 9 which shows a variation of about a factor of around the best-fit calculation.
The role of the level densities is slightly different from the other above ingredients because the chosen level density affects the calculated cross section indirectly. Except , all in Eq. (1) result from the sum over all energetically allowed final states. In practice, low-lying levels are taken into account explicitly, whereas the contributions from higher-lying levels are taken into account by a theoretical level density. Because of the negative -value of the (,n) reaction, in the energy range under study practically all relevant levels are taken into account explicitly, and thus the role of the level density is negligible in the (,n) channel. The (,) cross section varies by about a factor of two for the given 6 options for the level density in TALYS (see Fig. 10).
Combining the above sensitivities, it can be concluded that a simultaneous measurement of many reaction channels is essential to constrain the parameters of the statistical model. Otherwise, different shortcomings of the chosen parameters may (at least partly) compensate each other. This holds in particular for the ,) channel with its sensitivity to , , and and the implicit dependence on the level density.
For completeness it can be noted that the various options for the nucleon-OMP, the -ray strength, and the level density in combination with the best-fit -OMP lead to a wide range in from about 1.7 for the best-fit () up to about 1500 (). This huge range for the total results mainly from the (,) channel where the worst calculation shows and . The (,n) cross sections to the 118Sb ground state and isomer are almost insensitive the the other ingredients except the -OMP with a variation of of about a factor of two. A variation of the -ray strength function (level density) alone leads to a range of overall up to 105 (63) and (1.47). Interestingly, the overall best-fit is obtained with an intermediate -ray strength and a low level density. Alternatively, the data can be well described using a lower -ray strength (e.g., the default KU strength, red line in Fig. 9) with a higher level density (e.g., the MSHC level density, magenta dashed line in Fig. 10) (for abbreviations see Table 3).
As a final remark we point out that the sensitivities of the cross sections in dependence of the input parameters in Figs. 7-10 should be interpreted as empirical sensitivities. These variations result from the range of predictions of widely used global parametrizations. Contrary to the empirical sensitivities of the present study, mathematical sensitivities have been studied e.g. in rausensi and are provided at non . These mathematical sensitivities, as defined in Eq. (1) of rausensi , have the advantage of being well-defined, but do not take into account the reasonable physical range of the input parameters. In that sense both approaches, the empirical sensitivities of the present study and the mathematical sensitivities of rausensi , should be considered as complemetary.
References
- (1) F. Käppeler et al., Rev. Mod. Phys. 83, 157 (2011).
- (2) F. K. Thielemann et al., Prog. Part. Nucl. Phys. 66, 346 (2011).
- (3) J. J. Cowan and W. K. Rose, Astrophys. J. 212, 149 (1977).
- (4) M. Hampel et al., Astrophys. J. 831, 171 (2017).
- (5) C. Fröhlich et al., Phys. Rev. Lett. 96, 142502 (2006).
- (6) J. Pruet et al., Astrophys. J. 644, 1028 (2006).
- (7) Y. Qian and G. J. Wasserburg, Phys. Rep. 442, 237 (2007).
- (8) B. Meyer et al., Astrophys. J. 399, 656 (1992).
- (9) T. Rauscher et al., Rep. Prog. Phys. 76, 066201 (2013).
- (10) L. Hüdepohl et al., Rhys. Rev. Lett. 104, 251104 (2010).
- (11) G. Martínez-Pinedo et al., Phys. Rev. Lett. 109, 251104 (2012).
- (12) S. E.Woosley and R. D. Hoffman, Astrophys. J. 395 202 (1992).
- (13) A. Arcones and F. Montes, Astrophys. J. 731, 5 (2011).
- (14) A. Arcones and J. Bliss J. Phys. G. 41, 044005 (2014).
- (15) P. Mohr, Phys. Rev. C 94, 035801 (2016).
- (16) S. E. Woosley and W. M. Howard, Astrophys. J. Suppl. 36, 285 (1978).
- (17) T. Rauscher et al., Astrophys. J. 576, 323 (2002).
- (18) C. Travaglio et al., Astrophys. J. 739, 93 (2011).
- (19) N. Nishimura et al., MNRAS 474, 3133 (2018).
- (20) C. Travaglio et al., Astroph. J. 854, 18 (2018).
- (21) T. Rauscher, Phys. Rev. C 73, 015804 (2006).
- (22) W. Rapp et al., Astrophys. J. 653, 474 (2006).
- (23) J. Bliss et al., J. Phys. G 44, 054003 (2017).
- (24) W. Hauser and H. Feshbach, Phys. Rev. 87, 366 (1952).
- (25) G. G. Kiss et al., Phys. Rev. C 88, 045804 (2013).
- (26) L. Netterdon et al., Nucl. Phys. A 916, 149 (2013).
- (27) T. Rauscher, Int. J. Mod. Phys. E 20, 1071 (2011).
- (28) T. Rauscher, Astrophys. J. Suppl. 201, 26 (2012).
- (29) A. Sauerwein et al., Phys. Rev. C 84, 045808 (2011).
- (30) P. Scholz et al., Phys. Rev. C 90, 065807 (2014).
- (31) Gy. Gyürky et al., Phys. Rev. C 90, 052801 (2014).
- (32) G. G. Kiss et al., J. Phys. G 42, 055103 (2015).
- (33) A. Koning et al., code TALYS version 1.8, available online: http://www.TALYS.eu/
- (34) G. G. Kiss et al., J. Phys. Conf. Series 665, 012035 (2016).
- (35) D. M. Symochko et al., Nuclear Data Sheets 110, 2945 (2009).
- (36) R. Huszánk et al., J. Rad. Nucl. Chem. 307, 341 (2016).
- (37) E. Koltay et al., Chemical applications of ion accelerators. Handbook of Nuclear Chemistry. 2nd edition. Eds: A. Vértesi, S. Nagy, Z. Klencsár, R. G. Lovas, F. Rösch Hamburg, Springer Verlag 3, 1695 (2011).
- (38) T. Szücs et al., AIP conference proceedings 1595, 173 (2014).
- (39) Zs. Kertész et al.,Nucl. Instr. Meth. B 268, 1924 (2010).
- (40) C. Yalçın et al., Phys. Rev. C 79, 065801 (2009).
- (41) J. F. Ziegler, M. D. Ziegler, and J. P. Biersack, Code SRIM, Version 2008.4; http://www.srim.org/SRIM/SRIMLEGL.htm.
- (42) T. Rauscher, Code NON-SMOKERWEB v5.8.1, http://nucastro.org/websmoker.html.
- (43) R. V. Carlson and P. J. Daly, Nucl. Phys. A 102, 161 (1967).
- (44) R.W. Dodson, Natl. Nuclear Energy Ser. 3, 1 (1952).
- (45) A. E. Antonov et al., in proceedings of the 41th Conf. Nucl. Spectroscopy Nucl. Struct., Minsk 330 (1991).
- (46) http://www.oecd-nea.org/tools/abstract/detail/nea-0850
- (47) S. Watanabe, Nucl. Phys. 8, 484 (1958).
- (48) M. Avrigeanu and V. Avrigeanu Phys. Rev. C 20, 014606 (2010).
- (49) V. Avrigeanu, et al., Phys. Rev. C 90, 044612 (2014).
- (50) L. McFadden and G. R. Satchler, Nucl. Phys. 84, 177 (1966).
- (51) T. Rauscher and F.-K. Thielemann, At. Data Nucl. Data Tables 75, 1 (2000).
- (52) T. Rauscher and F.-K. Thielemann, At. Data Nucl. Data Tables 79, 47 (2001).
- (53) P. Demetriou et al., Nucl. Phys. A 707, (2002) 253.
- (54) A.M. Kobos et al., Nucl. Phys. A 425, (1984) 205.
- (55) G. G. Kiss et al., Phys. Rev. C 80, 045807 (2009).
- (56) Zs. Fülöp et al., Phys. Rev. C 64, 065805 (2001).
- (57) G. G. Kiss et al., Eur. Phys. J. 27, 197 (2006).
- (58) A. Ornelas et al., Nucl. Phys. A 940, 194 (2015).
- (59) G. G. Kiss et al., Phys. Rev. C 83, 065807 (2011).
- (60) D. Galaviz et al., Phys. Rev. C 71, 065802 (2005).
- (61) P. Mohr et al., Phys. Rev. C 55, 1523 (1997).
- (62) P. Mohr et al., At. Data Nucl. Data Tables 99, 651 (2013).
- (63) P. Mohr et al., Phys. Rev. C 82, 047601 (2010).
- (64) P. Scholz et al., Phys. Lett. B 761, 247 (2016).
- (65) P. Mohr, Gy. Gyürky, Zs. Fülöp, Phys. Rev. C 95, 015807 (2017).
- (66) J. P. Jeukenne, A. Lejeune, C. Mahaux, Phys. Rev. C 58, 1118 (1998).
- (67) E. Bauge, J. P. Delaroche, M. Girod, Phys. Rev. C 63, 024607 (2001).
- (68) S. Goriely, E. Khan, M. Samyn, Nucl. Phys. A739, 331 (2004).
- (69) W. Dilg, W. Schantl, H. Vonach, M. Uhl, Nucl. Phys. A217, 269 (1973).
- (70) S. Goriely and J.-P. Delaroche, Phys. Lett. B 653, 178183 (2007).
- (71) S. Hilaire, M. Girod, S. Goriely, A. J. Koning, Phys. Rev. C 86, 064317 (2012).
- (72) S. Goriely, Phys. Lett. B 436, 10 (1998).
- (73) S. Goriely, F. Tondeur, J. M. Pearson, At. Data Nucl. Data Tables 77, 311 (2001).
- (74) J. Kopecky and M. Uhl, Phys. Rev. C 41, 1941 (1990).
- (75) A. Gilbert and D. Cameron, Can. J. Phys. 43, 1446 (1965).
- (76) R. Capote et al., Nucl. Data Sheets 110, 3107 (2009).
- (77) S. Goriely, S. Hilaire, A. J. Koning, Phys. Rev. C 78, 064307 (2008).
- (78) V. Avrigeanu, P. E. Hodgson, M. Avrigeanu, Phys. Rev. C 49, 2136 (1994).
- (79) M. Nolte, H. Machner, J. Bojowald, Phys. Rev. C 36, 1312 (1987).
- (80) A. J. Koning and J. P. Delaroche, Nucl. Phys. A713, 231 (2003).
- (81) Z. Halász et al., Phys. Rev. C 94, 045801 (2016).
- (82) L. Netterdon et al., Phys. Rev. C 91, 035801 (2015).
- (83) Z. Halász et al., Phys. Rev. C 85, 025804 (2012).
- (84) W. Rapp et al., Phys. Rev. C 78, 025804 (2008).
- (85) N. Özkan et al., Phys. Rev. C 75, 025801 (2007).
- (86) Gy. Gyürky et al., Phys. Rev. C 74, 025805 (2006).
- (87) E. Somorjai et al., Astron. Astrophys. 333, 1112 (1998).
- (88) K. C. Chan et al., Phys. Rev. C 8, 1363 (1973).
- (89) A. Ornelas et al., Phys. Rev. C 94, 055807 (2016).