Variable broad lines and outflow in the weak blazar PBC J2333.9-2343
Abstract
PBC J2333.9-2343 is a peculiar active nucleus with two giant radio lobes and a weak blazar-like nucleus at their center. In the present work we show new optical, UV, and X-ray data taken from the San Pedro Mártir telescope, the New Technology Telescope, NTT/EFOSC2, and the Swift/XRT satellite. The source is highly variable at all frequencies, in particular the strongest variations are found in the broad H component with a flux increase of 614 per cent between 2009 and 2016, following the X-ray flux increase of 626 per cent between 2010 and 2016. We also detected a broad H component in 2016, making the optical classification change from type 1.9 to type 1.8 in one year. We have also detected a broad component of the [OIII]5007 line, which is blue-shifted and of high velocity, suggesting an origin from a highly disturbed medium, possibly an outflow. The line flux variability and broad widths are indicative of a jet that is, at least in part, responsible for the ionization of the BLR and NLR.
keywords:
galaxies: active – galaxies: jets – galaxies: individual: PBC J2333.9-23431 Introduction
PBC 2333.9-2343 (z=0.0475, Parisi et al., 2012), is a very peculiar active galactic nucleus (AGN), being a giant radio galaxy but hosting in its center a blazar-like nucleus. The NVSS radio image shows two extended radio lobes with a size 1.2 Mpc (Bassani et al., 2016), plus a bright compact core at their center. Recent simultaneous multi-wavelength data have revealed that the nuclear emission is dominated by a jet pointing towards us, at low inclination angles (Hernández-García et al., 2017b). One possible explanation to reconcile the large and small scale jets is a restarting activity scenario in which the source has initially produced two jets that are now observed as two extended old radio lobes. Lately, likely due to an intermittent activity episode, a new pair of jets have formed changing direction with respect to the old ones and pointing toward us, transforming this source from a radio galaxy to a blazar, a very exceptional case of restarting activity. Thus, although the host galaxy is very old, with stellar populations older than 10 Gyr, the nuclear radio core might be a very young source if we assume that the restarted activity occurred slowly, e.g., related to changes in the accretion, explaining the low nuclear bolometric luminosity (9.41043 erg s-1, Hernández-García et al. 2017b) compared to more powerful blazars ( 1046 erg s). The combination of the jet inclination angle and its low power allows the detection of emission lines in the optical spectra, usually missed in blazars. In this work, we show that PBC 2333.9-2343 has an exceptional optical spectrum, where variable broad emission lines and broadened narrow emission lines are found, having a truly unique combination of BLR, outflow and jet interaction in the same galaxy. Here we present its exceptional characteristics at optical, UV, and X-ray frequencies.
The paper is organized as follows. In Section 2 we present the observations and data reduction, while the analysis and main results can be found in Section 3, which are discussed in Section 4. A summary of the main results is presented in Section 5. Throughout the text we have assumed H0 = 70 km s-1Mpc-1, = 0.73 and = 0.27, from which we have derived a luminosity distance of 206 Mpc, which corresponds to a scale of 0.92 kpc arcsec-1.
2 Observations and data reduction
The nucleus of PBC J2333.92343 was observed on 2009 September 18, on 2015 November 7, and on 2016 November 26 with the 2.12-m telescope of the San Pedro Mártir Observatory (SPM, in México), equipped with a Boller & Chivens spectrograph and a 20482048 pixels E2V-4240 CCD, which was tuned to the 3800 Å to 8000 Å range (grating 300 l mm-1), with a spectral dispersion of 4.5 Å pixel-1, corresponding to FWHM=10 Å derived from the FWHM of different emission lines of the arc-lamp spectrum. A 2.5 arcsec slit was used oriented with the parallactic angle and the pixel spatial scale was 1.1 arcsec pixel-1 in 2009 and 0.6 arcsec pixel-1 in 2015 and 2016. It was also observed once on 2016 November 16 with the 3.58-m New Technology Telescope (NTT, in Chile), using the ESO Faint Object Spectrograph and Camera (EFOSC2, Buzzoni et al., 1984) which has a 20482048 pixels CCD. The grism#11 and 1arcsec slit was used oriented with the parallactic angle, corresponding to a resolution of 17.16 ÅṪhe pixel spatial scale was 0.24 arcsec pixel-1 with a 22 binning, and a spectral pixel scale of 2.04 Å pixel-1. The spectrophotometric data reduction was carried out with the IRAF package111http://iraf.noao.edu/, including bias and flat-field corrections, cosmic-ray removal, two-dimensional wavelength calibration, sky spectrum subtraction, and flux calibration. It is worth noting that SPM spectra were acquired with a high airmass (1.8), resulting into a slit loss and therefore cannot be used for absolute spectrophotometric measurements. However, given the reliability of line widths estimates, we use SPM spectra to study emission line variations, whereas the NTT spectrum is used to derive physical parameters. Note that SPM and NTT spectral results are not compared because of the different slit sizes which could introduce errors in the variability analysis.
We used all the public data of PBC J2333.9-2343 in the Swift archive, eight times between 2010 and 2017. The data reduction of the Swift X-ray Telescope (XRT, Burrows et al., 2005) in the Photon Counting mode was performed by following standard routines described by the UK Swift Science Data Centre (UKSSDC)222http://www.swift.ac.uk/analysis/xrt/index.php and using the software in HEASoft version 6.19. Calibrated event files were produced using the routine xrtpipeline, accounting for bad pixels and effects of vignetting, and exposure maps were also created. Source and background spectra were extracted from circular regions with 30 arcsec and 80 arcsec radius. The xrtmkarf task was used to create the corresponding ancillary response files. The response matrix files were obtained from the HEASARC CALibration DataBase. The spectra were grouped to have a minimum of 20 counts per bin using the grppha task.
The Ultraviolet and Optical Telescope (UVOT, Roming et al., 2005) observes with six primary photometric filters of V (centred at 5468 Å), B (at 4392 Å), U (at 3465 Å), UVW1 (at 2600 Å), UVM2 (at 2246 Å) and UVW2 (at 1928 Å). We notice that data are available in the six filters but not on all dates. The uvotsource task was used to perform aperture photometry using a circular aperture radius of 5 arcsec again centred on the coordinates given by NED. The background region was selected as a free of sources circular region of 20 arcsec close to the nucleus.
3 Data analysis and results
3.1 Optical spectroscopy
Notes. For each spectrum, the signal to noise (S/N) of the continuum estimated in the 5650-5750 Å region, where no emission or absorption lines are present, the reduced chi-square and degrees of freedom (d.o.f.) of the spectral fits for the [OIII]-H/H-[NII] regions, respectively, and the seeing for each night are presented. From the fourth line on, for each line the centroid wavelength, , in Å, shift respect to the NLR, , in km s-1, line width, , in km s-1, and fluxes, , in units of 10-15 cm-2 s-1 Å-1, are presented. The reported errors are those derived from the fit. The values have been corrected for instrumental broadening.
| Line | Parameter | SPM(2009) | SPM(2015) | SPM(2016) | ESO (2016) |
|---|---|---|---|---|---|
| (1) | (2) | (3) | (4) | (5) | (6) |
| Spectrum | S/N | 39 | 43 | 39 | 66 |
| 0.9/1.0 | 0.8/1.0 | 1.3/1.2 | 1.1/1.0 | ||
| Seeing (arcsec) | 2.5 | 2.6 | 2.5 | 1.2 | |
| 5009.30.8 | 5007.40.3 | 5007.60.2 | 5001.83.1 | ||
| 14449 | 3619 | 3013 | -347187 | ||
| 85060 | 88030 | 80324 | 1919301 | ||
| 13.82.0 | 19.41.1 | 13.10.6 | 8.31.9 | ||
| H | 6622.96.2 | 6636.06.7 | 6654.93.0 | 6642.32.7 | |
| 2738283 | 3337306 | 4201137 | 3625123 | ||
| 6340283 | 5120238 | 6235183 | 5325101 | ||
| 453 | 665 | 1155 | 802 | ||
| H | - | - | 4935.06.3 | 4879.721.9 | |
| - | - | 4567389 | 11541352 | ||
| - | - | 4005259 | 51101062 | ||
| - | - | 91 | 134 |
x
We applied the STARLIGHT stellar population synthesis code (Cid Fernandes et al., 2005) for the recovery of the shape of the stellar continuum to all the spectra. We performed the spectral synthesis using 150 single stellar populations from the evolutionary synthesis models of Bruzual & Charlot (2003) and six different power-law slopes to simulate the AGN component to the optical continuum emission. The extinction law of Cardelli et al. (1989) with Rv = 3.1 was adopted. The base components comprise 25 ages between 1 Myr and 18 Gyr, and six metallicities, from Z=0.005 to 2.5 . The regions affected by atmospheric absorption and emission lines were masked and excluded from the fit. From the NTT data, we estimated the stellar velocity dispersion, =2694 km s-1.
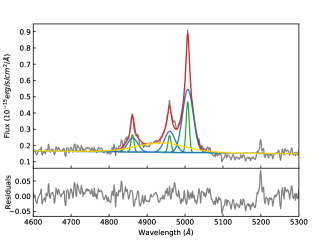
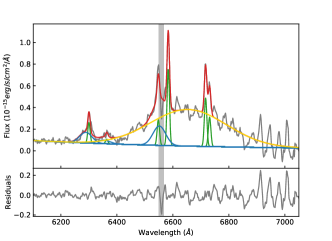
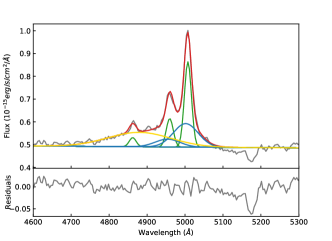
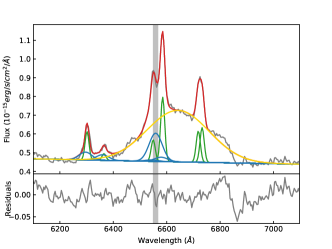
We then developed a model based on the scipy.optimize package in Python, using the curve fit routine, in order to perform the spectral analysis on the stellar population-subtracted spectra. The [OIII]-H and H-[NII] regions were fitted separately, using the following models:
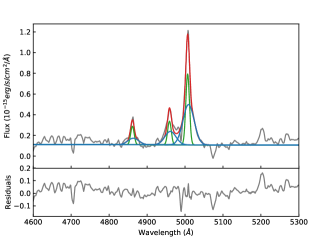
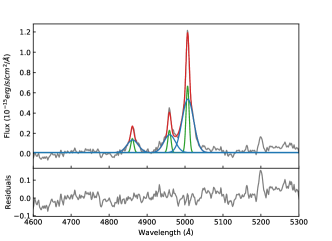
–[OIII]-H: (i) a Gaussian profile for fitting each narrow component of the [OIII]4959,5007 Å doublet and the H emission lines, associated with the NLR; (ii) the same number of Gaussians as in (i) for fitting the possible broad components associated with the outflowing gas; (iii) one Gaussian profile for fitting the BLR component of the H emission.
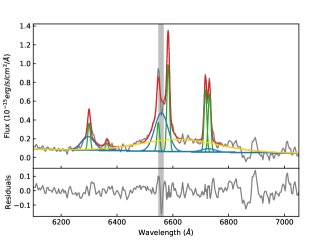
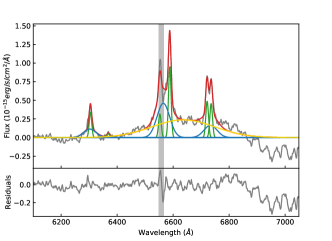
–H-[NII]: (i) a Gaussian profile for fitting each narrow component of the [OI], [NII] and [SII] doublets and of the H emission line, associated with the NLR; (ii) the same number of Gaussians as in (i) for fitting the possible broad components associated with the outflowing gas; (iii) one Gaussian profile for fitting the BLR component of the H emission.333We notice that the H broad component associated with the BLR was fitted in all spectra. The BLR H emission was only added in the 2016 spectra.
We fitted the spectra by fixing the relative wavelengths and intensities of the lines according to their atomic parameters, and assuming equal broadening for the lines of the same kinematic component. We limited the width of the narrow component to be larger than the instrumental one.
The normalizations between the [OIII] doublet was fixed equal to 1:3. The same ratio was applied to the [NII] doublet. Moreover, the intrinsic velocity dispersion of each emission line was forced to be the same in each fitted region. Same rules were applied for the broad components associated with the outflow. The measurements were corrected for instrumental broadening. Best-fit results for [OIII]5007, H and H are presented in Table 1 and Figure 1.
The main results obtained from the optical spectral fitting are the following:
– Broad Balmer emission line variations: by comparing the three SPM spectra, the strongest variations are found in the broad H component (Fig. 1).
Specifically, it shows a flux brightening of 614 per cent between 2009 and 2016.
Moreover, the coherence between the 2016 SPM and NTT spectra, taken in very different observing conditions and with very different spectral set up, support the remarkable increase in the relative contribution of the broad H component.
In the 2016 NTT and SPM spectra we also detected a broad H component, which was not present in the 2009 and 2015 SPM spectra.
This implies that the optical classification of this source has changed from type 1.9 to type 1.8 in one year.
– Broad Balmer emission line shifts: we have measured a line centroid of the H and H redshifted by 1000 km s-1 with respect to the systemic velocity, which is estimated from the narrow component of the [OIII] emission line.
Unfortunately, a telluric line affects the H wavelength region (Fig. 1), preventing us from deriving the correct line profile and thus from confirming the exact value of the shift. Note that the shift is within the errors in the NTT spectrum, thus this result still needs to be confirmed.
– Broad component of the narrow emission lines: a broad blueshifted component is confirmed in high ([OIII] doublet) and low ionization lines (H, [OI]6300) in all spectra. Here we study the broad component of the [OIII] emission line.
Finally, we have used independent methods to provide a black hole mass estimate. Using FWHM(H) and the continuum at 5100 Å following Bongiorno et al. (2014) and their error estimation, we measure , where the luminosity at 5100 Å was estimated from the AGN component in the STARLIGHT fit (L5100Å = (1.30.4)1043 erg s-1). We notice that if the jet partially ionizes the BLR (see Sect. 4.1), the motions of the BLR would be at least partially non gravitational and this would imply an incorrect value of . Using the derived from the NTT spectrum and the relation in Gültekin et al. (2009), we obtain . In addition, using the K-band from the 2MASS catalogue as reported in NED and following Marconi & Hunt (2003), we found . These measurements are consistent within uncertainties and in agreement with previous ones in Hernández-García et al. (2017b).
3.2 X-ray spectroscopy, UV and optical photometry
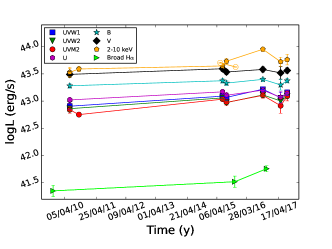
The X-ray data analysis was performed using XSPEC v. 12.9.0. We assume a Galactic absorption of NGal = 1.631020 cm-2 (Dickey & Lockman, 1990). Following the results obtained in Hernández-García et al. (2017b), we fitted the Swift/XRT spectra of with a single power-law model. All the spectra were fitted simultaneously to avoid degenerations between the spectral parameters, and because this process allows to search for X-ray spectral variability (Hernández-García et al., 2013). We found that linking all the parameters to each other does not result in a good spectral fit (/do.f.=3.18), indicating presence of variability. We let the spectral index, , and normalization of the power law, vary one-by-one and by pairs in the model. We found that the model where the normalization varied and =1.65 remained constant showed the greatest improvement (/do.f.=1.09) respect to the model where is varying (/do.f.=2.58). The X-ray fluxes derived from the fit are presented in Col. 4 of Table 2. These values are in agreement with those obtained with XMM-Newton in 2015 (two observations separated by six months, see Fig. 2), where a small drop of 16 per cent was detected (Hernández-García et al., 2017b). We also let the two parameters vary together, but the improvement is not statistically significant (/do.f.=1.08). UVOT data showed UV and optical variations between the observations above the 3 confidence level.
Overall, our results show that PBC J2333.9-2343 is variable at all the observed frequencies on timescales between months and years (Fig. 2). The largest flux variations are obtained between 2010 and 2016, with a brightening of 626 per cent (2-10 keV), 198 per cent (V), 246 per cent (B), 345 per cent (U), 515 per cent (UVW1), 564 per cent (UVM2), and 445 per cent (UVW2). Moreover, the optical continuum is bluer in 2016 than in 2009, in agreement with the UV variations.
Notes. (Col. 1) ObsID., (Col. 2) date, (Col. 3) exposure time in ksec, (Col. 4) X-ray flux in units of 10-11 erg s-1cm-2 from the XRT when fitting a power-law model, and (Cols. 5-10) UV and optical fluxes in units of 10-15 erg s-1cm-2 from the UVOT.
| ObsID. | Date | Exposure | 2-10 keV | UVW2 | UVM2 | UVW1 | U | B | V |
|---|---|---|---|---|---|---|---|---|---|
| (1) | (2) | (3) | (4) | (5) | (6) | (7) | (8) | (9) | (10) |
| 00031731001 | 2010-06-05 | 2 | 0.64 | 0.820.04 | 0.670.04 | 0.670.04 | 0.650.03 | 0.950.04 | 1.230.07 |
| 00031731002 | 2010-06-05 | 4 | 0.65 | - | - | - | 0.660.01 | - | - |
| 00041128001 | 2010-09-23 | 9 | 0.74 | - | 0.550.02 | - | - | - | - |
| 00081308001 | 2015-06-13 | 7 | 0.84 | 1.290.05 | 1.050.04 | 1.030.05 | 0.930.04 | 1.170.04 | 1.560.07 |
| 00081308002 | 2015-07-30 | 6 | 1.03 | 1.060.03 | 0.920.05 | 0.980.05 | 0.800.04 | 1.060.04 | 1.360.07 |
| 00031731003 | 2016-10-09 | 6 | 1.71 | 1.460.06 | 1.230.06 | 1.380.06 | 1.000.04 | 1.240.05 | 1.510.07 |
| 00031731004 | 2017-05-10 | 3 | 1.01 | 1.130.08 | 0.800.11 | 0.960.09 | 0.740.07 | 0.980.09 | 1.310.01 |
| 00031731005 | 2017-07-28 | 5 | 1.11 | 1.380.06 | 1.190.10 | 1.200.06 | 0.880.04 | 1.170.04 | 1.440.07 |
4 Discussion
4.1 Continuum and line variability
In non-jetted AGN, the origin of emission line variations is ascribed to variations from the photo-ionizing continuum (Peterson, 1988), or to extinction caused by clouds intersecting the line of sight of the observer (e.g., Hernández-García et al., 2017a). Blazars are usually characterized by absent or very weak optical emission lines, because of the strong and highly variable over-imposed continuum emission (Netzer, 2013). In the case of PBC J2333.9-2343 the low power jet and favorable jet inclination angle allow us to detect strong emission lines and their variability. It is unlikely that obscuration is the origin of the variability in PBC J2333.9-2343, as the source is not absorbed at X-rays and does not show spectral shape variations. The strong variability observed in UV and X-rays favors the hypothesis that the emission line fluxes are responding to the continuum variability.
Fig. 2 shows the simultaneous X-ray and UV/optical variations observed by Swift, suggesting that the regions responsible for the X-ray and UV emissions are coupled over long timescales. The flux of the broad H increased by 614 per cent between 2009 and 2016, similarly the X-ray variation is of 626 per cent between 2010 and 2016. Also the flux of the broad component of the [OIII] line has increased by 2914 per cent between 2009 and 2015. This variation is however detected at a 2 confidence level and it deserves further investigation. Future monitoring of this source with high quality spectroscopy will shed light on these spectral variations.
According to the results of the spectral energy distribution fitting, the X-rays in this source are produced by the jet (Hernández-García et al., 2017b). The evidence that in our observations the broad H flux increases in time as well as the X-ray flux, suggests that the jet could be, at least in part, responsible for the ionization of the BLR and, if variations will be confirmed in the outflowing component, also in the NLR.
The interaction of BLR clouds with a jet has already been suggested for AGN. For instance, line variations in Mg II2800 related with a flare-like event have been found in the blazar 3C 454.3 (where also a change in the jet direction has been observed, Raiteri et al., 2008), indicating that the jet powered the BLR during intense outbursts (León-Tavares et al., 2013). In the case of 3C 277.3, a strong relationship between emission-line gas and the radio jet has been found by van Breugel et al. (1985), who have suggested that the collision between the jet and the clouds produces flaring radio emission and the ionizing synchrotron continuum (optical/infrared), and deflects and entrains the jet material. The action of the jet to ionize the surrounding medium could be exerted in two ways. One one hand, it could be collisionally excited as a result of heating (Paltani & Türler, 2003; Punsly, 2013). On the other hand, the hot shocked gas could emit intense UV and soft X-ray radiation, photoionizing the gas ahead of the shock (Allen et al., 2008). New data are however needed in order to determine the correct profile of each line and their shifts and to study the effect of the jet.
4.2 Outflow
The [OIII] emission line is produced in low density ambient, e.g., at large scales in the NLR. In a large number of AGN, the spectral profile of the [OIII]5007 can be highly asymmetric, showing a broad blue-shifted profile, typically associated with outflowing ionized gas at kpc-scale (Fiore et al., 2017; Perna et al., 2017). Broad [OIII] components are observed in all the optical spectra presented here, however, because of the higher reliability in the flux calibration of the lines, we focus on the NTT spectrum to derive the physical parameters of the outflow. The measured [OIII] component is quite broad (=1919301 km s-1), with a modest blueshift (347187 km s-1) and a maximum velocity of =4230660 km s-1, representing the outflow velocity (assumed constant with radius and spherically symmetric) along the line of sight. The low shift and the large FWHM could be due to: i) a gas highly perturbed (Villar-Martín et al., 2011), possibly by the jet itself; ii) a particular geometry for which we can see both the redshifted and the blueshifted components of the outflow, similarly to the quasar SDSS J1201+1206 that shows a quasi symmetric line (Bischetti et al., 2017); or a combination of (i) and (ii).
The derived mass outflow rate is =(2.3),yr-1, and the kinetic energy is =(1.3)1043 erg s-1, obtained using equations 5 and 6 from Bischetti et al. (2017), and following their error estimate. We assumed C1, [O/H]0 (solar metallicity), an electron density ne=200 cm-3 (an estimate of the density from the [SII] was not achievable because of the blending in both the [SII] and [OIII]4363 lines), and a radius of the emitting broad [OIII] region of 0.46 kpc, estimated from the size of the aperture used to extract the NTT spectrum, which represents an upper limit (Villar-Martín et al., 2016). We caution that the derived values are rough estimates because of the several assumptions (see details in Kakkad et al., 2016).
We have compared the above values with those obtained for different kind of winds as reported in Fiore et al. (2017). They compiled a sample of 94 AGN with detected outflows at sub-pc to kpc spatial scales and investigated scaling relations between AGN, host galaxy and outflows properties. PBC J2333.9-2343 is characterized by a relatively low bolometric luminosity with respect to other AGN producing winds. Interestingly, the and values place PBC J2333.9-2343 at the low end distribution of ionised winds (see Figure 1, in Fiore et al. 2017). On the other hand, the measured maximum velocity is relatively high given its bolometric and broad [OIII] luminosity (4.21.01040 erg ). However, the main assumption in Fiore et al. (2017) is that winds are radiation-driven, while in the case of PBC J2333.9-2343 the presence of a blazar-like jet should be taken into account as possible source of radiation and/or shocks production. The extreme kinematics of the broad component in [OIII] compared to the stellar kinematics and its low bolometric luminosity indeed suggest that the outflow is induced by the interaction between the jet and the ambient gas. This is in agreement with the fact that, even in radio quiet objects, the most extreme outflows are often related with objects presenting modest level of jet activity (Whittle, 1992; Tadhunter et al., 2000; Mullaney et al., 2013; Villar Martín et al., 2014; Tadhunter et al., 2014; Giroletti et al., 2017).
Outflows are also observed in radio loud sources (e.g., Emonts et al., 2005; Morganti et al., 2013; Mahony et al., 2016; Couto et al., 2017). In particular, the co-existence of a mildly relativistic wind detected at X-rays with velocities and a jet in a radio galaxy (Tombesi et al., 2012), indicates a transverse stratification of a global flow and the possibility that the X-ray wind could provide additional support for the initial jet collimation (Fukumura et al., 2014). The radio activity is very likely influencing the energetics and thermodynamics of the emission-line gas during the period that the jet is expanding through the interstellar medium (e.g., Best et al., 2000). Recently, Couto et al. (2017) used integral field spectroscopy to study the kinematics of the radio galaxy 3C 33, proposing that shocks in the jet lead to a lateral expansion of the gas, producing an outflow, which is responsible for shock ionization of the gas. Another example is 3C 293, a double-double radio galaxy that shows a jet-driven outflow of ionised gas (Emonts et al., 2005; Mahony et al., 2016). Theoretically, current models of interactions between the jet and the interstellar medium predict that these kind of outflows are produced by shocks that ionise the surrounding medium (Wagner et al., 2012).
4.3 Caveats and limitations of the analysis
The SPM spectra presented in this paper are affected by some source of uncertainties and thus we caution the reader on some aspects of the presented results. The spectra were obtained with a high airmass and a telluric line affects the H region, preventing the determination of the line centroid of its narrow component, and consequently on the [NII]/H and [SII]/H line ratios. We notice that by fitting the narrow and outflow components in the red lines our aim is to constrain as accurately as possible their combined contribution to the total [NII]-H blend and to estimate how different fits could affect the parameters of the underlying broad H component. For this reason, the fluxes and relative line ratios of the narrow and outflow components in the red lines are not expected to be accurate. We confirm that the large associated uncertainties affecting them do not affect the conclusions regarding the broad underlying H, whose errors also account for the diversity of fits. Despite the above, the estimates on line widths are reliable and statistically significant, for instance the variation of the width of the broad H component is detected at a 14 confidence level. Variations in the broad lines might also be related to changes in the continuum level, i.e., intrinsic to the nuclear source. However, from the optical photometry obtained with Swift/UVOT data, variations in the continuum are at the level of 20 per cent, with much smaller amplitude than those observed in the broad H component, thus supporting the variations in the BLR.
A huge shift in the velocity of the broad H larger than 1000 km s-1 might be present. Since the narrow H component is suppressed due to the telluric line, we cannot confirm the exact shift of the line. Space spectroscopic observations are needed to measure the exact shift of the broad H component.
5 Conclusions
In the present work we present multi epoch optical (SPM and NTT), and UV and X-ray (Swift) data of the nucleus in the peculiar source PBC J2333.9-2343, a blazar candidate. These data reveal:
-
•
A strong and variable broad component of H, with a flux variation of 61 per cent between 2009 and 2016.
-
•
A broad component in H, observed in the 2016 spectra, but not present in 2009 nor in 2015, changing the optical classification from a type 1.9 to a 1.8 Seyfert.
-
•
A broadened, blueshifted component is confirmed in high ([OIII] doublet) and low ionization lines (H, [OI]6300).
-
•
An X-ray variable flux (amplitude of 62 per cent) between 2010 and 2016.
-
•
An optical and UV variable continuum (20 per cent and 50 per cent, respectively).
The spectral X-ray and broad H component variations are of the same order, they occur during the same timescale and they show the same trend. Since X-rays are interpreted as emission from the jet, we propose that the BLR is at least in part responsible for the ionization of the AGN. Moreover, the extreme kinematics of the broadened component in [OIII] and its low bolometric luminosity suggest that the outflow is induced by the interaction between the jet and the ambient gas.
Acknowledgments
We acknowledge the referee, M. Villar Martín, for her comments and suggestions that helped to improve the paper. This work made use of data supplied by the UK Swift Science Data Centre at the University of Leicester, the NASA/IPAC extragalactic database (NED), the STARLIGHT code, and the IRAF software. Based upon observations carried out at the Observatorio Astronómico Nacional on the Sierra San Pedro Mártir (OAN-SPM), Baja California, México. LHG and FP acknowledge the ASI/INAF agreement number 2013-023-R1, LHG partial support from FONDECYT through grant 3170527, MP from ESSTI under the MoST, and from MINECO through research projects AYA2013-42227-P and AYA2016-76682-C3-1-P (AEI/FEDER, UE), SC from the Spanish grant AYA2013-42227-P, VC by CONACyT research grant 280789, EFJA from the Collaborative Research Center 956, subproject A1, funded by DFG, and GV from the DFG Cluster of Excellence ‘Origin and Structure of the Universe’ (www.universe-cluster.de).
References
- Allen et al. (2008) Allen M. G., Groves B. A., Dopita M. A., Sutherland R. S., Kewley L. J., 2008, ApJS, 178, 20
- Bassani et al. (2016) Bassani L., Venturi T., Molina M., Malizia A., Dallacasa D., Panessa F., Bazzano A., Ubertini P., 2016, MNRAS, 461, 3165
- Best et al. (2000) Best P. N., Röttgering H. J. A., Longair M. S., 2000, MNRAS, 311, 23
- Bischetti et al. (2017) Bischetti M., et al., 2017, A&A, 598, A122
- Bongiorno et al. (2014) Bongiorno A., et al., 2014, MNRAS, 443, 2077
- Bruzual & Charlot (2003) Bruzual G., Charlot S., 2003, MNRAS, 344, 1000
- Burrows et al. (2005) Burrows D. N., et al., 2005, Space Sci. Rev., 120, 165
- Buzzoni et al. (1984) Buzzoni B., et al., 1984, The Messenger, 38, 9
- Cardelli et al. (1989) Cardelli J. A., Clayton G. C., Mathis J. S., 1989, ApJ, 345, 245
- Cid Fernandes et al. (2005) Cid Fernandes R., Mateus A., Sodré L., Stasińska G., Gomes J. M., 2005, MNRAS, 358, 363
- Couto et al. (2017) Couto G. S., Storchi-Bergmann T., Schnorr-Müller A., 2017, MNRAS, 469, 1573
- Dickey & Lockman (1990) Dickey J. M., Lockman F. J., 1990, ARA&A, 28, 215
- Emonts et al. (2005) Emonts B. H. C., Morganti R., Tadhunter C. N., Oosterloo T. A., Holt J., van der Hulst J. M., 2005, MNRAS, 362, 931
- Fiore et al. (2017) Fiore F., et al., 2017, A&A, 601, A143
- Fukumura et al. (2014) Fukumura K., Tombesi F., Kazanas D., Shrader C., Behar E., Contopoulos I., 2014, ApJ, 780, 120
- Giroletti et al. (2017) Giroletti M., Panessa F., Longinotti A. L., Krongold Y., Guainazzi M., Costantini E., Santos-Lleo M., 2017, A&A, 600, A87
- Gültekin et al. (2009) Gültekin K., et al., 2009, ApJ, 698, 198
- Hernández-García et al. (2013) Hernández-García L., González-Martín O., Márquez I., Masegosa J., 2013, A&A, 556, A47
- Hernández-García et al. (2017a) Hernández-García L., Masegosa J., González-Martín O., Márquez I., Guainazzi M., Panessa F., 2017a, A&A, 602, A65
- Hernández-García et al. (2017b) Hernández-García L., et al., 2017b, A&A, 603, A131
- Kakkad et al. (2016) Kakkad D., et al., 2016, A&A, 592, A148
- León-Tavares et al. (2013) León-Tavares J., et al., 2013, ApJ, 763, L36
- Mahony et al. (2016) Mahony E. K., Oonk J. B. R., Morganti R., Tadhunter C., Bessiere P., Short P., Emonts B. H. C., Oosterloo T. A., 2016, MNRAS, 455, 2453
- Marconi & Hunt (2003) Marconi A., Hunt L. K., 2003, ApJ, 589, L21
- Massaro et al. (2012) Massaro F., D’Abrusco R., Tosti G., Ajello M., Gasparrini D., Grindlay J. E., Smith H. A., 2012, ApJ, 750, 138
- Morganti et al. (2013) Morganti R., Fogasy J., Paragi Z., Oosterloo T., Orienti M., 2013, Science, 341, 1082
- Mullaney et al. (2013) Mullaney J. R., Alexander D. M., Fine S., Goulding A. D., Harrison C. M., Hickox R. C., 2013, MNRAS, 433, 622
- Netzer (2013) Netzer H., 2013, The Physics and Evolution of Active Galactic Nuclei
- Paltani & Türler (2003) Paltani S., Türler M., 2003, ApJ, 583, 659
- Parisi et al. (2012) Parisi P., et al., 2012, A&A, 545, A101
- Perna et al. (2017) Perna M., Lanzuisi G., Brusa M., Mignoli M., Cresci G., 2017, A&A, 603, A99
- Peterson (1988) Peterson B. M., 1988, PASP, 100, 18
- Punsly (2013) Punsly B., 2013, ApJ, 762, L25
- Raiteri et al. (2008) Raiteri C. M., et al., 2008, A&A, 491, 755
- Roming et al. (2005) Roming P. W. A., et al., 2005, Space Sci. Rev., 120, 95
- Tadhunter et al. (2000) Tadhunter C. N., Villar-Martin M., Morganti R., Bland-Hawthorn J., Axon D., 2000, MNRAS, 314, 849
- Tadhunter et al. (2014) Tadhunter C., Morganti R., Rose M., Oonk J. B. R., Oosterloo T., 2014, Nature, 511, 440
- Tombesi et al. (2012) Tombesi F., Sambruna R. M., Marscher A. P., Jorstad S. G., Reynolds C. S., Markowitz A., 2012, MNRAS, 424, 754
- Villar-Martín et al. (2011) Villar-Martín M., Humphrey A., Delgado R. G., Colina L., Arribas S., 2011, MNRAS, 418, 2032
- Villar Martín et al. (2014) Villar Martín M., Emonts B., Humphrey A., Cabrera Lavers A., Binette L., 2014, MNRAS, 440, 3202
- Villar-Martín et al. (2016) Villar-Martín M., Arribas S., Emonts B., Humphrey A., Tadhunter C., Bessiere P., Cabrera Lavers A., Ramos Almeida C., 2016, MNRAS, 460, 130
- Wagner et al. (2012) Wagner A. Y., Bicknell G. V., Umemura M., 2012, ApJ, 757, 136
- Whittle (1992) Whittle M., 1992, ApJS, 79, 49
- van Breugel et al. (1985) van Breugel W., Miley G., Heckman T., Butcher H., Bridle A., 1985, ApJ, 290, 496