Content-based Popularity Prediction of Online Petitions Using a Deep Regression Model
Abstract
Online petitions are a cost-effective way for citizens to collectively engage with policy-makers in a democracy. Predicting the popularity of a petition — commonly measured by its signature count — based on its textual content has utility for policy-makers as well as those posting the petition. In this work, we model this task using CNN regression with an auxiliary ordinal regression objective. We demonstrate the effectiveness of our proposed approach using UK and US government petition datasets.111 The code and data from this paper are available from http://github.com/shivashankarrs/Petitions
1 Introduction
A petition is a formal request for change or an action to any authority, co-signed by a group of supporters. Research has shown the impact of online petitions on the political system Lindner and Riehm (2011); Hansard (2016); Bochel and Bochel (2017). Modeling the factors that influence petition popularity — measured by the number of signatures a petition gets — can provide valuable insights to policy makers as well as those authoring petitions Proskurnia et al. (2017).
Previous work on modeling petition popularity has focused on predicting popularity growth over time based on an initial popularity trajectory Hale et al. (2013); Yasseri et al. (2017); Proskurnia et al. (2017), e.g. given the number of signatures a petition gets in the first hours, prediction of the total number of signatures at the end of its lifetime. Asher et al. (2017) and Proskurnia et al. (2017) examine the effect of sharing petitions on Twitter on its overall success, as a time series regression task. Other work has analyzed the importance of content on the success of the petition Elnoshokaty et al. (2016). Proskurnia et al. (2017) also consider the anonymity of authors and petitions featured on the front-page of the website as additional factors. Huang et al. (2015) analyze ‘power’ users on petition platforms, and show their influence on other petition signers.
In general, the target authority for a petition can be political or non-political. In this work, we use petitions from the official UK and US government websites, whereby citizens can directly appeal to the government for action on an issue. In the case of UK petitions, they are guaranteed an official response at 10k signatures, and the guarantee of parliamentary debate on the topic at 100k signatures; in the case of US petitions, they are guaranteed a response from the government at 100k signatures. Political scientists refer to this as advocacy democracy Dalton et al. (2003), in that people are able to engage with elected representatives directly. Our objective is to predict the popularity of a petition at the end of its lifetime, solely based on the petition text.
Elnoshokaty et al. (2016) is the closest work to this paper, whereby they target Change.org petitions and perform correlation analysis of popularity with the petition’s category, target goal set,222See http://bit.ly/2BXd0Sl. and the distribution of words in General Inquirer categories Stone et al. (1962). In our case, we are interested in the task of automatically predicting the number of signatures.
We build on the convolutional neural network (CNN) text regression model of Bitvai and Cohn (2015) to infer deep latent features. In addition, we evaluate the effect of an auxiliary ordinal regression objective, which can discriminate petitions that attract different scales of popularity (e.g., 10 signatures, the minimum count needed to not be closed vs. 10k signatures, the minimum count to receive a response from UK government).
2 Proposed Approach
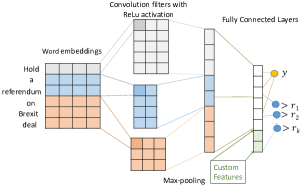
Inspired by the successes of CNN for text categorization Kim (2014) and text regression Bitvai and Cohn (2015), we propose a CNN-based model for predicting the signature count. An outline of the model is provided in Figure 1. A petition has three parts: (1) title, (2) main content, and (3) (optionally) additional details.333Applicable for the UK government petitions only. We concatenate all three parts to form a single document for each petition. We have petitions as input training examples of the form {, }, where and denote the text and signature count of petition , respectively. Note that we log-transform the signature count, consistent with previous work Elnoshokaty et al. (2016); Proskurnia et al. (2017).
We represent each token in the document via its pretrained GloVe embedding Pennington et al. (2014), which we update during learning. We then apply multiple convolution filters with width one, two and three to the dense input document matrix, and apply a ReLU to each. They are then passed through a max-pooling layer with a activation function, and finally a multi-layer perceptron via the exponential linear unit activation,
to obtain the final output (), which is guaranteed to be positive. We train the model by minimizing mean squared error in log-space,
| (1) |
where is the estimated signature count for petition . We refer to this model as CNN.
2.1 Auxiliary Ordinal Regression Task
We augment the regression objective with an ordinal regression task, which discriminates petitions that achieve different scale of signatures. The intuition behind this is that there are pre-determined thresholds on signatures which trigger different events, with the most important of these being 10k (to guarantee a government response) and 100k (to trigger a parliamentary debate) for the UK petitions; and 100k (to get a government response) for the US petitions. In addition to predicting the number of signatures, we would like to be able to predict whether a petition is likely to meet these thresholds, and to this end we use the exponential ordinal scale based on the thresholds .444We use for the US petitions, as only petitions which get a minimum of 150 signatures are published on the website. Overall this follows the exponential distribution of signature counts closely Yasseri et al. (2017).
We transform the ordinal regression problem into a series of simpler binary classification subproblems, as proposed by Li and Lin (2007). We construct binary classification objectives for each threshold in . For each petition we construct an additional binary vector , with a 0–1 encoding for each of the ordinal classes ({,,}). Note that the transformation is done in a consistent way, i.e., if a petition has signatures, then in addition to immediate lower-bound threshold in determined by (for ), all classes which have a lesser threshold are also set to 1 ().
With this transformation, apart from the real-valued output , we also learn a mapping from with sigmoid activation for each class (). Finally we minimize cross-entropy loss for each binary classification task, denoted .
Overall, the loss function for the joint model is:
| (2) |
where is a hyper-parameter which is tuned on the validation set. We refer to this model as CNN.
3 Hand-engineered Features
We hand-engineered custom features, partly based on previous work on non-petition text. This includes features from Tan et al. (2014) and Piotrkowicz et al. (2017) such as structure, syntax, bias, polarity, informativeness of title, and novelty (or freshness), in addition to novel features developed specifically for our task, such as policy category and political bias features. We provide a brief description of the features below:
-
•
Additional Information (Add): binary flag indicating whether the petition has additional details or not.
-
•
Ratio of indefinite (Ind) and definite (Def) articles.
-
•
Ratio of first-person singular pronouns (Fsp), first-person plural pronouns (Fpp), second-person pronouns (Spp), third-person singular pronouns (Tsp), and third-person plural pronouns (Tpp).
-
•
Ratio of subjective words (Subj) and difference between count of positive and negative words (Pol), based on General Inquirer lexicon.
-
•
Ratio of biased words (Bias) from the bias lexicon Recasens et al. (2013).
-
•
Syntactic features: number of nouns (NNC), verbs (VBC), adjectives (ADC) and adverbs (RBC).
-
•
Number of named entities (NEC), based on the NLTK NER model Bird et al. (2009).
-
•
Freshness (Fre): cosine similarity with all previous petitions, inverse weighted by the difference in start date of petitions (in weeks).
-
•
Action score of title (Act): probability of title conveying the action requested. Predictions are obtained using an one-class SVM model built on the universal representation Conneau et al. (2017) of titles of rejected petitions,555https://petition.parliament.uk/help as they don’t contain any action request. These rejected petitions are not part of our evaluation dataset.
-
•
Policy category popularity score (Csc): commonality of the petition’s policy issue Subramanian et al. (2017), based on the recent UK/US election manifesto promises.
-
•
Political bias and polarity: relative leaning/polarity based on: (a) (Pbias) (b) (L–R). Sentence-level left, right and neutral classes are obtained using a model built on the CMP dataset, and the categorization given by Volkens et al. (2013).
The custom features are passed through a hidden layer with activations (), and concatenated with the hidden representation learnt using the dense input document (Section 2), , before mapping to the output layer (Figure 1). We refer to this model as CNN. We use the Adam optimizer Kingma and Ba (2014) to train all our models.
4 Evaluation
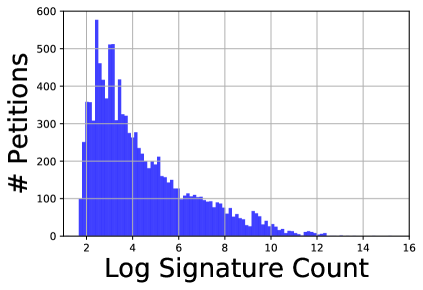
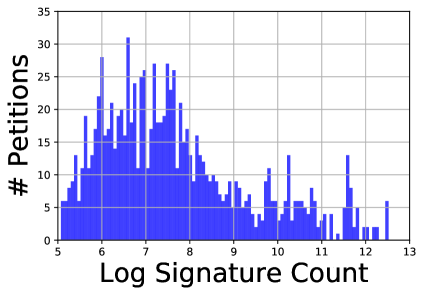
We collected our data from the UK666https://petition.parliament.uk and US777https://petitions.whitehouse.gov/ government websites over the term of the 2015–17 Conservative and 2011–14 Democratic governments respectively. The UK dataset contains 10950 published petitions, with over 31m signatures in total. We removed US petitions with signatures, resulting in a total of 1023 petitions, with over 12m signatures in total. We split the data chronologically into train/dev/test splits based on a 80/10/10 breakdown. Distribution over signature counts is given in Figures 2 and 3.
To analyze the statistical significance of each feature varying across ordinal groups , we ran a Kruskal-Wallis test (at : Kruskal and Wallis (1952)) on the training set. The test results in the test statistic and the corresponding -value, with a high indicating that there is a difference between the two groups. The analysis is given in Table 2, where , and are denoted as “***”, “**” and “*”, respectively. Note that the ordinal groups are different for the two datasets: analyzing the UK dataset with the same ordinal groups used for the US dataset ({1000,10000,100000}) resulted in a similarly sparse set of significance values for non-syntactic features as the US dataset.
We benchmark our proposed approach against the following baseline approaches:
- Mean:
-
average signature count in the raining set.
- Linear:
-
linear regression (Linear) model using TF-IDF weighted bag-of-words features.
- Linear:
-
linear regression model based on word distributions from the General Inquirer lexicon; similar to Elnoshokaty et al. (2016), but without the target goal set or category of the petition (neither of which is relevant to our datasets).
- SVR:
-
support vector regression (SVR) model with RBF kernel and TF-IDF weighted bag-of-words features.
- SVR:
-
SVR model using the hand-engineered features from Section 3.
- SVR:
-
SVR model using combined TF-IDF weighted bag-of-words and hand-engineered features.
| UK Petitions | US Petitions | ||||
| Approach | MAE | MAPE | MAE | MAPE | |
| Mean | 4.37 | 159.7 | 2.82 | 44.61 | |
| Linear | 1.75 | 57.56 | 2.51 | 37.01 | |
| Linear | 1.77 | 58.22 | 1.84 | 27.71 | |
| SVR | 1.53 | 45.35 | 1.39 | 20.37 | |
| SVR | 1.54 | 46.96 | 1.40 | 20.48 | |
| SVR | 1.52 | 44.71 | 1.39 | 20.38 | |
| CNN | 1.44 | 36.72 | 1.24 | 14.98 | |
| CNN | 1.42 | 33.86 | 1.22 | 14.68 | |
| CNN | 1.41 | 32.92 | 1.20 | 14.47 | |
| CNN | 1.43 | 35.84 | 1.23 | 14.75 | |
| CNN + Additional hidden layer | 1.40 | 31.68 | 1.16 | 14.38 | |
We present the regression results for the baseline and proposed approaches based on: (1) mean absolute error (MAE), and (2) mean absolute percentage error (MAPE, similar to Proskurnia et al. (2017)), calculated as . Results are given in Table 1.
The proposed CNN models outperform all of the baselines. Comparing the CNN model with regression loss only, CNN, and the joint model, CNN is superior across both datasets and measures. When we add the hand-engineered features (CNN), there is a very small improvement. In order to further understand the effect of the hand-engineering features without the ordinal regression loss, we use it only with the regression task (CNN), which mildly improves over CNN, but is below CNN. We also evaluate a variant of CNN with an additional hidden layer, given in the final row of Table 1, and find it to lead to further improvements in the regression results. Adding more hidden layers did not show further improvements.
4.1 Classification Performance
The F-score is calculated over the three classes of , and (corresponding to the thresholds at which the petition leads to a government response or parliamentary debate) for the UK dataset; and and for the US dataset, by determining if the predicted and actual signature counts are in the same bin or not. We also built an SVM-based ordinal classifier Li and Lin (2007) over the significant ordinal classes, as an additional baseline. The CNN models struggle to improve F-score (in large part due to the imbalanced data). For the UK dataset, CNN models with an ordinal objective (CNN and CNN) result in a macro-averaged F-score of 0.36, compared to 0.33 for all other methods. But for the US dataset, which is a binary classification task, all methods obtain a 0.49 F-score. In addition to text, considering other factors such as early signature growth Hale et al. (2013) — which determines the timeliness to get the issue online on the US website — could be necessary.
| UK Petitions | US Petitions | |||||||
|---|---|---|---|---|---|---|---|---|
| Feature | Description | |||||||
| Add | Additional details | 94.59 | *** | |||||
| Ind | Indefinite articles | 14.87 | * | 8.56 | * | * | ||
| Def | Definite articles | 34.91 | *** | * | 3.69 | |||
| Fsp | First-person singular pronouns | 53.36 | *** | 6.84 | * | |||
| Fpp | First-person plural pronouns | 11.26 | * | 6.10 | ||||
| Spp | Second-person pronouns | 13.80 | * | 3.95 | ||||
| Tsp | Third-person singular pronouns | 5.82 | 9.07 | * | ||||
| Tpp | Third-person plural pronouns | 16.13 | ** | 5.58 | ||||
| Subj | Subjective words | 12.25 | * | 7.21 | * | *** | ||
| Pol | Polarity | 2.60 | * | 4.27 | ||||
| Bias | Biased words | 11.92 | * | 4.56 | * | |||
| NNC | Nouns | 7.34 | *** | 1.93 | ** | |||
| VBC | Verbs | 2.75 | ** | 7.46 | * | *** | ||
| ADC | Adjectives | 26.14 | *** | *** | 4.07 | |||
| RBC | Adverbs | 17.09 | ** | 2.99 | * | |||
| NEC | Named entities | 51.11 | *** | *** | 3.94 | * | ||
| Fre | Freshness | 86.97 | *** | * | 13.86 | ** | * | |
| Act | Title’s action score | 3.89 | 3.54 | |||||
| Csc | Policy category popularity | 38.22 | *** | 1.94 | ||||
| Pbias | Political bias | 4.13 | 12.23 | ** | ||||
| L–R | Left–right scale | 10.94 | * | 12.88 | ** | |||
4.2 Latent vs. Hand-engineered Features
Finally, we built a linear regression model with the estimated hidden features from CNN as independent variables and hand-engineered features as dependent variables, to study their linear dependencies in a pair-wise fashion. The most significant dependencies (given by -value, ) over the test set are given in Table 2. We found that the model is able to learn latent feature representations for syntactic features (NNC, VBC, ADC,8 RBC9), Fre, NEC, Ind and Def,8 but not the other features — these can be considered to provide deeper information than can be extracted automatically from the data, or else information that has no utility for the signature prediction task. From the analysis in Table 2, some of the features that vary across ordinal groups are not linearly dependent with the deep latent features. These include ADD,8 Bias, Csc,888UK dataset only. Pbias,999US dataset only. and L–R, where the latter ones are policy-related features. This indicates that the custom features and hidden features contain complementary signals.
Overall our proposed approach with the auxiliary loss and hand-engineered features (CNN) provides a reduction in MAE over CNN by 2.1% and 3.2%, and SVR by 7.2% and 13.7% on the UK and US datasets, resp. Although the ordinal classification performance is not very high, it must be noted that the data is heavily skewed (only 2% of the UK test-set falls in the and bins put together), and we tuned the hyper-parameters wrt the regression task only.
5 Conclusion and Future Work
This paper has targeted the prediction of the popularity of petitions directed at the UK and US governments. In addition to introducing a novel task and dataset, contributions of our work include: (a) we have shown the utility of an auxiliary ordinal regression objective; and (b) determined which hand-engineered features are complementary to our deep learning model. In the future, we aim to study other factors that can influence petition popularity in conjunction with text, e.g., social media campaigns, news coverage, and early growth rates.
Acknowledgements
We thank the reviewers for their valuable comments. This work was funded in part by the Australian Government Research Training Program Scholarship, and the Australian Research Council.
References
- Asher et al. (2017) Molly Asher, Cristina Leston Bandeira, and Viktoria Spaiser. 2017. Assessing the effectiveness of e-petitioning through Twitter conversations. Political Studies Association (UK) Annual Conference.
- Bird et al. (2009) Steven Bird, Ewan Klein, and Edward Loper. 2009. Natural Language Processing with Python. O’Reilly Media.
- Bitvai and Cohn (2015) Zsolt Bitvai and Trevor Cohn. 2015. Non-linear text regression with a deep convolutional neural network. In Proceedings of the 53rd Annual Meeting of the Association for Computational Linguistics and the 7th International Joint Conference on Natural Language Processing, pages 180–185.
- Bochel and Bochel (2017) Catherine Bochel and Hugh Bochel. 2017. ‘Reaching in’? The potential for e-petitions in local government in the United Kingdom. Information, Communication & Society, 20(5):683–699.
- Conneau et al. (2017) Alexis Conneau, Douwe Kiela, Holger Schwenk, Loïc Barrault, and Antoine Bordes. 2017. Supervised learning of universal sentence representations from natural language inference data. In Proceedings of the 2017 Conference on Empirical Methods in Natural Language Processing, pages 670–680.
- Dalton et al. (2003) Russell J. Dalton, Susan E. Scarrow, and Bruce E. Cain. 2003. Democracy Transformed?: Expanding Political Opportunities in Advanced Industrial Democracies. Oxford University Press.
- Elnoshokaty et al. (2016) Ahmed Said Elnoshokaty, Shuyuan Deng, and Dong-Heon Kwak. 2016. Success factors of online petitions: Evidence from change.org. In 49th Hawaii International Conference on System Sciences, pages 1979–1985.
- Hale et al. (2013) Scott A. Hale, Helen Margetts, and Taha Yasseri. 2013. Petition growth and success rates on the UK No. 10 Downing Street website. In Proceedings of the 5th Annual ACM Web Science Conference, pages 132–138.
- Hansard (2016) Hansard. 2016. Audit of Political Engagement 13. Hansard Society, London, UK.
- Huang et al. (2015) Shih-Wen Huang, Minhyang Mia Suh, Benjamin Mako Hill, and Gary Hsieh. 2015. How activists are both born and made: An analysis of users on change. org. In Proceedings of the 33rd Annual ACM Conference on Human Factors in Computing Systems, pages 211–220.
- Kim (2014) Yoon Kim. 2014. Convolutional neural networks for sentence classification. In Proceedings of the 2014 Conference on Empirical Methods in Natural Language Processing (EMNLP), pages 1746–1751.
- Kingma and Ba (2014) Diederik P. Kingma and Jimmy Ba. 2014. Adam: A method for stochastic optimization. CoRR, abs/1412.6980.
- Kruskal and Wallis (1952) William H. Kruskal and W. Allen Wallis. 1952. Use of ranks in one-criterion variance analysis. Journal of the American Statistical Association, 47(260):583–621.
- Li and Lin (2007) Ling Li and Hsuan-Tien Lin. 2007. Ordinal regression by extended binary classification. In Proceedings of the Advances in Neural Information Processing Systems, pages 865–872.
- Lindner and Riehm (2011) Ralf Lindner and Ulrich Riehm. 2011. Broadening participation through e-petitions? An empirical study of petitions to the German parliament. Policy & Internet, 3(1):1–23.
- Pennington et al. (2014) Jeffrey Pennington, Richard Socher, and Christopher Manning. 2014. GloVe: Global vectors for word representation. In Proceedings of the 2014 Conference on Empirical Methods in Natural Language Processing (EMNLP), pages 1532–1543.
- Piotrkowicz et al. (2017) Alicja Piotrkowicz, Vania Dimitrova, Jahna Otterbacher, and Katja Markert. 2017. Headlines matter: Using headlines to predict the popularity of news articles on Twitter and Facebook. In Proceedings of the Eleventh International Conference on Web and Social Media, pages 656–659.
- Proskurnia et al. (2017) Julia Proskurnia, Przemyslaw Grabowicz, Ryota Kobayashi, Carlos Castillo, Philippe Cudré-Mauroux, and Karl Aberer. 2017. Predicting the success of online petitions leveraging multidimensional time-series. In Proceedings of the 26th International Conference on World Wide Web, pages 755–764.
- Recasens et al. (2013) Marta Recasens, Cristian Danescu-Niculescu-Mizil, and Dan Jurafsky. 2013. Linguistic models for analyzing and detecting biased language. In Proceedings of the 51st Annual Meeting of the Association for Computational Linguistics, pages 1650–1659.
- Stone et al. (1962) Philip J. Stone, Robert F. Bales, J. Zvi Namenwirth, and Daniel M. Ogilvie. 1962. The general inquirer: A computer system for content analysis and retrieval based on the sentence as a unit of information. Systems Research and Behavioral Science, 7(4):484–498.
- Subramanian et al. (2017) Shivashankar Subramanian, Trevor Cohn, Timothy Baldwin, and Julian Brooke. 2017. Joint sentence-document model for manifesto text analysis. In Proceedings of the 15th Annual Workshop of the Australasian Language Technology Association (ALTA), pages 25–33.
- Tan et al. (2014) Chenhao Tan, Lillian Lee, and Bo Pang. 2014. The effect of wording on message propagation: Topic-and author-controlled natural experiments on Twitter. In Proceedings of the 52nd Annual Meeting of the Association for Computational Linguistics, pages 175–185.
- Volkens et al. (2013) Andrea Volkens, Judith Bara, Budge Ian, and Simon Franzmann. 2013. Understanding and validating the left-right scale (RILE). In Mapping Policy Preferences From Texts: Statistical Solutions for Manifesto Analysts, chapter 6. Oxford University Press.
- Yasseri et al. (2017) Taha Yasseri, Scott A Hale, and Helen Z Margetts. 2017. Rapid rise and decay in petition signing. EPJ Data Science, 6(1):20.