Gas accretion in Milky Way-like galaxies: temporal and radial dependencies
Abstract
One of the fundamental assumptions of chemical evolution models (CEMs) of the Milky Way (MW) and other spirals is that higher gas accretion rates are expected in the past, and in the inner regions of the Galaxy. This leads to the so-called “inside-out disc formation scenario”. Yet, these are probably the most unconstrained inputs of such models. In the present paper, we aim at investigating these main assumptions by studying how gas is accreted in four simulated MW-like galaxies assembled within the CDM scenario. The galaxies were obtained using two different simulation techniques, cosmological setups and initial conditions. Two of them are MW candidates corresponding to the chemodynamical model of Minchev et al. (2013, 2014) (known as MCM) and the Local Group cosmological simulation of Nuza et al. (2014). We investigate vertical and radial gas accretion on to galaxy discs as a function of cosmic time and disc radius. We find that accretion in the MW-like galaxies seem to happen in two distinct phases, namely: an early, more violent period; followed by a subsequent, slowly declining phase. Our simulations seem to give support to the assumption that the amount of gas incorporated into the MW disc exponentially decreases with time, leading to current net accretion rates of M⊙ yr-1. In particular, accretion timescales on to the simulated thin-disc-like structures are within Gyr, consistent with expectations from CEMs. Moreover, our simulated MW discs are assembled from the inside-out with gas in the inner disc regions accreted in shorter timescales than in external ones, in qualitative agreement with CEMs of the Galaxy. However, this type of growth is not general to all galaxies and it is intimately linked to their particular merger and gas accretion history.
keywords:
galaxies: formation, evolution, intergalactic medium – accretion – hydrodynamics – methods: numerical1 Introduction
Gas accretion is a key ingredient in chemodynamical evolution models (CEMs) aiming at describing the assembly history of galaxies through the chemical imprints of stellar populations. Together with the star formation (SF) law, the assumption of a gas accretion recipe univocally determines the SF evolution of galaxies. Despite its importance, gas accretion is yet one of the least constrained inputs of such models. Moreover, CEMs of the Milky Way (MW) have shown that a significant number of observables are directly affected by assumptions on gas accretion rates and its temporal and radial dependencies. In particular, CEMs matching a large number of Galactic observational constraints assume either exponential or Gaussian accretion rates (e.g., Matteucci & Francois, 1989; Prantzos & Aubert, 1995; Chiappini et al., 1997; Portinari & Chiosi, 1999; Fenner & Gibson, 2003; Chiappini et al., 2001; Chiappini, 2009; Mollá et al., 2016). Another key assumption of CEMs is that the thin-disc of the Galaxy is postulated to form from the inside-out, i.e. the number of newly born stars per unit time has to decrease towards disc outskirts. This is usually modelled assuming a shorter infall timescale for the inner regions of the disc (e.g., Chiappini et al., 2001; Hou & Prantzos, 2001; Hou et al., 2002), together with a radial dependence of the star formation efficiency111For the classical chemical evolution results on abundance gradients see e.g., Pagel (2009), Matteucci (2012) and Stasińska et al. (2012).. These set of assumptions are key to provide CEMs successfullly reproducing observed present-day abundance gradients in the Galactic disc, as well as photometric properties of galaxies similar to the MW (Boissier & Prantzos, 1999). Some degeneracy with additional model assumptions (e.g., temporal or radial variations in the initial mass function, modelling of galactic winds, etc.) may exist, but their inclusion does not seem justified given current observational constraints.
More recently, with the advent of asteroseismology, and in particular thanks to the CoRoT satellite mission (Baglin et al., 2006), it has been possible to constrain the time-evolution of the abundance gradients in the MW (Anders et al., 2017a, b). This key new observational constraint is well reproduced by the chemodynamical model of Minchev et al. (2013, 2014) (hereafter MCM13, MCM14), that combines the chemical modelling provided by CEMs with the dynamical information of -body simulations. The reason for this agreement can be attributed mainly to the following: (i) the inside-out formation of the disc in their hybrid-model approach adopts the prescriptions of Chiappini (2009) for the MW thin-disc, and (ii) the dynamically self-consistent stellar radial migration is taken from a simulated galaxy (Martig et al., 2012) that contributes to flatten the original gradient of the oldest stars.
Further constraints come from large spectroscopic surveys, which have also shown present-day chemical abundance gradients to flatten with increasing height from the Galaxy’s midplane (e.g., Chen, 2012; Boeche et al., 2013, 2014; Anders et al., 2014; Hayden et al., 2014; Minchev, 2015). Again, these rather new constraints are readily explained by the MCM13 and MCM14 chemodynamical model (see also Minchev et al. 2016 for more details and comparison with other observational constraints). In this respect, the variation of SF histories as a function of cosmic time and galactocentric distance is essential to reproduce chemical abundance diagnostic diagrams as, for instance, the classical [/Fe] vs. [Fe/H] plot (see Anders et al., 2014, 2017a, and references therein).
Direct evidence of ongoing/recent accretion of external gas from minor mergers and interactions, as well as from halo gas and the local environment in nearby galaxies –including the MW and Andromeda (M31)– has been found (e.g., Thilker et al., 2004; Sancisi et al., 2008; Lehner & Howk, 2011; Putman et al., 2012; Richter, 2012; Gentile et al., 2013; Richter et al., 2017). Spiral galaxies in the local universe show extraplanar H i structures and so-called high-velocity clouds (HVCs) of neutral material presumably feeding star formation in galaxy discs at a rate of about M⊙ yr-1(Sancisi et al., 2008; Richter, 2012; Putman et al., 2012). Furthermore, the ionized counterpart of HVCs has also been detected in the MW halo at higher rates, suggesting that these clouds comprise the bulk of gas accretion in MW-type galaxies (Lehner & Howk, 2011; Richter et al., 2017). In fact, the existence of a gas-reservoir around galaxy-size haloes has long been suggested by numerical simulations222See Nuza et al. (2014) for a thorough comparison between simulations and observations of the gaseous halo components in MW and M31. and it is hinted by observations of the MW and nearby spirals (e.g., Thilker et al., 2004; Sancisi et al., 2008; Miller & Bregman, 2015; Richter et al., 2017), and of more massive and distant galaxies (e.g., Tumlinson et al., 2013; Singh et al., 2018).
Other works place constraints based on more indirect methods. For instance, Rocha-Pinto et al. (2000) proposed that the empirical age-metallicity relation and the SF history (SFH) of the MW allow an estimate of the time variation of gas mass, which could lead to an estimate of gas accretion evolution. Fraternali & Tomassetti (2012) used a model-dependent method (excluding chemical information) to derive gas infall rates in spiral galaxies as a function of time and galactocentric distance, applied to 21 galaxies from the THINGS survey (Walter et al., 2008) and the MW. For the latter, the authors find a general good agreement with conclusions coming from pure CEMs.
Nevertheless, a precise derivation of past accretion or ejection rates in galaxies is extremely difficult to obtain, either from observations or first principles, calling for the use of hydrodynamical simulations in a cosmological framework with enough resolution and reliable feedback modelling (important to constrain the role of outflows). Current zoom-in, high-resolution, cosmological simulations of MW-like systems are broadly consistent with a large number of chemical, dynamical and structural properties of galaxies (e.g., Guedes et al., 2011; Dubois et al., 2013; Stinson et al., 2013; Aumer et al., 2014; Genel et al., 2014; Hopkins et al., 2014; Marinacci et al., 2014; Naab et al., 2014; Wetzel et al., 2016; Grand et al., 2017). However, the relative contribution of the different feedback processes shaping them (e.g., supernova vs. black hole vs. radiation pressure vs. cosmic ray feedback) is still under debate (Scannapieco et al., 2012). For MW-mass systems, the release of energy and chemical elements by supernovae plays a crucial role in their formation and evolution, enriching the interstellar medium and circulating material between the thin disc and galactic halo components (Scannapieco et al., 2008). Although recycled gas seems to be underdominant in comparison to gas directly accreted from the intergalactic medium, this has not been yet studied in detail and might have consequences for CEMs.
Using the chemical evolution approach, Chiappini et al. (1997, 2001) demonstrated that a model assuming two main accretion episodes for the formation of the Galaxy gives a reasonable description of observations both in the solar neighborhood and the whole disc. According to this model, during first infall, primordial gas is rapidly accreted giving rise to the formation of spheroidal components (i.e., stellar halo and bulge) of the Galaxy. This episode is followed by the smooth accretion of fresh gas in much longer timescales resulting in the inside-out formation of the thin-disc component. Recently, by analysing a sample of MW-like systems in the EAGLE cosmological simulation, Mackereth et al. (2018) found that a ‘two-infall’ model of the kind described above may provide a plausible explanation for the bimodality observed in [/Fe] vs. [Fe/H] distribution, although the usual approximation of instantaneous mixing of star-forming gas in CEMs can lead to some discrepancies.
In this work, we compute gas flows on to galactic discs of a set of simulated MW-like systems and study their gas accretion history in relation to the usual assumptions of CEMs333Preliminary results can be found in Nuza et al. (2018).. We consider the exchange of gas between the stellar disc and its surroundings, as well as radial migration within the disc. Our sample consists of four MW-like galaxies from Martig et al. (2012) and Nuza et al. (2014) plus a rescaled version of one galaxy of the former following the procedure of MCM13 and MCM14. These galaxies correspond to two different simulation suits, each of them with their own advantages and shortcomings, that serve to gauge the variance in existing self-consistent galaxy formation models. However, the discussion concerning the detailed modelling of the physics of accreted gas in simulations is out of the scope of this paper444For a recent discussion on the subject see e.g., Nelson et al. (2016) and references therein..
The structure of the paper is as follows. In Section 2, we present the cosmological simulations used to obtain the MW-like galaxies analysed in this work, their properties and the main differences between the two galaxy formation models. In Section 3 we describe the method used to compute gas fluxes on to the simulated stellar discs. Results are presented in Section 4, where we focus on gas fluxes and accretion patterns vs. cosmic time and radius for material coming from directions perpendicular and parallel to the disc plane. Finally, in Section 5 we summarise and discuss our results.
2 Cosmological simulations
We analyse four galaxies labeled g37, g106, MWc and M31c, which were obtained using two different simulation techniques, cosmological setups and initial conditions. Galaxies g37 and g106 are obtained assuming a WMAP-3 cosmology. They belong to the Martig et al. (2012) sample of simulated galaxies and were chosen to display a quiet merger history. On the other hand, galaxies MWc and M31c are the MW and M31 candidates of Nuza et al. (2014) (see also Scannapieco et al. 2015) that were extracted from a WMAP-5 cosmological simulation of the Local Group. As a result, these galaxies reside in an environment more similar to the actual one. The main properties of each model galaxy at are shown in Table 1. The latter also includes a scaled-down version of g106, referred to as g106r, that was used as a MW candidate by MCM13 and MCM14 in their Galactic chemodynamical model. More details concerning the galaxies, as well as the main assumptions and techniques adopted to perform each simulation, can be found below.
| Name | B/T | Reference | ||||
|---|---|---|---|---|---|---|
| [ M⊙] | [kpc] | [ M⊙] | [kpc] | |||
| g37 | 120 | 220 | 12.0 | 35.1 | 0.13 | Martig et al. (2014) |
| g106 | 42 | 154 | 4.3 | 24.6 | 0.22 | Martig et al. (2014) |
| MWc | 125 | 222 | 4.3 | 14.7 | 0.43 | Nuza et al. (2014) |
| M31c | 168 | 245 | 4.7 | 15.3 | 0.73 | Nuza et al. (2014) |
| g106r† | 28 | 92 | 7.9 | 15.0 | 0.22 | MCM13, MCM14 |
†Rescaled g106 used as a MW proxy by MCM13 and MCM14 (see Section 4.3).
2.1 g37 and g106
These galaxies are selected from the larger galaxy sample of Martig et al. (2012). The simulation technique involves basically two steps (see Martig et al., 2009, for technical details). First, a dark-matter-only simulation is performed in a box of Mpc on a side using the adaptive mesh refinement RAMSES code (Teyssier, 2002) to extract merger and accretion histories for the target haloes. Some properties such as time, mass, velocity and spin of incoming satellites are then stored. In the second step, a new simulation is performed in which each halo recorded in the dark-matter-only run is replaced by a model galaxy made up of gas, stars and dark matter particles. Similarly, each diffuse particle of the cosmological simulation is replaced with a blob of higher-resolution gas and dark matter particles. These model ‘seed’ galaxies are made up of a disc containing gas and stars, a stellar bulge and a dark matter halo following analytical prescriptions for the profiles in each case.
The stellar mass of a galaxy in the simulation is set according to the Moster et al. (2010) relation as a function of halo mass and redshift. All model galaxies are assumed to be disc galaxies without a bulge, except for the most massive haloes with M⊙ at , in which case the mass of the bulge is set to of the stellar mass. The gas content in the disc is also set according to an analytical scheme: at , the gas fraction (with respect to the total baryonic mass) is 0.3 for small galaxies ( M⊙) and 0.15 for the massive ones. At higher redshifts, the gas fraction is chosen independently of the total mass, and is set to 0.5 for and 0.7 for . No hot gas halo is included, which should be a sensible approximation only for halo masses lower than a critical mass of M⊙ , which is required for virial shocks to be stable (e.g., Birnboim & Dekel, 2003).
The resimulation starts at inside a region of radius 800 kpc, i.e. spanning a few times the virial radius value of the main galaxy at , and follows its evolution down to the present epoch. The mass resolution is set to M⊙ for gas, M⊙ for stars and M⊙ for dark matter. Note that in these simulations there are no particles outside the 800 kpc sphere. Gas dynamics is modelled with a sticky-particle scheme including also the effect of star formation, (kinetic) supernova feedback and the continuous mass loss rate from stars (see Martig et al. 2012 and references therein for details on the modelling of these processes).
The target haloes are selected in such a way that they inhabit relatively isolated environments at , i.e. no halo more massive than half of their mass can be found within Mpc and they are, at least, at a distance of Mpc from one of the four most massive haloes in the simulation. Therefore, by construction, the target haloes are located in underdense regions with typical environmental density between that of the centre of voids and the LG. As a result, the merger history of the target haloes displays a relatively quiet behaviour with none or few significant mergers at late times. In particular, g37 shows a quiescent history555Following Scannapieco et al. (2015), we refer to ‘minor’, ‘intermediate’ or ‘major’ mergers when the total mass ratio of the colliding galaxies is , or , respectively.: all interactions at are ‘minor’, displaying stellar mass ratios smaller than 1:50. The situtation is similar for g106 which has only one ‘major’ merger at with a stellar mass ratio of 1:5. Such a quiet merger history promotes the formation of galaxies with dominant stellar discs.
The main advantage of this numerical technique is the low computation time needed to perform the resimulations. This allows to increase the mass resolution at a lower computational expense. Also, the fact that the evolution of the main galaxy is decoupled from the expansion of the universe keeps the physical resolution constant as a function of time at no additional cost. The most important drawbacks are related to the large number of free parameters needed to model the seed galaxies; the ad-hoc distribution of gas within the lagrangian region, and the treatment of hydrodynamics using a sticky-particle model that poorly treats the hot gas phase in haloes with masses above the critical M⊙ value. This limitation implies that the main accretion mode for g37 and g106 consists of cold gas coming from neighboring filaments.
2.2 MWc and M31c
In our study we also analyse the MW and M31 candidates of Nuza et al. (2014) which have been extracted from a simulation of the LG performed within the context of the CLUES project666www.clues-project.org. The simulation is run using the Tree-PM Smoothed Particle Hydrodynamics GADGET-3 code (Springel, 2005; Springel et al., 2008) including modules for star formation, metal-dependent cooling, chemical enrichment, (thermal) supernova feedback, a multiphase model for the gas component and a UV background field (see e.g., Scannapieco et al., 2015, and references therein, for details concerning the modelling of these processes).
The initial conditions (ICs) reproduce, by construction, the known dynamical properties of the local Universe at the present day within a dark-matter-only periodic box of Mpc on a side (see Yepes et al., 2014, for details on the method and the type of constraints used). The simulation starts at inside a zoomed-in sphere of Mpc radius, located at the center of the box, containing so-called high-resolution gas and dark matter particles with a mass of M⊙ and M⊙ respectively. The size of this region is large enough to comprise the large-scale distribution of gas in the LG associated to the MW and M31 galaxy candidates during their evolution. Additionally, this also ensures that the transition between the low- and high-resolution zones occurs away from the position of the target galaxies thus decreasing the chances of contamination with low-resolved particles in the region of interest.
As galaxies evolve, the influence of the LG environment on the formation of galaxy candidates is taken into account777The interested reader is also referred to Creasey et al. (2015) which focuses on the effect of the LG environment in the final galaxy properties for a related set of runs.. As a result, gas inflows are consistently included in the simulation, eventually giving rise to the formation of stellar discs in a natural way. This cosmological setup enables us to test the assembly history of a Milky Way-type galaxy without introducing any other simplifying assumptions, i.e. no ad-hoc prescriptions for the gas distribution, merger trees and/or ‘seed’ galaxies at early times are assumed. As shown by Nuza et al. (2014) both ‘cold’ an ‘hot’ accretion modes are considered throughout the evolution with warm-hot material significantly contributing to the accreted mass budget. This is clearly the main advantage of full cosmological simulations such as the present one, although, in this case, model consistency is achieved at the expense of a lower numerical resolution.
At , the target haloes inhabit an environment similar to that of the actual LG. The two main galaxies in this region, labelled MWc and M31c, are separated by a distance of kpc and are approaching each other with a radial velocity of km s-1, resembling the actual MW-M31 system. However, it is worth noting that, as the constraints in the ICs can only be imposed on large scales, the properties of the simulated MWc and M31c will not necessarily reproduce in detail those of the actual ones.
The more realistic LG scenario in this simulation suggests that the merger history of the target galaxies has to be more active than in the g37 and g106 cases. In fact, at , MWc undergoes four ‘intermediate’ mergers: two at and with a stellar mass ratio of 1:20; one at with a ratio of about 1:10, and one at with a ratio of 1:50. M31c undergoes two ‘intermediate’ mergers at and with a stellar mass ratio of 1:20, and two ‘major’ mergers at and with a stellar mass ratio of about 1:4 and 1:3, respectively (see Table 2 of Scannapieco et al. 2015). In particular, these two last ‘major’ mergers are responsible of significantly reducing the growing stellar disc of the simulated M31c leading to a bulge-to-total ratio larger than for the actual M31. However, this characteristic is not relevant for our study as here we are only interested in studying the evolution of gas accretion onto MW-size haloes regardless of the detailed properties of the resulting stellar discs.
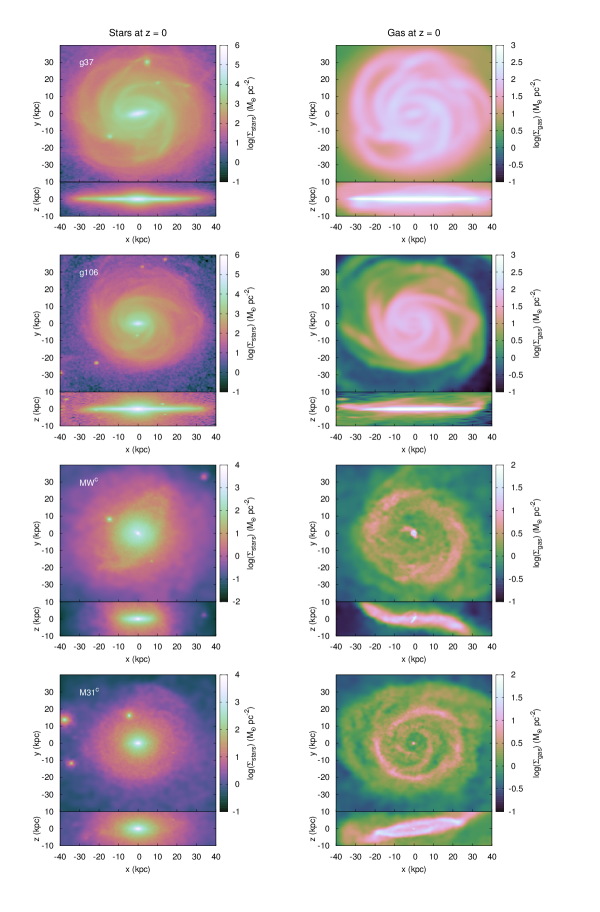
The stellar and gas densities for the simulated galaxies at the present time can be seen in the left and right columns of Fig. 1 respectively, where we show the first four galaxies in Table 1 (from top to bottom). Galaxy g106r is not shown as it is just a scaled-down version of g106. Every panel depicts both face- and edge-on views in the reference frame corresponding to the stellar or gaseous discs; meaning that their orientation defines the -plane of the systems for each component (see Section 3.1). As expected, g37 and g106 galaxies display a very thin and large stellar disc (see in Table 1) which is always aligned to the gaseous one at late times. In addition, the bulge counterpart is small. This is not always the case for the CLUES galaxies owing to the larger number of interactions undergone by them evidenced, for instance, by the presence of warps in the gas distribution. This indicates that considering target galaxies in the right environment can play an important role in the final galaxy properties.
3 Computing gas fluxes
The flux of particles per unit time at an arbitrary surface is defined as
| (1) |
where is the number of particles crossing the area and is the time interval considered. Ideally, one would like to sample this function in a continuous way. However, simulations only provide a discrete set of output files indicating the spatial and kinematical information of the gas particles. It is possible to think of these outputs as a collection of pictures, or snapshots, of the simulated system at different stages in its evolution. Therefore, in order to compute the flux of gas particles as a function of time using Eq. 1, we need to know the particle trajectories between the different snapshots. In this way, we will be able to compute the approximate crossing time and position of gas particles accross any given surface.
As a first approximation, one could think of estimating particle trajectories using a linear path between snapshots if the corresponding time interval is small enough. However, this approximation cannot be adopted in our case, mainly because the collisional nature of gas can significantly depart particles from a linear trajectory. In addition, gas particles may appear or disappear from the studied region, e.g. after being ejected as a result of supernova feedback or, eventually, transformed into a star particle if the conditions for star formation are fulfilled.
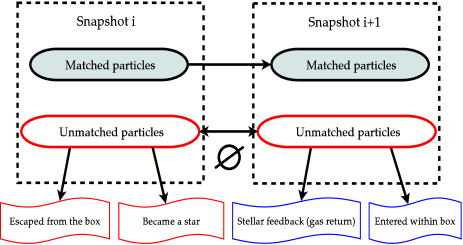
A schematic view of all possible cases between two consecutive output files can be seen in Fig. 2, where gas particles have been divided among those found in both snapshots (matched particles) and those without a matched counterpart (unmatched particles). For the sake of simplicity, when computing the fluxes, we will ignore unmatched particles as there is no obvious way to track their trajectories. Fortunately, this type of particles only represents a small fraction of the total number (, depending on the simulation) for most of the evolution; specially after the first accretion episode.
Once we have identified the particles belonging to all consecutive output files, we calculate their acceleration using the initial and final positions in order to track the trajectories more precisely. This allow us to estimate the spatial and time coordinates of all particles crossing the stellar disc boundary by dividing the time interval between snapshots into smaller timesteps. In the next section, we will present more details concerning the choice of coordinate system and the flux calculation.
3.1 Defining the surfaces
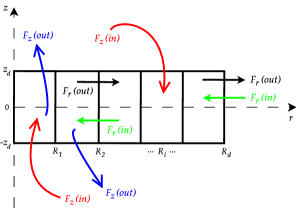
We follow the accretion history of our simulated galaxies adopting, in each case, a coordinate system aligned to the total angular momentum of the stellar discs. In this way, we are able to follow the orientation of the galaxies as they evolve to determine the amount of material flowing across the vertical and radial directions with respect to the plane defined by the stellar discs. Therefore, at any given cosmic time, a flat cylinder comprising the rotationally supported stellar component in the plane is adopted. The cylinder is divided into several rings of radius and width to study the radial dependence of flux up to a distance . The vertical coordinate of the cylinder goes from to , where defines the cylinder’s height. We note that, at very early times, vertical and radial directions are essentially indistinguishable as only weak rotational support is achieved by the stellar component at these stages.
Fig. 3 shows a scheme depicting the adopted reference frame as well as the gas fluxes across the radial and vertical directions; and represent the flux of infalling and outflowing material across the arbitrary surfaces , whereas and stand for the flux across the surfaces , i.e. inwards and outwards towards the galactic centre. Thus, using the flux definition given by Eq. 1, we can compute the time-dependent particle fluxes as function of radius as follows
| (2) |
| (3) |
where and are the number of particles crossing the surfaces during time , defined by the timestep between two consecutive output files (see Figs. 2 and 3). In what follows, we will convert all fluxes to (physical) units of M⊙ Gyr-1 pc-2 by transforming the corresponding particle number into mass. If all gas particles have the same mass resolution this is a straightforward task; otherwise, we must integrate over particle masses as they cross the surfaces of interest.
The amount of mass deposited on an arbitrary surface during a certain period of time can be written as
| (4) |
where represents the inflowing/outflowing gas mass flux accross surface as computed from Eqs. 2 and 3. The integrated mass deposition over the entire disc can be simply calculated by summing up the contributions of the different elements, i.e.
| (5) |
where is the total number of surfaces, is the adopted disc radius and is the width of the radial bins shown in Fig. 3.
It is important to emphasize that –inspired in the framework adopted by CEMs– we are using cylindrical coordinates to check gas flows through the disc surfaces. A direct comparison with other gas accretion studies (e.g., Peek et al., 2008; Joung et al., 2012; Nuza et al., 2014; Ceverino et al., 2015; Nelson et al., 2015) must be performed with care since gas infall is usually measured adopting spherical coordinates, i.e. no prefered direction is considered.
3.2 Setting the cylinder’s size
To perform flux calculations, we adopt kpc and kpc for the radius and -coordinate’s range of the cylinder, respectively (see Fig. 3). The cylinder’s radius is deliberately chosen larger than the optical radius of the galaxies at . We note that such a large value is motivated by the fact that gaseous discs are more extended than stellar ones; alowing us to compute fluxes over their whole extension888The choice of does not strongly affect our results for radially-integrated quantities because flux contributions at distances larger than optical radii of our simulated galaxies are significantly smaller than in central regions (see next section).. On the other hand, the adopted gives a cylinder’s height of kpc which is large enough to encompass the vertical distribution of simulated disc stars. The influence of varying this parameter on the results is discussed in Appendix A.
4 Results
In this Section, we investigate the behaviour of the vertical and radial gas fluxes (inflowing and outflowing) as a function of time and radius for our four simulated galaxies (Sections 4.1 and 4.2) and gas accretion rates focusing only on our MW candidates (Section 4.3). Note that, according to our definition, all fluxes are positive. In what follows, we define net flow rates as the difference between the infall and outflow fluxes, such that a positive value indicates a net gas infall.
4.1 Vertical and radial gas fluxes vs. time and radius
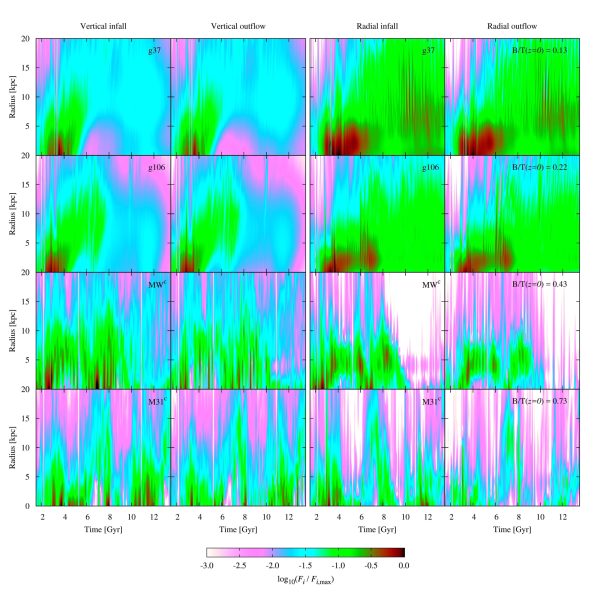
In order to have a first, qualitative view of the vertical and radial flow patterns of our simulated galaxies, we show, in Fig. 4, the colour-coded logarithm of gas fluxes defined by Eqs. 2 and 3, where the horizontal and vertical axes indicate the cosmic time and disc radius, respectively. In this figure, colours represent flux values, normalized to the peak infall value of each galaxy, in order to identify the radii and times of the dominant gas flows. This procedure is performed separately for every flux component showing the vertical (radial) patterns in the left-hand (right-hand) panels.
The first column of Fig. 4 shows the vertical gas infall of our four simulated galaxies, indicating that gas inflows are higher both at early times –the first gigayears of evolution– and at the innermost radii. At later times, the accretion is smoother, as well as extended in radius. This general behaviour is shared by all of our galaxies. However, it is clear that there are some qualitative differences between the two sets of simulations. In the CLUES galaxies, the accretion activity at late times is larger than for g37 and g106, as a result of the richer environment where they reside. Some of these accretion episodes are driven by ‘intermediate’ (see e.g. the significant infall in MWc at Gyr) and ‘major’ mergers; in contrast to the ‘minor’ ones taking place in g37 and g106 for most of their evolution (see Section 2.2). In particular, M31c experiences several massive mergers after , seen as infall peaks at Gyr and Gyr, (see also Fig. 6 of Scannapieco et al. 2015) that disrupt the stellar disc and produce a bulge-dominated galaxy at the current epoch. Enhanced accretion in these simulations can also occur as a result of fountains triggered by feedback, as gas moves out from the disc owing to energy ejected during SN explosions to be reaccreted later.
The outflow of gas in the vertical direction is shown in the second column of Fig. 4. Outflows can be generated both by SN explosions and/or by the passage of orbiting satellites. There is a significant correlation between inflow and outflow vertical patterns, possibly produced by the birth of stars in inflowing disc regions. This is more pronounced in the case of g37 and g106 owing to the poor treatment of the hot gas phase in these galaxies that prevents the mixing of gas phases. Note that, in the simulations, the particularities of our two galaxy formation models can in fact lead to differences in the behaviour of the gas components. Ultimately, the rate of mass deposition in galaxy discs will depend on the interplay between gas inflows and outflows as it will be shown below.
The last two columns of Fig. 4 show the normalized inward and outward radial maps. Interestingly, radial and vertical flows are correlated. This is expected as gas falling on to the central galaxy regions will, in general, cross the boundaries of the cylinder in all directions. For the radial flows, we also detect higher gas fluxes at earlier times and small radii, although they are less concentrated in time compared to the vertical ones. Whereas in galaxies g37 and g106 the behaviour of the radial flows is smoother –slowly increasing in radius as time elapses– for the CLUES galaxies the radial accretion is more episodic; particularly at intermediate and late times. This is produced by the fact that, after the first infall event, accretion of material in g37 and g106 is less violent than in the CLUES simulation. As a result, the former are able to develope larger and denser gaseous discs at the present time.
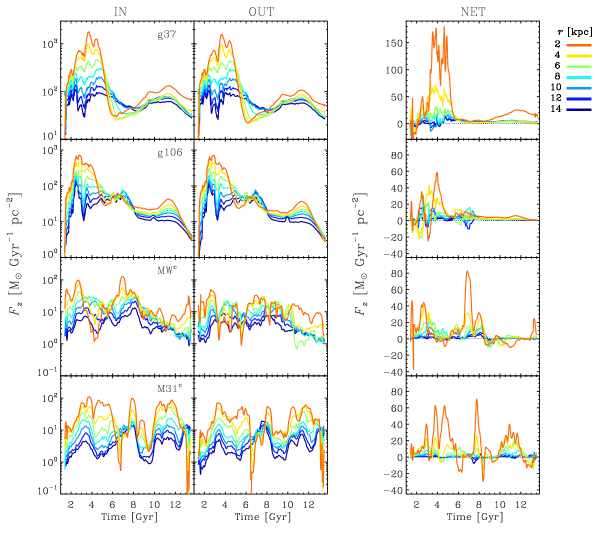
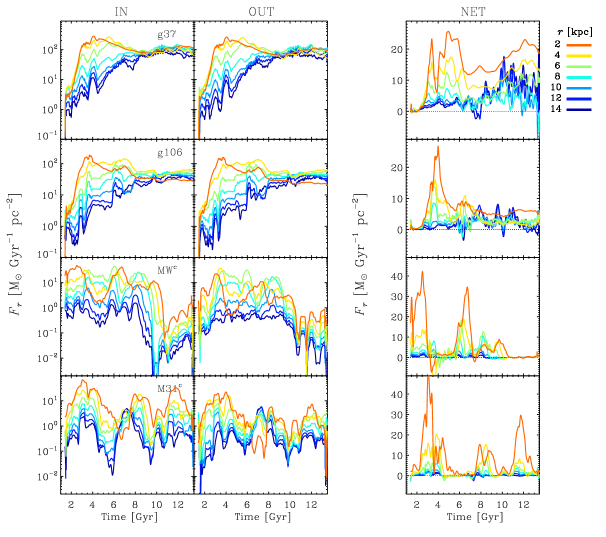
In Figs. 5 and 6, we quantitatively compare the gas flows for our simulated galaxies as a function of time for various radial bins. Besides the inflow and outflow patterns in each component (left-hand panels), we also show the net flux, i.e. , such that a positive value indicates a pure gas inflow (right-hand panels). These figures indicate that inflow fluxes tend to be higher at early times and for the smallest radii. This is most noticeable for g106 and MWc galaxies, whose properties at better resemble those of the MW rather than g37 and M31c. A similar result has been found by Courty et al. (2010) after measuring vertical inflows in a MW-size simulated galaxy, although showing a somewhat stronger radial dependence at the present time. Quite generally, gas inflows are larger than outflows for most of the evolution. For all simulated galaxies, both the vertical and radial net flows are dominated by the smallest radii, up to about kpc from their centre. Additionally, vertical inflows at these radii are always dominant compared to radial flows; except for the very central regions at early times, where, although smaller, they are more similar. Radial flows remain small for most of the evolution but show a significant net inward flux at early times in agreement with MCM14 (see their Fig. 12). However, these are boosted during merger events at small and intermediate radial distances. Note also that, in the case of g37, the radial inflow within kpc is very pronounced and it is spread over a wide time interval, which is suggestive of the strong bar formed in this galaxy.
Galaxy g37 is the one with the highest vertical infall values at early times, followed by g106, MWc and M31c, which might reflect the particular environment they inhabit and the halo mass variation in each galaxy formation model999Note that, in the case of CLUES galaxies, whereas MWc is the least massive of the two at , M31c is the least massive at higher redshift (see Scannapieco et al. 2015).. In the case of net radial flows, the situation is similar for all galaxies; although net flows at later times can be different, both in terms of their shape and magnitude. This is because, at late times, the formation history of a galaxy can significantly alter the accretion patterns, particularly in the presence of mergers, which are easily seen as flux enhancements. As already mentioned, this is fairly evident in CLUES but it can also be seen in g106 at Gyr, which corresponds to the only significant merger during its entire lifetime. Note that, even if satellite galaxies are not extremely gas-rich (as it is, in fact, the case of our CLUES simulations; see Scannapieco et al. 2015), and regardless of whether they fly-by or merge with the central galaxy, their interaction can drive gas inflows towards its center.
Our finding of higher accretion flux for earlier times and smaller radii is in agreement with the so-called ‘inside-out’ disc formation scenario, in the sense that an early, strong infall leads to the formation of the inner region of the galaxy in a short timescale, followed by a subsequent, smoother growth of the gaseous disc, eventually allowing the formation of a stellar disc (e.g., Larson, 1976; Brook et al., 2012). We note, however, that the stellar component will not necessarily directly follow gas accretion history as, although star formation depends primarily on gas density, it is also influenced by feedback effects in a non-trivial manner. In this work we are mainly interested in studying gas inflow patterns on to the self-consistently evolved stellar disc that may eventually serve as fuel for star formation. Therefore, it is out of the scope of this paper to quantify how much of the accreted material is transformed into stars and ends up building the stellar disc.
4.2 Averaged fluxes
In this Section we focus on gas flows in the simulated galaxies studying separately their radial- and time-dependencies. As seen above, the picture may appear complex if we look at the flux as a function of time and radius, . In order to simplify this view, we integrate the infall (inward) and outflow (outward) fluxes in time and radius, producing two averaged flux functions that can be easily interpreted. After integrating in time and dividing by the total time spanned by the simulation, we obtain the following radial-dependent function
| (6) |
where for each annulus of radius we sum the flux at each timestep over the entire time interval . Thus, for a given radius, this function is proportional to the time-integrated mass per unit area in an arbitrary surface . Similarly, for the radially-averaged temporal flux we can write
| (7) |
which is simply the flux version of Eq. 5 divided by the corresponding total surface area. If cylinder’s caps are considered the resulting function is proportional to the total mass accretion rate on to the disc plane at a given time. If, instead, radial surfaces are used, Eq. 7 provides a measure of the mass flow rate in the plane of the disc at a given cosmic time.
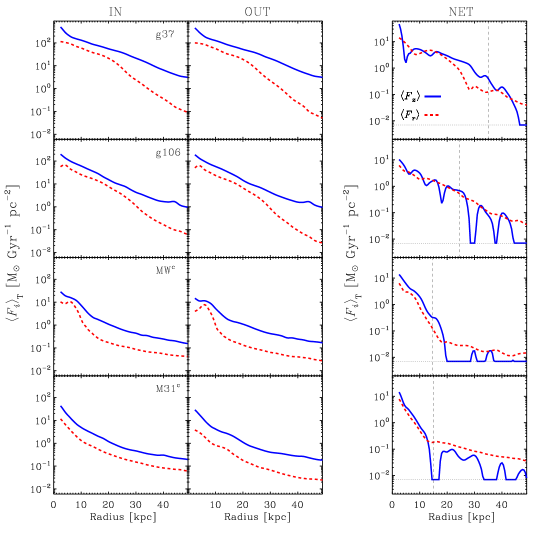
The left-hand panels of Fig. 7 show gas infall and outflow vs. radius as obtained from Eq. 6 for the four simulated galaxies. As before, in the right-hand panel, we also plot the resulting net infall. Both vertical and radial mean flows are shown. Decreasing fluxes with radius are consistent with the inside-out picture introduced in the previous section, showing that, during the whole evolution, more material is being accreted in the inner regions than in the outskirts. It is interesting to notice that, even beyond the optical radii of the simulated galaxies (kpc), gas is still being accreted in small amounts on to their gaseous discs, consistent to the findings of Sommer-Larsen et al. (2003). These plots demonstrate that gas infall accross the disc can be reasonably well described by an exponential law as also shown by Peek et al. (2008). However, net vertical infall patterns complicate this picture, as they are typically noisier owing to the interplay between inflowing and outflowing material in certain disc regions. Interestingly, three out of four of our galaxies, show that net infall fluxes decrease significantly close to the edge of stellar discs (see vertical dashed lines in the right-hand panel of Fig. 7), suggesting that star formation beyond these radii is less efficient. In this case, an exponential law up to the termination radius of the stellar discscan also be taken to describe the net infall of gas.
The existence of extended H i discs in spirals is further supported by the recent work of Bland-Hawthorn et al. (2017). After computing the fraction of atomic hydrogen in the presence of an external ionizing background, these authors conclude that there is room for the detection of proto-discs of neutral material at radii larger than previously thought. For instance, for column densities of cm-2, the H i discs might reach galactocentric distances of about kpc, according to the different scenarios considered. This is consistent with the flattened H i structures seen in our CLUES galaxies (see Fig. 10 of Nuza et al. 2014). From these simulations it is possible to speculate on the origin of the accreting material at such large distances, which is presumably associated to the circumgalactic halo.
The radial dependence of gas flows is similar in all galaxies although displaying different slopes. Radial inward and outward flux values are typically smaller than vertical ones, except for the very central regions, where they can be of the same order. In general, net radial and vertical fluxes show similar magnitudes. In terms of radial mass deposition within a given disc radius, , this is mostly relevant for the central regions, i.e. at kpc for our fiducial value, being subdominant in comparison to net vertical mass inflows. In addition, there is a clear change of regime beyond the optical radius, with radial slopes getting shallower in three of our galaxies. This indicates that, beyond stellar discs, radial fluxes become roughly constant, eventually overtaking vertical ones at large radii.
The time dependence of the infall in galaxies has been shown to be much more complex. Sommer-Larsen et al. (2003) and Fraternali & Tomassetti (2012) found that the gas accretion history is in agreement with an exponential decay function. It is worth noting that these authors have reached the same conclusion after considering different accretion scenarios. For instance, Sommer-Larsen et al. (2003) assumed that the cooling of hot coronal gas is responsible for the gas accreted onto the galactic disc. However, this mechanism has been challenged by invoking thermal instability effects in the corona (Binney et al., 2009; Nipoti, 2010). On the other hand, Fraternali & Tomassetti (2012) obtained a smooth exponential accretion law by modelling the star formation rate (SFR) using the Kennicutt-Schmidt law, i.e. only considering gas actively involved in star formation, thus ignoring the bulk of the accretion. There is no unique explanation able to reproduce the accretion history of gas in an unbiased way. Moreover, several mechanisms are taking place simultaneously as shown by numerical simulations (e.g., Nuza et al. 2014), where a halo mass transition of M⊙ separates the ‘cold’ and ‘hot’ accretion regimes (Birnboim & Dekel, 2003)101010See, however, Nelson et al. (2015) for a recent discussion on the validity of a critical halo mass transition for the emergence of stable virial shocks.. We note that virial masses in our simulated galaxies at lie just around this critical value and, therefore, the two accretion modes could contribute. This is valid for our CLUES galaxies during most of their evolution. In the case of g37 and g106, however, no hot halo gas is included as a result of the adopted sticky-particle treatment of hydrodynamics (see Section 2.1). In this work, we do not make any prior assumption about how gas is deposited on to the stellar disc. We only use kinematic information provided by the hydrodynamical simulations to derive the infall flux, regardless of the mechanism responsible for the accretion. Therefore, within the limitations of the simulations, we believe that gas kinematics can be used to derive a coherent picture of the total accretion history of our MW-size objects in a reliable way.
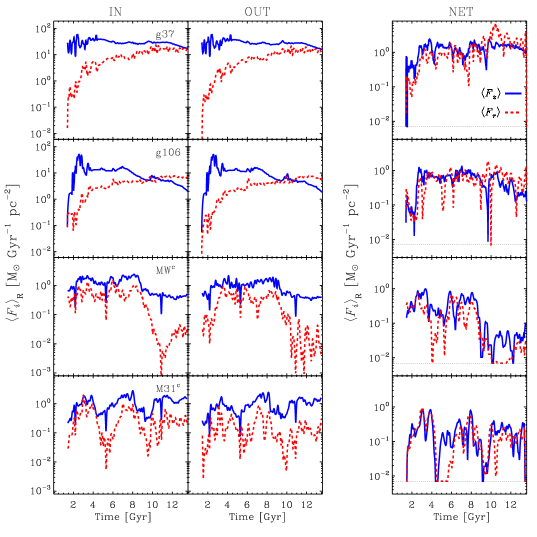
Fig. 8 shows the time dependence of gas fluxes computed using Eq. 7 for the four simulated galaxies. Both vertical and radial flux contributions are considered. The left-hand panel shows that radial fluxes are smaller than vertical ones during a significant fraction of the evolution (see also Figs. 5 and 6). After first infall, net flows show the same tendency for all galaxies developing a significant stellar disc at the end of the simulation and with vertical-to-radial flow ratios of about 2. Interestingly, this tendency reverses for g106 at Gyr, i.e. well beyond the formation of the stellar disc in this simulation, when vertical accretion becomes negligible. The fact that radial fluxes show a net inward flow indicates that gas particles are able to migrate between different disc annuli. This is specially true at the smaller radii which are the ones dominating the signal. Nevertheless, as shown by MCM14 for a rescaled version of g106 (see next section), most of the orbiting gas particles in the disc are non-migrators.
From these plots, it can also be seen that a simple exponential law can not explain the details of the whole gas accretion history in any of the galaxies under study. However, on average, an exponential law appears to be useful to describe fluxes over certain periods of time. This can be better applied after the first accretion episode, where average fluxes can be approximated using a linear function in the plane. In particular, the net infall evolution for galaxies g37, g106 and MWc show a slight decline of just a few times for g37 to more than an order of magnitude for g106 and MWc. In the case of M31c, the very active merger history significantly flattens gas flows as a result of the continuous supply of material induced by mergers. It is worth recalling that M31c does not have a dominant stellar disc at , unlike actual M31, owing to the effects of late-time massive mergers (Scannapieco et al., 2015).
4.3 Gas accretion rate vs. cosmic time for MW candidates
In this section, we focus on the analysis of the MW galaxy candidates in our sample, i.e. g106 and MWc, to study in more detail several aspects of the gas infall process as a function of cosmic time. Following MCM13, we downscaled the disc radius of g106 by a factor of and adjusted its rotational velocity at the solar radius to be km s-1. This is done to obtain a model galaxy –dubbed g106r– with dynamical and morphological features closely matching the MW at the present time, which includes the central bar and spiral arms. Other properties such as optical radius and gas-to-total-mass and B/T ratios are also in good agreement with MW observations. We note that, by construction, g106 and its scaled version share the same structural properties and, therefore, results obtained with either version of the galaxy will be in qualitative agreement. For MWc, only global MW disc properties are qualitatively reproduced, but in this case no fine-tuning is performed to the resulting galaxy output at the end of the simulation.
4.3.1 Evidence for an exponential law
One of the ingredients of CEMs for the MW is the parametrization of its gas accretion history. An early attempt to derive a cosmologically-motivated infall law for MW-like haloes to test CEMs was performed by Colavitti et al. (2008). These authors used dark matter-only simulations to infer gas accretion from halo assembly history and concluded that the derived infall law was consistent to that of the ‘two-infall’ model of Chiappini et al. (1997, 2001).
In this work, we use our MW candidates as a proxy for gas evolution in the Galaxy, thus considering both its cosmological and hydrodynamical nature. We compute accretion rates in units of solar masses per year by multiplying gas fluxes by their corresponding surface areas. At late times, the vertical component accounts for most of the material coming from outside the disc, whereas radial fluxes mostly measures inward/outward flows within it. Therefore, the evolution of vertical accretion mainly quantifies the amount of material being incorporated into the system at any given time.
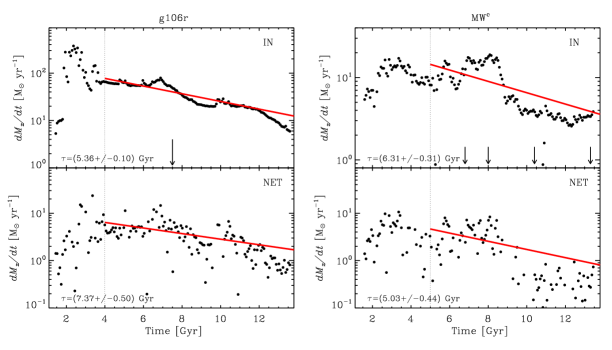
Fig. 9 shows the vertical infall (top panels) and net (bottom panels) gas accretion rates vs. cosmic time for our two MW galaxy candidates. At early times, accretion rates start to increase reaching its maximum after a few gigayears and then decline towards net values within the range M⊙ yr-1 at the present day. We note that current rates measured at the virial radius of simulated galaxies with M⊙ (assuming spherical symmetry) are of the order of M⊙ yr-1 (e.g., Joung et al., 2012; Nuza et al., 2014). If we assume that star-forming material accretes on to the disc at the typical rates found, the latter suggest that the efficiency of gas that is able to cool down and/or travel into the innermost regions of the Galaxy is . The top and bottom panels of Fig. 9 show very active accretion at early times leading to a more gentle decline afterwards. During this smoother accretion period stellar discs have the chance to steadily grow without suffering significant perturbations, conversely to what happens in the early-infall episodes. In the following, we define as the transition time between these two regimes; roughly corresponding to the time where the crossing of dynamically-significant systems across the virial radius of the galaxies have ceased (see e.g., Fig. 6 of Scannapieco et al. 2015).
As mentioned in the previous section, an exponential function alone is not able to describe the complexity of the whole gas accretion history of the galaxies. However, it can be safely taken as an average during certain periods of time (see solid lines). This is specially evident after Gyr for g106r. For MWc, a similar behaviour is observed, although the more active merger history of this galaxy makes the evolution more complicated. An example of this is given by the two close ‘intermediate’ mergers occurring at Gyr, which have a sensible effect in the accretion curve (see blue arrows). In this galaxy, accretion rates start to systematically decline at somewhat longer times, i.e. after Gyr.
The exponential fits shown in Fig. 9 indicate that the late-time accretion in our MW candidates takes places in timescales of Gyr which, according to the fiducial disc’s scale height adopted, correspond to ‘thin-disc’ structures in our simulations. The latter can be considered ‘thin’ in the sense that they are formed by young, rotationally-supported stellar populations, in contrast to simulated bulges (Scannapieco et al., 2011; Martig et al., 2012). These timescales must be addressed in the context of CEMs In these models, thin disc formation timescales are usually within a range of Gyr, with associated accretion rate values of M⊙ yr-1 at the present day (Chiappini, 2009; Kubryk et al., 2015). These values are entirely consistent with our late-time accretion results.
4.3.2 Inside-out disc formation
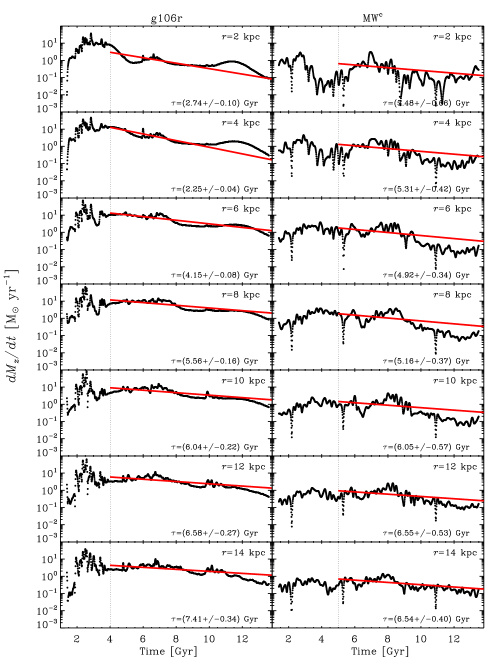
As shown in previous sections, when integrating over the whole galaxy evolution, star-forming material is preferentially accreted in the central regions, eventually producing radially-growing discs. This ‘inside-out’ formation of the Galaxy is modelled in some CEMs under simplifying assumptions; generally adopting a radially-increasing accretion timescale for the thin disc (see e.g. Romano et al., 2000; Chiappini et al., 1997, 2001; Chiappini, 2009). In this way, it is possible to form stellar populations in the external regions of the disc later than in the inner parts. To study this further, we split the accretion rate evolution of our MW galaxy candidates in radial bins of width kpc both for the vertical infall and net accretion components. Then, exponential fits are performed to compute the timescale as a function of radius. This procedure is illustrated in Fig. 10 for the vertical infall. All fits are done only for the late-time declining part of the accretion evolution as discussed in previous section. As expected, the resulting timescales bracket the disc-averaged ones shown in the top panels of Fig. 9.
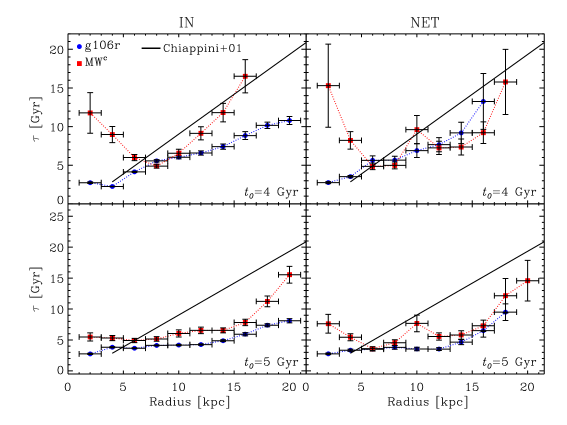
In Fig. 11 we present one of the main results of our paper. This figure shows the decay timescale of the disc component of our MW candidates in the infall (left-hand panels) and net (right-hand panels) accretion components for different radial bins. Results using a minimum cosmic time of Gyr (top panels) and Gyr (bottom panels) are presented. For completeness, we computed all decay timescales using either Gyr (g106r) or Gyr (MWc), irrespectively of the galaxy being analysed (see Table 2). This can be taken to gauge the impact of on the derived timescales. The linear approximation for the variation of in the thin-disc postulated by Chiappini et al. (2001) in their CEM is also shown111111This approximation is valid for galactocentric distances of kpc. Note, however, that new constraints towards the inner Galaxy regions are now becoming available (Chiappini et al. 2018).. Overall, we obtain similar trends between infall and net cases for the two galaxies under study. For Gyr, g106r exhibits an increase with radius as expected for an inside-out formation scenario of the disc, although less pronounced than assumed in the CEM of Chiappini et al. (2001). Interestingly, MWc shows a downturn in the central regions, albeit inverting the trend at larger radii. This is somewhat expected since at Gyr gas accretion in MWc has not reached its maximum, thus flattening the evolution and increasing the corresponding timescales. If, instead, Gyr is used, we get similar trends than obtained for g106r in the vertical infall and net cases. Similarly, when Gyr is adopted for g106r, original trends are also affected as the resulting timescales are more sensitive to fluctuations in the evolution of gas accretion. When compared to the linear approximation of Chiappini et al. (2001), results for the decay timescales of MWc towards larger galactocentric radii display less pronounced slopes. Interestingly, some of these correlations show a curved shape that is reminiscent of the one obtained in the analytical galaxy models of Mollá et al. (2016) (see their Fig. 2).
From these plots, we can conclude that, during the more gentle, late-time decay phase of gas accretion, galaxy discs in our MW galaxy candidates are built in qualitative agreement with assumptions of CEMs of the Galaxy. However, this type of assembly strongly depends on the particular evolution history of the systems. A very active merger and/or gas accretion history can, in fact, significantly affect these trends. This is the case of M31c, where the growing stellar disc has been almost completely destroyed as a result of a late-time merger (Scannapieco et al., 2015). On the other hand, despite showing a quiet late-time evolution, the roughly constant accretion rate of g37 after Gyr, produces a similar result; even in the presence of an already existing stellar disc. More details concerning these two galaxies are given in Appendix B.
5 Summary and Discussion
We made an extensive analysis of gas fluxes on to the rotationally-supported stellar component of four different simulated galaxies focusing on two MW candidates, dubbed MWc and g106r. The former is the MW galaxy candidate of Nuza et al. (2014), whereas the latter is a rescaled version of the g106 galaxy of Martig et al. (2012) following MCM13 and MCM14. The simulations are consistent with a CDM universe, use two different codes and setups and have been extensively tested to study the properties of galaxies similar to the MW. The different numerical techniques, SN feedback implementations and resolutions allow us to assess the robustness of the results.
The motivation for our work was to understand whether the assumptions of CEMs for gas infall patterns fueling SF in galaxy discs are consistent with the results of cosmological simulations that naturally include mass accretion, satellite interactions and mergers in an expanding universe. Nevertheless, these are not the only factors determining the SFR of a galaxy, as feedback effects are able to drive galactic winds and fountains affecting different regions of the disc in a unique way, both in terms of radius and height of the disc. Using the simulations, we obtained some general trends that are consistent with our current understanding of the MW evolution from CEMs, albeit not free from the complexities inherent to the physics of galaxy formation. However, despite of the different setups and numerical techniques adopted, similar conclusions are obtained from our set of simulated galaxies.
Our main results are discussed below:
-
•
All our galaxies show an early, high and rapidly decaying accretion phase –specially at the smallest radii– and a weaker, more gentle evolution at late times. We found that the latter is specially important for the formation of a rotationally-supported galaxy stellar disc as demonstrated by our simulations. Our analysis shows that gas accretion is a complex process, greatly influenced by details in the formation history of galaxies, which ultimately determine their fate and morphological type. Environmental effects could also play a role (see e.g. Creasey et al. 2015); although a larger sample of galaxies would be needed to properly quantify its importance in MW-like systems.
-
•
When time-integrating disc gas fluxes in the vertical and radial directions, we found that infalling mass per unit area exponentially decays with radius as already shown by Peek et al. (2008). However, actual profiles often show irregularities difficult to reproduce by a simple function, specially for net infall patterns. In three of our four galaxies, net vertical infall profiles beyond the optical radius decrease significantly suggesting that SF may be less efficient at those radii. Conversely, radial profiles tend to flatten, indicating that most of the material being accreted at large distances is mainly located within the plane of the rotating gaseous discs.
-
•
The fact that a net inward flux is present in our simulations indicates that a fraction of the available gas is able to migrate between different radial bins. According to MCM14 its fraction amounts to about . This effect is more important for the smallest disc radii, reaching its maximum at early times, and may have significant consequences for CEMs neglecting radial flows at these times and locations. At intermediate radial distances (including the solar neighborhood), we found small –but nonzero– net inward flows that might also have an impact on galaxy metallicity gradients if not properly accounted for (Spitoni & Matteucci, 2011). Moreover, during merger events, our simulations show that net radial flows are boosted by a significant amount, possibly affecting metallicity patterns at intermediate distances due to some degree of radial mixing. However, the analysis of chemical abundances, and their associated temporal and spatial trends, is out of the scope of this paper and further work is needed to conclude on these issues.
-
•
We found that a single exponential law cannot reproduce the complexities of gas accretion history, although it can provide a reasonable approximation to the mean during certain periods. This is specially evident at late-times in our MW galaxy candidates, where infall patterns decline with cosmic time. More importantly, postulating a dependence on gas accretion with radius, such that the innermost galaxy regions present higher accretion rates compared to the outskirts, appears to be a plausible assumption. In particular, we found that accretion timescales in simulated disc-like structures belonging to our MW candidates follow a similar trend than postulated in CEMs (see e.g., Romano et al. 2000; Chiappini et al. 2001; Chiappini 2009; Mollá et al. 2016); although numerically not entirely consistent. This behaviour goes in line with the so-called inside-out formation of the thin-disc in the Galaxy. We stress, however, that this scenario may not be valid for all galaxies as their specific merger and gas accretion histories could have a strong impact on these trends, as it is shown in the case of M31c and g37 simulated galaxies (see Appendix B).
On-going and future surveys will provide an enourmous amount of information leading to a detailed description of properties in our Galaxy. This will allow us to better trace its formation history, improve both chemical evolution and galaxy formation models, and help us to better identify their joint strengths and weaknesses.
Acknowledgments
We thank the anonymous referee for valuable comments that helped to improve this paper. SEN and CS are members of the Carrera del Investigador Científico of CONICET. SEN, CC and IM acknowledge support by the Deutsche Forschungsgemeinschaft under the grants NU 332/2-1, CH 1188/2-1 and MI 2009/1-1, respectively. CS acknowledges support from the Leibniz Gemeinschaft through grant SAW-2012-AIP-5 129. CC also acknowledges support from the ChETEC COST Action (CA16117), funded by COST (European Cooperation in Science and Technology). TCJ acknowledges support by Fundação CAPES and DAAD-CNPq-Brazil through a fellowship within the program “Science without Borders”.
References
- Anders et al. (2014) Anders F., et al., 2014, A&A, 564, A115
- Anders et al. (2017a) Anders F., et al., 2017a, A&A, 597, A30
- Anders et al. (2017b) Anders F., et al., 2017b, A&A, 600, A70
- Aumer et al. (2014) Aumer M., White S. D. M., Naab T., 2014, MNRAS, 441, 3679
- Baglin et al. (2006) Baglin A., Michel E., Auvergne M., COROT Team 2006, in Proceedings of SOHO 18/GONG 2006/HELAS I, Beyond the spherical Sun. p. 34
- Binney et al. (2009) Binney J., Nipoti C., Fraternali F., 2009, MNRAS, 397, 1804
- Birnboim & Dekel (2003) Birnboim Y., Dekel A., 2003, MNRAS, 345, 349
- Bland-Hawthorn et al. (2017) Bland-Hawthorn J., Maloney P. R., Stephens A., Zovaro A., Popping A., 2017, ApJ, 849, 51
- Boeche et al. (2013) Boeche C., et al., 2013, A&A, 559, A59
- Boeche et al. (2014) Boeche C., et al., 2014, A&A, 568, A71
- Boissier & Prantzos (1999) Boissier S., Prantzos N., 1999, MNRAS, 307, 857
- Brook et al. (2012) Brook C. B., et al., 2012, MNRAS, 426, 690
- Ceverino et al. (2015) Ceverino D., Sanchez-Almeida J., Muñoz-Tuñon C., Dekel A., Elmegreen B. G., Elmegreen D. M., Primack J., 2015, preprint, (arXiv:1509.02051)
- Chen (2012) Chen L., 2012, in Nuclei in the Cosmos (NIC XII). p. 110
- Chiappini (2009) Chiappini C., 2009, in Andersen J., Nordströara m B., Bland-Hawthorn J., eds, IAU Symposium Vol. 254, IAU Symposium. pp 191–196, doi:10.1017/S1743921308027580
- Chiappini et al. (1997) Chiappini C., Matteucci F., Gratton R., 1997, ApJ, 477, 765
- Chiappini et al. (2001) Chiappini C., Matteucci F., Romano D., 2001, ApJ, 554, 1044
- Chiappini et al. (2018) Chiappini C., Minchev I., Starkenburg E., Valentini M., eds, 2018, Rediscovering our Galaxy IAU Symposium Vol. 334, doi:10.1017/S1743921318000789.
- Colavitti et al. (2008) Colavitti E., Matteucci F., Murante G., 2008, A&A, 483, 401
- Courty et al. (2010) Courty S., Gibson B. K., Teyssier R., 2010, in Debattista V. P., Popescu C. C., eds, American Institute of Physics Conference Series Vol. 1240, American Institute of Physics Conference Series. pp 131–134 (arXiv:1002.2383), doi:10.1063/1.3458467
- Creasey et al. (2015) Creasey P., Scannapieco C., Nuza S. E., Yepes G., Gottlöber S., Steinmetz M., 2015, ApJ, 800, L4
- Dubois et al. (2013) Dubois Y., Gavazzi R., Peirani S., Silk J., 2013, MNRAS, 433, 3297
- Fenner & Gibson (2003) Fenner Y., Gibson B. K., 2003, Publ. Astron. Soc. Australia, 20, 189
- Fraternali & Tomassetti (2012) Fraternali F., Tomassetti M., 2012, MNRAS, 426, 2166
- Genel et al. (2014) Genel S., et al., 2014, MNRAS, 445, 175
- Gentile et al. (2013) Gentile G., et al., 2013, A&A, 554, A125
- Grand et al. (2017) Grand R. J. J., et al., 2017, MNRAS, 467, 179
- Guedes et al. (2011) Guedes J., Callegari S., Madau P., Mayer L., 2011, ApJ, 742, 76
- Hayden et al. (2014) Hayden M. R., et al., 2014, AJ, 147, 116
- Hopkins et al. (2014) Hopkins P. F., Kereš D., Oñorbe J., Faucher-Giguère C.-A., Quataert E., Murray N., Bullock J. S., 2014, MNRAS, 445, 581
- Hou & Prantzos (2001) Hou J. L., Prantzos N., 2001, Nuclear Physics A, 688, 411
- Hou et al. (2002) Hou J.-L., Chang R.-X., Chen L., 2002, Chinese J. Astron. Astrophys., 2, 17
- Joung et al. (2012) Joung M. R., Putman M. E., Bryan G. L., Fernández X., Peek J. E. G., 2012, ApJ, 759, 137
- Kubryk et al. (2015) Kubryk M., Prantzos N., Athanassoula E., 2015, A&A, 580, A126
- Larson (1976) Larson R. B., 1976, MNRAS, 176, 31
- Lehner & Howk (2011) Lehner N., Howk J. C., 2011, Science, 334, 955
- Mackereth et al. (2018) Mackereth J. T., Crain R. A., Schiavon R. P., Schaye J., Theuns T., Schaller M., 2018, preprint, (arXiv:1801.03593)
- Marinacci et al. (2014) Marinacci F., Pakmor R., Springel V., 2014, MNRAS, 437, 1750
- Martig et al. (2009) Martig M., Bournaud F., Teyssier R., Dekel A., 2009, ApJ, 707, 250
- Martig et al. (2012) Martig M., Bournaud F., Croton D. J., Dekel A., Teyssier R., 2012, ApJ, 756, 26
- Martig et al. (2014) Martig M., Minchev I., Flynn C., 2014, MNRAS, 442, 2474
- Matteucci (2012) Matteucci F., 2012, Chemical Evolution of Galaxies, doi:10.1007/978-3-642-22491-1.
- Matteucci & Francois (1989) Matteucci F., Francois P., 1989, MNRAS, 239, 885
- Miller & Bregman (2015) Miller M. J., Bregman J. N., 2015, ApJ, 800, 14
- Minchev (2015) Minchev I., 2015, in Chemical and dynamical evolution of the Milky Way and Local Group. p. 14
- Minchev et al. (2013) Minchev I., Chiappini C., Martig M., 2013, A&A, 558, A9
- Minchev et al. (2014) Minchev I., Chiappini C., Martig M., 2014, A&A, 572, A92
- Minchev et al. (2016) Minchev I., Chiappini C., Martig M., 2016, Astronomische Nachrichten, 337, 944
- Mollá et al. (2016) Mollá M., Díaz Á. I., Gibson B. K., Cavichia O., López-Sánchez Á.-R., 2016, MNRAS, 462, 1329
- Moster et al. (2010) Moster B. P., Somerville R. S., Maulbetsch C., van den Bosch F. C., Macciò A. V., Naab T., Oser L., 2010, ApJ, 710, 903
- Naab et al. (2014) Naab T., et al., 2014, MNRAS, 444, 3357
- Nelson et al. (2015) Nelson D., Genel S., Vogelsberger M., Springel V., Sijacki D., Torrey P., Hernquist L., 2015, MNRAS, 448, 59
- Nelson et al. (2016) Nelson D., Genel S., Pillepich A., Vogelsberger M., Springel V., Hernquist L., 2016, MNRAS, 460, 2881
- Nipoti (2010) Nipoti C., 2010, MNRAS, 406, 247
- Nuza et al. (2014) Nuza S. E., Parisi F., Scannapieco C., Richter P., Gottlöber S., Steinmetz M., 2014, MNRAS, 441, 2593
- Nuza et al. (2018) Nuza S. E., Chiappini C., Scannapieco C., Minchev I., Martig M., Junqueira T. C., 2018, in Chiappini C., Minchev I., Starkenburg E., Valentini M., eds, IAU Symposium Vol. 334, Rediscovering Our Galaxy. pp 219–222 (arXiv:1805.01588), doi:10.1017/S1743921317008870
- Pagel (2009) Pagel B. E. J., 2009, Nucleosynthesis and Chemical Evolution of Galaxies
- Peek et al. (2008) Peek J. E. G., Putman M. E., Sommer-Larsen J., 2008, ApJ, 674, 227
- Portinari & Chiosi (1999) Portinari L., Chiosi C., 1999, A&A, 350, 827
- Prantzos & Aubert (1995) Prantzos N., Aubert O., 1995, A&A, 302, 69
- Putman et al. (2012) Putman M. E., Peek J. E. G., Joung M. R., 2012, ARA&A, 50, 491
- Richter (2012) Richter P., 2012, ApJ, 750, 165
- Richter et al. (2017) Richter P., et al., 2017, A&A, 607, A48
- Rocha-Pinto et al. (2000) Rocha-Pinto H. J., Scalo J., Maciel W. J., Flynn C., 2000, A&A, 358, 869
- Romano et al. (2000) Romano D., Matteucci F., Salucci P., Chiappini C., 2000, ApJ, 539, 235
- Sancisi et al. (2008) Sancisi R., Fraternali F., Oosterloo T., van der Hulst T., 2008, A&ARv, 15, 189
- Scannapieco et al. (2008) Scannapieco C., Tissera P. B., White S. D. M., Springel V., 2008, MNRAS, 389, 1137
- Scannapieco et al. (2011) Scannapieco C., White S. D. M., Springel V., Tissera P. B., 2011, MNRAS, 417, 154
- Scannapieco et al. (2012) Scannapieco C., et al., 2012, MNRAS, 423, 1726
- Scannapieco et al. (2015) Scannapieco C., Creasey P., Nuza S. E., Yepes G., Gottlöber S., Steinmetz M., 2015, A&A, 577, A3
- Singh et al. (2018) Singh P., Majumdar S., Nath B. B., Silk J., 2018, MNRAS, 478, 2909
- Sommer-Larsen et al. (2003) Sommer-Larsen J., Götz M., Portinari L., 2003, ApJ, 596, 47
- Spitoni & Matteucci (2011) Spitoni E., Matteucci F., 2011, A&A, 531, A72
- Springel (2005) Springel V., 2005, MNRAS, 364, 1105
- Springel et al. (2008) Springel V., et al., 2008, MNRAS, 391, 1685
- Stasińska et al. (2012) Stasińska G., et al., eds, 2012, Oxygen in the Universe EAS Publications Series Vol. 54
- Stinson et al. (2013) Stinson G. S., Brook C., Macciò A. V., Wadsley J., Quinn T. R., Couchman H. M. P., 2013, MNRAS, 428, 129
- Teyssier (2002) Teyssier R., 2002, A&A, 385, 337
- Thilker et al. (2004) Thilker D. A., Braun R., Walterbos R. A. M., Corbelli E., Lockman F. J., Murphy E., Maddalena R., 2004, ApJ, 601, L39
- Tumlinson et al. (2013) Tumlinson J., et al., 2013, ApJ, 777, 59
- Walter et al. (2008) Walter F., Brinks E., de Blok W. J. G., Bigiel F., Kennicutt Jr. R. C., Thornley M. D., Leroy A., 2008, AJ, 136, 2563
- Wetzel et al. (2016) Wetzel A. R., Hopkins P. F., Kim J.-h., Faucher-Giguère C.-A., Kereš D., Quataert E., 2016, ApJ, 827, L23
- Yepes et al. (2014) Yepes G., Gottlöber S., Hoffman Y., 2014, New Astron. Rev., 58, 1
Appendix A Dependence of gas infall with height above the disc
To further investigate the dependence of infall rates with distance over the disc plane, we repeated our analysis for kpc, each value representing a total cylinder’s height of kpc, respectively.
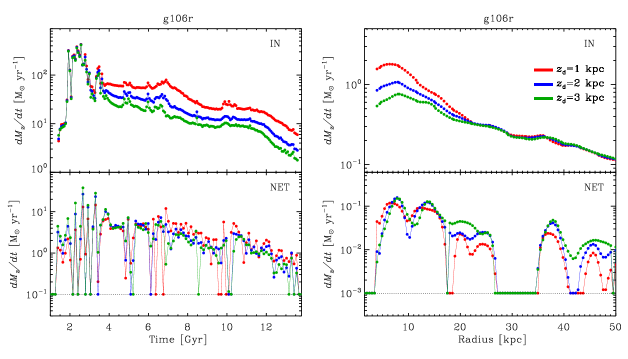
Fig. 12 shows accretion rates as a function of time and radius in the vertical infall and net cases for our two MW candidates. Whilst at early times less variation of the vertical infall for different heights can be seen, it becomes more significant after a few gigayears, i.e. (left-hand panels). For g106r, the lowest accretion values correspond to the highest ’s. This occurs as a result of the poor treatment of the hot gas phase in this kind of simulations, which prevents the formation of a hot gaseous halo around the galaxy (see Section 2.1). Therefore, most of the accreted material is low entropy gas directly feeding the disc from filamentary-like structures. The lower the height above the disc, the higher the fraction of colder (and clumpier) material. Conversely, this trend is inverted in the case of MWc. In this galaxy, the hot gaseous halo is responsible for a significant fraction of the total accretion, typically increasing with distance from the inner galaxy regions (see e.g., Fig. 14 of Nuza et al. 2014).
Right-hand panels show results obtained after integrating gas fluxes during the entire galaxy lifetimes. For g106r, the vertical infall beyond the optical radius does not depend on height as most of the material preferentially falls on to the central regions at higher rates. This is not the case of MWc, which accretes material up to distances close to the virial radius owing to the presence of the hot gaseous halo. Interestingly, for both galaxies, net vertical accretion splits into different curves with the lowest accretion values corresponding to the lowest ’s. This simply reflects the fact that the intensity of galactic outflows always decreases as one moves away from the disc plane, i.e. at higher elevations the net amount of accreted material is larger; irrespectively of the nature of the dominant accretion modes in each galaxy.
In summary, although time and radial dependencies on accretion rates show some differences for different cylinder’s heights, they can be easily interpreted and the resulting global trends are similar. We thus conclude that the particular choice of kpc adopted in this paper does not affect our main conclusions. However, caution must be taken when comparing with observations as absolute accretion values do vary with elevation above the disc midplane.
Appendix B Accretion timescales vs. disc radius in the general case
As mentioned in Section 4.3.2, according to our simulations, the usual correlation between accretion timescale and radius invoked within the inside-out disc formation scenario is not straightforward. To illustrate this, in Fig. 13 we show the analogue of Fig. 10 for the case of the M31c and g37 simulated galaxies. All fits are performed after the more rapid accretion period at early times, which roughly corresponds to Gyr for these two galaxies. As seen in the plots, exponential fits in the plane show a transition from positive slopes to flatter ones as a function of disc radius. This means that, although globally rates mildly decline or stay roughly constant with time, they actually increase exponentially during the late-time phase for the innermost radial bins. This is in sharp contrast to the behaviour observed in our MW candidates. For a galaxy like M31c, which is undergoing an active merging phase that completely disrupts the existing stellar disc at late-times, this is expected. However, despite of having a very quiet merger history, g37 displays a similar behaviour; even in the presence of a stellar disc. This is mainly due to the formation of a strong bar at late-times as it can be seen, for instance, in the upper-right panel of Fig. 5 for kpc. Moreover, at Gyr, material is also accreted at significant rates for the largest radii (see upper-left panel of Fig. 4). As a result, these features significantly affect the way these specific discs form and evolve.
| infall | net infall | ||||||||
| MWc | g106r | MWc | g106r | ||||||
| [kpc] | [Gyr] | [Gyr] | [Gyr] | [Gyr] | |||||
| Gyr | 2 | 11.77 | 2.62 | 2.74 | 0.10 | 15.29 | 5.37 | 2.76 | 0.13 |
| 4 | 8.97 | 1.04 | 2.25 | 0.04 | 8.21 | 1.13 | 3.53 | 0.15 | |
| 6 | 6.00 | 0.39 | 4.15 | 0.08 | 4.85 | 0.42 | 6.64 | 0.58 | |
| 8 | 4.88 | 0.25 | 5.56 | 0.16 | 4.98 | 0.45 | 5.66 | 0.50 | |
| 10 | 6.56 | 0.51 | 6.04 | 0.22 | 9.60 | 1.83 | 6.90 | 0.89 | |
| 12 | 9.13 | 0.85 | 6.58 | 0.27 | 7.24 | 0.85 | 7.66 | 0.92 | |
| 14 | 11.81 | 1.20 | 7.41 | 0.34 | 7.35 | 1.03 | 9.18 | 1.38 | |
| 16 | 16.51 | 2.15 | 8.84 | 0.51 | 9.21 | 1.40 | 13.25 | 3.61 | |
| 18 | – | – | 10.16 | 0.42 | 15.77 | 4.21 | – | – | |
| 20 | – | – | 10.78 | 0.52 | – | – | – | – | |
| Gyr | 2 | 5.48 | 0.66 | 2.74 | 0.10 | 7.62 | 1.52 | 2.76 | 0.13 |
| 4 | 5.31 | 0.42 | 3.82 | 0.10 | 5.44 | 0.57 | 3.34 | 0.18 | |
| 6 | 4.92 | 0.34 | 3.66 | 0.08 | 3.60 | 0.30 | 3.49 | 0.29 | |
| 8 | 5.16 | 0.37 | 4.11 | 0.10 | 4.56 | 0.47 | 3.80 | 0.30 | |
| 10 | 6.05 | 0.57 | 4.17 | 0.12 | 7.67 | 1.34 | 3.54 | 0.29 | |
| 12 | 6.55 | 0.53 | 4.25 | 0.12 | 5.56 | 0.59 | 3.53 | 0.22 | |
| 14 | 6.54 | 0.40 | 4.87 | 0.16 | 5.81 | 0.69 | 4.64 | 0.41 | |
| 16 | 7.83 | 0.52 | 5.93 | 0.26 | 7.29 | 0.91 | 6.50 | 1.04 | |
| 18 | 11.23 | 0.87 | 7.38 | 0.24 | 12.15 | 2.79 | 9.49 | 1.34 | |
| 20 | 15.54 | 1.35 | 8.10 | 0.34 | 14.57 | 3.29 | – | – | |