Agent Based Rumor Spreading in a scale-free network
Abstract
In the last years, the study of rumor spreading on social networks produced a lot of interest among the scientific community, expecially due to the role of social networks in the last political events. The goal of this work is to reproduce real-like diffusions of information and misinformation in a scale-free network using a multi-agent-based model. The data concerning the virtual spreading are easily obtainable, in particular the diffusion of information during the announcement for the discovery of the Higgs Boson on TwitterTM was recorded and investigated in detail. We made some assumptions on the micro behavior of our agents and registered the effects in a statistical analysis replying the real data diffusion. Then, we studied an hypotetical response to a misinformation diffusion adding debunking agents and trying to model a critic response from the agents using real data from a hoax regarding the Occupy Wall Street movement. After tuning our model to reproduce these results, we measured some network properties and proved the emergence of substantially separated structures like echochambers, independently from the network size scale, i.e. with one hundred, one thousand and ten thousand agents.
Introduction
Studying information diffusion attracted the attention of the scientific community in the last decade, thanks to the birth and exponential growth of many social networks like FacebookTM, TwitterTM, InstagramTM, LinkedinTM, etc. (De Domenico et al. 2013; Lotan 2012; Lerman 2016; Gomez-Rodriguez et al. 2014; Zollo et al. 2015; Tambuscio et al. 2016; Serrano et al. 2015; Liu & Chen 2011; Zollo et al. 2017; de C Gatti et al. 2013; Huang et al. 2016; Bessi et al. 2016). The study is interesting and non trivial since it shows a complexity due to a double feedback between topology and users’ properties. Indeed it is unknown whether real social networks have been shaped to this structure because of users’ interests determining their friendships, or if the users’ interests were influenced by their personal network topologic structure, i.e. their friends. To develop our model we chose an innovative approach for the field of information diffusion on networks which is a Multi-Agent based model. Multi-Agent systems are more suitable to investigate this kind of social behavior complexity because, unlike object-oriented systems, agents are capable of performing autonomous actions based on self-interest at run-time. Agents have stronger autonomy and they are social, they can communicate with each other through protocols, be proactive and reactive. Moreover, each of them has its own perception of the environment it lives within. According to their perceptions, agents may decide to autonomously act on the environment, in order to meet their design objectives. For these rationales the agent-based approach seemed to be promising for our purpose. (Wooldridge 2009). There are lots of simulation models built to analyze the viral behavior of a diffusion as an emergent property (Serrano et al. 2015; Liu & Chen 2011; de C Gatti et al. 2013). Micro assumptions similar to ours on the agents’ behavior like threshold of skepticism, reliability of the news, influence of the neighbors, communication between agents, have been made from other recent studies (Tambuscio et al. 2016; de C Gatti et al. 2013; Huang et al. 2016), but most of them are models which are based on the epidemiologic approach, i.e. SIR models, which have been contrasted in some real data recent analysis (Lerman 2016). One main difference between these models and ours is the existence of emergent debunking behavior agents, which are agents that try to fact-check the information they find. In the SIR models these individuals are usually represented by stiflers, but once they become stiflers they stop interacting with the remaining infected nodes. On the contrary, in our model debunker agents try to make spreaders change their mind on the hoax they spread. As seen in the empirical study reproduced in (Zollo et al. 2017) the behavior of these debunker agents is observed in the polarization of the network in various echo chambers. These echo chambers are resonance bubbles where the information spread from users forms a loop in their friends network. Information in these contexts does not spread uniformely with all the neighbouring nodes of the user but stays trapped in his social circle, made of people who usually share similar contents. These bubbles may be the result of the FacebookTM news feed algorithms which decide which contents have to be shown to the users according to the people with whom they interact more (Facebook 2015) and the phenomenon known as confirmation bias.
1 The network
The environment of our agents model is a scale free graph generated with the Barabasi-Albert algorithm. Our network can be formalized as unweighted and undirected graph, where is the set of vertices we represent as users, is the set of the edges, which we represent as the friendship connections on the social network. The number of edges of each node is called his degree . A scale free graph is a graph constituted of nodes whose distribution of degrees follows a power law function of the form:
where is the probability to find a given degree node in the network, is the exponent which stands in the range (Barabási & Albert 1999). A fundamental aspect of these networks is the presence of many low-degree nodes and specifically few so-called "hubs": nodes with very high degree compared to the size of the net. These properties have been observed in real networks as social networks, the World Wide Web, the network of scientific collaborations, the network of movie actors collaborations (Barabási & Albert 1999) and many more. Social networks as the ones we study, follow the scale free distribution as the study itself mentions (De Domenico et al. 2013). TwitterTM is known to be a directed network due to asimmetric possibility to follow somebody without being followed, but the information diffusion can overpass this limit thanks to platform features like mentions, hashtags and trending topics. The Barabasi-Albert algorithm is the first algorithm that reproduces the structure of scale free networks through two main processes: growth and preferential attachment. The preferential attachment sets a probability for every new node added to the net to set links with the highest degree nodes already present in the graph. (Barabási & Albert 1999).
2 The model
To create our model we used the Gama Platform, which is free.
First of all we created a scale-free network using the Barabasi-Albert
built-in function to reproduce at best the architecture of a real
social network.
In every simulation we have a brand new network, we do not set a seed
to a root for the diffusion of the information, in order to avoid
to start everytime with the same fixed network, which could influence
the results from the initial conditions.
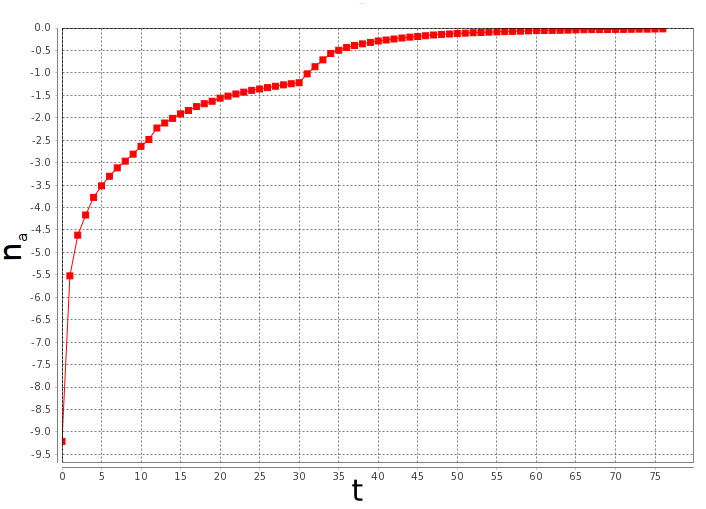
We verified that the built-in function effectively generated a scale-free
graph with ten thousand nodes and tested its properties measuring the degree distribution as shown in Fig.1.

We fitted the tail of the degree distribution of ten different graphs with nodes each, excluding the saturation
points for low degrees and we found the mean gamma exponent of our degree distribution.
The sistematic error found is the standard deviation of ten fitted independent gamma values and it results bigger
than the statistical error, obtained through the mean of gamma values error in the covariance matrix.
We used the standard deviation of the gamma values to know in what range of values
our graph generator works and what kind of graphs we can expect.
The measure of gamma is then consistent with the expected value of gamma for a scale-free
network, being and the relation , so we are sure to work always with scale free graphs (Barabási & Albert 1999).
The value measured in (De Domenico et al. 2013) is , so we work in the same topological conditions.
The node species corresponds to our social network users,
while the edge species represents the kind of interaction and relationship
between the users.
We created two species because we want our model to be flexible for further studies and implementations.
Indeed our model could be developed to a dynamic network, which means to kill edge-agents when friendships end
and to create new edge-agents when a new friendship arises.
We represented a single news as a single instance global variable between 0 and 1. The news
is accessible with a visualization probability for every agent to simulate the information
overflow in the feed. The choice to limit the study to a one-dimensional problem is given by the
necessary initial simplification of the model. Further developments will allow for multiple topics inside the news or for multiple news in a single network.
Every agent has the possibility to choose whether to
spread or not the news, depending on his personal preparation on the
topic, which is an individual private threshold randomly assigned
at the instantiation of the agents.
In our model we represented three different types of diffusion:
-
•
spontaneous spreading of the information after direct visualization: happens when news > threshold, which means that the information is reliable enough to the agent;
-
•
collective influence: when more than 30% (López-Pintado 2006) of agent’s friends are spreaders or a very influent hub agent between the friends of mine shared the information, the agent’s threshold decreases, which makes him more gullible. The diffusion induced by friends is an automatic communication we assume to happen between the agents;
-
•
communication persuasion: happens when undeployed agents are friends of spreader agents, these send them messages to inform them about the validity of the news. If the interlocutors have a similar preparation on the topic, the undeployed agent’s threshold decreases in order to raise his probability of spreading due to augmented faith in his friend;
We distinguished our nodes in the network with different colors in order to visualize the evolution of the system during the diffusion. The red ones are the undeployed nodes, i.e. non-spreaders agents, the blue ones are those who spontaneously visualized and believed the information, the green ones are those who have been influenced by their friends, and the yellow ones are those who deployed due to communication. After a fixed time every agent stops spreading and turns off independently from the others, in fact the transmissibility of information diminishes over time as information loses novelty. The probability to retweet information on TwitterTM does not depend on its absolute age, but only the time it first appeared in a user’s social feed, as a study demonstrates (Hodas 2012). Indeed this time of deactivation is taken into account since the news has been spread from the agent and in this model it is constant and fixed for every agent. In this first simulations the agents are not allowed to reactivate. Running the model with different network sizes we found similar times of persistence of the news and observed the same relaxation curves, so we can suppose the model does not depend qualitatively on the scale of the network, but only on the parameters of the simulation. To test the reproducibility of the experiments, we set a seed to the model in order to keep the dynamics similar. We verified the stability of the experiments running the simulations to twenty thousands cycles. We measured the density of activated users, i.e. spreader agents, for every class of degree present in the network, to see how the behaviour of our agents depends on their own connectivity and on the reliability of the news.
(a) (b)


In Fig.2a we observed that news reliabity is more salient for low connected nodes, i.e. agents with few neighbours, whereas high connected nodes in Fig.2b show a common behaviour which seems to be more sensitive to social influence and play a fundamental role in the spreading of the news in the network. High degree classes are taken into account in the final average only if they appear in our iterations.
3 Spreading of a true news
We simulated the diffusion of a single news with maximum
value of reliability on a ten thousand nodes network, the probability
of visualization of the news is and every agent has the possibility
to spread the news in three different ways of diffusion: spontaneous
visualization, collective influence and communication persuasion.
We plotted the density of active users versus time and compared the
results of the simulation with a SIR rumor spreading model (Zanette 2001)
(derived from the epidemiologic SIR model), which is one of the
most used models to explain social contagion.
Both models are runned over scale free networks generated through the Barabasi-Albert model.
The model has been studied analytically
through differential equations regulated by two parameters: to represent the rate
of transition to stifler (R), to represent the transition rate to spreader (S) (Barrat et al. 2008).
At each time step a randomly chosen spreader agent contacts another
element .
If is in the ignorant state, it becomes a spreader;
If, on the other hand, is a spreader or stifler, becomes a stifler;
The compartment represents the ignorant users, the spreaders, the stiflers.

The results in Fig.3 have been obtained by the average over ten different simulations
for both models, both on scale free networks. The error bars represent
the standard deviation of the number of activated agents at each time.
The SIR model we used follows the equation (2-3-4) described above.
The difference between the Multi-Agent based model and
the SIR model can be shown in the different diffusion rates in the early times of spread of the news.
The news spreading in the SIR models goes strictly viral in the first times, while in the agent based model the diffusion rate is slightly smoother.
To fit as best as possible the peak of the spreading in the MAS simulation,
we set the SIR model parameters with and .
Of course this approach is not enough to explain the real dynamics of an information
diffusion: as shown in a recent study (Lerman 2016), cognitive limits
may explain the difference between information spreading and virus
contagion due to friendship paradox (Feld 1991) in social networks
and information overflow (Gomez-Rodriguez et al. 2014).
4 Spreading of Higgs’s Boson discovery
In this phase, we simulated the spread of the announcement of the discovery of Higgs Boson and compared the results with the empirical data measured by (De Domenico et al. 2013) in the paper and with the results obtained by the analysis we made from the free database downloadable from (SnapStanford 2015).

In Fig.4 we can see the number of active users versus time who spreaded
the rumor.
In our model we used agents, as shown in Fig.5, which could communicate and share
information between themselves as already said before. The simulation starts with a small reliability information
at time and only later on the news is confirmed
officially and gains the value of maximum reliability at time .
(a) (b) (c)


A qualitative representation is given from the number of active users from one simulation in Gama in Fig.6.
(a) (b)


(a) (b)

The blue dots are the cumulative spreaders of the news, the red ones are those who spontaneously spreaded the news, the green ones are those who have been influenced from the collectiveness, the yellow ones are those who changed their mind due to communication persuasion.
We can observe some similar trends in the curve of the density of active users which represent the different moments of the diffusion in Fig.7. Of course our graph is smaller than the one used in the paper (De Domenico et al. 2013), but we can say that the activation dynamics in the graphic are the same, at least from a qualitatively perspective.
(a) (b) (c)
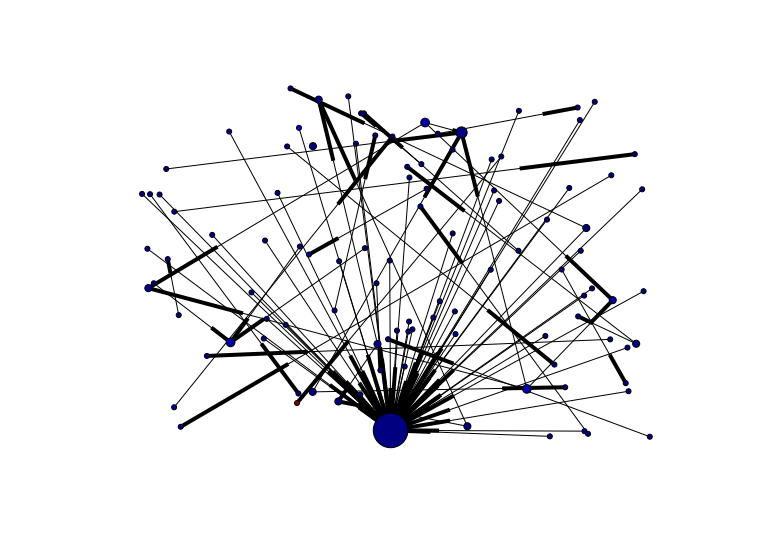


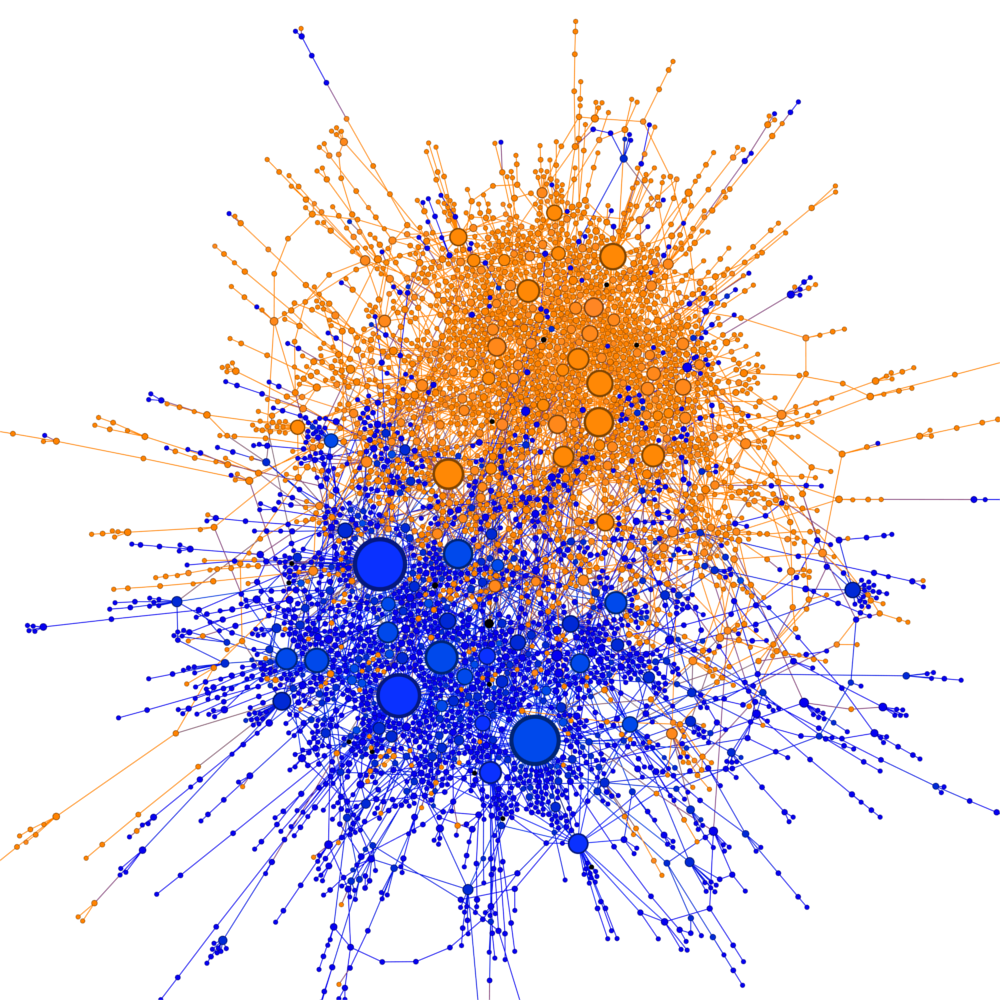
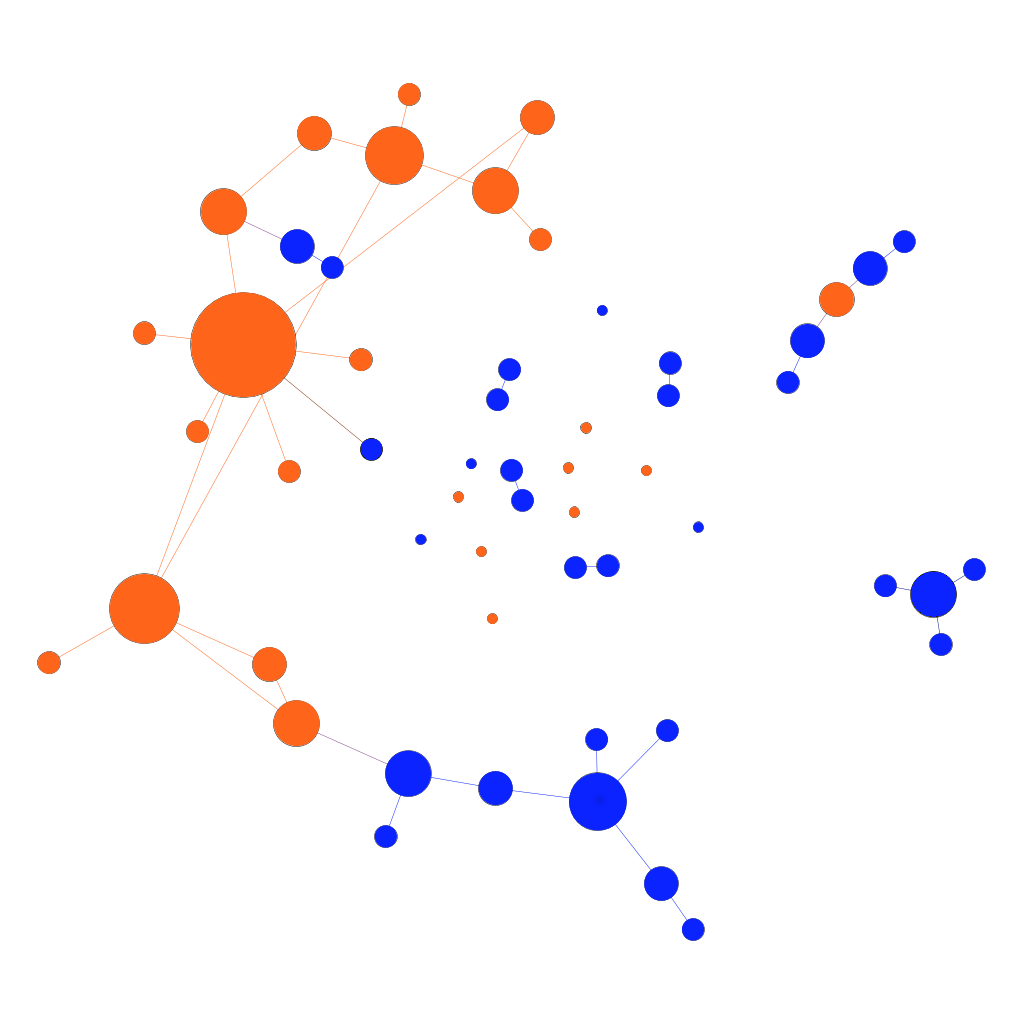
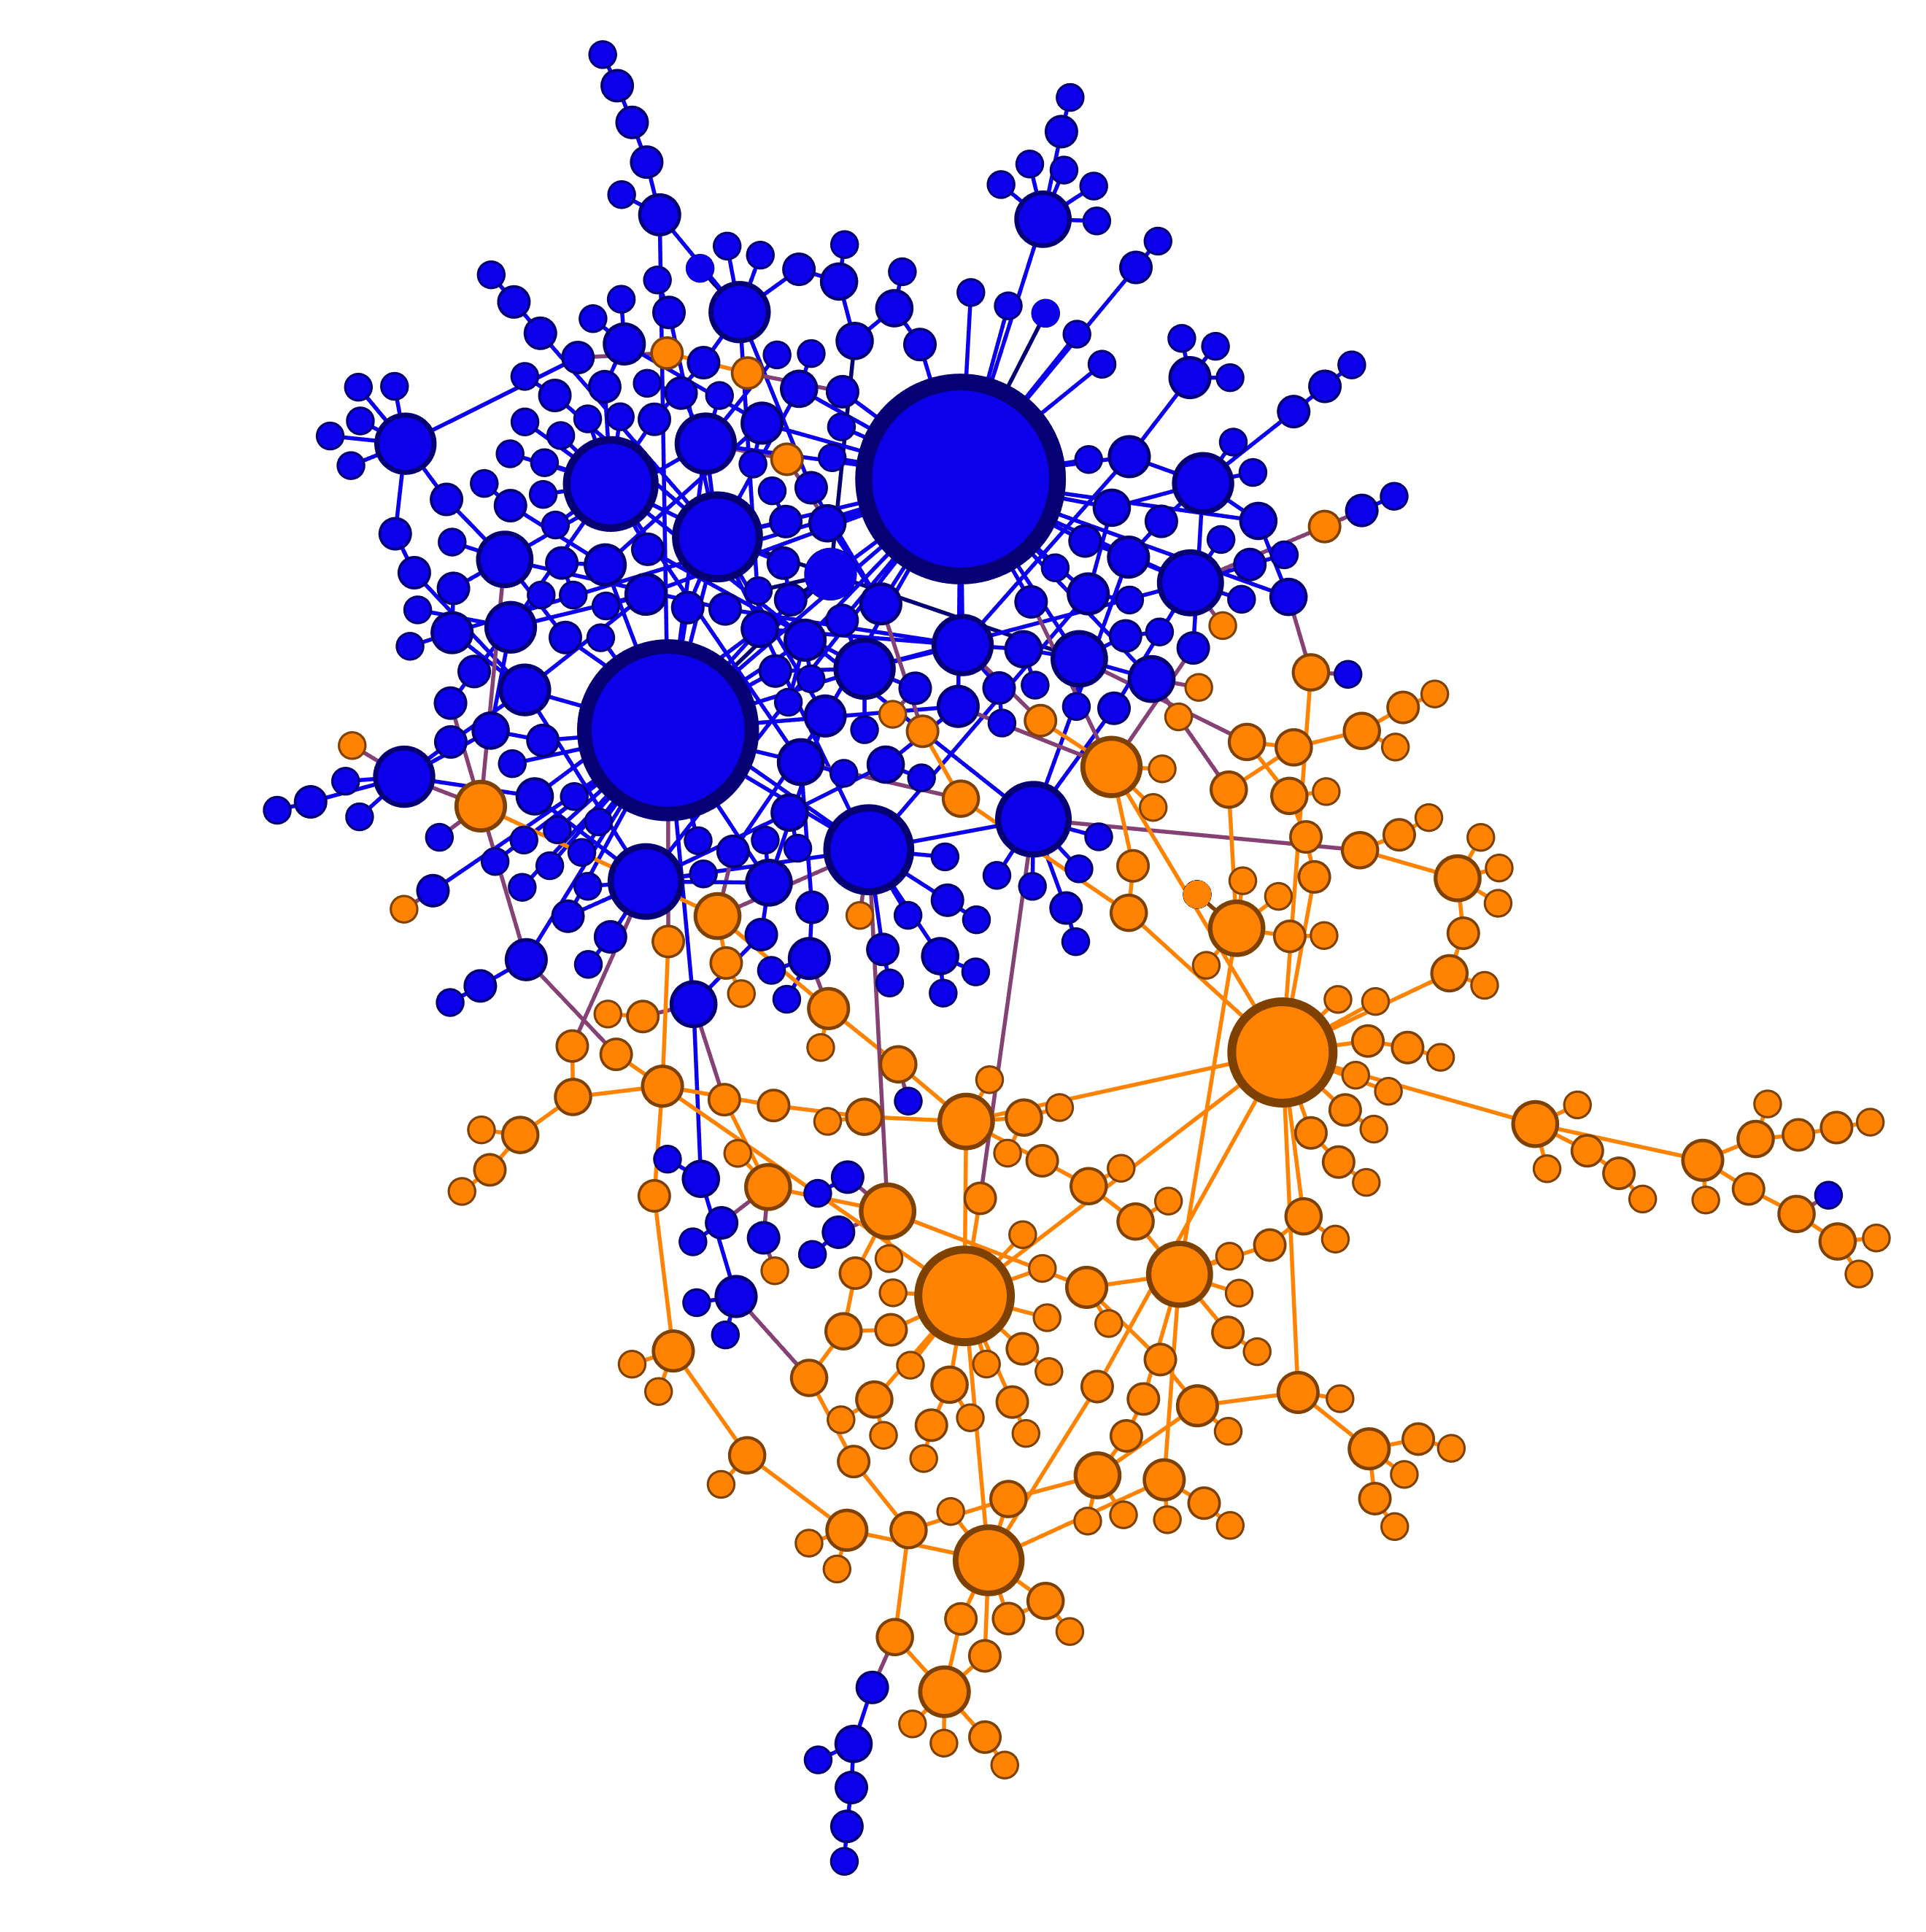
In Fig.8a we show a focus on one hub of the real diffusion network excrated from (De Domenico et al. 2013), while in Fig.8b,c two representations of our model network in two different sizes.
5 Spreading of misinformation and correction
After that, we developed a model using the same features but, this
time, we introduced a new kind of user who is able to recognize
the fakeness of the news and alert his neighbors. The oranges are those
who have a threshold-news difference big enough to allow them to contrast
the spreading of the misinformation. When an orange agent is aware
of the misinformation, he communicates back to those who tried to
convince him before. These ones can then be converted to oranges if
the communication happens between two users who both have the similar
knowledge of the topic.

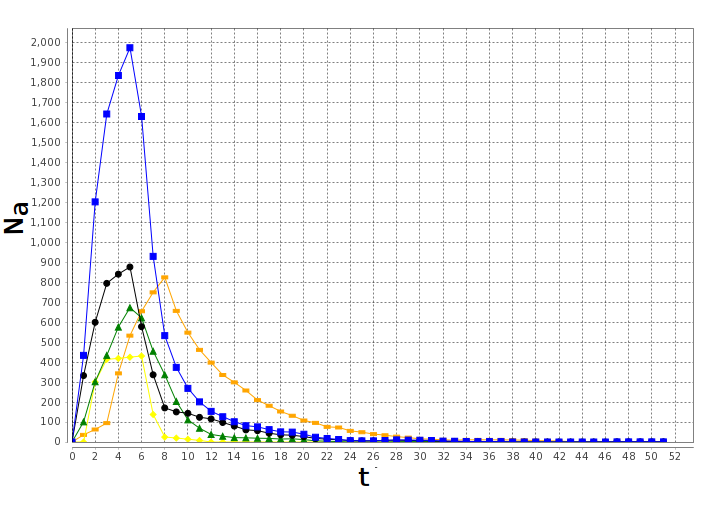
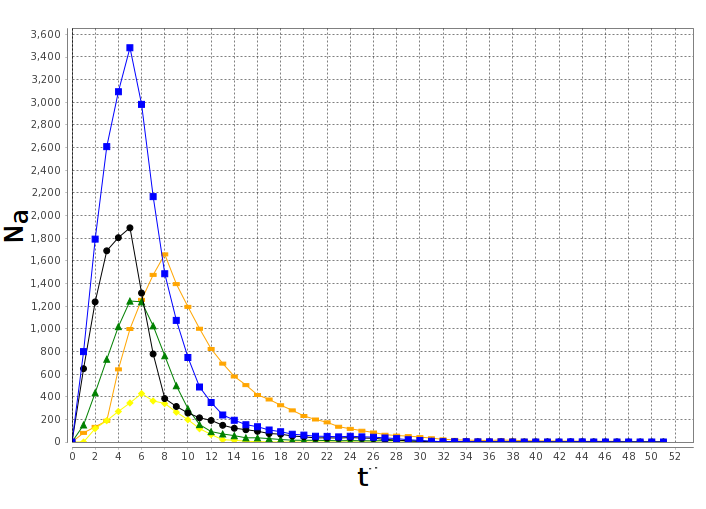
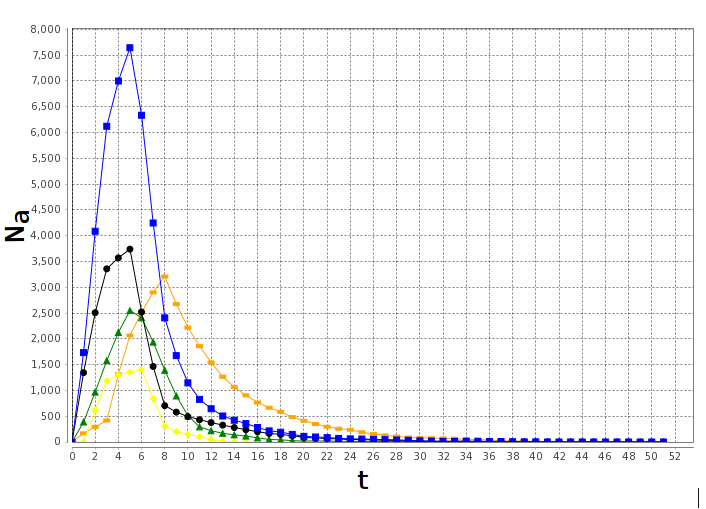
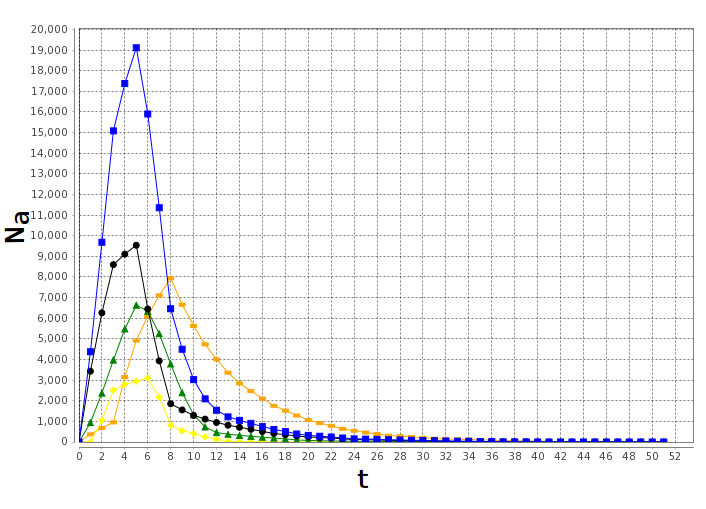
We simulated with networks of different dimensions, scale-free, as shown in Fig.10 and gave the news with a reliability of , which appeared to be the optimal value to reproduce the observed dynamics in this case. After some time the news happens to be
false and his reliability decreases to . The agents recognize
the change of the news reliability value and a critical group of users
arises. We compared this result with the study presented on (Lotan 2012)
about the news spreading on Twitter of the protests of Occupy Wall Street in Fig.9.
In this case, a false news was spread from the NBC and retweeted from
lots of users. Twenty minutes after the correction of the misinformation
appeared on Twitter, but the cascade of the correction has been registered
to be too weak to contrast the virality of the misinformation.
In our model the dynamic is represented by the number of active users versus time. We can notice the similarity in the dynamics of misinformation and correction and see that sadly the correction doesn’t take over the misinformation cascade and users keep on sharing a false news.
(a)
(b)
(c)
(d)
6 Echo chambers in the network
Following the work reported in (Zollo et al. 2017) we studied the emerging properties of the network after a spreading of a news. We analyzed the final threshold distribution of the agents and we made some statistics of it to observe if there was a polarization of the skepticism in the final population for various values of news realiability. We drew nine histograms, one for every different value of news reliability, averaged over ten iterations to visualize the agents skepticism threshold distribution properly in a range from to in Fig.11a.
(a) (b)
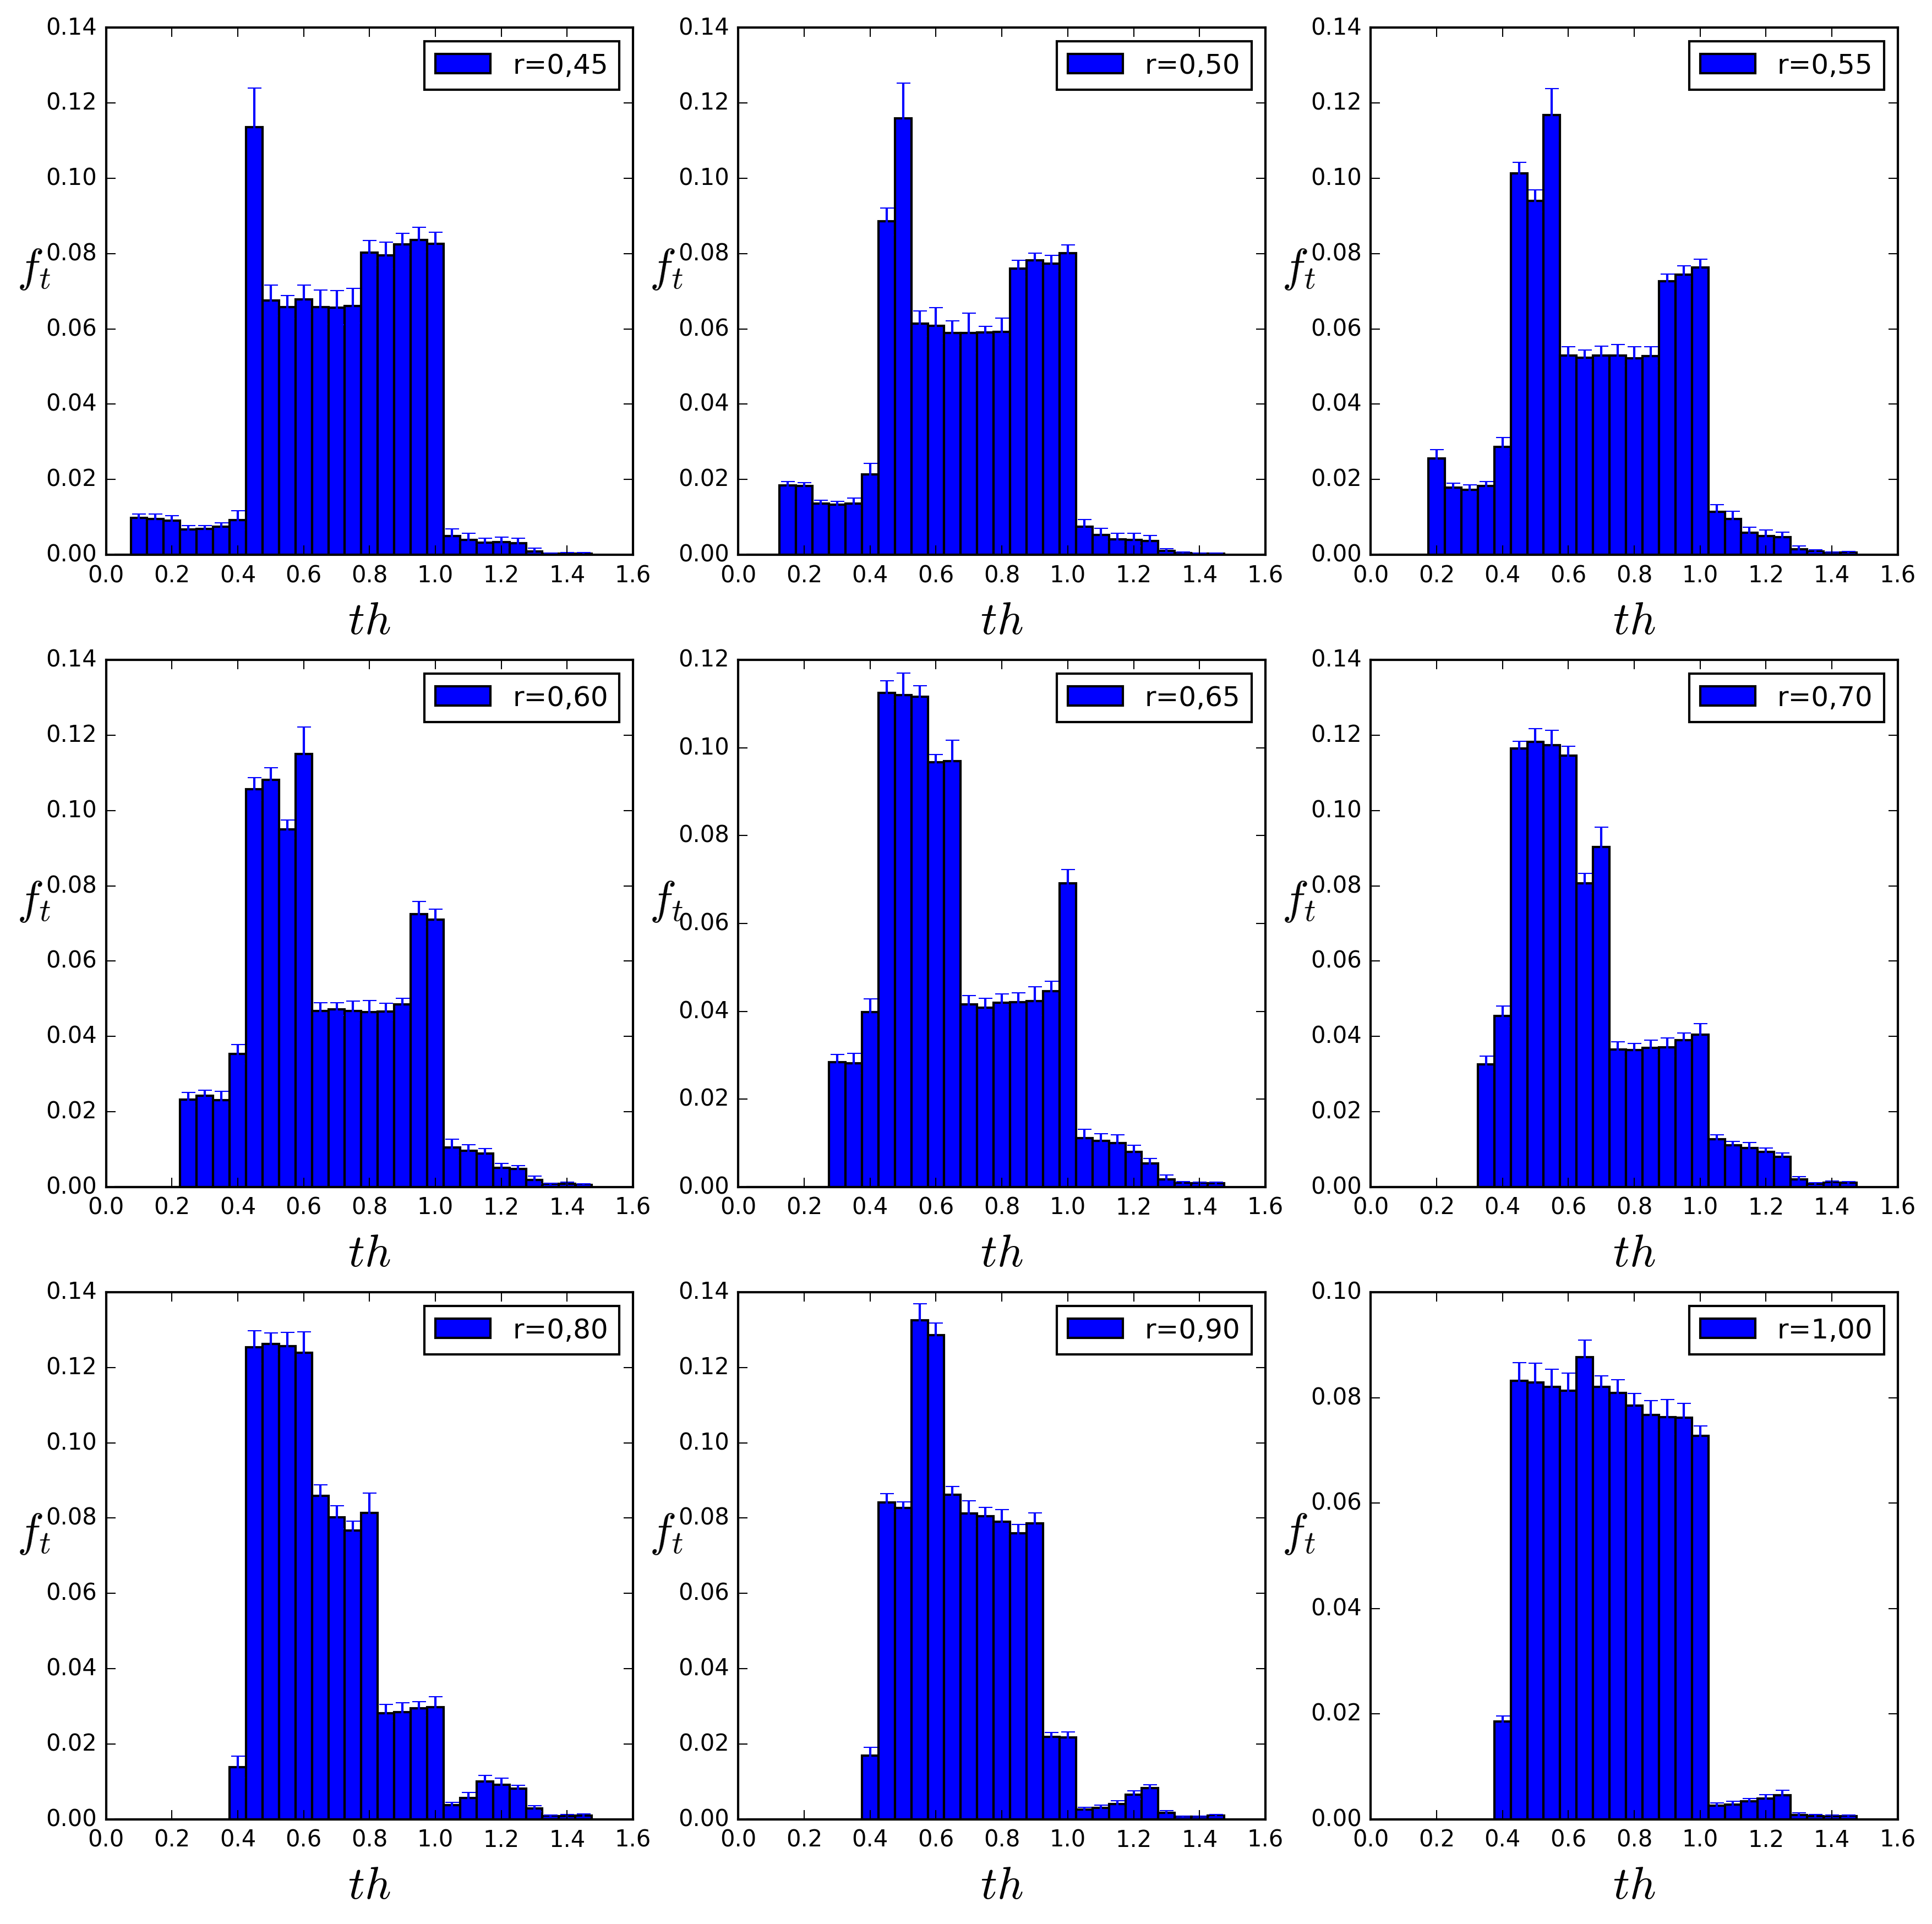
We observe that there is a polarization of the criticism over the news spreaded and this depends on the reliability of the news we gave at the beginning of the simulation.
Clearly we see that the critical value of the news reliability stands in a range between and , so we add in Fig.12 a qualitative representation of a simulation final state of the diffusion graph for a reliability news. We select the nodes who spreaded or debunked the news only, because we are interested in the properties of a news diffusion graph, which is what we can investigate through the use of online social networks APIs.
This representation has been made considering only those links between agents whose thresholds of skepticism did not differ more than , this could be a starting point to consider further links removal and move to dynamic networks. Looking at these picture we can see that a threshold similarity facilitates the communication between agents and the emergence of proto echo-chambers (Bessi et al. 2016).
Nonetheless, we have to look at the properties of the network to see if the topology induces any effect on the diffusion process, e.g. the tendency of our agents to be connected to agents with the same features, i.e. assortativity.
(a) (b) (c)
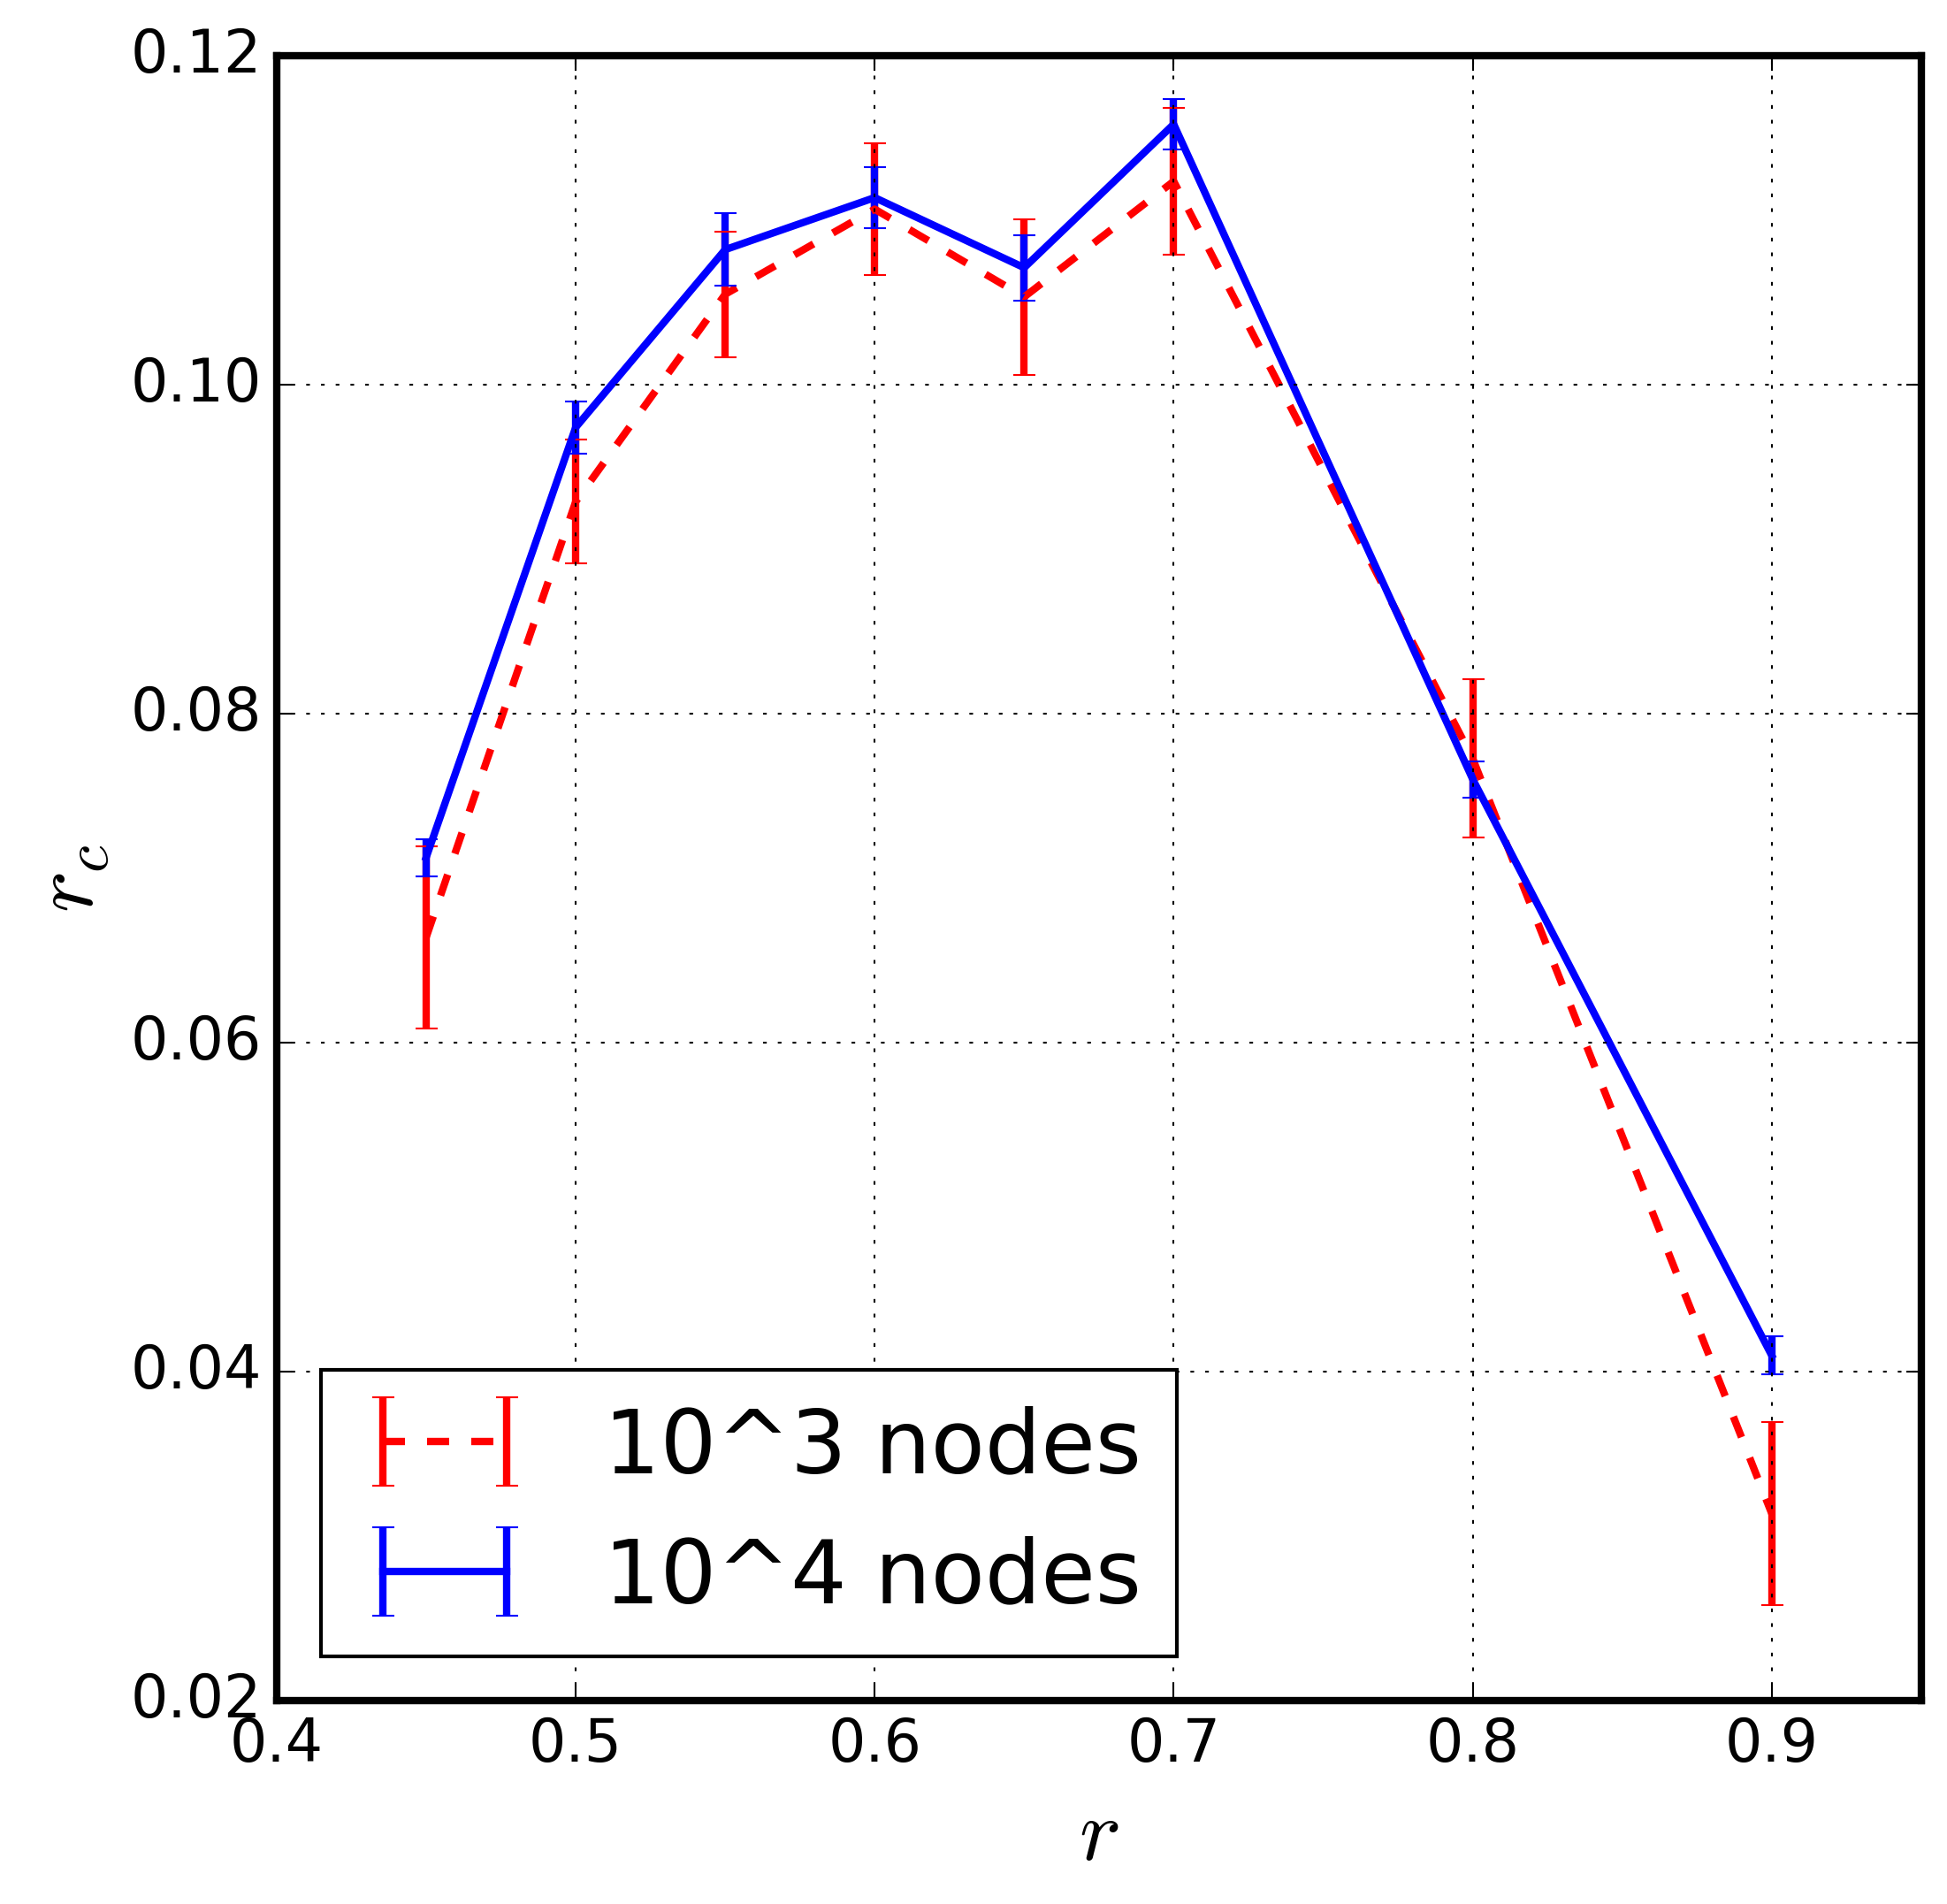
To understand this we looked at the color of our users, which tells us if they were spreaders or debunkers, we measured the attribute assortative coefficient (Newman 2003) in the final states for various news reliabilities, we averaged the values over ten iterations to have a minimal statistic of it and shown it in Fig.11b.
We observe that for contrasted reliability news the averaged assortativity raises while it goes disappearing as the news becomes more reliable. Of course the spreading of a unique news is not enough to reproduce the case studied by Zollo et al. in (Zollo et al. 2017), indeed we cannot say that this proves the existence of the same echo chambers in our model, anyway we know that our agents are strongly influenced by neighbours, so we observe a tendency of our nodes to behave as the nodes with whom they are connected to.
Conclusions
This work gives a contribution to the field of information diffusion because it offers a new framework
of analysis, which takes into account both Multi-Agent based modeling and network science.
Our model behaves well with respect to various and different studies
on real social networks data, we managed to reproduce some important
parameters and features, but first of all we managed to reproduce real phenomena at the macroscopic level.
All these phenomena we modeled in every part of this study are the result of
an emergent behaviour of our agents, in particular of our hypotheses on the interactions at the microscopic level we made from
common experience on the internet or reproduced from other studies on
the topic.
Concerning the case of the Higgs Boson discovery, we reproduced the diffusion of the news through the measure and the modeling of the density of active users over time,
with significant similarity in the quality of the dynamics, considering at the micro level different sets of parameters as the visualization and the news reliability, which came out to be the
most sensitive parameters of our model.
We tried to simulate the diffusion of a hoax and its correction in the case of the National Broadcasting Company spreading during the Occupy Wall Street movement in New York. In this case we had the number of tweets per time during a range of time of hours. We reproduced the qualitative dynamics of the event for various network scales simulating the activation of single users with satisfying results for the purpose of this work.
We have been surprised to see that other unexpected emergent behaviors arised in our model, as described in empirical studies (Bessi et al. 2016),
without the need for further assumptions to be made, indeed we observed the emergence
of substantially separated structures like echochambers independently of the network size scale.
We observed many fluctuations in the results of the simulations due
to the architecture of the network, e.g. the presence of hubs, and the stochasticity of the dynamics
which contributed to reproduce the complexity of a diffusion dynamic
like this.
As we have seen agent based models can be very useful instruments
to investigate information diffusion on social networks with very
few parameters. Despite the complexity of reality, this problem may
need further studies to explain how misinformation is often so much more
viral than corrections and replicate further phenomena based on the same dynamics.
For example, further studies may involve raising the heterogeneity of the agents, let them change their links on a temporal network,
iterate more news spreadings and check the changes in the graph structure. By means of a machine learning algorithm based on real information diffusion data, it could be possible to tune
the parameters on users’ real features, simulate and study attacks to few influent spreaders of a network in order to control the outbreak of scientific misinformation.
References
- Barabási & Albert (1999) Barabási, A.-L. & Albert, R. (1999). Emergence of scaling in random networks. science, 286(5439), 509–512
- Barrat et al. (2008) Barrat, A., Barthelemy, M. & Vespignani, A. (2008). Dynamical processes on complex networks. Cambridge university press
- Bessi et al. (2016) Bessi, A., Zollo, F., Del Vicario, M., Puliga, M., Scala, A., Caldarelli, G., Uzzi, B. & Quattrociocchi, W. (2016). Users polarization on facebook and youtube. PloS one, 11(8), e0159641
- de C Gatti et al. (2013) de C Gatti, M. A., Appel, A. P., dos Santos, C. N., Pinhanez, C. S., Cavalin, P. R. & Neto, S. B. (2013). A simulation-based approach to analyze the information diffusion in microblogging online social network. In Simulation Conference (WSC), 2013 Winter, (pp. 1685–1696). IEEE
- De Domenico et al. (2013) De Domenico, M., Lima, A., Mougel, P. & Musolesi, M. (2013). The anatomy of a scientific rumor. Scientific reports, 3, 2980
- Facebook (2015) Facebook (2015). How news feed works. available at: https://www.facebook.com/help/327131014036297/.
- Feld (1991) Feld, S. L. (1991). Why your friends have more friends than you do. American Journal of Sociology, 96(6), 1464–1477
- Gomez-Rodriguez et al. (2014) Gomez-Rodriguez, M., Gummadi, K. P. & Schoelkopf, B. (2014). Quantifying information overload in social media and its impact on social contagions. In ICWSM, (pp. 170–179)
- Hodas (2012) Hodas, N. O. (2012). How limited visibility and divided attention constrain social contagion. In In SocialCom. Citeseer
- Huang et al. (2016) Huang, W.-M., Zhang, L.-J., Xu, X.-J. & Fu, X. (2016). Contagion on complex networks with persuasion. Scientific reports, 6, 23766
- Jacomy et al. (2014) Jacomy, M., Venturini, T., Heymann, S. & Bastian, M. (2014). Forceatlas2, a continuous graph layout algorithm for handy network visualization designed for the gephi software. PloS one, 9(6), e98679
- Lerman (2016) Lerman, K. (2016). Information is not a virus, and other consequences of human cognitive limits. Future Internet, 8(2), 21
- Liu & Chen (2011) Liu, D. & Chen, X. (2011). Rumor propagation in online social networks like twitter–a simulation study. In Multimedia Information Networking and Security (MINES), 2011 Third International Conference on, (pp. 278–282). IEEE
- López-Pintado (2006) López-Pintado, D. (2006). Contagion and coordination in random networks. International Journal of Game Theory, 34(3), 371–381
- Lotan (2012) Lotan, G. (2012). A tale of three rumors. http://blogs.harvard.edu/truthiness/2012/03/05/541. archived at http://www.webcitation.org/6z0ugjjam.
- Newman (2003) Newman, M. E. (2003). Mixing patterns in networks. Physical Review E, 67(2), 026126
- Serrano et al. (2015) Serrano, E., Iglesias, C. Á. & Garijo, M. (2015). A novel agent-based rumor spreading model in twitter. In Proceedings of the 24th International Conference on World Wide Web, (pp. 811–814). ACM
- SnapStanford (2015) SnapStanford (2015). Higgs twitter dataset https://snap.stanford.edu/data/higgs-twitter.html. archived at http://www.webcitation.org/6z0vwgcwc.
- Tambuscio et al. (2016) Tambuscio, M., Oliveira, D. F., Ciampaglia, G. L. & Ruffo, G. (2016). Network segregation in a model of misinformation and fact checking. arXiv preprint arXiv:1610.04170
- Wooldridge (2009) Wooldridge, M. (2009). An introduction to multiagent systems. John Wiley & Sons
- Zanette (2001) Zanette, D. H. (2001). Critical behavior of propagation on small-world networks. Physical Review E, 64(5), 050901
- Zollo et al. (2017) Zollo, F., Bessi, A., Del Vicario, M., Scala, A., Caldarelli, G., Shekhtman, L., Havlin, S. & Quattrociocchi, W. (2017). Debunking in a world of tribes. PloS one, 12(7), e0181821
- Zollo et al. (2015) Zollo, F., Novak, P. K., Del Vicario, M., Bessi, A., Mozetič, I., Scala, A., Caldarelli, G. & Quattrociocchi, W. (2015). Emotional dynamics in the age of misinformation. PloS one, 10(9), e0138740