Evolution of the Outflows in NGC 3516
Abstract
We analyse the 2011 HST/COS spectrum of the Seyfert 1 galaxy NGC 3516, which demonstrates clear changes in one of the intrinsic absorption troughs (component 5), slight evidence of change in a second trough (component 6), and the appearance of a new absorption trough (component 9). We interpret both the changes and appearance of the new trough as bulk motion across the line-of-sight. The implied lower limit on the transverse velocity of component 5 is 360 km s-1 comparing to the earlier 2001 HST/STIS spectrum, while the lower limits for components 6 and 9 are 920 km s-1 based on 2009 FUSE data. Component 5 also exhibits a shift in velocity centroid. This is only the second known case of this behavior in a Seyfert galaxy. Due to the high quality of the HST/COS spectrum, we identify a previously undetected trough due to an excited state of Si ii for component 1. In combination with the resonance trough of Si ii and photoionization modelling, we directly determine the distance of the component 1 outflow to be 67.2 pc.
1 Introduction
Active galactic nuclei (AGN) are extremely luminous objects due to matter accreting onto a supermassive black hole (SMBH). Seyfert galaxies are AGN that are relatively nearby (z 0.15) and only moderately luminous ( = 43-45) and are known to be highly variable in continuum flux (e.g., Dunn et al., 2006, and references therein) on both short and long timescales. The variability is likely due to changes in the mass inflow rate of the accretion disk which is constrained to a small volume. In approximately 50% of Seyfert galaxies, we observe blueshifted absorption troughs due to outflowing material ejected from the AGN (i.e., intrinsic absorption Crenshaw et al., 2003, and references therein). These mass outflows in AGN are potentially an important feedback mechanism that help regulate the SMBH mass and explain the coevolution of the SMBH and galactic bulge (Di Matteo et al., 2005; Hopkins & Elvis, 2010). Similar to the nuclear continuum, absorption troughs due to outflows tend to show variability in structure or number in Seyfert galaxies. In one survey of this phenomenon, Dunn et al. (2008) found a lower limit for absorption line variability in the far UV of approximately 40% of a sample of 72 Seyfert Galaxies.
While the energetics of mass outflows are beginning to become constrained by observations, the dynamics of these winds is still unclear (e.g., Granato et al., 2004; Di Matteo et al., 2005; Menci et al., 2008; King, 2010; Zubovas & King, 2012; Fabian, 2012; Faucher-Giguère & Quataert, 2012; Zubovas & King, 2014; Nayakshin, 2014; Costa et al., 2014, 2015; King & Pounds, 2015). In order to determine which driving mechanisms (radiation pressure, MHD acceleration, thermal flows) play important roles in the ejection of the material, we require critical information about the outflows in general such as transverse velocities. The most direct technique to constrain the transverse velocity requires variations in the troughs as observed over multiple epochs where the gas presumably moves into or out of the line-of-sight and is uncorrelated with continuum variations, suggesting that ionization changes are not responsible for the absorption variability (Kraemer et al., 2001; Crenshaw & Kraemer, 2007).
It follows that Seyfert galaxies provide excellent testbeds for exploring dynamical scenarios due to their proximity and highly variable nature. NGC3516 (=0.00884) is a well-studied Seyfert galaxy that exhibits intrinsic absorption. Kraemer et al. (2002) characterized the absorption in the Space Telescope Imaging Spectrograph (STIS) 2001 observation as 8 distinctive kinematic components and used photoionization modeling to place distance limits on each component from the nucleus. In X-ray spectra, Holczer & Behar (2012) found that the absorption structure showed variability over the span of 5 years. Crenshaw & Kraemer (2012) provided a summary of the physical constraints on both UV and X-ray absorbers in NGC 3516. We explore in this work the absorption trough variability of the ultraviolet lines in NGC3516 as well as the benefits of detecting previously unknown troughs due to the significantly higher signal-to-noise in the UV spectra from the Cosmic Origins Spectrograph (COS) onboard the Hubble Space Telescope (HST).
2 Update on the UV Spectra of NGC 3516
Using the HST/COS, we obtained new high resolution (R=20,000) spectra of NGC 3516 (=0.00884; RA: 11 06 47.491; Dec: +72 34 06.89) on 2011 January 22. We list the details of these spectra in Table 1. We download the processed spectra (Fox et al., 2015) from the Mikulski Archive for Space Telescopes (MAST) website. As each spectrum covers a different wavelength range, we coadd the spectra for a similar epoch and average overlapping regions weighting by exposure time. The final coadded spectrum has an signal-to-noise ratio of 6.2 near 1550 Å, which is 2.5 higher than the previous HST/STIS spectra.
| Dataset | Start Time | Exposure Time | Grating | Cent. Wavelength |
|---|---|---|---|---|
| (UT) | (s) | (Å) | ||
| LBGU58010 | 06:19:33 | 560.032 | G130M | 1291 |
| LBGU58020 | 06:32:29 | 560.032 | G130M | 1300 |
| LBGU58030 | 06:45:25 | 560.000 | G130M | 1309 |
| LBGU58040 | 06:58:21 | 560.032 | G130M | 1318 |
| LBGU58050 | 07:11:59 | 684.192 | G160M | 1589 |
| LBGU58060 | 07:51:16 | 684.192 | G160M | 1600 |
| LBGU58070 | 08:06:07 | 684.192 | G160M | 1611 |
| LBGU58080 | 08:20:58 | 684.192 | G160M | 1623 |
We also obtained a 16,700 second spectrum of NGC 3516 on 2007 January 23 with the Far Ultraviolet Spectroscopic Explorer (FUSE, Moos et al., 2000). We download all of the available FUSE spectra of NGC 3516 from the MAST archive and process the spectra using the CalFUSE data reduction software (v3.2.3, Dixon et al., 2007). To correct for the so-called “worm” feature frequently observed in the LiF2A segment, we fit the average ratio of the LiF2A to LiF1B with a spline and correct the LiF2A continuum to match the LiF1B (similar to Kriss et al., 2011). We coadd the 8 spectral FUSE segments and scale the fluxes in the overlapping regions of each segment to match the LiF1A, which is the primary channel used for pointing the instrument (see Dunn et al., 2008).
| Dataset | Start Date | Start Time | Exposure Time | Aperture |
|---|---|---|---|---|
| (UT) | (s) | |||
| P1110404000 | 2000-04-17 | 10:58:04 | 16335 | LWRS |
| P2110102000 | 2002-02-14 | 01:46:54 | 20686 | LWRS |
| P2110103000 | 2003-01-28 | 06:17:55 | 16901 | LWRS |
| P2110104000 | 2003-03-29 | 05:44:39 | 16329 | LWRS |
| G9170101000 | 2006-02-09 | 17:12:24 | 28687 | LWRS |
| G9170102000 | 2007-01-23 | 06:38:51 | 16847 | LWRS |
3 Changes in the Continuum Flux and Absorption Troughs
In Figure 1 (top), we show an updated UV continuum flux history of NGC 3516 measured at 1460 Å in the observed frame (Dunn et al., 2006). The continuum flux level in the HST/COS spectrum is consistent with the previous continuum flux measurements taken from HST/STIS spectra in 2000. This hints that the continuum flux of NGC 3516 has remained in a relatively low flux state over the last 10 years. We also show the continuum flux lightcurve measured at 1160 Å for the FUSE data in Figure 1 (bottom). While the source has variation, the general flux level appears to have remained in a low state as seen in both the HST/COS and FUSE flux measurement.

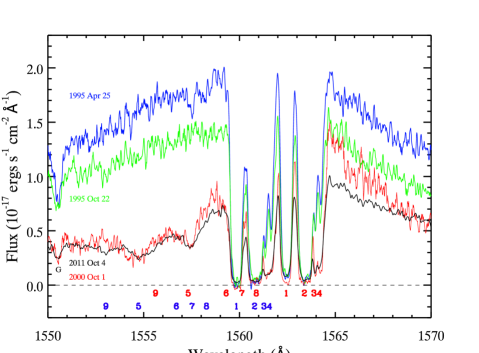
To evaluate the changes in the absorption troughs, we begin by plotting the 3 previous HST high-resolution spectra with the coadded HST/COS spectrum for C iv (Figure 2) and identifying the previously known troughs (Kraemer et al., 2002). The most notable differences occur at high velocity. First, we label a new high velocity kinematic component 9 which is visible at approximately 1553 Å or a radial velocity of 1700 km s-1. This trough is detected at 5 above the level of the flux uncertainties for the N v doublet and 4 for the C iv doublet. Secondly, the component 5 trough visible in the HST/STIS spectrum, located at approximately 1555 Å, has had considerable change in the radial velocity of the centroid and overall profile. This difference in the radial velocity does not appear to be due to variation in the core emission profile as the change is evident after normalizing the emission. Moreover, the component 7 trough, which is similar in depth and equivalent width and closer to the emission core in radial velocity, does not exhibit any measurable change. Finally, we find that the component 1 trough in the red member of the C iv doublet (1551) has become notably shallower.
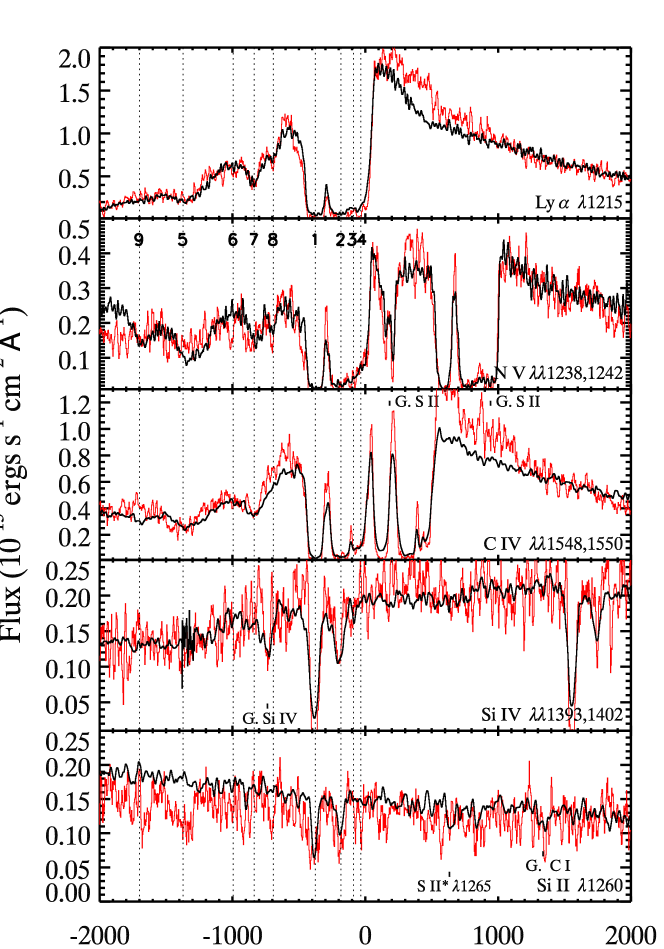
We plot in Figure 3 spectral segments from HST/STIS and the HST/COS for lines from commonly observed ions to search for changes in other components. Component 9 is clearly detected in both the C iv and N v data but is not visible in Si iv or Ly. The lack of a Ly trough is likely due to the presence of the Galactic Ly trough. Similar to C iv, the component 5 trough also appears to have undergone change in N v, although the difference is not as distinct. Also noteworthy in the N v doublet is the lack of the component 6 trough. The trough was only weakly detected by Kraemer et al. (2002) in the HST/STIS spectrum and has potentially vanished by the time of the HST/COS observation. This is based though on the poorer signal-to-noise level in the HST/STIS spectrum. Finally, as with the C iv doublet, the component 1 trough in Si iv ( 1402) appears to be significantly shallower in the HST/COS spectrum.
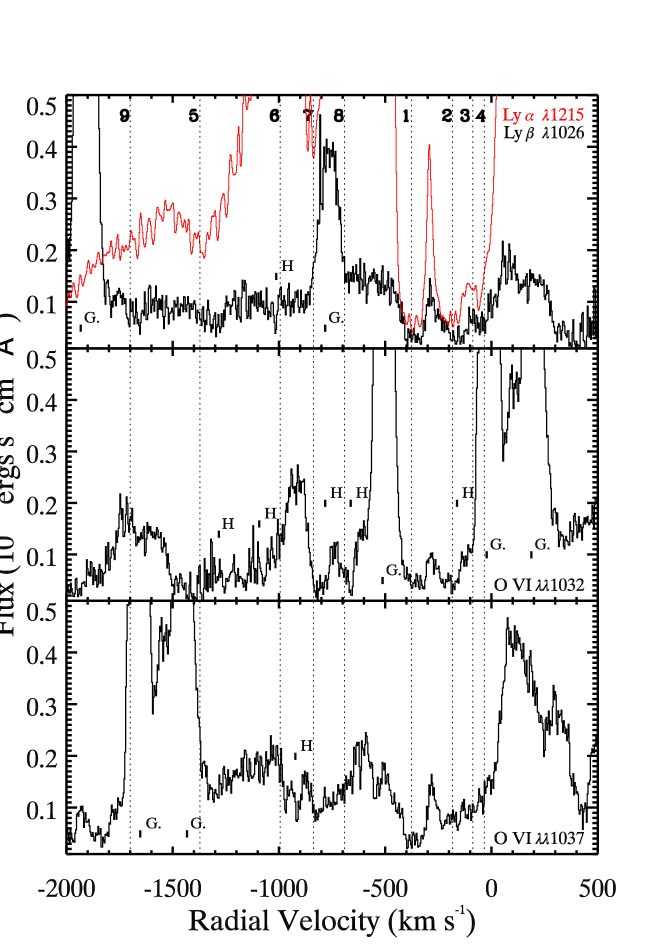
We also plot in Figure 4 the FUSE spectra for Ly 1026 and the O vi doublet 1032,1037. We coadd the available spectra to achieve the highest possible S/N ratio. Component 9 does not seem to appear between the HST/STIS and FUSE observations as it is not readily detected in either the Ly nor the O vi 1032 troughs, although it would be obscured by geocoronal emission in O vi 1037. Component 6 is also not detected in either ion. However, given it was not strongly detected in the HST/STIS spectrum it may not have strong associated Ly or O vi troughs. Component 5 appears shallow in Ly and relatively correlated in velocity with the HST/COS data, which implies the change occurred between the FUSE and HST/COS observations.
We also detect the presence of a previously unobserved trough due to the metastable, excited state line Si ii* 1265 for component 1. The trough is weak but clearly detected and was probably not visible in the HST/STIS spectrum due to the comparably lower signal-to-noise. The trough in conjunction with that from the resonance line Si ii 1260 seen in both the HST/COS and HST/STIS data provides key information on the number density of the gas and its distance from the nucleus (5).
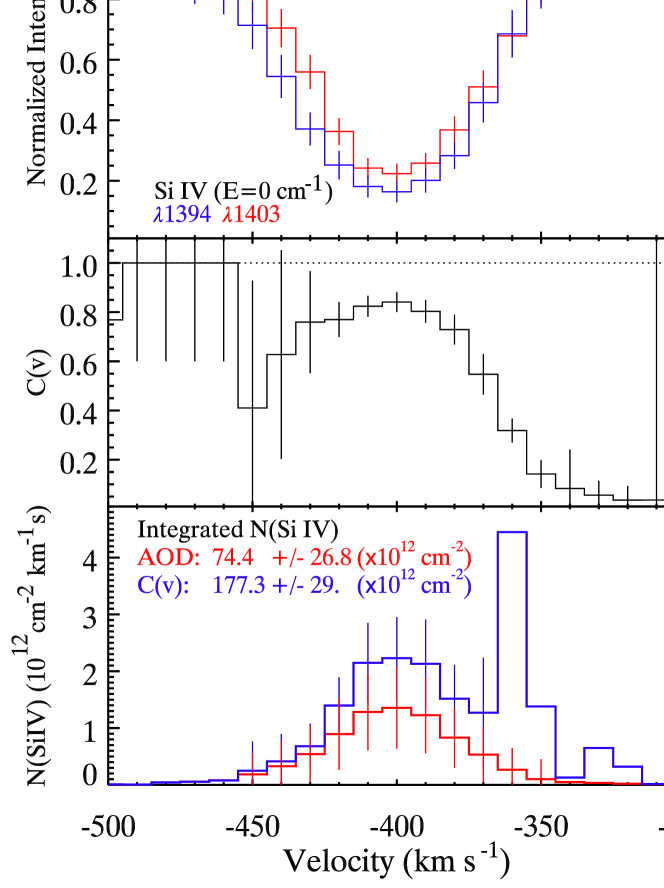
4 Column Density Measurements
To extract the ionic column densities () of the identified troughs, where available we use the velocity dependent pure partial covering method (; de Kool et al., 2002; Arav et al., 2005, 2008; Dunn et al., 2010). We simultaneously determine the optical depth and partial covering factor at every velocity element for each doublet or line series (i.e., the Lyman series), which have known ratios of oscillator strength. We show an example of this for the column density of Si iv in Figure 5. For Si ii and C ii lines of component 1, we assume the covering factor from their higher ionization state counterparts (i.e., C iv and Si iv). For single lines or to provide an absolute lower limit for the column density, we also calculate the apparent optical depth (AOD; Savage & Sembach, 1991). We also measure the new column density of components 5 and 9 based purely on AOD for the blue members of the doublets as the red are blended with other components. We list in Table 3 the new column density determinations for components 1, 5, and 9 and the previously measured column density values for components 1 and 5 from Kraemer et al. (2002) for comparison. For component 1, the measured column densities have exhibited little to no change between epochs, despite the slight change in the depths of some of the troughs.
| Ion | Nion(C1) | Nion(C1) | Nion(C5) | Nion(C5) | Nion(C9) |
|---|---|---|---|---|---|
| (COS) | (STIS)b | (COS) | (STIS)b | (COS) | |
| C ii | 73.2 10.6 | 79 25 | 25 | ||
| C ii* | 99.1 11.6 | 144 30 | 25 | ||
| C iii | 14 | ||||
| C iv | 495 | 1026 | 160 | 211 30 | 50 |
| Si ii | 15.5 1.4 | ||||
| Si ii* | 4.7 1.3 | ||||
| Si iv | 126 51 | 186 | 4 | ||
| H i | 980 | 599 | 97 18 | ||
| O vi | 1020 | ||||
| N v | 1090 | 2048 | 165 39 | 150 | |
| P v | 12 |
For the hydrogen column density, we use the higher order Lyman lines visible in the spectra as there appears to be little evidence for change in continuum flux. The 1026 trough appears to be shallower than the 1216 trough in a normalized spectrum, which suggests non-saturated troughs. However, the underlying continuum in the spectrum is probably contaminated due to the much larger aperture. Thus, we treat the measured column density from as a lower limit. It is also noteworthy that in the 973 trough, despite the poor signal-to-noise, the component 1 trough clearly appears to have a narrow high velocity sub-component and hints of a second lower velocity trough.
The and AOD methods only provide lower limits for traditionally saturated troughs such as the C iv doublet 1548,1551. To attempt a more accurate determination, we begin by creating a template from the Si iv 1402 trough, which appears to be non-saturated as it has a notably shallower depth than its doublet counterpart (1393). We scale the template in optical depth until the wing of the template matches the trough wall (see “wing” fitting technique in Dunn et al. 2010). We show the fit for the C iv 1551 line in Figure 6, which provides the largest lower limit on the column density. From the match, it is clear that the Si iv template cannot match the full velocity range of the C iv troughs when we scale the trough to match the wing, which we discuss further in the next section.

Finally, we find the upper limits for column densities of C iii and P v for component 1. Because there are no clear indications of troughs for either the P v doublet 1118, 1128 or the C iii* excited state line 1175, we scale the Si iv template for component 1 and compare it to the region where these lines would be detected. We vary the scaling in optical depth to the noise level to find the largest possible optical depth that could be buried without detection. We integrate across the template to determine the column density limits and list the values in Table 2.
5 Implications of the New Column Densities and Variability
We find four kinematic components in absorption that show evidence of change despite very little evidence for significant changes in the continuum flux. Comparing the measured column densities for component 1 in the HST/COS spectrum to those measured by Kraemer et al. (2002) for the HST/STIS spectrum (also listed in Table 3), we find that the column densities do not appear to have changed. Thus, the photoionization model determined in Kraemer et al. (2002) is likely still viable for the HST/COS data and further supports the argument that NGC 3516 has been stable since the 2000 HST/STIS observation.
Because of the apparent lack of change in flux, column densities, and ionization state, both the appearance of component 9, the disappearence of component 6 and the changes in component 5 are most easily explained as material moving into or out of the line-of-sight due to transverse velocity. As these are absorbing light from the broad line region (BLR), we limit the transverse velocity based on the crossing time across the line-of-site to the BLR. The size of the BLR in C iv for NGC3516 is estimated to be approximately 4.5 ld (Goad et al., 1999) and the time between the last HST/STIS and HST/COS observations is 4020 days. This yields a lower limit on the transverse velocities for components 5, 6, and 9 of greater than 360 km s-1. However, since the troughs for components 6 and 9 were also not detectable in the spectrum of 2007, we estimate a more robust lower limit of 920 km s-1.
Examining the C iv 1551 trough of component 1, the slight change could also be an indication of a changing column density. Unlike components 5 and 9, since the change only occurred in C iv, it is more plausible that the difference between the HST/STIS and HST/COS spectra is due to the larger aperture of HST/COS. The HST/COS spectrum likely contains an underlying continuum and emission due to active star formation. The structure of component 1 as a whole appears to be a blend of two distinct kinematic components as evidenced by the fit to C iv and the Ly trough. This potentially provides observational support to the two photoionization models necessary (1a and 1b) to match the ionic column densities measured for component 1 (Kraemer et al., 2002).
While the column densities we measure are similar to those of Kraemer et al. (2002), due to the higher signal-to-noise we detect and measure the column density of an excited state line of Si ii* for component 1. Assuming the plasma is in equilibrium, the ratio of the Si ii* column density to the column density of the Si ii resonance line at 1260 provides a simple and reliable diagnostic of the electron density (Bautista et al., 2009). From the measured column densities, we determine a density of 2.3 for component 1.
The ionization state of the plasma is described by the ratio of the rate of hydrogen ionization to recombination, or the so-called ionization parameter given by:
| (1) |
where is the rate of hydrogen ionizing photons emitted by the AGN, is the radial distance of the plasma from the nucleus, and is the speed of light. We measure from the HST/COS spectrum assuming a “UV-soft” SED (Dunn et al. 2010) and find =53.6. Using the value of of 0.9 from Kraemer et al. (2002) for component 1a, we find a distance to the absorber from the nucleus of 67.2 pc. This distance is consistent with the lower limit derived by Crenshaw & Kraemer (2012) of 15.5 pc.
6 Conclusions and Discussion
Using HST/COS spectra of NGC3516, we find for the first time in NGC3516 the appearance of a new absorption trough (component 9) between the FUSE observation in 2006 and the HST/COS observation in 2012. Previous changes in troughs were all ascribed to ionization changes (Kraemer et al. 2002). We also show that component 5 has undergone measurable change in the trough structure and radial velocity, which we attribute to bulk motion. The only other known case of radial velocity change is NGC3783 (Gabel et al., 2003). The final change we find in the new spectrum is that component 6, which was a weakly detected trough in the HST/STIS spectrum, is no longer visible. Accepting the lower signal-to-noise of the HST/STIS spectrum, this disappearance could be due to motion out of the line-of-sight. Considering the physical properties of the AGN of NGC3516, these changes imply lower limits on the transverse velocity of component 5 of 360 km s-1 and components 9 and potentially component 6 of 920 km s-1.
We also find a previously undetected trough due to the higher signal-to-noise HST/COS spectrum of an excited state line for Si ii*. We measure the column density for Si ii* and use the previously established photoionization models by Kraemer et al. (2002) to determine the radial distance of component 1 to be 67.2 pc. Due to the radiation shielding arguments established in Kraemer et al. (2002), this distance agrees with the upper limits for components 2, 3, and 4 but provides a new lower limit for components 58 that is 4.3x larger than the previous limit. Crenshaw & Kraemer (2012) estimated the total kinetic luminosity output for NGC 3516 to be 5.4 ergs s-1 based on the previous limits. Given the increased limit on distance and the linear relation between distance and , the new lower limit for the total kinetic luminosity of NGC 3516 is 2.4 ergs s-1.
Examining the transverse velocities of components 5 and 9 and their radial components of 1450 km s-1 and 1700 km s-1, respectively, we find that the limit on the transverse motion of component 9 (and perhaps 5) is comparable to the radial motion. Similar to the other higher velocity components, component 9 exhibits a high column density ratio for N v/C iv, which implies either that it is highly ionized or that it’s physical state is due to screening by component 1 (Kraemer et al. 2002). Because the other components with similar column density ratios only appear in low flux states, it follows that they are likely experiencing screening and are at larger radial distances than component 1. The column densities for component 9 are consistent with this scenario and suggest that it also has a radial distance beyond that of component 1. Given the limit on the distance from the nucleus for both components 5 and 9, the transverse velocities for each component are larger than the rotational velocities, which we estimate to be 67 km s-1 based upon the SMBH mass (42.7 million ; Peterson et al., 2004) and gravitational potential of the host galaxy (Mulchaey et al., 1992). The large transverse velocities beyond that of galactic rotation could suggest an origin much closer to the nucleus.
References
- Arav et al. (2005) Arav, N., Kaastra, J., Kriss, G. A., Korista, K. T., Gabel, J., & Proga, D. 2005, ApJ, 620, 665
- Arav et al. (2008) Arav, N., Moe, M., Costantini, E., Korista, K. T., Benn, C., & Ellison, S. 2008, ApJ, 681, 954
- Bautista et al. (2009) Bautista, M. A., Quinet, P., Palmeri, P., Badnell, N. R., Dunn, J., & Arav, N. 2009, A&A, 508, 1527
- Costa et al. (2014) Costa, T., Sijacki, D., & Haehnelt, M. G. 2014, MNRAS, 444, 2355
- Costa et al. (2015) ——. 2015, MNRAS, 448, L30
- Crenshaw & Kraemer (2007) Crenshaw, D. M., & Kraemer, S. B. 2007, ApJ, 659, 250
- Crenshaw & Kraemer (2012) ——. 2012, ApJ, 753, 75
- Crenshaw et al. (2003) Crenshaw, D. M., Kraemer, S. B., & George, I. M. 2003, ARA&A, 41, 117
- de Kool et al. (2002) de Kool, M., Korista, K. T., & Arav, N. 2002, ApJ, 580, 54
- Di Matteo et al. (2005) Di Matteo, T., Springel, V., & Hernquist, L. 2005, Nature, 433, 604
- Dixon et al. (2007) Dixon, W. V. et al. 2007, PASP, 119, 527
- Dunn et al. (2010) Dunn, J. P. et al. 2010, ApJ, 709, 611
- Dunn et al. (2008) Dunn, J. P., Crenshaw, D. M., Kraemer, S. B., & Trippe, M. L. 2008, AJ, 136, 1201
- Dunn et al. (2006) Dunn, J. P., Jackson, B., Deo, R. P., Farrington, C., Das, V., & Crenshaw, D. M. 2006, PASP, 118, 572
- Fabian (2012) Fabian, A. C. 2012, ARA&A, 50, 455
- Faucher-Giguère & Quataert (2012) Faucher-Giguère, C.-A., & Quataert, E. 2012, MNRAS, 425, 605
- Fox et al. (2015) Fox, A. et al. 2015, The COS/FUV Focus Sweep Program at Lifetime Position 3 (LENA2/13635), Tech. rep.
- Gabel et al. (2003) Gabel, J. R. et al. 2003, ApJ, 595, 120
- Goad et al. (1999) Goad, M. R., Koratkar, A. P., Kim-Quijano, J., Korista, K. T., O’Brien, P. T., & Axon, D. J. 1999, ApJ, 524, 707
- Granato et al. (2004) Granato, G. L., De Zotti, G., Silva, L., Bressan, A., & Danese, L. 2004, ApJ, 600, 580
- Holczer & Behar (2012) Holczer, T., & Behar, E. 2012, ApJ, 747, 71
- Hopkins & Elvis (2010) Hopkins, P. F., & Elvis, M. 2010, MNRAS, 401, 7
- King & Pounds (2015) King, A., & Pounds, K. 2015, ARA&A, 53, 115
- King (2010) King, A. R. 2010, MNRAS, 408, L95
- Kraemer et al. (2001) Kraemer, S. B., Crenshaw, D. M., & Gabel, J. R. 2001, ApJ, 557, 30
- Kraemer et al. (2002) Kraemer, S. B., Crenshaw, D. M., George, I. M., Netzer, H., Turner, T. J., & Gabel, J. R. 2002, ApJ, 577, 98
- Kriss et al. (2011) Kriss, G. A. et al. 2011, A&A, 534, A41
- Menci et al. (2008) Menci, N., Fiore, F., Puccetti, S., & Cavaliere, A. 2008, ApJ, 686, 219
- Moos et al. (2000) Moos, H. W. et al. 2000, ApJ, 538, L1
- Mulchaey et al. (1992) Mulchaey, J. S., Tsvetanov, Z., Wilson, A. S., & Perez-Fournon, I. 1992, ApJ, 394, 91
- Nayakshin (2014) Nayakshin, S. 2014, MNRAS, 437, 2404
- Peterson et al. (2004) Peterson, B. M. et al. 2004, ApJ, 613, 682
- Savage & Sembach (1991) Savage, B. D., & Sembach, K. R. 1991, ApJ, 379, 245
- Zubovas & King (2012) Zubovas, K., & King, A. 2012, ApJ, 745, L34
- Zubovas & King (2014) Zubovas, K., & King, A. R. 2014, MNRAS, 439, 400