Gemini/GMOS Spectroscopy of Globular Clusters in the Merger Remnant Galaxy M85
Abstract
M85 is a peculiar S0 galaxy in Virgo and is a well-known merger remnant. In this paper, we present the first spectroscopic study of globular clusters (GCs) in M85. We obtain spectra for 21 GC candidates and the nucleus of M85 using the Gemini Multi-Object Spectrograph on the Gemini North 8.1 m telescope. From their radial velocities, 20 of the GCs are found to be members of M85. We find a strong rotation signal of the M85 GC system with a rotation amplitude of 235 km s-1. The rotation axis of the GC system has a position angle of about 161, which is 515 larger than that of the stellar light. The rotation-corrected radial velocity dispersion of the GC system is estimated to be 160 km s-1. The rotation parameter of the GC system is derived to be 1.47, which is one of the largest among known early-type galaxies. The ages and metallicities of the GCs, which show the same trend as the results based on Lick indices, are derived from full spectrum fitting (ULySS). About a half of the GCs are an intermediate-age population of which the mean age is 3.7 1.9 Gyr, having a mean [Fe/H] value of –0.26. The other half are old and metal-poor. These results suggest that M85 experienced a wet merging event about 4 Gyr ago, forming a significant population of star clusters. The strong rotational feature of the GC system can be explained by an off-center major merging.
1 Introduction
M85 is an S0pec galaxy in the northernmost region of the Virgo Cluster and has many interesting and unusual properties. It has the second highest fine-structure index, , in the list of merger remnant elliptical and S0 galaxies in Schweizer & Seitzer (1992). The fine-structure index defined by Schweizer et al. (1990) is a quantitative parameter that measures how many fine structures exist, which gives information about the time and length of the last merger. M85 shows isophotes distorted due to its neighbor galaxies (Burstein, 1979), a dozen irregular ripples (Schweizer & Seitzer, 1988), and boxy isophotes within 1 from the galaxy center(Ferrarese et al., 2006). Kormendy et al. (2009) found that the surface brightness profile of M85 is different from that of typical S0 galaxies, in the sense that it shows an excess in the outer region at . M85 shows a positive color gradient in the central region at (becoming bluer toward the center), which is in contrast to other early-type galaxies (Lauer et al., 2005). In addition, the nucleus of M85 shows a double structure with a separation of (Lauer et al., 2005). McDermid et al. (2004) revealed, using high-resolution integral-field spectroscopy, that M85 has a counter-rotating kinematically decoupled core within 1. All of these features indicate that M85 might have experienced merging events in the recent past.
Several studies have estimated the age of the central stellar light of M85 and concluded that M85 had undergone merger-induced star formation. Schweizer & Seitzer (1992) developed a simple two-burst model for mergers based on the color of galaxies, assuming the merger progenitors and gas-to-star conversion efficiency, and provided a relation between the heuristic merger age and fine-structure index. From this model, they derived a heuristic merger age for M85 ranging from 3.9 to 7.5 Gyr. Fisher et al. (1996) detected a strong H absorption line in the spectrum of the M85 nucleus, which indicates that it may be younger than 3 Gyr. Terlevich & Forbes (2002) also estimated the age and metallicity from the H line index and a combination index [MgFe] of the M85 nucleus: an age of 1.6 Gyr and [Fe/H] 0.44 dex. These suggest that there was a wet merging event for M85 a few gigayears ago. Table 1 lists the basic parameters of M85.
| Parameter | Value | References |
|---|---|---|
| R.A. (J2000) | 12:25:24.1 | 1 |
| Decl. (J2000) | +18:11:29 | 1 |
| Morphological type | S01(3)pec | 2 |
| -band total magnitude, | 10.09 | 2 |
| -band total magnitude, | 8.82 | 3 |
| Distance | 17.86 Mpc | 4 |
| Distance modulus, | 31.26 0.05 | 4 |
| Foreground reddening, | 0.0239 | 5 |
| Absolute -band total magnitude, | –21.28 | 2 |
| Absolute -band total magnitude, | –22.52 | 3 |
| Effective radius from Sérsic fit, | 12889 | 3 |
| Image scale | 5.21 kpc arcmin-1 | |
| 86.8 pc arcsec-1 | ||
| Radial velocity, | 729 2 km s-1 | 6 |
If M85 had experienced a wet merger a few gigayears ago, it is expected that M85 may host numerous intermediate-age globular clusters (GCs) formed during the wet merging process. There are only two studies of the GCs in M85 in the literature, and they are based purely on photometry. Peng et al. (2006) presented the color distribution of the GCs based on the HST/ACS images obtained from the ACS Virgo Cluster Survey (Côté et al., 2004). In massive early-type galaxies, GCs often show a bimodality in their color distribution, indicating the presence of two distinct populations: an old metal-poor population and an old metal-rich one. The color distribution of the GCs in M85, however, is not simply bimodal. Peng et al. (2006) suggested that M85 is a good candidate that may show a trimodal GC color distribution. Later, Trancho et al. (2014) investigated the GC population in the northwestern region of M85 with a combination of photometry in the ACSVCS and photometry obtained using the Near InfraRed Imager and spectrograph on the Gemini North telescope. They suggested that about 85% of the observed GCs may be intermediate-age clusters formed about 1.8 Gyr ago.
In this study, we present a spectroscopic survey of the GCs in M85 with the Gemini Multi-Object Spectrograph (GMOS) on the Gemini North telescope. Spectroscopic surveys of the GCs have advantages over photometric surveys. First, spectroscopy is efficient for removing the foreground and background contamination in the photometric GC candidates. Second, spectral analysis enables us to estimate the ages and metallicities of the GCs independently, breaking the age-metallicity degeneracy involved with photometric studies. However, to date, there has been no previous spectroscopic study of M85 GCs.
This paper is organized as follows. We briefly describe the spectroscopic target selection, observation, and data reduction in Section 2. In Section 3, we derive the radial velocities of targets and identify genuine M85 GCs. In Section 4, we investigate the age and metallicity distribution of the M85 GCs and in Section 5, we present the kinematic properties of the M85 GC system. Primary results are discussed in Section 6. We summarize the results in Section 7. We adopted a distance to M85 of 17.9 Mpc (Mei et al., 2007). One arcmin (one arcsec) corresponds to 5.21 kpc (86.8 pc) at the distance to M85.
2 Observation and data reduction
2.1 Target Selection for Spectroscopy
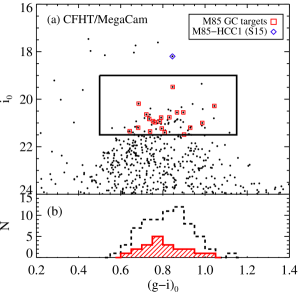
We selected GC candidates from the -band images obtained from the CFHT/MegaCam observation (program 14AK06, PI: Myung Gyoon Lee; Ko, Y. et al. 2018, in preparation). GCs at the distance of the Virgo cluster appear as point sources or slightly extended sources in the CFHT/MegaCam images. Figure 1(a) shows the color-magnitude diagram (CMD) for the point sources and the slightly extended sources in the field centered on M85. The and magnitudes are based on the CFHT/MegaCam AB system. The foreground reddening toward M85 is (Schlafly & Finkbeiner, 2011), and the corresponding extinction values ( and ) are used in this study.
The dominant population seen in Figure 1(a) has a color range of , and it contains mostly GCs in M85. For the GC candidates, we selected the sources with a color range of , as done in the case of NGC 474, based on the same magnitude system(Lim et al., 2017). Then, we chose the bright GC candidates with as the target candidates for spectroscopy, marked by the large box in the figure. We set the bright limit because all of the sources brighter than = 19.0 mag in the field of view of GMOS are saturated in the CFHT images except for the hypercompact cluster in M85 (M85-HCC1) discovered by Sandoval et al. (2015).
Finally, among the bright GC candidates, we selected 21 GC candidates for spectroscopy, while taking into consideration the silt configuration in the Gemini-N/GMOS mask. Figure 1(b) shows the color distribution of the selected spectroscopic targets, in comparison with that of all GC candidates with the same magnitude and color ranges.
In addition to our M85 GC candidates, we included two sources as a reference for radial velocity: M85-HCC1, with mag (Sandoval et al., 2015), and SDSS J122519.52+181053.7, classified as a star in SDSS DR12 (Alam et al., 2015) with mag. We also included the nucleus of M85 for comparison with the M85 GCs. The basic information for the spectroscopic targets is listed in Table 2.
| ID | (J2000) | (J2000) | |||||
|---|---|---|---|---|---|---|---|
| (deg) | (deg) | (mag) | (mag) | (mag) | (mag) | (km s-1) | |
| M85-GC01 | 186.305710 | 18.160259 | 22.087 0.008 | 1.04 0.01 | 1023 17 | ||
| M85-GC02 | 186.307587 | 18.206360 | 22.198 0.008 | 0.79 0.01 | 967 30 | ||
| M85-GC03 | 186.320374 | 18.160419 | 22.130 0.008 | 0.84 0.01 | 718 53 | ||
| M85-GC04 | 186.326767 | 18.193560 | 21.982 0.007 | 0.73 0.01 | 1121 24 | ||
| M85-GC05 | 186.329453 | 18.159719 | 21.667 0.006 | 0.84 0.01 | 760 32 | ||
| M85-GC06 | 186.333328 | 18.195629 | 21.525 0.005 | 0.92 0.01 | 21.475 0.021 | 1.16 0.02 | 1027 17 |
| M85-GC07 | 186.336823 | 18.184280 | 21.833 0.006 | 0.81 0.01 | 21.830 0.021 | 0.97 0.02 | 555 15 |
| M85-GC08 | 186.340759 | 18.196980 | 21.430 0.005 | 1.09 0.01 | 21.076 0.027 | 1.19 0.04 | 659 16 |
| M85-GC09 | 186.348480 | 18.175610 | 21.827 0.006 | 0.84 0.01 | 21.857 0.016 | 1.05 0.02 | 915 23 |
| M85-GC10 | 186.352448 | 18.198999 | 20.431 0.002 | 0.90 0.01 | 20.330 0.025 | 1.19 0.03 | 652 19 |
| M85-GC11 | 186.354111 | 18.182461 | 21.552 0.005 | 0.95 0.01 | 21.583 0.020 | 1.23 0.02 | 653 18 |
| M85-GC12 | 186.356293 | 18.172230 | 21.462 0.005 | 0.77 0.01 | 21.509 0.007 | 0.87 0.01 | 674 27 |
| M85-GC13 | 186.360748 | 18.206301 | 21.780 0.006 | 0.80 0.01 | 21.836 0.018 | 1.00 0.02 | 464 26 |
| M85-GC14 | 186.365677 | 18.186300 | 21.691 0.006 | 0.88 0.01 | 21.695 0.015 | 1.13 0.02 | 700 15 |
| M85-GC15 | 186.368820 | 18.185720 | 20.972 0.004 | 0.73 0.01 | 20.951 0.018 | 0.85 0.02 | 927 36 |
| M85-GC16 | 186.373337 | 18.193729 | 21.666 0.006 | 0.78 0.01 | 21.827 0.009 | 1.06 0.03 | 656 11 |
| M85-GC17 | 186.380371 | 18.205959 | 22.230 0.009 | 0.98 0.01 | 22.285 0.023 | 1.31 0.03 | 427 18 |
| M85-GC18 | 186.387253 | 18.186489 | 22.310 0.009 | 0.86 0.01 | 537 15 | ||
| M85-GC19 | 186.389374 | 18.206619 | 22.091 0.008 | 0.69 0.01 | 22.270 0.028 | 0.90 0.03 | 404 29 |
| M85-GC20 | 186.394760 | 18.170530 | 22.491 0.010 | 0.95 0.01 | 640 12 | ||
| Star01 | 186.323792 | 18.172689 | 21.874 0.007 | 0.61 0.01 | 32 42 | ||
| M85-HCC1 | 186.345184 | 18.181549 | 19.141 0.001 | 0.89 0.01 | 19.134 0.026 | 1.18 0.04 | 659 4c |
| M85-Nucleus | 186.350327 | 18.191050 | 756 8 |
2.2 Spectroscopic Observation and Data Reduction
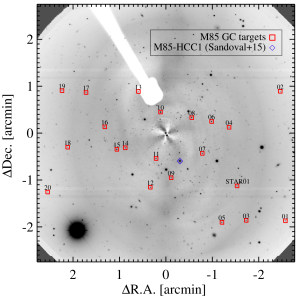
We carried out spectroscopic observations using the Gemini-N/GMOS on 2015 March 22 (program ID: GN-2015A-Q-207, PI: Myung Gyoon Lee). We designed a mask with a field of view of . Figure 2 shows the positions of the spectroscopic targets overlaid on the GMOS -band image of M85. The galaxy light of M85 was subtracted from the original image using IRAF/ELLIPSE fitting. The spectroscopic targets are located along the E–W direction to avoid slit collision. We used a B600_G5307 grating with a dispersion of 0.92 Å pixel-1, which covers the wavelength range of about 3800 Å to 6000 Å for most of our targets. We did a 2 pixel binning in the spectral direction and a 4 pixel binning in the spatial direction for each target in order to improve the signal-to-noise ratio of the observed spectra. Each target was placed at the central 10 wide slit. The exposures were taken in eight sets of 1800 s, and the total integrated exposure time is 4 hr.
We used the Gemini package in IRAF for data reduction.111IRAF is distributed by the National Optical Astronomy Observatory, which is operated by the Association of Universities for Research in Astronomy (AURA) under a cooperative agreement with the National Science Foundation. We used the gsflat task to make a master flat and the gsreduce task for the bias and overscan correction, trimming, and flat-fielding. The wavelength calibration was done with the gswavelength task using CuAr arc spectra. The wavelength solution was applied to the science data using the gstransform task. We used the gemcombine task to combine eight exposures for each target, and the gsskysub task to subtract the background level. The spectra were traced and extracted using the gsextract task. We derived a sensitivity function from the spectrophotometric standard star Hiltner 600, observed during the same night, using gsstandard. Science spectra were flux-calibrated with gscalibrate using the derived sensitivity function. The mean signal-to-noise ratio of the final spectra of GC candidates at 4000 – 5700 ranges from 12 to 56.
3 Radial velocity measurements and membership


We used the Fourier cross-correlation task, fxcor, in the IRAF rv package (Tonry & Davis, 1979), to estimate the heliocentric radial velocities of the spectroscopic targets. SDSS J122519.52+181053.7 and M85-HCC1 are used as spectral templates for the radial velocity measurements. The radial velocities of the SDSS star and M85-HCC1 are 35 4 km s-1 and 659 4 km s-1, respectively, according to the SDSS DR12. To apply the cross-correlation method, we used the prominent absorption features of the spectroscopic targets over the wavelength range of 4840 – 5500 Å. For each target, we adopted the error-weighted mean value of the radial velocities determined by two spectral templates.
We measured the radial velocity of the M85 nucleus to be 756 8 km s-1 , similar to the previous measurements, = 729 2 km s-1 from Smith et al. (2000) and = 760 km s-1 from Gavazzi et al. (2004). The radial velocity uncertainties range from 8 to 53 km s-1, with a mean value of 23 11 km s-1.
Figure 3 shows the heliocentric radial velocity distribution of 21 GC candidates. The radial velocity distribution of most GC candidates shows a peak at 700 km s-1, which is similar to that of the M85 nucleus. Only one GC candidate shows a large deviation, at = 32 km s-1. We considered 20 GC candidates with = 404 – 1121 km s-1 to be the GCs bound to M85. The source with = 32 km s-1 is considered to be a foreground star.
Figure 4 shows the spectra of three GC examples (an old metal-poor GC, M85-GC15; an old metal-rich GC, M85-GC11; and an intermediate-age GC, M85-GC10) confirmed in this study, in comparison with the spectrum of the M85 nucleus. The continuum of the old metal-poor GC spectrum is flatter than that of the old metal-rich GC and intermediate-age GC spectra. The old metal-rich GC spectrum shows a stronger Mg absorption line, when compared with the old metal-poor GC spectrum. The intermediate-age GC spectrum shows stronger H and Mg absorption lines, resembling the spectrum of the M85 nucleus.
4 Age, [Z/H], and [/Fe] of M85 GCs
4.1 Lick Indices
Burstein et al. (1984) measured the strengths of 11 prominent absorption lines in the spectra of 17 Galactic GCs with a resolution of about 9 Å and introduced them as the Lick index system. Later, Worthey et al. (1994) and Worthey & Ottaviani (1997) added 10 and 4 more absorption lines to the Lick index system, respectively. Trager et al. (1998) refined the system with a definition of these 25 absorption lines. The Lick line indices are widely used to determine the ages and metallicities of old stellar systems by comparing them with those expected from theoretical models.
We measured the Lick indices from the spectra of the 20 GCs, M85-HCC1, and the M85 nucleus using the EZ_Ages package (Graves & Schiavon, 2008) based on the stellar population model of Schiavon (2007). Since we did not observe the Lick standard stars during our observing run, we could not calibrate our values of the Lick indices to the Lick standard system. Pierce et al. (2006a, b) also used noncalibrated Lick indices to determine the ages and metallicities of GCs in two elliptical galaxies, NGC 3379 and M60. They noticed that some indices show systematic differences from those expected from simple stellar population (SSP) models. We also caution about this point. The Lick line indices and errors of all observation targets are listed in Tables 3 and 4, respectively.
We used two independent methods based on these Lick line indices to derive the ages and metallicities of M85 GCs, M85-HCC1, and the M85 nucleus: a Lick index grid method and a minimization method. We used the SSP models of Thomas et al. (2011). The ages of the SSP models of Thomas et al. (2011) range from 0.1 to 15 Gyr, the metallicities [Z/H] from –2.25 to +0.67, and the -element abundances [/Fe] from –0.3 to +0.5.
4.1.1 Lick Index Grid Method
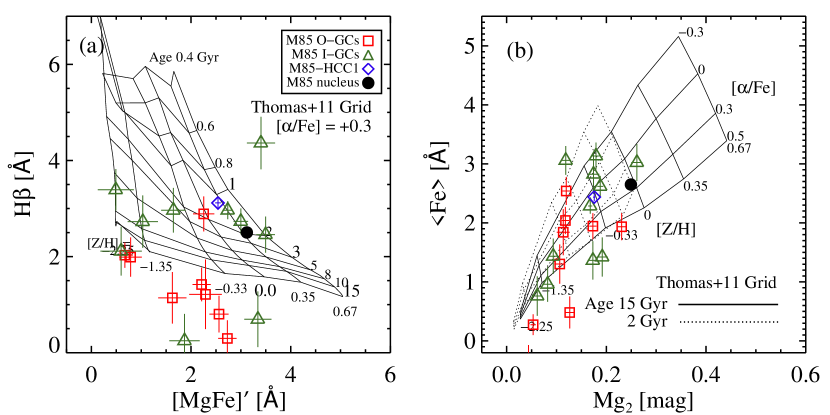
The Lick index grid method uses age- and metallicity-sensitive absorption lines such as Balmer lines (H, H, and H), Fe5270, Fe5335, and Mg lines (Puzia et al., 2005). Figure 5 shows the diagnostic grids with the Lick indices of the M85 GCs, M85-HCC1, and the M85 nucleus: (a) H vs. [MgFe]′ and (b) Fe vs. Mg2. We selected the H index for the age indicator rather than the H and H indices because of its higher signal-to-noise ratio. The [MgFe]′ index is defined as [MgFe]′ = , which is a metallicity-sensitive composite index and little affected by [/Fe]. The Fe index is a metallicity indicator defined as Fe = (Fe5270 + Fe5335)/2, while the Mg2 index is sensitive to -element abundances.
In Figure 5(a), the sample of the M85 GCs is divided into two groups: an intermediate-age group with ages of 1-2 Gyr and an old group with ages older than 10 Gyr. The old GCs are all located below the 15 Gyr limit of the model in the figure. Most GCs older than 5 Gyr have metallicities lower than the solar metallicity ([Z/H] = 0). M85-HCC1 and the M85 nucleus have ages of a few gigayears and supersolar metallicities. A few M85 GCs show ages and metallicities similar to those of the M85 nucleus. Figure 5(b) shows that the [/Fe] values of the GCs range from –0.3 to +0.3. Most of the GCs in M85 are on the grids. We determined the ages, metallicities, and [/Fe] of all GCs, M85-HCC1, and the M85 nucleus through iterations between two diagnostic grids: the H versus [MgFe]′ grid and the Mg2 versus Fe grid. We followed the iteration technique described in Puzia et al. (2005) and Park et al. (2012). The [Z/H] can be measured from each grid, so we present the [Z/H] values from both grids. Note that there are some GCs older than 15 Gyr that fall outside the diagnostic grid. In this case, we adopted the parameters of the nearest point of the model grids in the direction of their error vector.
4.1.2 Minimization Method
Proctor et al. (2004) suggested a minimization technique based on the residuals between the observed Lick indices and SSP model predictions. This method uses as many Lick indices as possible so that it does not depend significantly on any specific lines. Among the 25 Lick indices, we excluded several lines in each spectrum for the fitting. First, we excluded the CN1, CN2, Ca4227, and NaD indices, following Proctor et al. (2004). The nitrogen abundance anomaly is a well-known problem for Galactic GCs. The CN indices and Ca4227 index are sensitive to nitrogen abundances, so they do not fit well with the typical SSP models. The NaD index is rejected because it is severely affected by interstellar absorption. Second, we only used the absorption lines with signal-to-noise ratios higher than 10. Third, we excluded some indices after clipping of their values iteratively. Finally, we used 8–20 Lick indices of each GC for the fitting.
| ID | CN1 | CN2 | Ca4227 | G4300 | Fe4383 | Ca4455 | Fe4531 | Fe4668 | H | Fe5015 | Mg1 | Mg2 | Mg | Fe5270 | Fe5335 | Fe5406 | Fe5709 | Fe5782 | NaD | TiO1 | TiO2 | H | H | H | H |
|---|---|---|---|---|---|---|---|---|---|---|---|---|---|---|---|---|---|---|---|---|---|---|---|---|---|
| (mag) | (mag) | (Å) | (Å) | (Å) | (Å) | (Å) | (Å) | (Å) | (Å) | (mag) | (mag) | (Å) | (Å) | (Å) | (Å) | (Å) | (Å) | (Å) | (mag) | (mag) | (Å) | (Å) | (Å) | (Å) | |
| M85-GC01 | |||||||||||||||||||||||||
| M85-GC02 | |||||||||||||||||||||||||
| M85-GC03 | |||||||||||||||||||||||||
| M85-GC04 | |||||||||||||||||||||||||
| M85-GC05 | |||||||||||||||||||||||||
| M85-GC06 | |||||||||||||||||||||||||
| M85-GC07 | |||||||||||||||||||||||||
| M85-GC08 | |||||||||||||||||||||||||
| M85-GC09 | |||||||||||||||||||||||||
| M85-GC10 | |||||||||||||||||||||||||
| M85-GC11 | |||||||||||||||||||||||||
| M85-GC12 | |||||||||||||||||||||||||
| M85-GC13 | |||||||||||||||||||||||||
| M85-GC14 | |||||||||||||||||||||||||
| M85-GC15 | |||||||||||||||||||||||||
| M85-GC16 | |||||||||||||||||||||||||
| M85-GC17 | |||||||||||||||||||||||||
| M85-GC18 | |||||||||||||||||||||||||
| M85-GC19 | |||||||||||||||||||||||||
| M85-GC20 | |||||||||||||||||||||||||
| M85-HCC1 | |||||||||||||||||||||||||
| M85-Nucleus |
4.2 Full Spectrum Fitting
We also used the spectrum fitting code ULySS222http://ulyss.univ-lyon1.fr (Koleva et al., 2009) to derive the ages and [Fe/H] of the M85 GCs. Koleva et al. (2008) presented the full spectrum fitting results from various combinations of SSP models and stellar libraries. They showed that the ages and metallicities of the GCs derived from the full spectrum fitting are consistent with those from the isochrone-fitting method based on photometry of resolved stars in the GCs. Recently, several studies have used the ULySS code to obtain stellar population parameters of GCs in nearby galaxies (e.g. Sharina et al. 2010, Cezario et al. 2013).
We fit the GMOS spectra of the 20 GCs in M85, adopting the SSP models of Vazdekis et al. (2010) computed using the MILES stellar library (Sánchez-Blázquez et al., 2006) and the Salpeter IMF. The SSP models cover the optical spectral range of 3540.5–7409.6 Å at a resolution of FWHM 2.3 Å. The ages of the SSP models range from 63 Myr to 18 Gyr and the metallicities [M/H] from –2.32 to +0.22 dex.
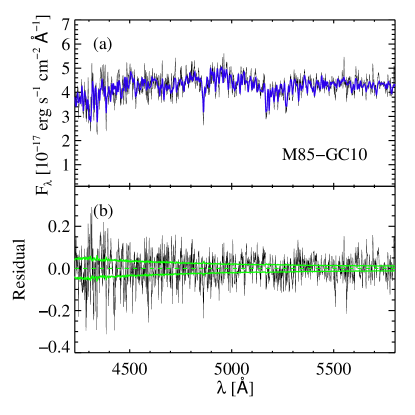
Liu et al. (2013) presented the effect of the signal-to-noise ratios of the spectra on the ULySS full spectrum fitting results. They found that ULySS fitting results are not reliable for the spectra with signal-to-noise ratios lower than 25. Therefore, we adopted a wavelength range with the signal-to-noise ratio of the spectra higher than 25 for the fitting. We used the wavelength range of about 5000–5800 Å for most target spectra. Figure 6 shows an example of the full spectrum fitting result for M85-GC10. The residuals from the best fit are comparable to the 1 error residuals on average. We ran 500 Monte Carlo simulations for each spectrum and determined the ages and [Fe/H] of the GCs by adopting the mean values of the 500 simulation results. The uncertainties of the parameters correspond to the 68% (1) confidence intervals of the simulation results. The ages and metallicities of the M85 GCs, M85-HCC1, and the M85 nucleus derived using the three methods are listed in Table 5.
| ID | Agegrid | [Fe/H] | [Fe/H] | [/Fe]grid | Age | [Fe/H] | [/Fe] | AgeULySS | [Fe/H]ULySS | |
|---|---|---|---|---|---|---|---|---|---|---|
| (Gyr) | (dex) | (dex) | (dex) | (Gyr) | (dex) | (dex) | (Gyr) | (dex) | ||
| M85-GC01 | * | |||||||||
| M85-GC02 | ||||||||||
| M85-GC03 | ||||||||||
| M85-GC04 | 5.7 | |||||||||
| M85-GC05 | * | |||||||||
| M85-GC06 | ||||||||||
| M85-GC07 | ||||||||||
| M85-GC08 | ||||||||||
| M85-GC09 | ||||||||||
| M85-GC10 | 0.28 | |||||||||
| M85-GC11 | ||||||||||
| M85-GC12 | ||||||||||
| M85-GC13 | ||||||||||
| M85-GC14 | * | |||||||||
| M85-GC15 | ||||||||||
| M85-GC16 | ||||||||||
| M85-GC17 | * | |||||||||
| M85-GC18 | ||||||||||
| M85-GC19 | ||||||||||
| M85-GC20 | ||||||||||
| M85-HCC1 | ||||||||||
| M85-Nucleus |
4.3 Comparison of Parameters
We compared the ages, metallicities, and [/Fe] derived using three different methods. There are some caveats for each method described in Sections 4.1 and 4.2. For the Lick index grid method, the ages of the GCs are only derived from the H–[MgFe]′ grid. We could not measure the ages of GC05 and GC12 because their [MgFe]′ indices are not real numbers. The dependence on H in determining the ages of GCs may be problematic because the H line strength is strongly affected by the horizontal branch morphology (Burstein et al., 1984; de Freitas Pacheco & Barbuy, 1995; Cohen et al., 2003). The blue horizontal branch stars in GCs strengthen the H line, and consequently, GCs that have a stronger blue horizontal branch morphology result in younger ages. In addition, the -element abundance is hard to distinguished at low metallicities as shown in Figure 5(b). As mentioned in Section 4.1.1, if the GCs do not fall on the grid, we cannot determine their ages and metallicities directly. In that case, we adopt the grid boundary values.
The minimization method uses more indices than the Lick index grid method, but there may be cases in which the fitting results depend heavily on only a few indices. We checked the stability of the fitting results by further excluding the Lick indices used for the fitting one by one. The fitting results for GC01 and GC05 are unstable if Mg and Fe lines are rejected. For example, the age and [Fe/H] of GC01 derived from the minimization method are 15 Gyr and –0.06 dex. However, if the Fe5015 index is excluded in the fitting process, they are derived to be 2 Gyr and +0.70 dex. This large difference caused by the exclusion of one line indicates that the fitting is unstable, not converging. In addition, the ages of five GCs (GC02, GC03, GC17, GC18, and GC20) strongly depend on the H index. For these five GCs, other Balmer lines, H and H, are excluded in the fitting process because of their low signal-to-noise ratios. The absence of Balmer lines with a large number of measured Lick indices for the fitting process of the minimization method affects minimally the derived ages, even though the Balmer lines are strong and age-sensitive lines (Proctor et al., 2004). However, for these GCs, the number of indices used in the fitting process is too small to exclude the H line. We deal with the derived parameters of these seven GCs carefully in further comparison.
These two methods based on Lick indices may give inaccurate properties because our values of the Lick indices are not calibrated to the Lick standard system. The full spectrum fitting is not affected by this calibration issue, but we cannot derive the -element abundances using the Vazdekis models in this method.
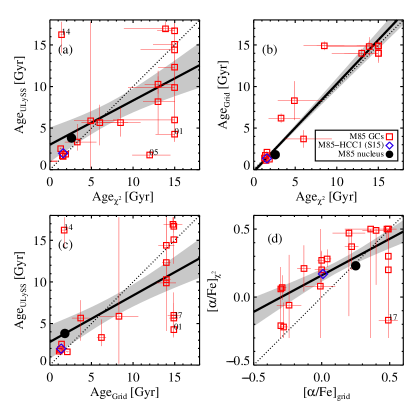
Figure 7 shows a comparison of the ages and [/Fe] obtained using different methods. The ages based on the Lick index grid method and the minimization method are consistent within uncertainties as shown in Figure 7(b). We derive a linear least-squares fit: Age(grid) = 1.0(0.1)Age() – 0.2(0.3) with RMSE = 1.9 Gyr. Figure 7(a) and (c) show a comparison of the ages obtained from the Lick indices and the full spectrum fitting. The linear least-squares fitting results are as follows: Age(ULySS) = 0.5(0.2)Age() + 3.0(2.0) with RMSE = 4.4 Gyr and Age(ULySS) = 0.6(0.2)Age(grid) + 2.9(2.1) with RMSE = 4.4 Gyr. It is noted that there are four outliers showing about 3 deviations (GC01, GC05, GC14, and GC17). Among them, the values for GC01, GC05, and GC17 are based on unstable fitting results as previously mentioned. We cannot find any possible clues to explain the other outlier, GC14. Figure 7(d) shows a comparison of the -element abundances derived from the Lick index grid method and the minimization method. We find a loose correlation between the two within uncertainties: [/Fe]() = 0.54(0.15)[/Fe](grid) + 0.16(0.04) with RMSE = 0.18 dex. The [/Fe] obtained from the minimization method are larger than those obtained from the Lick index grid method on average.
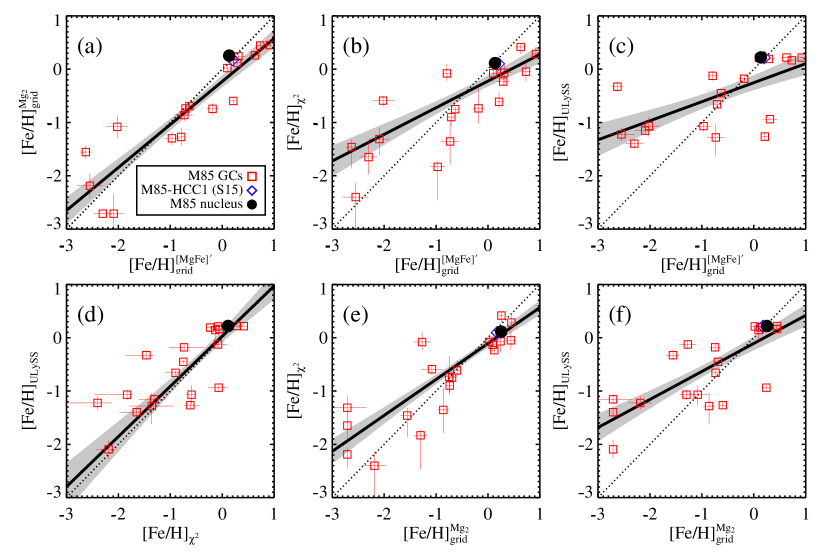
Figure 8 shows a comparison of the metallicities obtained using different methods. We calculate the iron abundance of the GCs based on the Lick indices using the relation presented by Thomas et al. (2003): [Fe/H] = [Z/H] – 0.94[/Fe]. Figure 8(a) shows that the [Fe/H] values derived from the Lick index grid method agree well. We derive a linear least-squares fit: [Fe/H](grid,Mg2) = 0.80(0.09)[Fe/H](grid,[MgFe]′) – 0.23(0.11) with RMSE = 0.40 dex. Figure 8(b) and (e) show a comparison of [Fe/H] derived from the minimization method and the grid method. We derive linear least-squares fits: [Fe/H]() = 0.50(0.10)[Fe/H](grid,[MgFe]′) – 0.22(0.11) with RMSE = 0.47 dex and [Fe/H]() = 0.67(0.09)[Fe/H](grid,Mg2) – 0.11(0.08) with RMSE = 0.41 dex. Figure 8(c) and (f) show a comparison between the [Fe/H] values derived from the full spectrum fitting and the grid method. The linear least-squares fits for these data are as follows: [Fe/H](ULySS) = 0.36(0.11)[Fe/H](grid,[MgFe]′) – 0.25(0.14) with RMSE = 0.47 dex and [Fe/H](ULySS) = 0.53(0.10)[Fe/H](grid,Mg2) – 0.11(0.13) with RMSE = 0.43 dex. The [Fe/H] values derived between the full spectrum fitting and the grid method show a big difference for metal-poor GCs ([Fe/H] –2). This difference is weakened between the [Fe/H] values from the full spectrum fitting and the minimization method.
As a result, we find that the ages and metallicities derived from the Lick indices and the full spectrum fitting follow the same trend, but there are inconsistencies for several GCs. These differences might be due to the calibration problem on the Lick indices in addition to the different stellar population models we used for the different methods. Therefore, only the results obtained from the full spectrum fitting will be considered in the following analysis.
We compare the ages and metallicities of the M85 nucleus and M85-HCC1 with those derived in previous spectroscopic studies. Fisher et al. (1996) suggested that the age of the M85 nucleus is about 3 Gyr, and Terlevich & Forbes (2002) derived the age and [Fe/H] of M85 as 1.6 Gyr and 0.44 dex. We measure the age and [Fe/H] of the M85 nucleus as 3.8 0.1 Gyr and 0.22 0.01 dex. All of the results agree that the M85 nucleus has an intermediate-age stellar population with a supersolar metallicity.
Sandoval et al. (2015) presented the values of the age, [Fe/H], and [Mg/Fe] ratio derived from the SDSS spectrum of M85-HCC1. The values of the parameters are 3.0 0.4 Gyr, –0.06 0.07 dex, and 0.05 0.13 dex, respectively. We derive the age and [Fe/H] of M85-HCC1 to be 2.0 0.1 Gyr and 0.22 dex. It is interesting that M85-HCC1 and the M85 nucleus have similar ages and metallicities, which indicates that M85-HCC1 might have formed with the recent star formation in the M85 nucleus.
4.4 Age and Metallicity Distribution of M85 GCs
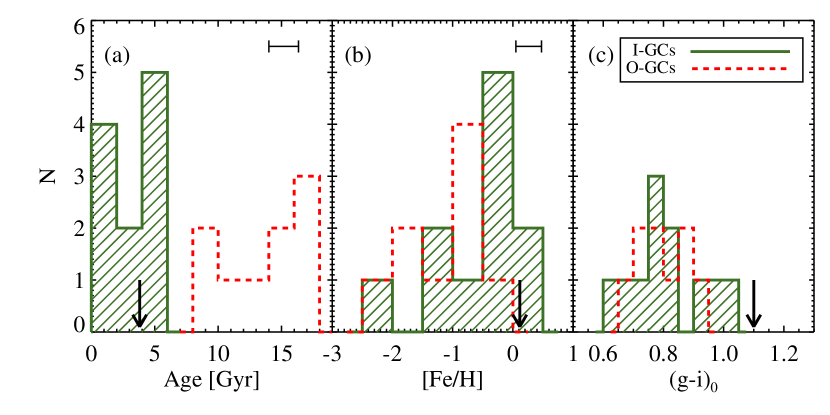
Figure 9 shows the age, [Fe/H], and color distributions of the M85 GCs confirmed in this study. We find two groups of M85 GCs based on their ages: intermediate-age GCs with ages of 8 Gyr and old GCs with ages of 8 Gyr. The number of intermediate-age and old GCs are 11 and 9, respectively. The mean age of the intermediate-age GCs is about 3.7 Gyr with a standard deviation of 1.9 Gyr, which is similar to the stellar age of the M85 nucleus ( 3.8 Gyr) within 1 uncertainty, while the old GCs have a mean age of 13.3 Gyr with a standard deviation of 3.3 Gyr. The intermediate-age GCs have, on average, higher H indices than the old GCs (see Figure 5(a)). However, there are some outliers. Three of the intermediate-age GCs (M85-GC01, M85-GC17, and M85-GC19) are located below the 15 Gyr line of the grid. The ages of these three GCs are estimated to be as old as 15 Gyr from the Lick index grid method. On the other hand, there is one old GC, M85-GC14, which has a H index as high as that of the intermediate-age GCs. The estimated age of M85-GC14 based on the Lick index grid method is 1.7 Gyr.
The fraction of intermediate-age GCs among all observed GCs is 55 17%, which is much smaller than the value, 85%, estimated by Trancho et al. (2014). Trancho et al. (2014) detected a 1.8 Gyr old GC population based on optical and near-infrared photometry. The difference may be caused by the difference of the observation coverage between the two studies. We cover an area seven times larger than that in Trancho et al. (2014), but analyze a sample three times smaller than the sample in Trancho et al. (2014).
We investigate the [Fe/H] and color distributions of two GC subpopulations separately. The intermediate-age GCs have a solar metallicity with a large dispersion, [Fe/H] = –0.26 0.62. The mean metallicity of the old GCs is [Fe/H] = –1.02 0.56, which is lower than that of the intermediate-age GCs. The intermediate-age and old GCs have a color range of and , respectively, with similar mean colors of (see Figure 9(c)). The two GC subpopulations do not show a significant difference in their color distributions. Old GCs in massive early-type galaxies generally show a color bimodality, and the GC populations are divided into blue and red subpopulations with a division color criterion of = 0.8 (Durrell et al., 2014). We expect that the intermediate-age GCs could weaken the color bimodality of the old GCs. However, there is no clear color bimodality for the old GCs in M85, and the mean color of the intermediate-age GCs is redder than that of the old GCs. This could be due to small number statistics, so it needs to be confirmed with larger samples in the future. In addition, we do not find any clear radial gradients of age or metallicity for the GCs in M85.
5 Kinematics of the GC system in M85

The mean radial velocity of the M85 GCs measured in this study is km s-1, which is similar to that of the M85 nucleus ( = 756 8 km s-1). Considering this and the Gaussian distribution of their radial velocity, we conclude that these GCs are indeed gravitationally bound to M85. We estimate the radial velocity dispersion and its error for the M85 GCs, km s-1. It is slightly higher than the velocity dispersion of the M85 nucleus ( km s-1).
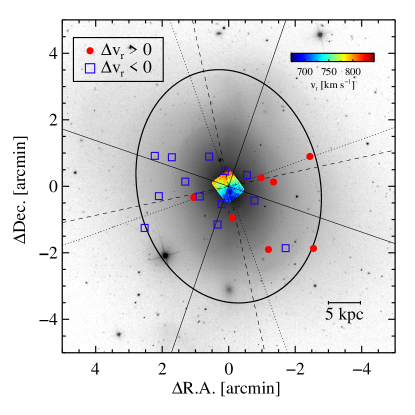
Figure 10 shows the spatial distribution of the GCs confirmed in this study. The GCs with radial velocity higher than that of the M85 nucleus are mostly located in the western region, while the others are in the eastern region. This spatial segregation of the GCs shows that the GC system of M85 is rotating. It is notable that the rotation signature is clear, although M85 is nearly a face-on galaxy.
The GCs rotating around a given axis in the plane of the sky have radial velocities depending sinusoidally on the position angle. We measure the rotation amplitude and position angle of the rotation axis for the M85 GC system by fitting the data to the following function,
where is the systemic velocity of the GC system, is the rotation amplitude, and is the orientation of the rotation axis. The systemic velocity of the M85 GC system is assumed to be the radial velocity of the M85 nucleus, = 756 km s-1. Figure 11(a) shows the radial velocities of the 20 GCs as a function of position angle with their best-fit rotation curves. The rotation amplitude and orientation of the rotation axis of the entire GC system are derived to be km s-1 and . In addition, we correct the projected rotation amplitude by considering the inclination of M85. The factor for the inclination angle is about 0.63, assuming that M85 has equal major and minor axes. Therefore, the rotation amplitude corrected for inclination, which is about 1.6 times larger than the projected one, is km s-1. The position angle of the photometric major axis is about 12 (Krajnović et al., 2011), which shows a significant deviation from that of the orientation of the rotation axis. We will discuss the difference between these position angles in Section 6.1.
In addition to the entire GC system, we measure the rotation parameters for the two GC subgroups considered above, the intermediate-age ( 8 Gyr) and old ( 8 Gyr) GC systems. Figure 11(b) and (c) show the rotation curves for 11 intermediate-age GCs and 9 old GCs, respectively. The rotation amplitudes of the intermediate-age and old GCs are km s-1 and 127 km s-1, respectively, corresponding to km s-1 and 202 km s-1 after inclination correction. The orientations of the rotation axes of the intermediate-age and old GCs are and 243, respectively, which are also consistent with those of the entire GC system within uncertainties.
We derive the rotation-corrected radial velocities of the M85 GCs by applying the rotation curve of the entire GC system. The rotation-corrected radial velocity dispersion of the M85 GC system is km s-1, which is much smaller than the rotation amplitude of the M85 GC system. The rotation parameter of the M85 GC system is = 1.47. We derive the values of = 2.41 and 1.14 for the intermediate-age GC and old GC systems, respectively. Thus, the intermediate-age GC system shows a stronger rotation than the old GC system. We caution, however, that the kinematics of these GC subpopulations can be biased toward showing rotational support due to small number statistics. Toloba et al. (2016) investigated the kinematics of the GC system in six Virgo early-type dwarf galaxies. They performed simulations to explore the effects of sample size on the kinematic analysis and found that the rotation amplitudes could be overestimated if the number of sample GCs is smaller than 20. Therefore, the strong rotation features of the intermediate-age and old GC systems in M85 found in this study need be checked with a larger sample size.
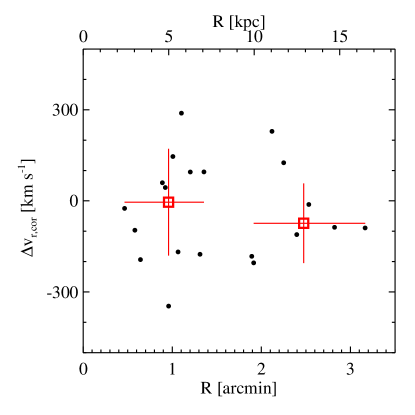
Figure 12 shows the rotation-corrected radial velocities of the M85 GCs relative to the radial velocity of the M85 nucleus as a function of galactocentric distance from M85. The rotation-corrected radial velocity dispersions of the GCs in the inner and outer regions are km s-1 and km s-1, respectively. The radial velocity dispersion of the GC system appears to decrease slightly as the galactocentric distance increases, but more samples are needed to reduce its uncertainties. The kinematics of the GC systems in M85 are summarized in Table 6. We estimate the uncertainties of the kinematic parameters corresponding to 68% (1) confidence intervals. We construct 1000 artificial data sets from the actual data for a numerical bootstrap procedure, estimate the kinematic parameters, and identify the 16th and 84th percentiles from the sorted results. The uncertainties are defined as the differences between these values and the parameters computed by the actual data.
| Sample | / | |||||||
|---|---|---|---|---|---|---|---|---|
| (km s-1) | (km s-1) | (km s-1) | (km s-1) | (deg) | (km s-1) | |||
| All GCs | 20 | 724 | 202 | 148 | 235 | 161 | 160 | 1.47 |
| Intermediate-age GCs | 11 | 716 | 217 | 221 | 351 | 137 | 145 | 2.41 |
| Old GCs | 9 | 734 | 182 | 127 | 202 | 243 | 177 | 1.14 |
6 Discussion
6.1 Kinematical Decoupling Between GCs and Stellar Light
The comparison of the kinematics of the GC system with those of the stellar light in their host galaxies provides useful clues to understand the formation and evolution history of their host galaxies. Li et al. (2015) investigated the kinematics of the central stellar light and the GC system in the outer region of four early-type Virgo Cluster galaxies. They found that two of them, VCC 2000 (NGC 4660) and VCC 685 (NGC 4350), show a clear misalignment of the kinematic position angles of the stars and GC system. These differences imply that the formation process of stars in the galaxy center is different from that of the GC system in the outer regions. The outer region of galaxies preserves merging or accretion signatures related to its formation history.
We compare the kinematics of the M85 GC system in this study with those of the stellar light in M85 investigated by ATLAS3D (Cappellari et al., 2011; Emsellem et al., 2011; Krajnović et al., 2011). Krajnović et al. (2011) presented the kinematic maps of 260 early-type galaxies with a field of view of 33 41 arcsec2 using the SAURON integral-field spectrograph and measured the kinematic misalignment angles. According to their analysis, the central stellar light of M85 is dominated by ordered rotation and shows a smooth variation of the kinematic orientation within 10. The kinematic position angle of the M85 stellar light derived by Krajnović et al. (2011) is PAkin = 195 48. The kinematic position angle is defined as the angle from the north to the maximum receding part of the velocity map. Thus, the stars in the central region of M85 rotate approximately about the photometric minor axis. Krajnović et al. (2011) estimated the photometric position angle of M85 at a much larger scale, . The photometric position angle of M85 is PAphot = 123 110. This value is not much different from that of the kinematic position angle. Therefore, the kinematic misalignment of stellar light in the central region of M85 is not significant.
The kinematic position angle of the M85 GCs is derived to be PAGCkin = 251 (see §5 and Figure 11). This value is 232 larger than the kinematic position angle of stellar light in M85. Thus, the GC system shows a rotation axis clearly distinct from that of the stars (see Figure 10). The decoupled rotation features of the stars and GC systems in M85 implies that M85 has undergone merging events.
6.2 The Merging History of M85
| Galaxy | Typea | / | Ref.e | |||||||
|---|---|---|---|---|---|---|---|---|---|---|
| (Mpc) | (mag) | (km s-1) | (km s-1) | (km s-1) | (km s-1) | |||||
| M85 | S0pec | 17.9 | –25.1 | 756 | 20 | 724 | 235 | 160 | 1.47 | This study |
| M60 | E2 | 17.3 | –25.5 | 1056 | 121 | 1073 | 141 | 217 | 0.65 | 1 |
| 366 | 95 | 229 | 0.41 | 9 | ||||||
| M87 | cDpec | 17.2 | –25.4 | 1307 | 276 | 1333 | 172 | 399 | 0.43 | 1(2) |
| 737 | 1336 | 0.07 | 10 | |||||||
| M49 | E2 | 17.1 | –25.8 | 997 | 263 | 973 | 54 | 321 | 0.17 | 1(3) |
| NGC 1399 | E1pec | 20.0 | –25.2 | 1442 | 435 | 1442 | 31 | 326 | 0.10 | 1(4) |
| NGC 5128 | S0pec | 4.2 | –24.2 | 541 | 210 | 536 | 30 | 129 | 0.23 | 1(5) |
| NGC 4636 | E0-1 | 14.7 | –24.4 | 928 | 172 | 899 | 29 | 207 | 0.14 | 1(6) |
| 238 | 949 | 37 | 226 | 0.16 | 7 | |||||
| NGC 1407 | E0 | 26.8 | –25.4 | 1784 | 172 | 1753 | 86 | 247 | 0.35 | 7(8) |
| 369 | 1774 | 0.17 | 10 | |||||||
| NGC 821 | E6 | 23.4 | –24.0 | 1718 | 61 | 1750 | 0.11 | 10 | ||
| NGC 1400 | SA0 | 26.8 | –23.8 | 558 | 72 | 612 | 0.07 | 10 | ||
| NGC 2768 | E6 | 21.8 | –25.4 | 1353 | 109 | 1338 | 0.39 | 10 | ||
| NGC 3377 | E6 | 10.9 | –22.7 | 690 | 126 | 685 | 0.19 | 10 | ||
| NGC 4278 | E2 | 15.6 | –23.8 | 620 | 256 | 637 | 0.17 | 10 | ||
| NGC 4365 | E3 | 23.3 | –25.2 | 1243 | 269 | 1210 | 0.11 | 10 | ||
| NGC 5846 | E0 | 24.2 | –25.0 | 1712 | 195 | 1706 | 0.02 | 10 | ||
| NGC 7457 | S0 | 12.9 | –22.4 | 844 | 27 | 847 | 1.68 | 10(10+11) | ||
| NGC 3115 | S0 | 9.4 | –24.0 | 663 | 190 | 710 | 0.66 | 10 | ||
| NGC 4494 | E1 | 16.6 | –24.2 | 1344 | 117 | 1338 | 0.60 | 10 |
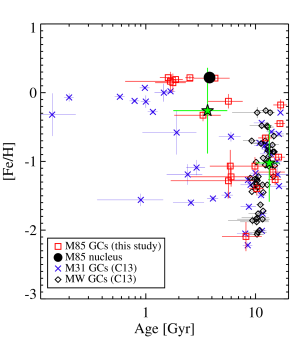
In Figure 13, we compare the ages and metallicities of the M85 GCs with those of the Milky Way GCs and M31 GCs that were derived from the full spectrum fitting with ULySS. We used the ages and metallicities of the Milky Way GCs and M31 GCs given by Cezario et al. (2013). We note that the GCs in M31 and M85 consist of not only old GCs but also intermediate-age GCs (with age 8 Gyr), while the GCs in the Milky Way Galaxy are predominantly old ( 10 Gyr). The intermediate-age GCs in M31 and M85 are, on average, more metal-rich than the old GCs in the same galaxies, which is consistent with the results for the GCs in other early-type galaxies (Puzia et al., 2005; Pierce et al., 2006a; Park et al., 2012).
The intermediate-age GCs in M85 have, on average, an age of 3.7 1.9 Gyr and [Fe/H] of –0.26 0.62 dex, while the old GCs have a lower mean metallicity ([Fe/H] = –1.02 0.56). The intermediate-age GCs comprise 55% of the observed GCs in our sample. The stars in the nucleus of M85 derived in this study have a mean age of 3.8 0.1 Gyr and a mean metallicity of [Fe/H] = 0.22 dex. The ages and metallicities of the central stars and the intermediate-age GCs are consistent within their uncertainties. The mean [Fe/H] of the intermediate-age GCs is lower than the [Fe/H] of the M85 nucleus, but the [Fe/H] distribution of the intermediate-age GCs has a peak near the [Fe/H] of the M85 nucleus with a low-metallicity tail (see Figure 9). We conclude that most of the intermediate-age GCs might have been formed during a wet merger about 4 Gyr ago, after the metal enrichment had proceeded. However, we caution that the ages and metallicities of the intermediate-age GCs in M85 cover large ranges with large estimation errors.
The GC system of M85 rotates strongly with a rotation amplitude of and a rotation parameter of 1.47. To date, the kinematics of the GC systems in dozens of early-type galaxies have been studied. Hwang et al. (2008), Lee et al. (2010), and Pota et al. (2013) presented the kinematics of the GC systems in early-type galaxies, using a method similar to the one used in this study. Table 7 compares the kinematic parameters of the M85 GC system with those of the GC systems in other early-type galaxies from the above references. The rotation parameters, , of most early-type galaxies in the previous studies are smaller than 1, while NGC 7457 shows a much larger value, (Pota et al., 2013). NGC 7457 (S0) is the faintest among the galaxies in Table 7. Chomiuk et al. (2008) investigated the GCs in NGC 7457 using HST photometry and Keck/LRIS spectroscopy, and found that there is an intermediate-age population with an age of 2–2.5 Gyr. Based on body simulations of galaxy mergers given by Bournaud et al. (2005), Pota et al. (2013) pointed out that the strong rotation feature of NGC 7457 GCs could be explained by uneven-mass galaxy mergers with a 1:10 mass ratio.
M85 ( mag) is much brighter (much more massive) than NGC 7457 ( mag). According to the hierarchical galaxy formation scenario, M85 must have undergone many more merging events than NGC 7457. In consequence, it is expected that the GC system in M85 may be a pressure-supported system now. However, the GC system of M85 shows the largest rotation parameter among the early-type galaxies in Table 7. This indicates that M85 may have experienced an off-center major merging event which injected the angular momentum to the GC system. Bekki et al. (2005) presented N-body simulation results for the kinematic properties of GC systems after major dry mergers of Milky-Way-like progenitors. They assumed that the GC systems of the progenitors are only supported by velocity dispersion. They found that the GC systems show significant amounts of rotation after a major dry merger with a mass ratio of 1. However, the values of the rotation parameters are smaller than 1 (0.2–0.3), and they are much smaller than the value for M85 GCs. Thus, further simulation studies are needed to understand the peculiar rotation of the M85 GC system.
7 Summary
We present a spectroscopic study of GC candidates in the field of the merger remnant galaxy M85 using Gemini-N/GMOS. We also included the hypercompact cluster M85-HCC1 (Sandoval et al., 2015) and the M85 nucleus for comparison. Our main results are summarized as follows.
-
•
Of the 21 GC candidates, 20 are found to be members of M85 based on their radial velocities. One GC candidate turns out to be a foreground star.
-
•
Eleven of the GCs are in an intermediate-age population, and the rest are in an old one ( 8 Gyr). The mean ages of the old and intermediate-age GCs are 13.3 3.3 Gyr and 3.7 1.9 Gyr, respectively. The mean metallicity of the intermediate-age GCs ([Fe/H] = –0.26) is higher than that of the old GCs ([Fe/H] = –1.02).
-
•
The mean radial velocity of the GCs in M85 is = 724 km s-1, which is similar to the systemic velocity of M85. The GC system shows a considerable rotation feature, the amplitude of which is = 235 km s-1. The rotation axis of the GC system shows little agreement with that of the central stellar light (), indicating that the galaxy is the product of merging.
-
•
The rotation-corrected radial velocity dispersion of the GC system of M85 is km s-1. The rotation parameter of the GC system is derived to be 1.47, which is one of the largest among known early-type galaxies.
Our results suggest that M85 experienced a wet merger about 4 Gyr ago, resulting in the formation of an intermediate-age nucleus. Most of the intermediate-age GCs might have been formed at the same epoch when the stars in the nucleus were formed. The strong rotation features of the GC system in M85 can be explained by an off-center major merger.
References
- Alam et al. (2015) Alam, S., Albareti, F. D., Allende Prieto, C., et al. 2015, ApJS, 219, 12
- Bekki et al. (2005) Bekki, K., Beasley, M. A., Brodie, J. P., & Forbes, D. A. 2005, MNRAS, 363, 1211
- Binggeli et al. (1985) Binggeli, B., Sandage, A., & Tammann, G. A. 1985, AJ, 90, 1681
- Bournaud et al. (2005) Bournaud, F., Jog, C. J., & Combes, F. 2005, A&A, 437, 69
- Burstein (1979) Burstein, D. 1979, ApJS, 41, 435
- Burstein et al. (1984) Burstein, D., Faber, S. M., Gaskell, C. M., & Krumm, N. 1984, ApJ, 287, 586
- Cappellari et al. (2011) Cappellari, M., Emsellem, E., Krajnović, D., et al. 2011, MNRAS, 413, 813
- Cezario et al. (2013) Cezario, E., Coelho, P. R. T., Alves-Brito, A., Forbes, D. A., & Brodie, J. P. 2013, A&A, 549, A60
- Chomiuk et al. (2008) Chomiuk, L., Strader, J., & Brodie, J. P. 2008, AJ, 136, 234
- Cohen et al. (2003) Cohen, J. G., Blakeslee, J. P., & Côté, P. 2003, ApJ, 592, 866
- Côté et al. (2001) Côté, P., McLaughlin, D. E., Hanes, D. A., et al. 2001, ApJ, 559, 828
- Côté et al. (2003) Côté, P., McLaughlin, D. E., Cohen, J. G., & Blakeslee, J. P. 2003, ApJ, 591, 850
- Côté et al. (2004) Côté, P., Blakeslee, J. P., Ferrarese, L., et al. 2004, ApJS, 153, 223
- de Freitas Pacheco & Barbuy (1995) de Freitas Pacheco, J. A., & Barbuy, B. 1995, A&A, 302, 718
- de Vaucouleurs et al. (1991) de Vaucouleurs, G., de Vaucouleurs, A., Corwin, H. G., Jr., et al. 1991, Third Reference Catalogue of Bright Galaxies, Vol. I: Explanations and References, Vol. II: Data for galaxies Between 0h and 12h, Vol. III: Data for galaxies Between 12h and 24h. (New York, USA: Springer)
- Durrell et al. (2014) Durrell, P. R., Côté, P., Peng, E. W., et al. 2014, ApJ, 794, 103
- Emsellem et al. (2007) Emsellem, E., Cappellari, M., Krajnović, D., et al. 2007, MNRAS, 379, 401
- Emsellem et al. (2011) Emsellem, E., Cappellari, M., Krajnović, D., et al. 2011, MNRAS, 414, 888
- Ferrarese et al. (2006) Ferrarese, L., Côté, P., Jordán, A., et al. 2006, ApJS, 164, 334
- Fisher et al. (1996) Fisher, D., Franx, M., & Illingworth, G. 1996, ApJ, 459, 110
- Gavazzi et al. (2004) Gavazzi, G., Zaccardo, A., Sanvito, G., Boselli, A., & Bonfanti, C. 2004, A&A, 417, 499
- Graves & Schiavon (2008) Graves, G. J., & Schiavon, R. P. 2008, ApJS, 177, 446-464
- Hui et al. (1995) Hui, X., Ford, H. C., Freeman, K. C., & Dopita, M. A. 1995, ApJ, 449, 592
- Hwang et al. (2008) Hwang, H. S., Lee, M. G., Park, H. S., et al. 2008, ApJ, 674, 869
- Jordán et al. (2009) Jordán, A., Peng, E. W., Blakeslee, J. P., et al. 2009, ApJS, 180, 54
- Koleva et al. (2008) Koleva, M., Prugniel, P., Ocvirk, P., Le Borgne, D., & Soubiran, C. 2008, MNRAS, 385, 1998
- Koleva et al. (2009) Koleva, M., Prugniel, P., Bouchard, A., & Wu, Y. 2009, A&A, 501, 1269
- Kormendy et al. (2009) Kormendy, J., Fisher, D. B., Cornell, M. E., & Bender, R. 2009, ApJS, 182, 216
- Krajnović et al. (2011) Krajnović, D., Emsellem, E., Cappellari, M., et al. 2011, MNRAS, 414, 2923
- Lauer et al. (2005) Lauer, T. R., Faber, S. M., Gebhardt, K., et al. 2005, AJ, 129, 2138
- Lee et al. (2008) Lee, M. G., Park, H. S., Kim, E., et al. 2008, ApJ, 682, 135-154
- Lee et al. (2010) Lee, M. G., Park, H. S., Hwang, H. S., et al. 2010, ApJ, 709, 1083
- Li et al. (2015) Li, B., Peng, E. W., Zhang, H.-x., et al. 2015, ApJ, 806, 133
- Lim et al. (2017) Lim, S., Peng, E. W., Duc, P.-A., et al. 2017, ApJ, 835, 123
- Liu et al. (2013) Liu, G.-C., Lu, Y.-J., Chen, X.-L., Du, W., & Zhao, Y.-H. 2013, Research in Astronomy and Astrophysics, 13, 1025-1040
- McDermid et al. (2004) McDermid, R., Emsellem, E., Cappellari, M., et al. 2004, Astronomische Nachrichten, 325, 100
- Mei et al. (2007) Mei, S., Blakeslee, J. P., Côté, P., et al. 2007, ApJ, 655, 144
- Park et al. (2010) Park, H. S., Lee, M. G., Hwang, H. S., et al. 2010, ApJ, 709, 377
- Park et al. (2012) Park, H. S., Lee, M. G., Hwang, H. S., et al. 2012, ApJ, 759, 116
- Peng et al. (2004) Peng, E. W., Ford, H. C., & Freeman, K. C. 2004, ApJ, 602, 705
- Peng et al. (2006) Peng, E. W., Jordán, A., Côté, P., et al. 2006, ApJ, 639, 95
- Pierce et al. (2006a) Pierce, M., Beasley, M. A., Forbes, D. A., et al. 2006a, MNRAS, 366, 1253
- Pierce et al. (2006b) Pierce, M., Bridges, T., Forbes, D. A., et al. 2006b, MNRAS, 368, 325
- Pota et al. (2013) Pota, V., Forbes, D. A., Romanowsky, A. J., et al. 2013, MNRAS, 428, 389
- Pota et al. (2015) Pota, V., Brodie, J. P., Bridges, T., et al. 2015, MNRAS, 450, 1962
- Proctor et al. (2004) Proctor, R. N., Forbes, D. A., & Beasley, M. A. 2004, MNRAS, 355, 1327
- Puzia et al. (2005) Puzia, T. H., Kissler-Patig, M., Thomas, D., et al. 2005, A&A, 439, 997
- Richtler et al. (2004) Richtler, T., Dirsch, B., Gebhardt, K., et al. 2004, AJ, 127, 2094
- Romanowsky et al. (2009) Romanowsky, A. J., Strader, J., Spitler, L. R., et al. 2009, AJ, 137, 4956
- Sánchez-Blázquez et al. (2006) Sánchez-Blázquez, P., Peletier, R. F., Jiménez-Vicente, J., et al. 2006, MNRAS, 371, 703
- Sandoval et al. (2015) Sandoval, M. A., Vo, R. P., Romanowsky, A. J., et al. 2015, ApJ, 808, L32
- Schiavon (2007) Schiavon, R. P. 2007, ApJS, 171, 146
- Schlafly & Finkbeiner (2011) Schlafly, E. F., & Finkbeiner, D. P. 2011, ApJ, 737, 103
- Schuberth et al. (2006) Schuberth, Y., Richtler, T., Dirsch, B., et al. 2006, A&A, 459, 391
- Schweizer & Seitzer (1988) Schweizer, F., & Seitzer, P. 1988, ApJ, 328, 88
- Schweizer et al. (1990) Schweizer, F., Seitzer, P., Faber, S. M., et al. 1990, ApJ, 364, L33
- Schweizer & Seitzer (1992) Schweizer, F., & Seitzer, P. 1992, AJ, 104, 1039
- Sharina et al. (2010) Sharina, M. E., Chandar, R., Puzia, T. H., Goudfrooij, P., & Davoust, E. 2010, MNRAS, 405, 839
- Skrutskie et al. (2006) Skrutskie, M. F., Cutri, R. M., Stiening, R., et al. 2006, AJ, 131, 1163
- Smith et al. (2000) Smith, R. J., Lucey, J. R., Hudson, M. J., Schlegel, D. J., & Davies, R. L. 2000, MNRAS, 313, 469
- Spolaor et al. (2008) Spolaor, M., Forbes, D. A., Hau, G. K. T., Proctor, R. N., & Brough, S. 2008, MNRAS, 385, 667
- Terlevich & Forbes (2002) Terlevich, A. I., & Forbes, D. A. 2002, MNRAS, 330, 547
- Thomas et al. (2003) Thomas, D., Maraston, C., & Bender, R. 2003, MNRAS, 339, 897
- Thomas et al. (2011) Thomas, D., Maraston, C., & Johansson, J. 2011, MNRAS, 412, 2183
- Toloba et al. (2016) Toloba, E., Li, B., Guhathakurta, P., et al. 2016, ApJ, 822, 51
- Tonry & Davis (1979) Tonry, J., & Davis, M. 1979, AJ, 84, 1511
- Tonry et al. (2001) Tonry, J. L., Dressler, A., Blakeslee, J. P., et al. 2001, ApJ, 546, 681
- Trager et al. (1998) Trager, S. C., Worthey, G., Faber, S. M., Burstein, D., & González, J. J. 1998, ApJS, 116, 1
- Trancho et al. (2014) Trancho, G., Miller, B. W., Schweizer, F., Burdett, D. P., & Palamara, D. 2014, ApJ, 790, 122
- Vazdekis et al. (2010) Vazdekis, A., Sánchez-Blázquez, P., Falcón-Barroso, J., et al. 2010, MNRAS, 404, 1639
- Worthey et al. (1994) Worthey, G., Faber, S. M., Gonzalez, J. J., & Burstein, D. 1994, ApJS, 94, 687
- Worthey & Ottaviani (1997) Worthey, G., & Ottaviani, D. L. 1997, ApJS, 111, 377