Structural, Vibrational and Electronic Properties of
Single Layer Hexagonal Crystals of Groups IV and V
Abstract
Using first-principles density functional theory calculations, we investigate a family of stable two-dimensional crystals with chemical formula , where and belong to groups IV and V, respectively ( = C, Si, Ge, Sn, Pb; = N, P, As, Sb, Bi). Two structural symmetries of hexagonal lattices and are shown to be dynamically stable, named as - and -phases correspondingly. Both phases have similar cohesive energies, and the -phase is found to be energetically favorable for structures except CP, CAs, CSb and CBi, for which the -phase is favored. The effects of spin-orbit coupling and Hartree-Fock corrections to exchange-correlation are included to elucidate the electronic structures. All structures are semiconductors except CBi and PbN, which have metallic character. SiBi, GeBi and SnBi have direct band gaps, whereas the remaining semiconductor structures have indirect band gaps. All structures have quartic dispersion in their valence bands, some of which make the valence band maximum and resemble a Mexican hat shape. SnAs and PbAs have purely quartic valence band edges, i.e. , a property reported for the first time. The predicted materials are candidates for a variety of applications. Owing to their wide band gaps, CP, SiN, SiP, SiAs, GeN, GeP can find their applications in optoelectronics. The relative band positions qualify a number of the structures as suitable for water splitting, where CN and SiAs are favorable at all pH values. Structures with quartic band edges are expected to be efficient for thermoelectric applications.
pacs:
31.15.A-,71.20.-b,63.22.-mI Introduction
Successful exfoliation of graphene in 2004 aroused intensive research interest towards prospective two-dimensional (2D) monolayers possibly having novel electronic, structural, optical and thermoelectric properties Novoselov et al. (2004). Subsequently, synthesis of graphene analogs belonging to the same column of the periodic table, silicene, germanene and stanene (monolayers of silicon, germanium and tin, respectively) emphasized the significance of monoelemental single layer materials and their diverse fields of application Balendhran et al. (2015); Wang et al. (2016a); Cahangirov et al. (2009); Ezawa (2015). There also exist theoretical predictions and experimental realizations of stable 2D honeycomb lattices of group-V elements (pnictogens), namely nitrogene, phosphorene, arsenene, antimonene and bismuthene. Lee et al. (2015); Kadioglu et al. (2017); Zhang et al. (2018); Liu et al. (2014a); Qiao et al. (2014); Li et al. (2014a); Pizzi et al. (2016); Madhushankar et al. (2017); Ji et al. ; Zhang et al.
Besides group-IV and group-V monolayers, theoretical and experimental studies also concentrated on the other possibly stable compounds belonging to the cross columns of the periodic table, such as single layers of group-III Demirci et al. (2017); Guo et al. (2017) and group-IV monochalcogenides Hu and Dong (2016); Li et al. (2018), V-IV-III-VI Lin et al. (2017) as well as I-III-VI2 Nagatani et al. (2015) compounds and their diverse fields of application. Among these, molecular electronicsGao et al. (2013); Wang et al. (2014), energy conversion and storage devices such as photoelectrochemical water splitting cells Chowdhury et al. (2017); Lin et al. (2017) and solar cells Zhao et al. (2018), gas sensors Late et al. (2012), photon-counting detectors in ultraviolet-visible region Liu et al. (2014b); Hu et al. (2013), and second harmonic generation (SHG) Hu and Huang (2017) are some of the most topical examples.
| FIC | ||||||||||||
|---|---|---|---|---|---|---|---|---|---|---|---|---|
| () | (Å) | (Å) | (Å) | (deg) | (deg) | (eV) | (eV) | (eV) | (eV/atom) | (e-) | (%) | |
| CN | 2.38 | 1.63 | 2.65 | 1.46 | 110.35 | 3.71 (K-M) | 5.14 (K-M) | 3.71 | 6.16 | |||
| CP111Have lower total energies in () symmetry. Also see Table 2 for structural properties of the marked compounds in space group. | 2.90 | 1.55 | 3.29 | 1.88 | 117.50 | 1.82 (K) | 2.74 (-K) | 1.81 | 5.35 | |||
| CAs111Have lower total energies in () symmetry. Also see Table 2 for structural properties of the marked compounds in space group. | 3.11 | 1.53 | 3.46 | 2.04 | 118.27 | 1.21 (-K) | 1.95 (-K) | 1.12 | 4.79 | |||
| CSb111Have lower total energies in () symmetry. Also see Table 2 for structural properties of the marked compounds in space group. | 3.41 | 1.53 | 3.70 | 2.25 | 118.97 | 0.28 (-K) | 0.85 (-K) | 0.13 | 4.42 | |||
| CBi111Have lower total energies in () symmetry. Also see Table 2 for structural properties of the marked compounds in space group. | 3.60 | 1.49 | 3.80 | 2.38 | 119.09 | Metallic | Metallic | Metallic | 4.13 | |||
| SiN | 2.90 | 2.43 | 3.54 | 1.76 | 108.40 | 1.74 (K-M) | 2.73 (K-M) | 1.74 | 5.59 | |||
| SiP | 3.53 | 2.37 | 4.41 | 2.28 | 116.50 | 1.52 (K-M) | 2.22 (K-M) | 1.51 | 4.19 | |||
| SiAs | 3.70 | 2.36 | 4.57 | 2.40 | 117.38 | 1.63 (-M) | 2.27 (-M) | 1.54 | 3.85 | |||
| SiSb | 4.02 | 2.36 | 4.82 | 2.62 | 117.92 | 1.18 (-M) | 1.76 (-M) | 0.99 | 3.50 | |||
| SiBi | 4.17 | 2.35 | 4.92 | 2.73 | 118.07 | 0.64 () | 1.15 () | 0.27 | 3.31 | |||
| GeN | 3.10 | 2.57 | 3.90 | 1.91 | 110.40 | 1.17 (K-) | 2.25 (K-) | 1.17 | 4.28 | |||
| GeP | 3.66 | 2.51 | 4.65 | 2.37 | 116.91 | 1.35 (K-M) | 2.05 (K-M) | 1.34 | 3.60 | |||
| GeAs | 3.82 | 2.50 | 4.80 | 2.49 | 117.54 | 1.20 (-M) | 1.81 (-M) | 1.08 | 3.36 | |||
| GeSb | 4.12 | 2.50 | 5.01 | 2.69 | 117.84 | 0.65 (-M) | 1.15 (-M) | 0.43 | 3.12 | |||
| GeBi | 4.26 | 2.49 | 5.09 | 2.78 | 117.85 | 0.22 () | 0.67 () | Metallic | 2.98 | |||
| SnN | 3.42 | 2.97 | 4.44 | 2.11 | 110.30 | 0.12 (K-) | 0.89 (K-) | 0.13 | 3.78 | |||
| SnP | 3.95 | 2.89 | 5.22 | 2.56 | 117.05 | 1.29 (K-M) | 1.91 (K-M) | 1.28 | 3.28 | |||
| SnAs | 4.09 | 2.88 | 5.37 | 2.67 | 117.74 | 1.14 () | 1.72 (-M) | 1.05 | 3.10 | |||
| SnSb | 4.39 | 2.87 | 5.58 | 2.87 | 118.13 | 0.80 (-M) | 1.28 (-M) | 0.54 | 2.89 | |||
| SnBi | 4.51 | 2.86 | 5.66 | 2.96 | 118.26 | 0.48 () | 0.92 () | Metallic | 2.78 | |||
| PbN | 3.63 | 3.17 | 4.78 | 2.24 | 110.92 | Metallic | Metallic | Metallic | 3.04 | |||
| PbP | 4.12 | 3.06 | 5.49 | 2.67 | 117.08 | 0.40 (K-M) | 0.76 (K-M) | 0.38 | 2.83 | |||
| PbAs | 4.25 | 3.05 | 5.62 | 2.77 | 117.66 | 0.36 (K-M) | 0.67 (-M) | 0.25 | 2.72 | |||
| PbSb | 4.53 | 3.03 | 5.82 | 2.96 | 118.01 | 0.28 (-M) | 0.51 (-M) | Metallic | 2.58 | |||
| PbBi | 4.63 | 3.02 | 5.88 | 3.03 | 118.10 | 0.06 () | 0.35 (-M) | 0.01 | 2.50 |
Single-layer group-III monochalcogenides in hexagonal structure Demirci et al. (2017); Zhuang and Hennig (2013); Sundarraj et al. (2014); Sun et al. (2017); Ayadi et al. (2017) gathered attention also for their intriguing thermoelectric properties. Interestingly, theoretical and experimental results demonstrate that they present so-called Mexican-hat shape dispersion at their valence band maximum (VBM), and consequently gives rise to Van-Hove singularity Van Hove (1953) in the density of states (DOS) near VBM Li et al. (2014b); Cao et al. (2015a); Aziza et al. (2017); Chen et al. (2018). This phenomena gives rise to a large temperature-independent thermopower along with linear-temperature resistivity Sevinçli (2017); Newns et al. (1994). Theoretical figure of merit () of these systems are found to increase dramatically upon reducing to monolayers from their corresponding bulk counterparts Wickramaratne et al. (2015). Given the electronic configuration of 2D “naturally bilayer” group III-VI materials and their stabilities in hexagonal symmetry with honeycomb structure Demirci et al. (2017), group IV-V monolayers generated tremendous research interest with the purpose of disclosing their potential authentic characteristics. Barreteau et al. (2016); Zhang et al. (2016); Wadsten (1967); Cheng et al. (2018); Wu and Huang (2016); Zhou et al. (2018); Shojaei and Kang (2016); Huang et al. (2015); Wang et al. (2016b); Singh et al. (2018); Matta et al. ; Xu et al. ; Miao et al. ; Ashton et al. (2016)
Recent synthesis of two-dimensional SiP, SiAs, GeP, and GeAs binary compounds Barreteau et al. (2016) invoked significant amount of research interest in both experimental and theoretical aspects Zhang et al. (2016). Bulk GeAs and SiAs are known to crystallize in a layered structure with monoclinic space group of Wadsten (1967); Cheng et al. (2018), having theoretical band gaps of 0.41 eV and 0.93 eV, respectively Wu and Huang (2016). However, given the relatively low interlayer formation energies, GeAs and SiAs monolayers are manageable to be fabricated by mechanical cleaving from their bulk structures. Upon cleavage, monolayers of GeAs and SiAs in C2/m space group are calculated to have band gaps of 2.06 eV (direct) and 2.50 eV (indirect), respectively, using HSE06 functional Zhou et al. (2018). Furthermore, application of in-plane strain converts GeAs to a direct-gap material, while this is not true for the GeP monolayer, therefore rendering the latter is impractical for optoelectronic applications Shojaei and Kang (2016).
Various stoichiometries of SixPy (y/x 1) monolayers are studied by Huang et al. Huang et al. (2015) in order to explore prospective stable or metastable structures of this promising compound by the use of global structural search algorithm and first-principles calculations. SiP monolayer in space group is found to be more stable than its bulk structure. Also, structural, electronic, vibrational, optical and thermoelectric properties of CP monolayers in different crystal structures are studied theoretically. Wang et al. (2016b); Singh et al. (2018) It is very recently reported that type monolayers, consisting of two sublayers ( C, Si, Ge, Sn and Sb) are thermally and kinetically unstable due to imaginary frequencies in their phonon spectra, which can be stabilized by surface functionalization. Also 16 of the type monolayer structures of groups IV-V with symmetry were studied theoretically by Ashton et al. Ashton et al. (2016)
Despite fruitful outcomes of group IV-V compounds both experimentally and theoretically, the literature lacks a complete and exhaustive database for the mentioned set of compounds, especially the hexagonal lattices. Based on this fact, we systematically studied the structural, electronic and vibrational properties of experimentally or otherwise available 2D group IV-V binary monolayers (IV = C, Si, Ge, Sn, Pb; V = N, P, As, Sb, Bi) with hexagonal crystal structure belonging to the space groups of and . We find that both phases are dynamically stable and have small differences in their cohesive energies. Hence polymorphism is quite likely to take place. Nevertheless the electronic structures of - and -phases are quite similar due to their structural similarity. We find a wide range of band gap values between 0.35 to 5.14 eV, which point to various possible applications for these structures such as water splitting. The quartic band dispersions are of particular importance, since they may give rise to interesting magnetic transitions Sevinçli (2017); Cao et al. (2015b) and thermoelectric performance. Sevinçli (2017); Wickramaratne et al. (2015)
II Computational Details
First-principles calculations were performed using VASP package Kresse and Furthmüller (1996) in density functional theory (DFT) framework by employing projector augmented wave (PAW) method and Perdew-Burke-Ernzerhof (PBE) exchange correlation (XC) functionals. Perdew et al. (1996) Hybrid Heyd-Scuseria-Ernzerhorf (HSE06) functionals are also employed to predict the energy band gaps correctly. Heyd et al. (2003) The systems were first subjected to various tests regarding the choice of plane-wave cut-off energies, and k-point grids in order to obtain optimum values for efficient calculations. The energy cut-off for plane-wave basis sets were taken to be ranging from 160 eV (PbBi) to 500 eV (CSb). Brillouin zone (BZ) is sampled by ( ranging between 7 to 14) k-point grids in the Monkhorst-Pack scheme Monkhorst and Pack (1976) according to the test results. A sufficiently large vacuum spacing of at least 15 Å in the direction orthogonal to the monolayer was utilized to hinder the interaction between periodically repeated images. The convergence criteria for electronic and ionic relaxations are set to eV and eV/Å, respectively.
Electronic band structures are calculated using both PBE and hybrid HSE06 functionals. HSE06, whose correlation part is only contributed from the PBE, mixes 25% of the exact Hartree-Fock exchange and 75% PBE exchange. The influence of the spin-orbit coupling (SOC) is also taken into consideration by employing the fully unconstrained noncollinear magnetic approach Hobbs et al. (2000). Force constants are calculated using Density Functional Perturbation Theory (DFPT) Baroni et al. (2001) with super cell sizes ranging from to . k-point grids are chosen to be . Phonopy package Togo and Tanaka (2015) was used to compute the phonon dispersion relations and the thermal properties such as heat capacity (). Effective charge analysis is performed by using Bader’s method. This method utilizes zero-flux surfaces in order to partition the charge distribution Bader (1998); Henkelman et al. (2006). Cohesive energies () per atom is defined by the following expression,
| (1) |
where and are energies of neutral atoms belonging to groups IV and V, respectively; and is the total energy of the system calculated by the conjugate gradient (CG) geometry optimization method. is the number of group IV(V) atoms in the unit cell, two atoms from each. Fractional ionic character (FIC) is calculated as , where and are the electronegativities of the constituent atoms.
| FIC | ||||||||||||
|---|---|---|---|---|---|---|---|---|---|---|---|---|
| () | () | () | () | (deg) | (deg) | (eV) | (eV) | (eV) | (eV/atom) | (e-) | % | |
| -CP | 2.90 | 1.53 | 3.67 | 1.89 | 117.35 | 1.91 (-M) | 2.77 (-M) | 1.89 | 5.37 | 1.86 | 3.2 | |
| -CAs | 3.12 | 1.50 | 3.86 | 2.04 | 118.02 | 1.14 (-M) | 1.84 (-M) | 1.08 | 4.82 | 0.38 | 3.4 | |
| -CSb | 3.42 | 1.49 | 4.16 | 2.25 | 118.77 | Metallic | 0.43 (-M) | Metallic | 4.45 | 1.11 | 6.1 | |
| -CBi | 3.60 | 1.44 | 4.33 | 2.39 | 119.63 | Metallic | Metallic | Metallic | 4.18 | 0.62 | 6.8 |
III Results and Discussion
III.1 Structural Properties
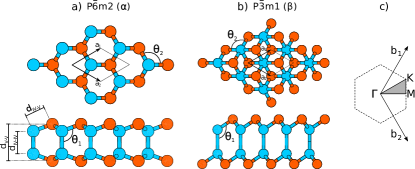
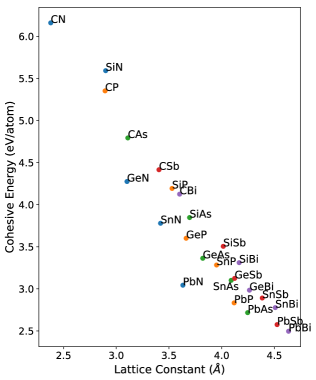
We consider - and -phases, which belong to and space groups, respectively. -SiP was recently shown to be stable. Huang et al. (2015) Also, group IV-V elements are expected to have structurally equivalent compounds with group III-VI monolayers, which have stable -phases. Demirci et al. (2017) Both - and -phases have stoichiometry (=C, Si, Ge, Sn, Pb; =N, P, As, Sb, Bi) with stacking. Stable geometric structures of the -phase is illustrated in Figure 1(a), which is found to be more stable than the -phase for most of the structures. Structural and electronic properties of the -phase compounds are detailed in Table 1. Lattice constants, bond lengths (, , ), and bond angles were obtained by performing structural optimization. Lattice constant tends to increase steadily for the compounds within the same group IV. Bond lengths and also follow the same trend. In contrast, follows an opposite trend compared to the other distances. It tends to decrease within the group IV. Bond angle , on the other hand, increase in the same group IV compounds, however very slightly. It is also noteworthy that only the nitrides possess a relatively narrower . This can be explained by the highest electronegativity that nitrogen bears in its group. In comparison, decreases within the same group IV, which is also associated with the increasing trend that the bond length demonstrates. Figure 2 shows the variation of the cohesive energy with the lattice constant. has a tendency to decrease systematically as one goes down in group IV. High cohesive energy is a result of the stability of the material, which implies that nitrides are more stable than its neighbors in group IV.
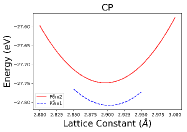
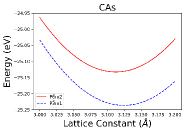
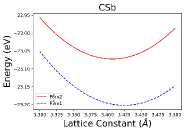
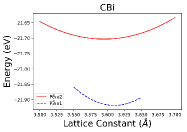
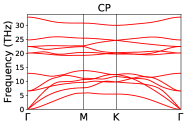
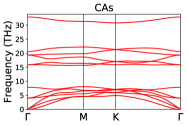
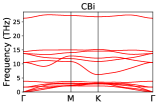
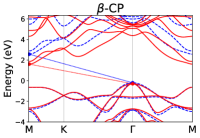
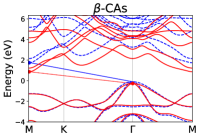
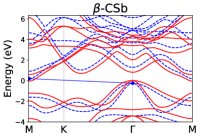
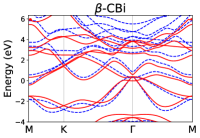
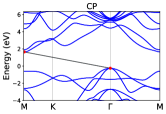
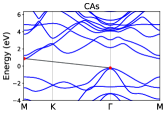
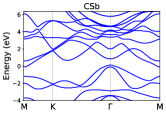
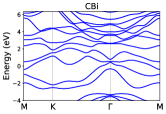
The -phase compounds are energetically more favorable for four structures, CP, CAs, CSb, and CBi. In Figure 3(a), the total energies of - and -phases of these compounds are plotted as functions of lattice constants, where it is observed that the minimum energies for the -phases are 25 to 110 meV/atom lower than their -phase counterparts. (see Figure 3(a)) The phonon dispersions in Figure 3(b) show that the -phases are dynamically stable. An interesting point is the charge transfer characteristics of these compounds. As summarized in Table 1, the only group of compounds that represent charge transfer from group-IV to group-V elements are the compounds whose energies are lower in symmetry. This is probably due to Coulombic repulsion between group-V atoms. Table 2 presents structural and electronic parameters of the mentioned compounds. Lattice constants, bond lengths and , and additionally bond angle follow an increasing trend when going down in the same group. Bond length and bond angle represents an inverse behavior. When compared, cohesive energies are at most 1.21% larger than that of their counterparts.
 |
 |
 |
 |
 |
|
 |
 |
 |
 |
 |
|
 |
 |
 |
 |
 |
|
 |
 |
 |
 |
 |
|
 |
 |
 |
 |
 |
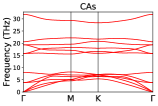
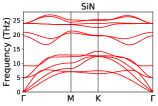
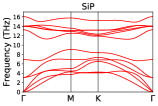
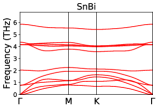
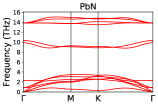
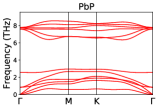
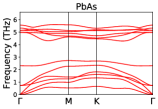
III.2 Vibrational Properties
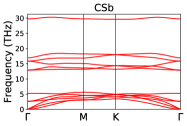
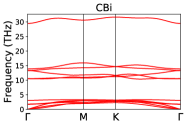
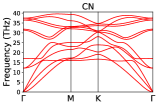
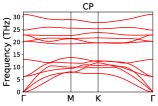
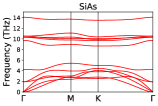
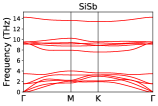
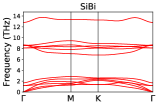
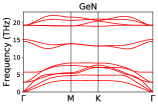
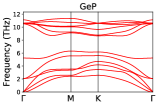
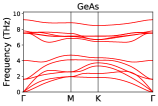
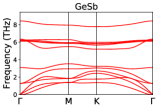
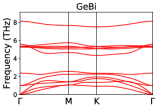
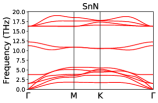
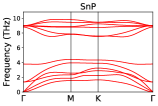
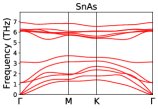
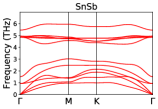
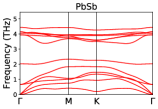
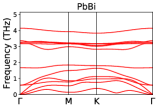
Phonon dispersion relation is an important benchmark to evaluate the stability of the systems at hand. As seen in Figure 4, all of the -compounds demonstrate positive phonon frequencies around point, linear in-plane (longitudinal acoustic and transverse acoustic) and quadratic out-of-plane (ZA) modes. This implies that the monolayers of group IV-V are dynamically stable. In a recent study, -phases of compounds including carbon and nitrogen were reported to be highly unstable. Ashton et al. (2016). However, our computations with increased accuracy and denser k-point grids reveal that all these mentioned structures are dynamically stable, that is no negative frequency is associated with these materials. Having said that, it is a well-known fact that acoustic modes may bear minuscule imaginary frequencies around the -point, and this may be stemming from numerical inaccuracies rather than the real instability of the system. On the other hand, -PbN and -SnP have negative frequencies in their out-of-plane acoustic modes around the K point, when the electronic temperature is low. One way to remedy this is to employ an enhanced smearing during DFPT computations. The Fermi-Dirac smearing function dictates the electronic temperature and occupation probability of the electronic states Mermin (1965). An increase in the smearing value corresponds to an increase in the effective temperature, therefore stability in higher temperatures can be examined. We have performed calculations for different smearing values () and found that eV (0.1 eV) is required for PbN (SnP) for obtaining real and positive vibrational frequencies. We note that such onset of imaginary frequencies at the boundaries of the Brillouin zone could also be related to charge density wave formation at low temperatures. Singh et al. (2017)
The maximum phonon frequency of a given structure () decreases steadily with increasing atomic masses in the unit cell, as expected. However detailed analysis of the force constant matrices and phonon dispersions show that the decrease is not only due to the increased mass, but also because of weaker inter atomic force constants. Assuming the masses to be those of heavier atoms in the group always overestimates . Phonon band gaps also show a particular trend. As a rule of thumb the phonon band gaps increase with increasing mass difference between the constituent elements in the unit cell, and it decreases with increasing atomic masses as the overall spectrum is squeezed. Both reduced of and wider phonon band gaps decrease phonon thermal transport. Therefore those structures can be expected to have better thermoelectric performances.
Vibrational heat capacities at constant volume are calculated using
| (2) |
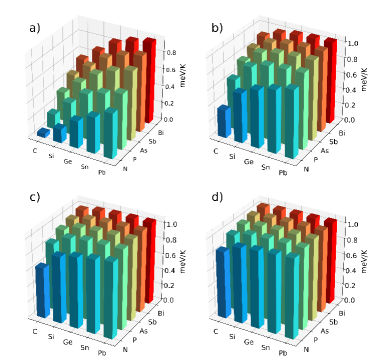
where is the phonon density of states and with and . In Figure 5, the vibrational heat capacities are plotted at K, 300 K, 500 K, and 800 K. The structures with slower sound velocities, i.e. those with heavier elements, have larger phonon DOS at lower frequencies. At lower temperatures, the function in Equation 2 filters out higher frequency modes. Therefore they have considerably higher heat capacities at 100 K, compared to e.g. carbon and nitrogen compounds. At higher temperatures, changes slowly with respect to and it is approximately equal to 1 in the entire phonon spectrum. Therefore of all structures reach to at high temperatures, 12 being the number of modes per unit cell. Heat capacities are also calculated for the -phases and almost identical numerical results have been obtained with the corresponding -phases, as expected.
III.3 Electronic Properties
 |
 |
 |
 |
 |
 |
 |
 |
 |
 |
 |
 |
 |
 |
 |
 |
 |
 |
 |
 |
 |
 |
 |
 |
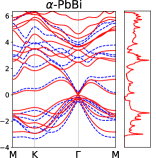 |
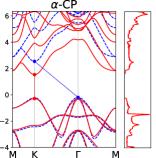
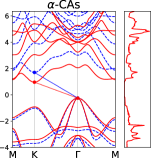
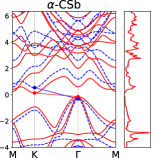
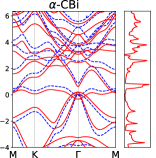
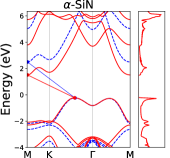
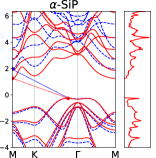
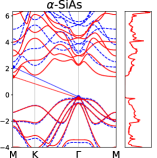
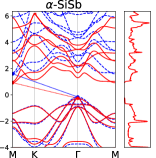
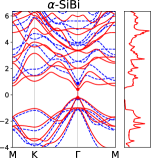
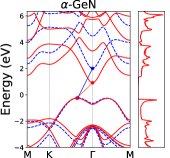
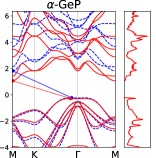
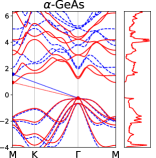
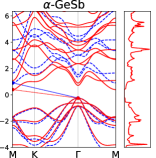
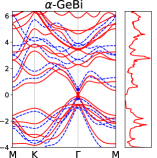
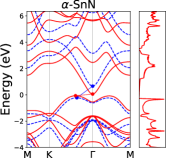
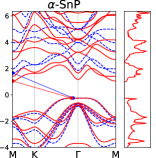
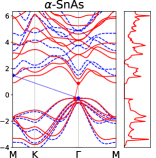
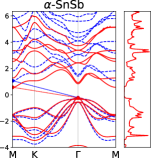
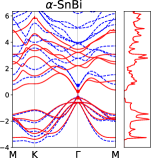
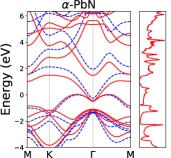
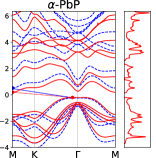
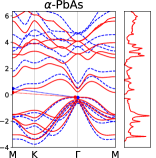
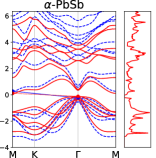
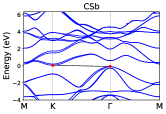
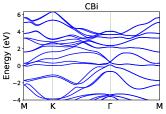
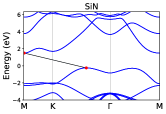
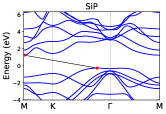
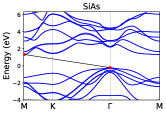
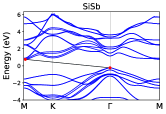
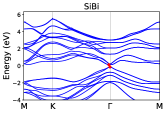
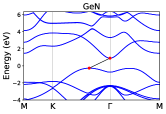
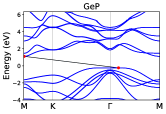
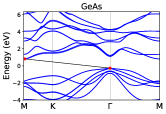
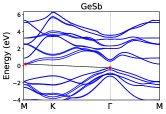
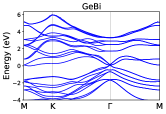
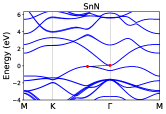
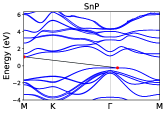
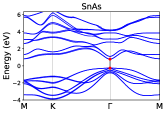
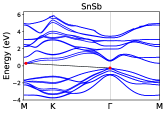
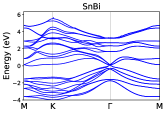
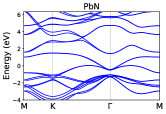
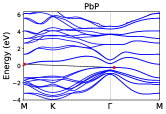
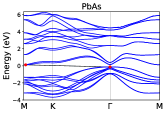
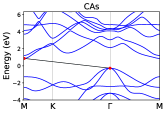
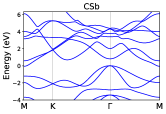
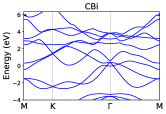
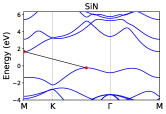
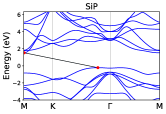
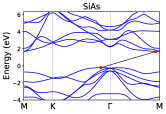
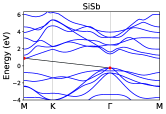
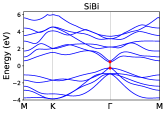
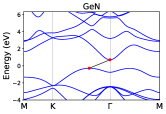
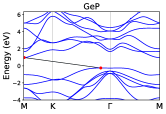
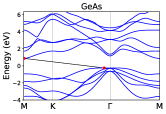
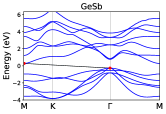
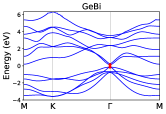
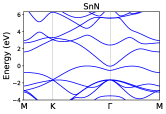
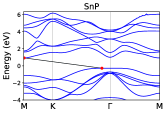
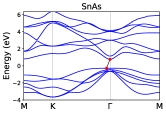
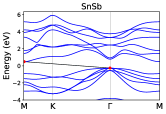
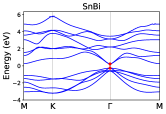
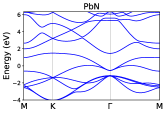
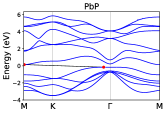
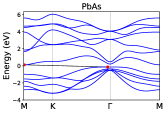
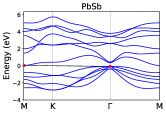
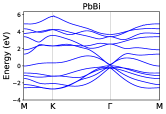
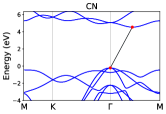
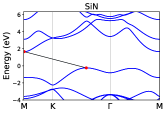
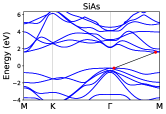
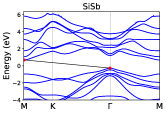
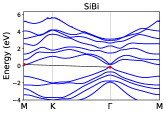
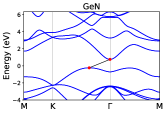
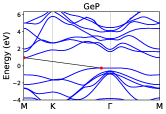
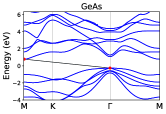
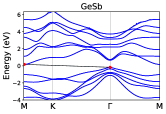
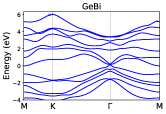
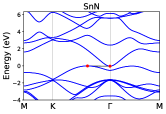
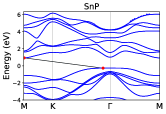
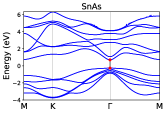
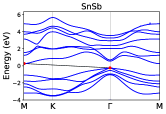
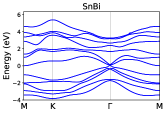
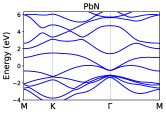
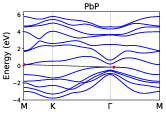
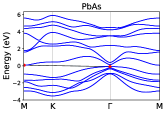
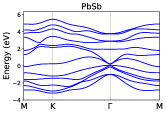
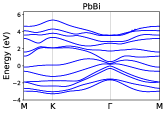
The electronic structure is studied using GGA-PBE with and without including spin-orbit interactions and also using hybrid HSE06 functionals. The electronic band diagrams of -phase structures as obtained from PBE and HSE06 functionals are presented in Figure 6. The band diagrams of the -phase compounds are plotted in Figure 7.
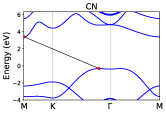
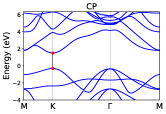
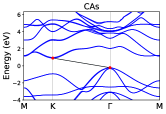
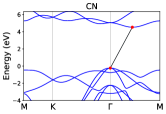
We first discuss the -phase. Total of six compounds; CP (K), SiBi (), GeBi() SnAs (), SnBi (), PbBi() have direct band gaps according to PBE. The k-points at which the direct transitions takes place are indicated in parenthesis. The band gap characteristics of the mentioned compounds, except CP, are identical with HSE06. Ten of the -phase structures (CN, SiN, SiP, GeN, GeP, SnN, SnP, SnAs, PbP, PbAs) have their valence band edges between and K. In fact, the valence band maxima (VBM) for these structures resemble a Mexican hat. In other words, the VBM occurs not on a single point and it is highly degenerate. The Mexican hat shaped quartic dispersions are discussed separately below.
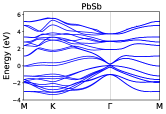
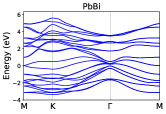
HSE06 calculations yield band structures, which are of the same character with the PBE results. The band gap values are increased by up to 1.43 eV (-CN) with HSE06. (see Figure 6) Some of the studied materials are wide band gap semiconductors, having band gaps greater than 2 eV. These are CP (2.737 eV), SiN (2.732 eV), SiP (2.223 eV), SiAs (2.267 eV), GeN (2.247 eV), GeP (2.047 eV). These materials can be used for UV-light applications such as, UV-light detection and photodetectors Monroy et al. (2003). A recent study reports nitrides and phosphides of Si, Ge and Sn in hexagonal symmetry Lin et al. (2017). Electronic structures of these compounds are quite consistent with our results, except those of antimony. While the difference in band gaps of Si and Ge nitrides and phosphides are at most 12%, this is almost 50% for SnN. Given that the structural parameters such as the lattice constants and layer heights of the mentioned compounds are very comparable with our findings, the difference in electronic structure may arise from the parameters of the HSE06 functional. According to Figure 6, compounds containing bismuth generally tend to have direct () band gaps ranging between 0.06 and 0.64 eV for PBE; and 0.35 to 1.15 eV for HSE06 calculations. The exception is PbBi when it comes to HSE06. In this case, the band gap points in the -M direction. Our band structure results are in agreement with those available in the literature. Ashton et al. (2016) Additionally, the effect of spin-orbit coupling (SOC) on the electronic states is also studied. Electronic band structures calculated with PBE and SOC included can be found in the Supporting Information. (see Figure S1) It is observed that direct/indirect character of interband transitions are not effected by the SOC. The predicted band gaps with SOC included () are close to those obtained from PBE without SOC. (see Table 1)
The electronic structures of the -phase compounds are also studied in detail. The layers, which make up the - and - structures are identical for both phases. The neighboring atom types are identical and the distances are almost the same up to the third nearest neighbors for type and the second nearest neighbors for type atoms. As a result, the lattice parameters and the band structures change only slightly between - and -phases. Still, there are some quantitative differences. For example, five more structures in the -phase have quartic valence band edges compared to the -phase, which make fifteen such structures in total (-CN, -SiN, -SiP, -SiAs, -GeN, -GeP, -GeAs, -SnN, -SnP, -SnAs, -PbP, -PbAs, -PbSb). The band gap values are approximately the same for - and -phases. (see Figure S2)
|
|
| CN | SiN | GeN | SnN | SiP | GeP | SnP | PbP | SnAs | PbAs | |
|---|---|---|---|---|---|---|---|---|---|---|
| (Å-1) | 0.32 | 0.57 | 0.47 | 0.47 | 0.24 | 0.18 | 0.16 | 0.11 | 0.0 | 0.0 |
| (eVÅ4) | 6.516 | 5.359 | 9.254 | 9.853 | 20.448 | 21.807 | 19.845 | 54.385 | 41.929 | 126.039 |
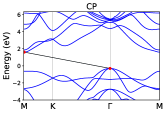
A distinctive feature of the hexagonal structures of group IV-V elements is the onset of quartic bands in their valence bands. It is well known that type lattices of groups III-VI with symmetry have quartic dispersions in their valence bands, which is also referred to as the Mexican hat dispersion. Ma et al. (2013); Zolyomi et al. (2013, 2014); Rybkovskiy et al. (2014) Of those structures, the quartic dispersions form the valence band edge for phases of BO, BS and with Ga, In, Al and S, Se, Te. Demirci et al. (2017) Quartic dispersion gives rise to a strong singularity () in the DOS, which gives rise to novel exciting properties Stauber et al. (2007) such as tunable magnetism Cao et al. (2015a) and multiferroic phase Seixas et al. (2016), namely simultaneous presence of ferromagnetism and ferroelasticity. Quartic dispersion also gives rise to a step-like change in the transmission spectrum, which is the reason for temperature independent thermopower and efficient thermoelectric transport. Wickramaratne et al. (2015); Sevinçli (2017)
It was shown for elemental lattices of group-V elements also display quartic dispersion Özcelik et al. (2015); Zhu and Tomanek (2014); Kamal and Ezawa (2015); Aktürk et al. (2015, 2016), and that the appereance of quartic bands is because of the hexagonal symmetry and that the dispersion relation can be expressed as Sevinçli (2017)
| (3) |
where is the band edge, and is the radius of the circular band maximum. This expression is obtained from a series expansion around the center of the Brillouin zone. Higher order terms (, with ), which break the circular symmetry and establish a hexagonal one, can also be included Zolyomi et al. (2013, 2014) but we limit our attention to the quartic case.
Layered hexagonal lattices of group IV-V elements also exhibit quartic dispersion as already shown in Figure 6. The valence band edges are formed by the quartic bands in 10 out of 25 structures, which are CN, SiN, GeN, SnN, SiP, GeP, SnP, PbP, SnAs and PbAs. Different from the PBE bands, the critical wave-vector shifts towards the point in SnAs and PbAs such that . That is a purely quartic dispersion, , is obtained. We obtained the values of for these structures by using the , and values as obtained from DFT calculations. (see Table 3)
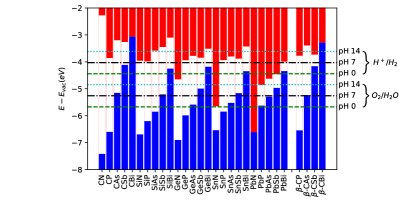
Photocatalytic water splitting Ni et al. (2007); Maeda and Domen (2010) is a promising field aiming to dissociate water to its constituents, hydrogen and oxygen solely using light. The main purpose is to use hydrogen for fuel. The absolute band edges of the material is important for hydrogen generation. Therefore, band edge positions of the studied systems are calculated by using HSE06 functional, and compared with the redox potentials of water in Figure 8. Dashed green, dashdotted black and dotted cyan lines corresponds to the absolute electrode potentials Trasatti (1986) in three different pH levels (0, 7 and 14, respectively). Given the relative band edge positions and the mentioned redox potentials of water in different pH environments; CN, CP, SiN, SiP, SiAs, GeP, SnP, and -CP are favorable in pH 0; CN, CP, SiN, SiP, SiAs, GeP, GeAs, SnP, SnAs and -CP are favorable in pH 7, lastly CN, CAs, SiAs, SiSb and -CAs are favorable in pH 14. The common compounds in all three pH conditions are CN and SiAs. However, as the band gap of CN is more than four times the required 1.23 eV of water splitting gap, which limits its efficiency. Provided its availability and abundance on earth, SnP may be an excellent candidate for this application in both acidic and neutral conditions.
III.4 Conclusion
We have presented a detailed study of group IV-V monolayers. A total of 50 structural configurations are investigated and tabulated, most of which are predicted for the first time. The small energy difference between the - and -phases ( and space groups, respectively) suggest that polymorpic structures should be expected. Two of the materials are metallic, while the rest span a wide range of energy band gap values between 0.35 to 5.14 eV. Quartic energy dispersion with a Mexican hat shape is a common feature of all structures in their valence band, which make the valence band maximum in some of the structures. -SnAs and -PbAs have purely quartic valence band edges. CN and SiAs are predicted to be useful for water splitting in terms of their relative band positions. Nonetheless SnP is an outstanding candidate regarding efficiency and environmental effects.
Acknowledgements.
We acknowledge support from Scientific and Technological Research Council of Turkey (TÜBİTAK) Grant No. 117F131.References
- Novoselov et al. (2004) K. S. Novoselov, A. K. Geim, S. V. Morozov, D. Jiang, Y. Zhang, S. V. Dubonos, I. V. Grigorieva, and A. A. Firsov, Science 306, 666 (2004).
- Balendhran et al. (2015) S. Balendhran, S. Walia, H. Nili, S. Sriram, and M. Bhaskaran, Small 11, 640 (2015).
- Wang et al. (2016a) M. Wang, L. Liu, C.-C. Liu, and Y. Yao, Physical Review B 93, 155412 (2016a).
- Cahangirov et al. (2009) S. Cahangirov, M. Topsakal, E. Aktürk, H. Şahin, and S. Ciraci, Physical Review Letters 102, 236804 (2009).
- Ezawa (2015) M. Ezawa, Journal of the Physical Society of Japan 84, 121003 (2015).
- Lee et al. (2015) J. Lee, W.-C. Tian, W.-L. Wang, and D.-X. Yao, Scientific Reports 5, 11512 (2015).
- Kadioglu et al. (2017) Y. Kadioglu, O. Uzengi Akturk, E. Akturk, and S. Ciraci, The Journal of Physical Chemistry C 121, 6329 (2017).
- Zhang et al. (2018) S. Zhang, S. Guo, Z. Chen, Y. Wang, H. Gao, J. Gómez-Herrero, P. Ares, F. Zamora, Z. Zhu, and H. Zeng, Chemical Society Reviews 47, 982 (2018).
- Liu et al. (2014a) H. Liu, A. T. Neal, Z. Zhu, Z. Luo, X. Xu, D. Tománek, and P. D. Ye, ACS Nano 8, 4033 (2014a).
- Qiao et al. (2014) J. Qiao, X. Kong, Z.-X. Hu, F. Yang, and W. Ji, Nature Communications 5, 4475 (2014).
- Li et al. (2014a) L. Li, Y. Yu, G. J. Ye, Q. Ge, X. Ou, H. Wu, D. Feng, X. H. Chen, and Y. Zhang, Nature Nanotechnology 9, 372 (2014a).
- Pizzi et al. (2016) G. Pizzi, M. Gibertini, E. Dib, N. Marzari, G. Iannaccone, and G. Fiori, Nature Communications 7 (2016).
- Madhushankar et al. (2017) B. Madhushankar, A. Kaverzin, T. Giousis, G. Potsi, D. Gournis, P. Rudolf, G. Blake, C. van der Wal, and B. van Wees, 2D Materials 4, 021009 (2017).
- (14) J. Ji, X. Song, J. Liu, Z. Yan, C. Huo, S. Zhang, M. Su, L. Liao, W. Wang, Z. Ni, Y. Hao, and H. Zeng, 7, 13352.
- (15) S. Zhang, Z. Yan, Y. Li, Z. Chen, and H. Zeng, 54, 3112.
- Demirci et al. (2017) S. Demirci, N. Avazlı, E. Durgun, and S. Cahangirov, Physical Review B 95, 115409 (2017).
- Guo et al. (2017) Y. Guo, S. Zhou, Y. Bai, and J. Zhao, The Journal of Chemical Physics 147, 104709 (2017).
- Hu and Dong (2016) T. Hu and J. Dong, Physical Chemistry Chemical Physics 18, 32514 (2016).
- Li et al. (2018) S. Li, X. Li, Z. Ren, and Q. Zhang, Journal of Materials Chemistry A 6, 2432 (2018).
- Lin et al. (2017) J.-H. Lin, H. Zhang, X.-L. Cheng, and Y. Miyamoto, Physical Review B 96, 035438 (2017).
- Nagatani et al. (2015) H. Nagatani, I. Suzuki, M. Kita, M. Tanaka, Y. Katsuya, O. Sakata, S. Miyoshi, S. Yamaguchi, and T. Omata, Inorganic Chemistry 54, 1698 (2015).
- Gao et al. (2013) M.-R. Gao, Y.-F. Xu, J. Jiang, and S.-H. Yu, Chemical Society Reviews 42, 2986 (2013).
- Wang et al. (2014) Z. Wang, K. Xu, Y. Li, X. Zhan, M. Safdar, Q. Wang, F. Wang, and J. He, ACS Nano 8, 4859 (2014).
- Chowdhury et al. (2017) C. Chowdhury, S. Karmakar, and A. Datta, The Journal of Physical Chemistry C 121, 7615 (2017).
- Zhao et al. (2018) Q. Zhao, Y. Guo, Y. Zhou, Z. Yao, Z. Ren, J. Bai, and X. L. Xu, Nanoscale 10, 3547 (2018).
- Late et al. (2012) D. J. Late, B. Liu, J. Luo, A. Yan, H. Matte, M. Grayson, C. Rao, and V. P. Dravid, Advanced Materials 24, 3549 (2012).
- Liu et al. (2014b) F. Liu, H. Shimotani, H. Shang, T. Kanagasekaran, V. Zolyomi, N. Drummond, V. I. Fal’ko, and K. Tanigaki, ACS Nano 8, 752 (2014b).
- Hu et al. (2013) P. Hu, L. Wang, M. Yoon, J. Zhang, W. Feng, X. Wang, Z. Wen, J. C. Idrobo, Y. Miyamoto, D. B. Geohegan, et al., Nano Letters 13, 1649 (2013).
- Hu and Huang (2017) L. Hu and X. Huang, RSC Advances 7, 55034 (2017).
- Zhuang and Hennig (2013) H. L. Zhuang and R. G. Hennig, Chemistry of Materials 25, 3232 (2013).
- Sundarraj et al. (2014) P. Sundarraj, D. Maity, S. S. Roy, and R. A. Taylor, RSC Advances 4, 46860 (2014).
- Sun et al. (2017) H. Sun, Z. Wang, and Y. Wang, AIP Advances 7, 095120 (2017).
- Ayadi et al. (2017) T. Ayadi, L. Debbichi, M. Said, and S. Lebègue, The Journal of Chemical Physics 147, 114701 (2017).
- Van Hove (1953) L. Van Hove, Phys. Rev. 89, 1189 (1953).
- Li et al. (2014b) X. Li, M.-W. Lin, A. A. Puretzky, J. C. Idrobo, C. Ma, M. Chi, M. Yoon, C. M. Rouleau, I. I. Kravchenko, D. B. Geohegan, et al., Scientific Reports 4, 5497 (2014b).
- Cao et al. (2015a) T. Cao, Z. Li, and S. G. Louie, Physical Review Letters 114, 236602 (2015a).
- Aziza et al. (2017) Z. B. Aziza, D. Pierucci, H. Henck, M. G. Silly, C. David, M. Yoon, F. Sirotti, K. Xiao, M. Eddrief, J.-C. Girard, et al., Physical Review B 96, 035407 (2017).
- Chen et al. (2018) M.-W. Chen, H. Kim, D. Ovchinnikov, A. Kuc, T. Heine, O. Renault, and A. Kis, npj 2D Materials and Applications 2, 2 (2018).
- Sevinçli (2017) H. Sevinçli, Nano Letters 17, 2589 (2017).
- Newns et al. (1994) D. Newns, C. Tsuei, R. Huebener, P. Van Bentum, P. Pattnaik, and C. Chi, Physical Review Letters 73, 1695 (1994).
- Wickramaratne et al. (2015) D. Wickramaratne, F. Zahid, and R. K. Lake, Journal of Applied Physics 118, 075101 (2015).
- Barreteau et al. (2016) C. Barreteau, B. Michon, C. Besnard, and E. Giannini, Journal of Crystal Growth 443, 75 (2016).
- Zhang et al. (2016) S. Zhang, S. Guo, Y. Huang, Z. Zhu, B. Cai, M. Xie, W. Zhou, and H. Zeng, 2D Materials 4, 015030 (2016).
- Wadsten (1967) T. Wadsten, Acta Chemica Scandinavica 21, 593 (1967).
- Cheng et al. (2018) A.-Q. Cheng, Z. He, J. Zhao, H. Zeng, and R.-S. Chen, ACS Applied Materials & Interfaces 10, 5133 (2018).
- Wu and Huang (2016) P. Wu and M. Huang, Physica Status Solidi (b) 253, 862 (2016).
- Zhou et al. (2018) L. Zhou, Y. Guo, and J. Zhao, Physica E: Low-dimensional Systems and Nanostructures 95, 149 (2018).
- Shojaei and Kang (2016) F. Shojaei and H. S. Kang, The Journal of Physical Chemistry C 120, 23842 (2016).
- Huang et al. (2015) B. Huang, H. L. Zhuang, M. Yoon, B. G. Sumpter, and S.-H. Wei, Physical Review B 91, 121401 (2015).
- Wang et al. (2016b) G. Wang, R. Pandey, and S. P. Karna, Nanoscale 8, 8819 (2016b).
- Singh et al. (2018) D. Singh, S. Kansara, S. K. Gupta, and Y. Sonvane, Journal of Materials Science 53, 8314 (2018).
- (52) S. K. Matta, C. Zhang, Y. Jiao, A. O’Mullane, and A. Du, 9, 1247.
- (53) C. Xu, M. Zhu, J. Zhang, W. Wang, and Y. Yan, 150, 314.
- (54) M.-s. Miao, J. Botana, E. Zurek, T. Hu, J. Liu, and W. Yang, 28, 1994.
- Ashton et al. (2016) M. Ashton, S. B. Sinnott, and R. G. Hennig, Applied Physics Letters 109, 192103 (2016).
- Cao et al. (2015b) T. Cao, Z. Li, and S. G. Louie, Physical Review Letters 114, 236602 (2015b).
- Kresse and Furthmüller (1996) G. Kresse and J. Furthmüller, Physical Review B 54, 11169 (1996).
- Perdew et al. (1996) J. P. Perdew, K. Burke, and M. Ernzerhof, Physical Review Letters 77, 3865 (1996).
- Heyd et al. (2003) J. Heyd, G. E. Scuseria, and M. Ernzerhof, The Journal of Chemical Physics 118, 8207 (2003).
- Monkhorst and Pack (1976) H. J. Monkhorst and J. D. Pack, Phys. Rev. B 13, 5188 (1976).
- Hobbs et al. (2000) D. Hobbs, G. Kresse, and J. Hafner, Physical Review B 62, 11556 (2000).
- Baroni et al. (2001) S. Baroni, S. de Gironcoli, A. Dal Corso, and P. Giannozzi, Rev. Mod. Phys. 73, 515 (2001).
- Togo and Tanaka (2015) A. Togo and I. Tanaka, Scripta Materialia 108, 1 (2015).
- Bader (1998) R. Bader, Canadian Journal of Chemistry 76, 973 (1998).
- Henkelman et al. (2006) G. Henkelman, A. Arnaldsson, and H. Jónsson, Computational Materials Science 36, 354 (2006).
- Mermin (1965) N. D. Mermin, Physical Review 137, A1441 (1965).
- Singh et al. (2017) B. Singh, C.-H. Hsu, W.-F. Tsai, V. M. Pereira, and H. Lin, Phys. Rev. B 95, 245136 (2017).
- Monroy et al. (2003) E. Monroy, F. Omnès, and F. Calle, Semiconductor Science and Technology 18, R33 (2003).
- Ma et al. (2013) Y. Ma, Y. Dai, M. Guo, L. Yu, and B. Huang, Physical Chemistry Chemical Physics 15, 7098 (2013).
- Zolyomi et al. (2013) V. Zolyomi, N. D. Drummond, and V. I. Fal’ko, Physical Review B 87, 195403 (2013).
- Zolyomi et al. (2014) V. Zolyomi, N. D. Drummond, and V. I. Fal’ko, Physical Review B 89, 205416 (2014).
- Rybkovskiy et al. (2014) D. V. Rybkovskiy, A. V. Osadchy, and E. D. Obraztsova, Physical Review B 90, 235302 (2014).
- Stauber et al. (2007) T. Stauber, N. M. R. Peres, F. Guinea, and A. H. Castro Neto, Physical Review B 75 (2007).
- Seixas et al. (2016) L. Seixas, A. Rodin, A. Carvalho, and A. Castro Neto, Physical Review Letters 116, 206803 (2016).
- Özcelik et al. (2015) V. O. Özcelik, O. Ü. Aktürk, E. Durgun, and S. Ciraci, Physical Review B 92, 125420 (2015).
- Zhu and Tomanek (2014) Z. Zhu and D. Tomanek, Physical Review Letters 112, 176802 (2014).
- Kamal and Ezawa (2015) C. Kamal and M. Ezawa, Physical Review B 91, 085423 (2015).
- Aktürk et al. (2015) O. Ü. Aktürk, V. O. Özçelik, and S. Ciraci, Physical Review B 91, 235446 (2015).
- Aktürk et al. (2016) E. Aktürk, O. Ü. Aktürk, and S. Ciraci, Physical Review B 94, 014115 (2016).
- Ni et al. (2007) M. Ni, M. K. Leung, D. Y. Leung, and K. Sumathy, Renewable and Sustainable Energy Reviews 11, 401 (2007).
- Maeda and Domen (2010) K. Maeda and K. Domen, The Journal of Physical Chemistry Letters 1, 2655 (2010).
- Trasatti (1986) S. Trasatti, Pure and Applied Chemistry 58, 955 (1986).
Supplemental Material
Structural, Vibrational and Electronic Properties of
Single Layer Hexagonal Crystals of Groups IV and V
Here we present further details regarding the electronic structures of - and -phases. In Figure S1 the band structures including the SOC are shown. In Figure S2 the electronic band diagrams obtained from PBE are shown for -phase compounds. The effect of SOC on the band structures of the -phases are included in Figure S3. The features in the band structures are discussed in the main text.
|
|
|
|
|
|
|
|
|
|
|

|
|
|
|