Isochrone fitting in the Gaia era. II. Distances, ages and masses from UniDAM using Gaia DR2 data.
Abstract
We present estimates of distances, ages and masses for over 3.5 million stars. These estimates are derived from the combination of spectrophotometric data and Gaia DR2 parallaxes. For that, we used the previously published Unified tool to estimate Distances, Ages, and Masses (UniDAM).
1 Introduction
In Mints & Hekker (2018) we presented an update of the Unified tool to estimate Distances, Ages, and Masses (UniDAM111UniDAM source code is available at https://github.com/minzastro/unidam.) (Mints & Hekker, 2017), which allowed for the use of parallax data in isochrone fitting. Recent release of Gaia DR2 (Gaia Collaboration et al., 2016, 2018) allowed us to produce a new catalogue of distance, ages and masses for over 3,5 million stars. We were also able to test the predictions for distance and age uncertainties described in Mints & Hekker (2018).
As compared to Mints & Hekker (2018) our sample was extended with the second data release from GALAH (Buder et al., 2018), that contains parameters for nearly 350,000 stars. Our sample is summarized in the Table 1 below.
| Survey | Input catalog size | Estimates without parallaxes | Estimates with Gaia DR2 parallaxes |
|---|---|---|---|
| APOGEE (DR14) | 157,322 | 149,599 | 139,253 |
| Gaia-ESO (DR2) | 6,376 | 5,964 | 5,140 |
| GALAH (DR1) | 342,682 | 335,783 | 321,836 |
| GCS | 13,565 | 12,987 | 8,079 |
| LAMOST (DR3) | 3,036,870 | 2,957,410 | 2,607,581 |
| LAMOST_CANNON* | 444,784 | 436,617 | 406,870 |
| LAMOST GAC (DR2)* | 366,173 | 354,409 | 321,194 |
| LAMOST GAC VB (DR2)* | 1,063,950 | 1,033,650 | 927,972 |
| RAVE (DR5) | 491,349 | 451,587 | 347,741 |
| RAVE_on* | 440,913 | 427,009 | 362,405 |
| SEGUE | 235,595 | 202,162 | 108,471 |
| TESS-HERMES (DR1) | 15,872 | 15,657 | 14,669 |
| Total | 4,249,195 | 4,106,571 | 3,567,434 |
2 Results and discussion
We publish results of UniDAM with Gaia DR2 parallaxes on http://www2.mps.mpg.de/homes/mints/unidam.html.
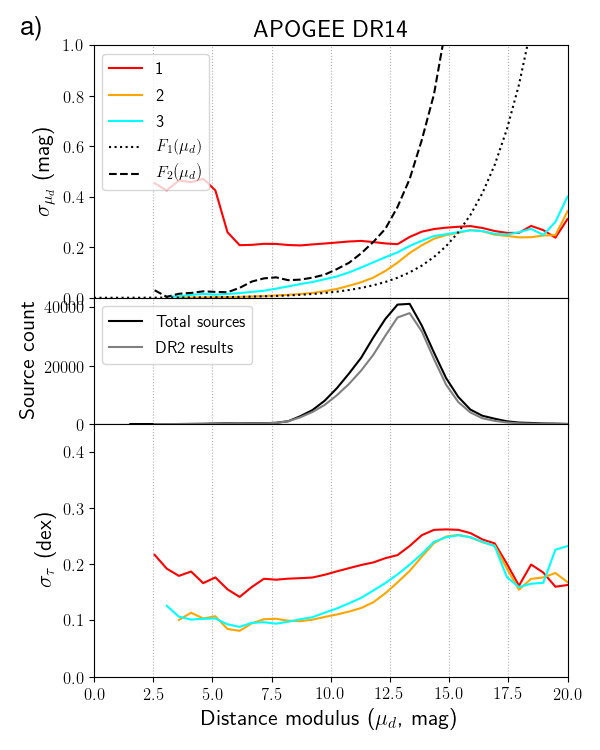
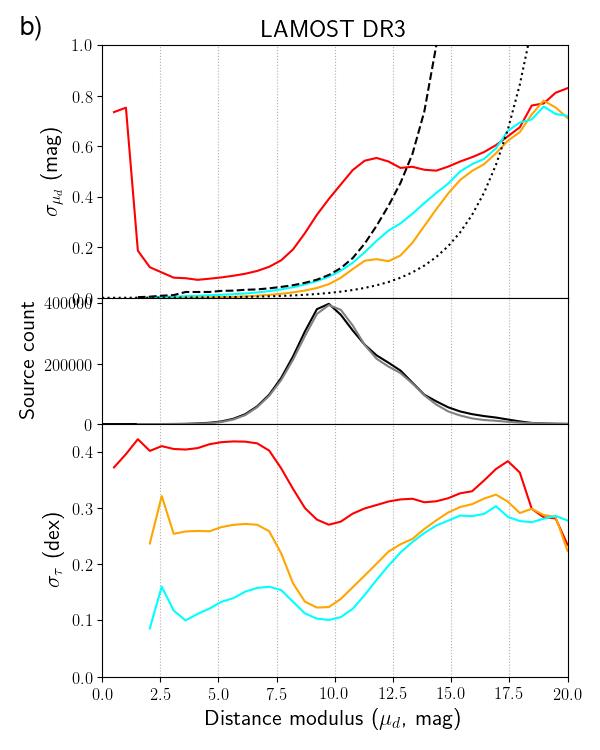
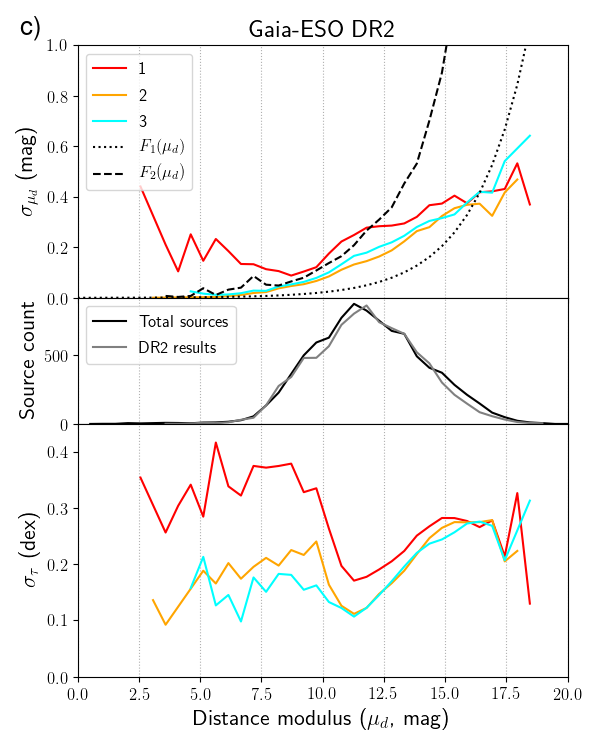
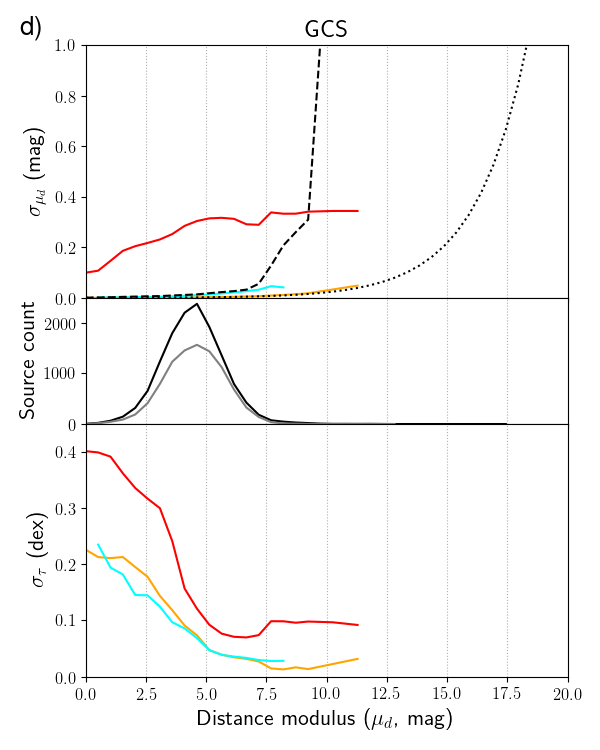
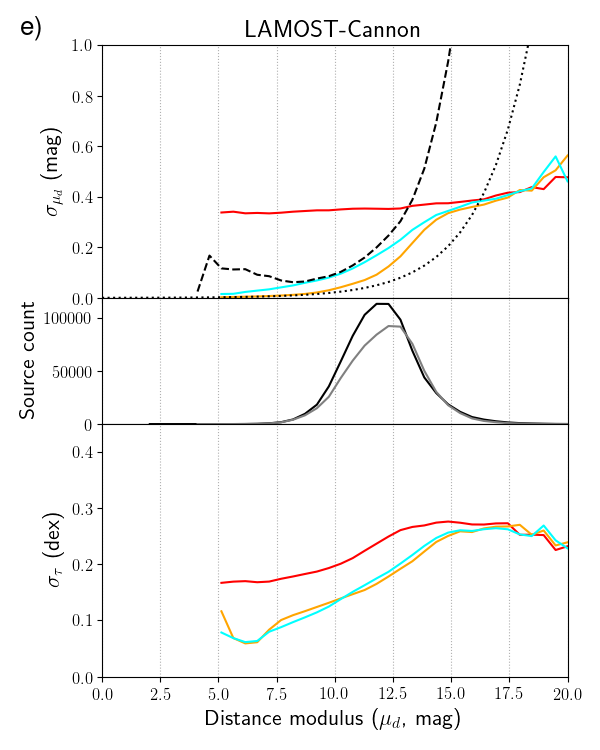
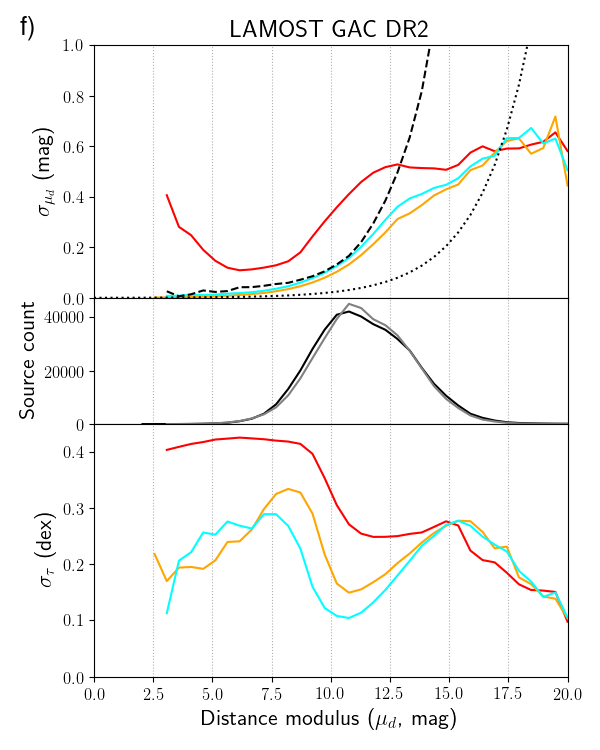
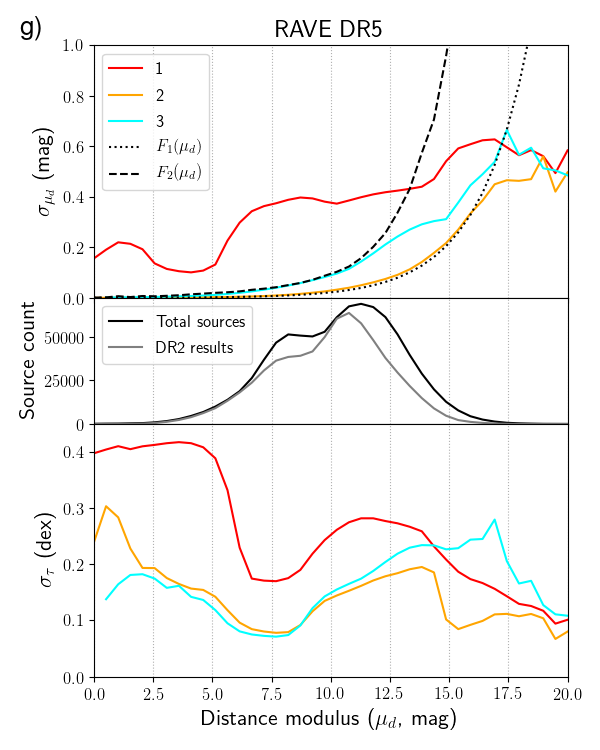
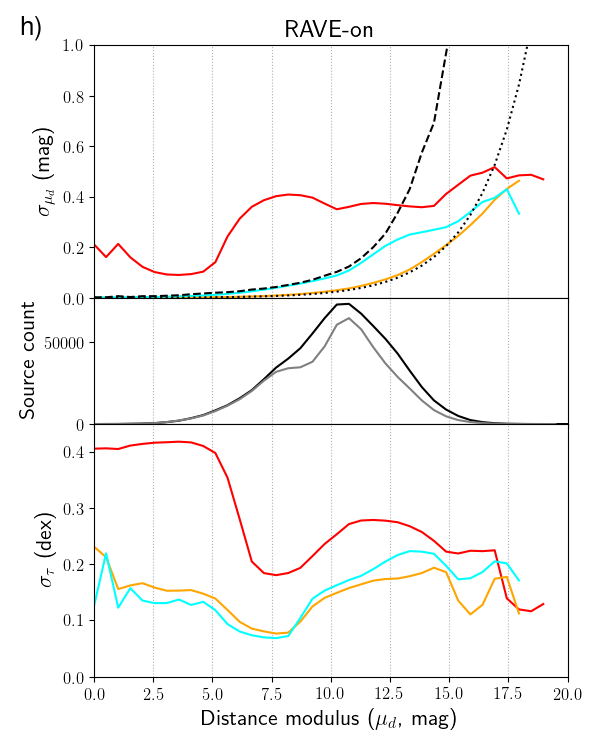
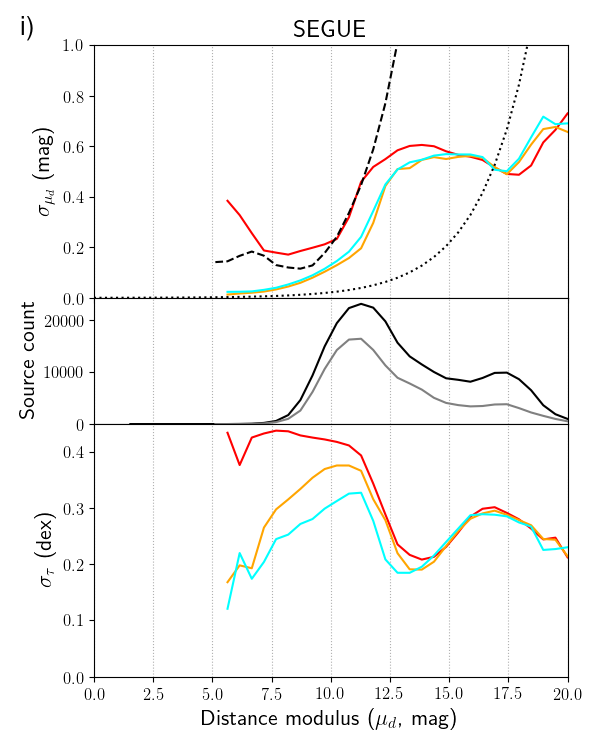
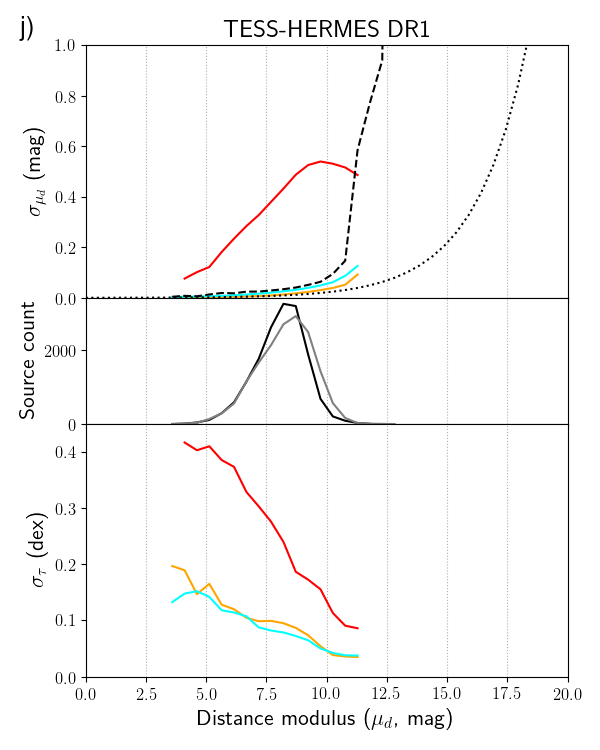
In Figure 1 we show how median uncertainties of distance modulus and log(age) derived with the use of Gaia DR2 data compare with results without parallaxes and with predictions for Gaia end-of-mission (EoM) parallax quality from Mints & Hekker (2018). In most cases, distance modulus uncertainties obtained with Gaia DR2 data are larger than those expected for Gaia EoM. This is as expected, given that Gaia DR2 parallaxes do not yet reach the EoM precision.
As for log(age) uncertainties, they are in most cases comparable with predictions. There is a trend for log(age) uncertainties to be smaller than expected for nearby stars and larger than expected for most distant ones (see, for example, figure 1h). Further analysis is needed to explain this behaviour.
For the majority of the surveys we find a consistent solutions for 85 to 95% of the stars. Only for RAVE we find consistent solutions for 75% of the stars.
Acknowledgements
The research leading to the presented results has received funding from the European Research Council under the European Community’s Seventh Framework Programme (FP7/2007- 2013)/ERC grant agreement (No 338251, StellarAges).
This work has made use of data from the European Space Agency (ESA) mission Gaia (https://www.cosmos.esa.int/gaia), processed by the Gaia Data Processing and Analysis Consortium (DPAC, https://www.cosmos.esa.int/web/gaia/dpac/consortium). Funding for the DPAC has been provided by national institutions, in particular the institutions participating in the Gaia Multilateral Agreement.
References
- Buder et al. (2018) Buder, S., Asplund, M., Duong, L., et al. 2018, ArXiv e-prints [arXiv1804.06041]
- Gaia Collaboration et al. (2018) Gaia Collaboration, Brown, A. G. A., Vallenari, A., et al. 2018, ArXiv e-prints [arXiv1804.09365]
- Gaia Collaboration et al. (2016) Gaia Collaboration, Prusti, T., de Bruijne, J. H. J., et al. 2016, A&A, 595
- Mints & Hekker (2017) Mints, A. & Hekker, S. 2017, A&A, 604
- Mints & Hekker (2018) Mints, A. & Hekker, S. 2018, ArXiv e-prints [arXiv1804.06578]