Improved resection margins in breast-conserving surgery using Terahertz Pulsed imaging data
A Santaolalla 222Translational Oncology and Urology Research (TOUR), School of Cancer and Pharmaceutical Sciences, King’s College London, London SE1 9RT, UK. Email: aida.santaolalla@kcl.ac.uk 555Equally contributing primary authors, M Sheikh333Institute for Mathematical and Molecular Biomedicine, Kings College London, London SE1 1UL, UK. Email: mansoor.sheikh@kcl.ac.uk 55footnotemark: 5,
M Van Hemelrijck22footnotemark: 2, A Portieri444TeraView Ltd., Cambridge, CB4 0WS, UK, ACC Coolen33footnotemark: 3
Abstract
New statistical methods were employed to improve the ability to distinguish benign from malignant breast tissue ex vivo in a recent study. The ultimate aim was to improve the intraoperative assessment of positive tumour margins in breast-conserving surgery (BCS), potentially reducing patient re-operation rates. A multivariate Bayesian classifier was applied to the waveform samples produced by a Terahertz Pulsed Imaging (TPI) handheld probe system in order to discriminate tumour from benign breast tissue, obtaining a sensitivity of 96% and specificity of 95%.
We compare these results to traditional and to state-of-the-art methods for determining resection margins. Given the general nature of the classifier, it is expected that this method can be applied to other tumour types where resection margins are also critical.
Keywords: Terahertz pulsed imaging, Bayesian classification, Malignant tissue discrimination
1 Introduction
Breast cancer is the most frequent cancer among women worldwide [1] and the leading cause of cancer death in females, accounting for 23% of the total cancer cases and 14% of the cancer deaths [2]. Surgery to remove the primary tumour is one of the main curative treatments in breast cancer which has evolved over time from radical surgery to more conservative approaches, such as breast conserving surgery [3] [4].
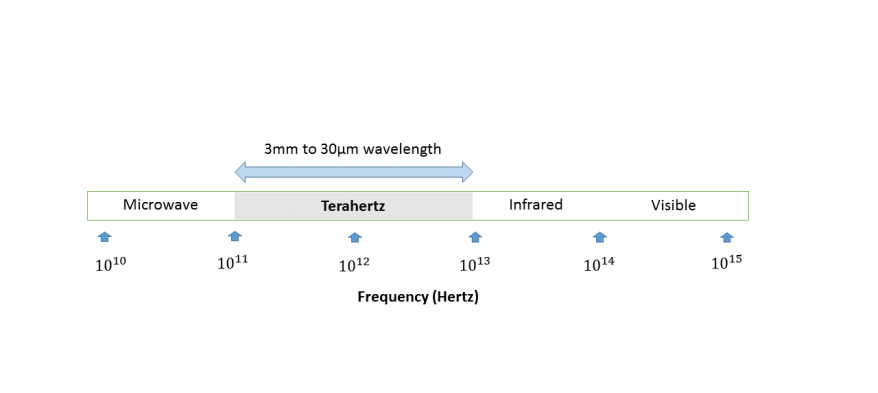
Good surgical outcomes are related to the accuracy in the resection of the tumour margins during surgery. Currently, a significant number of patients need to undergo additional surgery to obtain clear margins and/or remove remaining lymph nodes in the axilla, causing a significant physical and psychological morbidity in patients [5]. To date, histopathology, which occurs after surgery, is the gold standard to determine tumour margins. Hence, new techniques are being investigated to assess tumour margins intraoperatively. Terahertz (THz) radiation is one such tool (see figure 1); it does not produce harmful ionization in biological tissues and therefore has been applied in cancer studies previously [6].
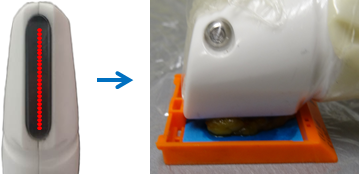
In order to implement this technology to assess tumour margins and sentinel lymph nodes in breast cancer patients intraoperatively, Teraview Ltd.(Cambridge, UK) developed a handheld THz Probe to be used in breast conserving surgery, eventually aiming to reduce the number of reoperations.
In [6], a feasibility study was performed to determine the capability of the handheld THz Probe to distinguish between different breast cancer tissues ex vivo.The THz raw data obtained was complex, multidimensional and hold lots of noise. There is a lack of standardised procedures for data acquisition, post processing, image analysis and interpretation of the data generated with this technology. Therefore, [6] used two different statistical approaches to discriminate between different breast tissue samples based on Terahertz pulsed imaging (TPI) data produced by the Teraview probe.
In the current paper, we aim to improve the prediction capabilities of the classifier by utilising a novel Bayesian classifier [7] which improves tissue discrimination by distinguishing between tumour, fibrous and adipose tissue in comparison with other technologies employ to assess tumour margins and in comparison with the previous feasibility study.
The large number of covariates in the dataset along with a relatively small number of tissue samples makes the prediction of the clinical outcome difficult because of overfitting problems and prohibitive computation demands. Typically Bayesian calculations rely on computational methods such as Markov Chain Monte Carlo to compute integrals. In our approach, this is overcome by judicious model selection resulting in the integrals which scale with dimension to be analytically tractable.
The paper is organised as follows. Section 2 describes the data collection and pre-processing methods. Section 3 outlines the new Bayesian classifier used for determining tissue class. The results are stated in section 4. We review results for existing and state-of-the-art technologies for this clinical problem in section 5. Discussion and next steps are in section 6.
2 Data collection
2.1 Technology
The handheld terahertz pulsed imaging (TPI) probe device (Teraview) has 26 pixels 2. Each pixel transmits terahertz electromagnetic radiation of frequency 0.1-2.0 THz to the biological sample and records any residual signal transmitted from the tissue. Technical details can be found in [8].
2.2 Data acquisition
Imaging data was produced from scanning 46 freshly excised breast cancer samples obtained from 30 breast cancer patients treated at Guy’s and St Thomas’ NHS Foundation Trust (GSTT) following a breast conservation surgery or mastectomy between August 2013 and August 2014. This dataset was acquired as part of a feasibility study to test the utility of the handheld (TPI) probe to discriminate between breast tissue types (REC 12-EE-0493).
The ex vivo breast tissue samples contained different proportions of adipose, fibrous and tumour tissue. Each sample was assessed for detailed histopathology by two experts blinded for the patient details that labelled the percentage of adipose, fibrous and tumour at pixel level for each of the samples. Following the histopathology assessment, the samples were scanned with the probe, using air as a reference, to produce the data for the study. Each pixel transmitted many pulses to the tissue sample and received the residual data. These were averaged within the device to produce a waveform which was the input for the statistical analysis. Ideally if the complete amount of the residual information from each pulse was preserved, a more accurate idea of the signal variability could have been obtained.
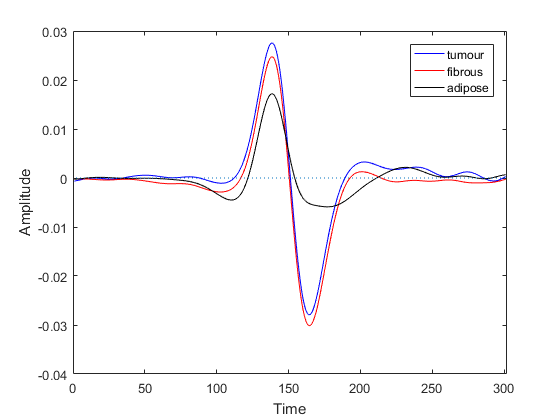
An averaged waveform with 674 data points was produced by each pixel. It was determined that the outermost points were either zero or noise so these were removed [8]. This reduced the number of data points to 301 per waveform (see figure 3). The detailed histopathology results were appended to the Terahertz (THz) data for each sample. In the language of statistical inference, this is a supervised learning problem with the predictor being the waveform and the response variable being the histopathology result. The size and orientation of the samples were varied. This resulted in varying numbers of pixels per tissue. The final dataset included a total of 257 pixels resulting in a matrix of real-valued data.
2.3 Data pre-processing
Our aim is to discriminate each impulse function (waveform) per pixel per sample into tumour, fibrous or benign breast tissue. However it is difficult to do so visually (see figure 3). Statistical analysis is therefore required.
Feature selection. Given the high dimensionality of the data, some methods use feature selection to choose the most informative features. In [8], the Support Vector Machine methodology used heuristic methods to determine which features had the greatest effect on classification results. For the Naive Bayesian classifier, also used in [8], overfitting is not as large a concern. Gaussian deconvolution, common in image processing, was used before sending the data to the classifier. In this present paper, we found that classification based on the raw waveform data produced the best results.
Throughout this paper, we distinguish between a tissue sample which is a physical sample from a patient and a data sample understood in the statisical sense. In this study there were 46 tissues samples collected which produced 257 data samples.
3 Classification methods
3.1 General method
A multivariate Bayesian classification algorithm [7] was applied to the TPI waveform data to discriminate benign from malignant breast tissue. The classifier used supervised learning techniques with the class labels derived from the histopathologically defined tissue content. The trained classifier was used to predict the classes of new observations.
In statistical learning, a classifier is a function which maps a data point to a class prediction. There are four stages to a classification problem. The first is model selection. We use the framework outlined in [7]. The second stage is to train our chosen model on the training data. In our case, this involves learning a set of parameters for each class: tumour, fibrous and adipose. In the third stage, the classifier uses a probabilistic approach assuming that the observations in each class were generated by a multivariate Gaussian distribution specific to that class. Predictive probabilities of a new data sample belonging to a certain class are calculated. Lastly, decision theory is applied to translate those probabilities into class predictions. This is done by simply choosing the class with the highest probability conditioned on the data sample. While traditional statistical methods produce probability point estimates, probability distributions are produced in our Bayesian approach. This allows us to quantify the uncertainty in the predictions made.
The performance of the classifier was evaluated using leave-one-out cross-validation (LOOCV). Training of the Bayesian classifier occurred by leaving out a single data sample and learning parameters from the remaining data samples. The estimated parameters were then used to classify the data sample that was left out. This process was repeated for all the samples. The results were compiled to estimate accuracy, sensitivity, specificity, positive predictive value (PPV) and negative predictive value (NPV) to distinguish malignant from benign tissue.
Overfitting. Typically, data with more covariates, , than samples, , leads to overfitting [9]. This is the case with our data where and . This is somewhat mitigated by using a fully Bayesian classification approach [7]. Inference methods such as maximum likelihood work well when but are prone to overfitting when . The classifier used in this paper avoids taking point estimates of unknown parameters. Instead it treats them in a Bayesian way by assuming they are random variables and integrating over them. By carefully choosing the prior probability distributions, a closed-form for the predictive probabilities is derived. The final estimation of hyperparameters is done analytically. An added advantage is that computationally expensive cross-validation methods are avoided allowing us to handle larger data-sets.
3.2 Application to Terahertz Pulsed Imaging
The data could be categorised under three different scenarios depending on the particular research question assessed. The class label for each sample will be determined by:
-
•
Scenario 1: pixels were marked as tumour when containing any amount of cancer cells (if the tumour percentage was greater than zero, the TPI impulse function was considered as tumour, irrespective of the content of fibrous or adipose tissue), otherwise the tissue content of the pixel was defined by the highest percentage of fibrous or adipose tissue;
-
•
Scenario 2: pixels were marked as tumour when containing any amount of cancer cells (if the tumour percentage was greater than zero, the TPI function was considered as tumour, independently of the content of fibrous or adipose tissue), otherwise tissue was considered to be “benign”. In this scenario, adipose and fibrous tissues were grouped together;
-
•
Scenario 3: pixels were marked based on their tissue content, so the tissue content of each pixel was defined by the highest percentage.
Given that the main aim of the project was to discriminate malignant tissue from benign breast tissue, and that benign breast tissue could be subdivided into fibrous and adipose tissue respectively, scenario 1 was the preferred option in the study. This results in class sizes of 115, 100 and 42 (totalling 257 data samples).
The original THz time domain pulses were assessed in their ability to discriminate tumour from healthy (fibrous/adipose) breast tissue using our probabilistic Bayesian classification algorithm [7].
Class imbalance problem. Classification methods with imbalanced class sizes tend to favour the majority class [10]. This is a well known phenomenon in classification literature. The problem frequently occurs in medical data-sets where the rare or diseased cases have many fewer samples. In our case, the data collected focussed on tumorous tissue and hence the adipose class has many fewer samples.
Methods to compensate for this effect can be grouped into pre-processing methods or algorithmic changes. Pre-processing can be achieved by over-sampling the minority class [11] or under-sampling the majority class [12]. On the other hand, the classification algorithm itself can be changed [10]. An example is to specify a cost function for misclassification to mitigate the class imbalance effect. We have not attempted these methods in this paper.
4 Results
Classification accuracy is first displayed for the three class analysis (tumour, fibrous and adipose) is in Table 1.
| Predict 1 | Predict 2 | Predict 3 | |
|---|---|---|---|
| True class 1 | 110 | 5 | 0 |
| True class 2 | 5 | 95 | 0 |
| True class 3 | 2 | 27 | 13 |
The number of corrected predicted samples was 218 out of 257 which gave a classification accuracy of 85%. However the clinically important decision was whether the sample contains tumour or not. Classes 2 and 3 represented benign tissue. By aggregating these benign classes, we obtained the confusion matrix in Table 2.
For the two class results, the classification accuracy, sensitivity and specificity were 95%, 96% and 95%. In addition the PPV and NPV values were 94% and 96%.
| Predict 1 | Predict 2 | |
|---|---|---|
| True class 1 | 110 | 5 |
| True class 2 | 7 | 135 |
Next we summarise the classification results on the same data-set using our method and those from previous studies [8] (see table 3).
| Classifier | Bayesian method | Support Vector Machine [8] | Naive Bayes [8] |
|---|---|---|---|
| Accuracy | 95% | 75% | 69% |
| Sensitivity | 96% | 86% | 89 % |
| Specificity | 95% | 66% | 53 % |
| PPV | 94% | 67% | 60 % |
| NPV | 96% | 85% | 86 % |
5 Comparison to existing methods
Different intraoperative margin assessment (IMA) tools are being investigated to assess tumour resection margins. Some of these techniques are clinically established, such as frozen section analysis [13][14][15], specimen radiography, intraoperative ultrasound, touch imprint cytology and optical spectroscopy. However these IMAs present diverse performance and limitations in terms of accuracy, speed, cost, and reliability. Therefore, new IMA tools are currently under development including Raman spectroscopy [16][17], microcomputed CT, mass spectroscopy [18], radiofrequency spectroscopy[19] or fluorescence imaging.
Our classification results were materially better than the performance of IMAs currently used, as reported by a recent meta-analysis [20] (see table 4).
| Number of patients/samples | Accuracy | Sensitivity | Specificity | |
|---|---|---|---|---|
| Frozen section analysis (FSA) | 46-1327 | 84-98 % | 78-91% | 92-98% |
| Specimen radiography | 12-119 | 33-84% | 45-61% | 77-89% |
| Intraoperative ultrasound | 81-225 | 62-80% | 36-79% | 66-91% |
| Touch imprint cytology | 27-510 | 78-99% | 71-97% | 90-98% |
| Optical spectroscopy | 20-179 | 75-94% | 74-91% | 65-96% |
| Support Vector Machine | 257 | 75% | 86% | 66% |
| Naive Bayesian method | 257 | 69% | 89% | 53% |
| New Bayesian method | 257 | 95% | 96% | 95% |
6 Discussion and next steps
Our results are comparable to Frozen Section Analysis, which is considered the gold standard. Therefore our classifier is learning most of the signal in the data. Comparing to previous methods, our classification method performs better on all measures than the previous classifiers from [6] on the given data-set. The Support Vector Machine method used heuristics to select suitable features. Our method has the advantage of using all the available data and requiring no heuristic choices. Additionally many classification methods require ad-hoc choices for the tuning parameters (hyperparameters). In our case, this hyperparameter optimisation is analytic.
The data-set used has class sizes of 115, 100 and 42. This class imbalance will lead to worse classification than a balanced data-set. We plan to use data pre-processing methods to help with class imbalance. Given this involves multiple runs with different samples removed, it requires much more time than no pre-processing.
6.1 Next steps
Three tumour types are present in the data (invasive ductal carcinoma, invasive lobular carcinoma and invasive tubular carcinoma). It is likely that these will have statistically different TPI waveforms. Our method labels all three tumour types as one class despite being able to handle many more than three classes. However too few data samples relative to the number of covariates leads to insufficient characterisation of each class. If sufficient numbers of each type were present in the data, it is likely that classification accuracy would improve.
The composition of human breast tissue can vary with patient age. Having access to additional data such as patient age is likely to improve classification accuracy.
Our method of leave-one-out cross-validation is a standard statistical learning procedure given small datasets. It was used to allow comparison to existing literature, specifically [8]. However it is recognised that including data samples from the same patient is not clinically realistic. This likely flattered our classification accuracy metrics. This should be compensated by increasing the overall training size.
Our data was obtained from ex vivo tissue samples. Since Terahertz radiation is non-ionising, it would be interesting to re-run the analysis using data from in vivo clinical trials.
Lastly, our analytical methods are sufficiently general to be applied to other tumour types.
7 Acknowledgements
We are grateful for the use of data produced by the handheld THz Probe developed by Teraview Ltd (Cambridge, UK) in a collaborative project with Professor Purushotham and his PhD student Maarten Grootendorst. The work of Mansoor Sheikh was supported by BBSRC and GSK Ltd.
Appendix A Confusion matrix terminology
| Predict 1 | Predict 2 | |
|---|---|---|
| True class 1 | a | b |
| True class 2 | c | d |
True Positive (TP), False Negative (FN), False Positive (FP), True Negative (TN)
Accuracy , Sensitivity , Specificity , PPV and NPV.
References
- [1] C. Fitzmaurice, C. Allen, R. M. Barber, L. Barregard, Z. A. Bhutta, H. Brenner, D. J. Dicker, O. Chimed-Orchir, R. Dandona, L. Dandona, et al., Global, regional, and national cancer incidence, mortality, years of life lost, years lived with disability, and disability-adjusted life-years for 32 cancer groups, 1990 to 2015: a systematic analysis for the global burden of disease study, JAMA oncology 3 (4) (2017) 524–548.
- [2] A. Jemal, F. Bray, M. M. Center, J. Ferlay, E. Ward, D. Forman, Global cancer statistics, CA: a cancer journal for clinicians 61 (2) (2011) 69–90.
- [3] G. Franceschini, S. Magno, C. Fabbri, F. Chiesa, A. Di Leone, F. Moschella, I. Scafetta, A. Scaldaferri, S. Fragomeni, L. Adesi Barone, et al., Conservative and radical oncoplastic approaches in the surgical treatment of breast cancer, Eur Rev Med Pharmacol Sci 12 (6) (2008) 387–96.
- [4] G. H. Sakorafas, Breast cancer surgery-historical evolution, current status and future perspectives, Acta Oncologica 40 (1) (2001) 5–18.
- [5] F. Fitzal, M. Gnant, Breast conservation: evolution of surgical strategies, The breast journal 12 (s2).
- [6] A. J. Fitzgerald, V. P. Wallace, M. Jimenez-Linan, L. Bobrow, R. J. Pye, A. D. Purushotham, D. D. Arnone, Terahertz pulsed imaging of human breast tumors, Radiology 239 (2) (2006) 533–540.
- [7] M. Sheikh, A. Coolen, Accurate bayesian data classification without hyperparameter cross-validation, arXiv preprint arXiv:1712.09813.
- [8] M. R. Grootendorst, A. J. Fitzgerald, S. G. B. de Koning, A. Santaolalla, A. Portieri, M. Van Hemelrijck, M. R. Young, J. Owen, M. Cariati, M. Pepper, et al., Use of a handheld terahertz pulsed imaging device to differentiate benign and malignant breast tissue, Biomedical Optics Express 8 (6) (2017) 2932–2945.
- [9] A. Coolen, J. Barrett, P. Paga, C. Perez-Vicente, Replica analysis of overfitting in regression models for time-to-event data, arXiv preprint arXiv:1705.01730.
- [10] B. C. Wallace, K. Small, C. E. Brodley, T. A. Trikalinos, Class imbalance, redux, in: Data Mining (ICDM), 2011 IEEE 11th International Conference on, IEEE, 2011, pp. 754–763.
- [11] N. V. Chawla, K. W. Bowyer, L. O. Hall, W. P. Kegelmeyer, Smote: synthetic minority over-sampling technique, Journal of artificial intelligence research 16 (2002) 321–357.
- [12] C. Drummond, R. C. Holte, et al., C4. 5, class imbalance, and cost sensitivity: why under-sampling beats over-sampling, in: Workshop on learning from imbalanced datasets II, Vol. 11, Citeseer Washington DC, 2003.
- [13] J. C. Cendán, D. Coco, E. M. Copeland, Accuracy of intraoperative frozen-section analysis of breast cancer lumpectomy-bed margins, Journal of the American College of Surgeons 201 (2) (2005) 194–198.
- [14] M. J. Kim, C. S. Kim, Y. S. Park, E. H. Choi, K. D. Han, The efficacy of intraoperative frozen section analysis during breast-conserving surgery for patients with ductal carcinoma in situ, Breast cancer: basic and clinical research 10 (2016) 205.
- [15] J. M. Jorns, D. Visscher, M. Sabel, T. Breslin, P. Healy, S. Daignaut, J. L. Myers, A. J. Wu, Intraoperative frozen section analysis of margins in breast conserving surgery significantly decreases reoperative rates: one-year experience at an ambulatory surgical center, American journal of clinical pathology 138 (5) (2012) 657–669.
- [16] A. S. Haka, K. E. Shafer-Peltier, M. Fitzmaurice, J. Crowe, R. R. Dasari, M. S. Feld, Diagnosing breast cancer by using raman spectroscopy, Proceedings of the National Academy of Sciences of the United States of America 102 (35) (2005) 12371–12376.
- [17] C.-H. Liu, Y. Zhou, Y. Sun, J. Li, L. Zhou, S. Boydston-White, V. Masilamani, K. Zhu, Y. Pu, R. Alfano, Resonance raman and raman spectroscopy for breast cancer detection, Technology in cancer research & treatment 12 (4) (2013) 371–382.
- [18] E. R. St John, J. Balog, J. S. McKenzie, M. Rossi, A. Covington, L. Muirhead, Z. Bodai, F. Rosini, A. V. Speller, S. Shousha, et al., Rapid evaporative ionisation mass spectrometry of electrosurgical vapours for the identification of breast pathology: towards an intelligent knife for breast cancer surgery, Breast Cancer Research 19 (1) (2017) 59.
- [19] F. Schnabel, S. K. Boolbol, M. Gittleman, T. Karni, L. Tafra, S. Feldman, A. Police, N. B. Friedman, S. Karlan, D. Holmes, et al., A randomized prospective study of lumpectomy margin assessment with use of marginprobe in patients with nonpalpable breast malignancies, Annals of surgical oncology 21 (5) (2014) 1589–1595.
- [20] E. R. St John, R. Al-Khudairi, H. Ashrafian, T. Athanasiou, Z. Takats, D. J. Hadjiminas, A. Darzi, D. R. Leff, Diagnostic accuracy of intraoperative techniques for margin assessment in breast cancer surgery: a meta-analysis, Annals of surgery 265 (2) (2017) 300–310.