Detection of magnetic fields in chemically peculiar stars observed with the K2 space mission
Abstract
We report the results of an observational study aimed at searching for magnetic pulsating hot stars suitable for magneto-asteroseismology. A sample of sixteen chemically peculiar stars was selected and analysed using both high-resolution spectropolarimetry with ESPaDOnS and K2 high-precision space photometry. For all stars, we derive the effective temperature, surface gravity, rotational and non-rotational line broadening from our spectropolarimetric data. High-quality K2 light curves were obtained for thirteen of the sixteen stars and revealed rotational modulation, providing accurate rotation periods. Two stars show evidence for roAp pulsations, and one star shows signatures of internal gravity waves or unresolved g-mode pulsations. We confirm the presence of a large-scale magnetic field for eleven of the studied stars, of which nine are first detections. Further, we report one marginal detection and four non-detections. Two of the stars with a non-detected magnetic field show rotational modulation due to surface abundance inhomogeneities in the K2 light curve, and we confirm that the other two are chemically peculiar. Thus, these five stars likely host a weak (undetected) large-scale magnetic field.
keywords:
stars: magnetic field – stars: rotation – stars: early-type – stars: oscillations1 Introduction
The number of known magnetic hot stars has steadily increased thanks dedicated campaigns (e.g., MiMeS, Wade et al. 2016; the BOB campaign, Morel et al. 2015; and the BRITE spectropolarimetric survey, Neiner et al. 2016) using the latest generation of high-resolution spectropolarimeters. Magnetic fields are found to occur in about 10 % of hot stars, are stable over long time scales, have a simple geometry (often dipolar), and are considered to be of fossil origin (e.g., Power, 2007; Neiner et al., 2015; Villebrun et al., 2016; Sikora et al., 2017). Yet, we still do not understand the impact of such large-scale magnetic fields on the deep stellar interior or on stellar evolution. Theory and numerical simulations indicate that the large-scale magnetic field should enforce a uniform rotation within the radiative envelope of hot stars (e.g., Ferraro, 1937; Moss, 1992; Spruit, 1999; Mathis & Zahn, 2005; Zahn, 2011). This affects the amount of material that is able to overshoot from the convective core to the surrounding radiative layers in these stars (e.g., Press, 1981; Browning et al., 2004). However, observational evidence of this effect remains rare.
Asteroseismology, the study of non-radial oscillations in stars, remains the sole method to reliably observe the conditions within stars (Aerts et al., 2010). Depending on the type of stellar oscillations, classified on the basis of their dominant restoring force of the pulsation modes, the driving mechanism, and the global stellar parameters, these oscillations probe different regions within the stellar interior. Gravity modes (g modes) probe the deep interior and the near-core region, while pressure modes (p modes) are mostly sensitive to the stellar envelope. The detection and modelling of oscillation modes has been successfully exploited for only two hot magnetic OB stars, namely V2052 Oph (Neiner et al., 2012a; Handler et al., 2012; Briquet et al., 2012) and Cep (Shibahashi & Aerts, 2000), at the level of magneto-asteroseismology. This is the combination of magnetometry and asteroseismology to study how the large-scale magnetic field of these magnetic hot stars influences their deep interior. Briquet et al. (2012) determined that the magnetic field of V2052 Oph was responsible for the low amount of convective-core overshooting required to successfully model the observed Cep p-mode oscillations when, comparised to a star with similar oscillations but no detected large-scale magnetic field.
Unfortunately, the number of known magnetic pulsating hot stars with a complete characterization of their large-scale magnetic field and sufficient data to perform asteroseismic modelling remains limited. This is in part due to the brightness limitation for ground-based high-resolution spectropolarimetry ( mag is the typical limit for moderately rotating hot stars) and in part because few intrinsically bright hot stars were observed by photometric space missions, such as Kepler or CoRoT. The K2 space mission (Howell et al., 2014) has partly filled this niche, since its field of view changes on the sky every days, and monitors stars that are accessible with modern high-resolution spectropolarimetry. As such, we are able to search for and investigate the periodic variability in photometry caused by oscillations and rotational modulation, while also measuring the strength of the large-scale magnetic field.
For this current study, we selected a sample of candidate magnetic hot stars, based on their peculiar chemical surface composition, to be observed with both K2 and ESPaDOnS, with the aim to find optimal targets for magneto-asteroseismology.
We describe the sample selection in Sect. 2. Section 3 discusses the observations and their respective data treatments. The periodic variability in the K2 photometry is investigated in Sect. 4, estimates on the stellar parameters are determined in Sect. 5, and in Sect. 6 we examine the high-resolution spectropolarimetry for the presence of a large-scale magnetic field. Section 7 discusses the results, and a summary and conclusions are provided in Sect. 8.
2 Sample selection
For each observing campaign of the K2 space mission, we selected the CP-2 stars(also known as Ap/Bp stars) and the He weak/strong stars from the Renson & Manfroid (2009) catalogue, which contains a list of stars known to have peculiar chemical photospheric abundances. The Ap/Bp stars are typically slow rotators with strong large-scale magnetic fields, which cause stratification in their atmospheres and create long-term chemical spots on the stellar surface (e.g., Stibbs, 1950; Michaud, 1970). The He strong stars are also assumed to host large-scale magnetic fields (e.g., Borra & Landstreet 1979, with Ori E as the best studied example, Oksala et al. 2015). The He weak stars (CP-4 stars) are of a different nature and do not form a homogeneous group (which was already noted by e.g., Sargent, 1964; Norris, 1971; Jaschek & Jaschek, 1974). Some CP-4 stars exhibit intense Si, or Ti and Sr lines, and are considered a hot extension of the magnetic Ap/Bp stars (examples of magnetic He weak stars are 3 Sco (Landstreet et al., 1979), HD 176582 (Bohlender & Monin, 2011), and HR 2949 (Shultz et al., 2015)). Others show overabundances of P and Ga, typically noted for HgMn stars (CP-3 stars), and could thus be related to these non-magnetic HgMn stars.
In total, over 60 of these anticipated magnetic stars have been selected and monitored by the K2 space mission, in its campaigns C00 up to C15. From this sample, we selected 16 of the brightest and/or slowest rotating stars to be observed with high-resolution spectropolarimetry, with the aim to detect and/or confirm the presence of a stable large-scale magnetic field. The combined analysis of the photometric and spectro-polarimetric data of this sub-sample forms the basis of the current paper. The individual stars and their properties are presented in Table 1. The photometric variability of the complete sample of 60 stars is analysed and presented in Bowman et al. (2018, submitted).
Two stars of the sample are the primary components of long-period binary systems. HD 134759 is part of a hierarchical system, for which the shortest orbital period is 23.42 yr (Heintz, 1982). HD 158596 has an angular separation of arcsec according to its Hipparcos data (ESA, 1997). One star is part of a short-period binary system, namely HD 139160. Levato et al. (1987) indicated an orbital orbit of 5.28 d and an eccentricity of . Yet, substantial scatter remains between their spectroscopic observations and orbital solution.
| Star | V | SpT | ||||
|---|---|---|---|---|---|---|
| [mag] | [K] | [dex] | [km s-1] | [km s-1] | ||
| HD97859 | 9.35 | B9 Si | ||||
| HD107000 | 8.02 | A2 Sr | ||||
| HD134759 | 4.54 | Bp Si + … | ||||
| HD139160 | 6.19 | B7 He wk. | ||||
| HD152366 | 8.08 | B8 Si | ||||
| HD152834 | 8.83 | A0 Si | ||||
| HD155127 | 8.38 | B9 Eu Cr Sr | ||||
| HD158596 | 8.94 | B9 Si + … | ||||
| HD164224 | 8.49 | B9 Eu Cr | ||||
| HD165972 | 8.96 | B9 Si | ||||
| HD166804 | 8.88 | B9 Si | ||||
| HD173406 | 7.43 | B9 Si | ||||
| HD173657 | 7.41 | B9 Si Cr | ||||
| HD177013 | 9.04 | A2 Eu Cr Sr | ||||
| HD177562 | 7.38 | B8 Si | ||||
| HD177765 | 9.15 | A5 Eu Cr Sr |
2.1 Previous inference of large-scale magnetic fields
For some of the stars in our sample, the presence of a large-scale magnetic field has been investigated from previous observations. However, in several cases it was not clearly confirmed that the star hosts a large-scale magnetic field. These observations are either from a photometric estimation of the ‘surface’ magnetic field (e.g., Cramer & Maeder, 1980a), medium resolution circular spectropolarimetry of metal or Balmer lines (e.g., Romanyuk et al., 2014), or from the directly observed Zeeman splitting of absorption lines (Mathys et al., 1997).
The photometric index based on the Geneva photometric system and calibrated on Kurucz models (Kurucz, 1979) can indicate the presence of a (large-scale) magnetic field for hot stars (with a spectral type ranging from B1 to A2; Cramer & Maeder, 1979, 1980b). This method was employed by Cramer & Maeder (1980a) to indicate that HD 134759 and HD 139160 should host a large-scale magnetic field with a strength of more than 1 kG. North & Cramer (1984) continued this analysis and determined a magnetic field strength of 1 kG, 2.7 kG, 4.1 kG, 2.4 kG, and 1.2 kG for HD 134759, HD 155127, HD 164224, HD 165972, and HD 173406, respectively.
Low to medium resolution circular spectropolarimetry was utilized to detect and measure the strength of the large-scale magnetic fields of three stars in our sample. Landstreet et al. (1975) investigated HD 134759 and obtained a longitudinal magnetic field value of G, which the authors did not claim as a definite detection. HD 97859 was observed and discussed by El’kin (1998), who obtained a longitudinal magnetic field of G. No errorbars were provided, but it can be assumed to be of the order of the measured value, as HD 97859 had the largest of all stars in their sample, with typical uncertainties ranging from 100 G to 500 G for stars with a km s-1. Lastly, HD 107000 was monitored by Romanyuk & Kudryavtsev (2008); Romanyuk et al. (2014, 2015), who measured longitudinal magnetic field values ranging from G up to G that vary with a period of about 2.4 d.
Mathys et al. (1997) and Mathys (2017) noted that HD 177765 hosts a sufficiently strong large-scale magnetic field causing Zeeman splitting of several absorption lines. By measuring the strength of the splitting, the authors determined a mean magnetic field modulus of approximately 3.4 kG, with little variation between the various observations.
Given this overview, we conclude that only HD 107000 and HD 177765 have a firmly detected large-scale magnetic field, albeit not with modern high-resolution spectropolarimetry.
3 Observations
3.1 K2 photometry
To construct the K2 light curves, we retrieved the target pixel files from the Mikulski Archive for Space Telescopes (MAST). For each (sub)-campaign and each star, we determined custom non-circular apertures from the stacked images. These were sufficiently large to accommodate the pixel drifts due to the thruster fires (Howell et al., 2014) and did not change during a given data set. Next, the mean background per frame was subtracted to create raw background corrected photometry. This was subsequently passed through the k2sc package (Aigrain et al., 2015; Aigrain et al., 2016; Aigrain et al., 2017) to correct for the pixel drifts, and their associated instrumental effects, by means of Gaussian processes. Subsequently, an outlier rejection was applied to the corrected photometry of each (sub)-campaign and another (long-term) instrumental detrending was performed. During this detrending step, we accounted for the high-amplitude rotational modulation signal (see Sect. 4.1). Finally, we combined the different (sub)-campaigns for a given star to one light curve. Details on the K2 photometry are given in Table 2.
Reduced K2 light curves were constructed for 14 stars of the sample, while reductions for HD 134759 and HD 139160 were still ongoing at the time of writing. A significant fraction of the flux of HD 177562 was lost outside the subraster, causing the light curve to be of poor quality. Therefore, only 13 light curves were used in the remaining of this paper.
| Star | EPIC ID | C | Time length | N | Notes |
|---|---|---|---|---|---|
| [d] | |||||
| HD 97859 | 201777342 | 01 | 80.07 | 3345 | |
| HD 107000 | 201667495 | 10 | 47.89 | 1907 | |
| HD 134759 | 249657024 | 15 | a | ||
| HD 139160 | 249152551 | 15 | a | ||
| HD 152366 | 203749199 | 02, 11 | 822.59 | 4209 | b |
| HD 152834 | 232176043 | 11 | 69.43 | 2925 | |
| HD 155127 | 232284277 | 11 | 69.45 | 2876 | |
| HD 158596 | 225990054 | 09, 11 | 221.99 | 5831 | b |
| HD 164224 | 226241087 | 09 | 68.64 | 2824 | |
| HD 165972 | 224206658 | 09 | 68.64 | 2822 | |
| HD 166804 | 227373493 | 09 | 68.64 | 2812 | |
| HD 173406 | 218676652 | 07 | 65.79 | 2624 | |
| HD 173657 | 213786701 | 07 | 81.28 | 3361 | |
| HD 177013 | 219198038 | 07 | 81.24 | 3289 | |
| HD 177562 | 214133870 | 07 | 81.80 | 3494 | c |
| HD 177765 | 214503319 | 07 | 78.78 | 3331 |
3.2 ESPaDOnS spectropolarimetry
Each star was observed at least once by the Echelle SpectroPolarimetric Device for the Observations of Stars (ESPaDOnS, Donati et al., 2006) mounted at the Canada France Hawaii Telescope (CFHT) on Mauna Kea in Hawaii. Standard settings were used for the spectropolarimeter in circular polarisation mode (Stokes V). The spectropolarimetric sequences consisted of four consecutive sub-exposures, for which the exposure times were tailored to the spectral type, brightness, and anticipated , to be able to detect a dipolar field of 600 G or higher. The observations were reduced with the libre-esprit (Donati et al., 1997) and upena softwares available at CFHT. The data span from 3 700 Å to 10 500 Å and have an average resolving power R = 65 000. The spectropolarimetric data were normalized to unity per spectral order with the interactive spline fitting tool spent (Martin et al., 2018). Details on the spectropolarimetric observations are given in Table 4.
4 Photometric variability
4.1 Rotational modulation
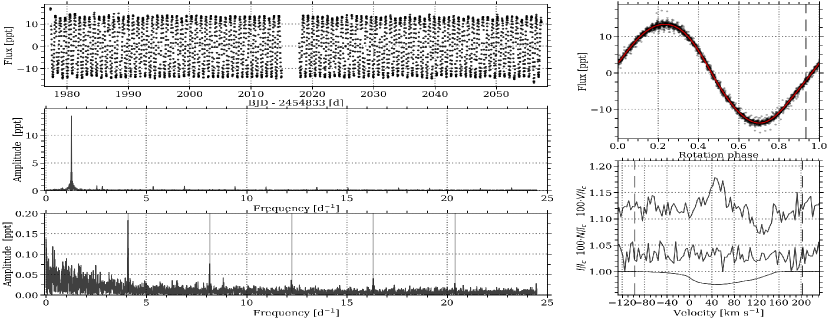
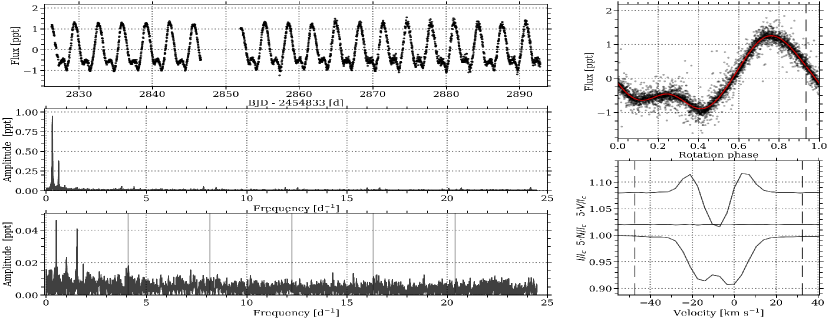
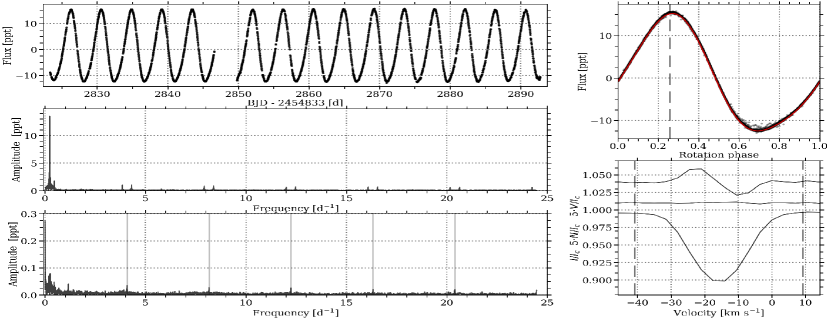
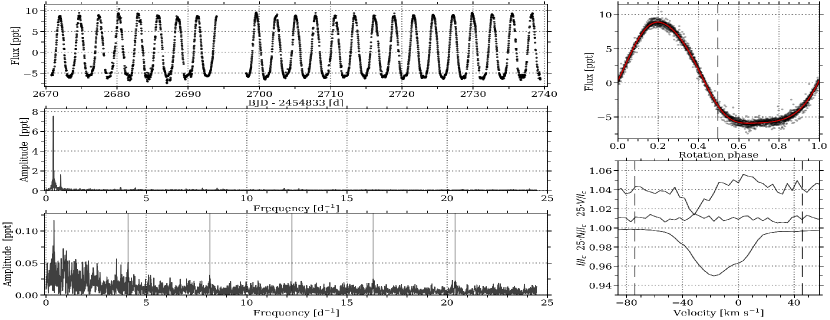
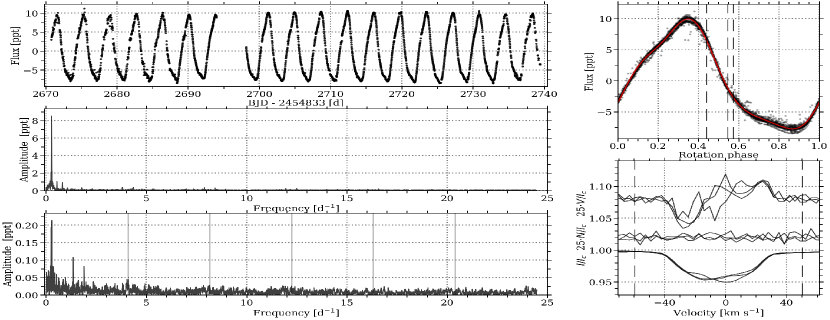
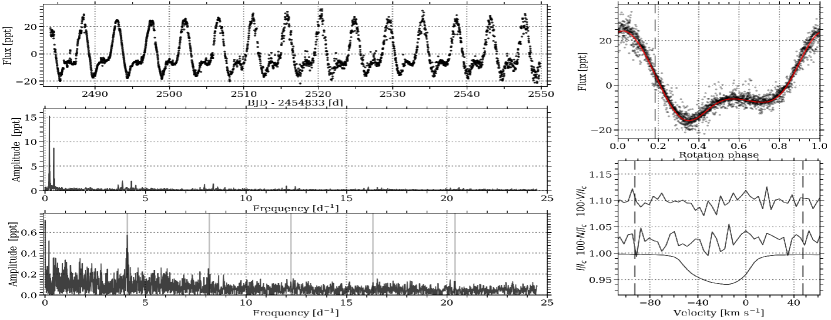
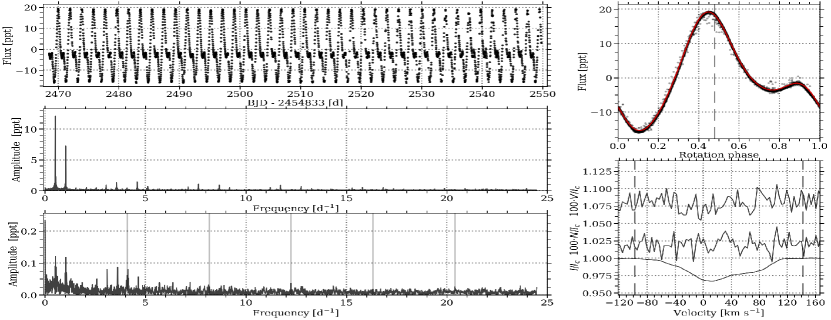
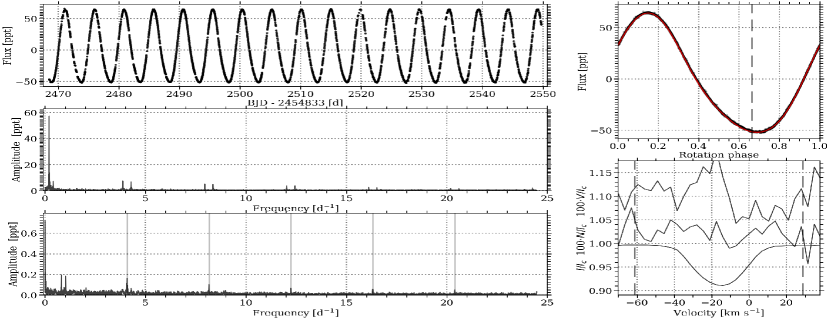
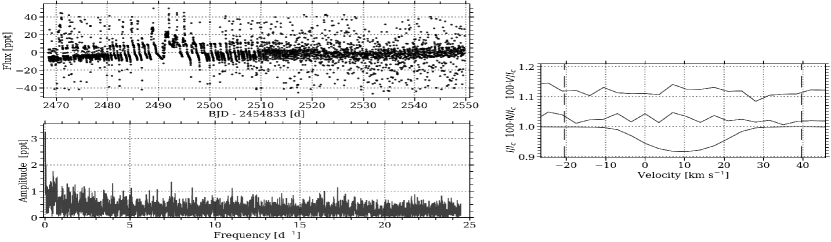
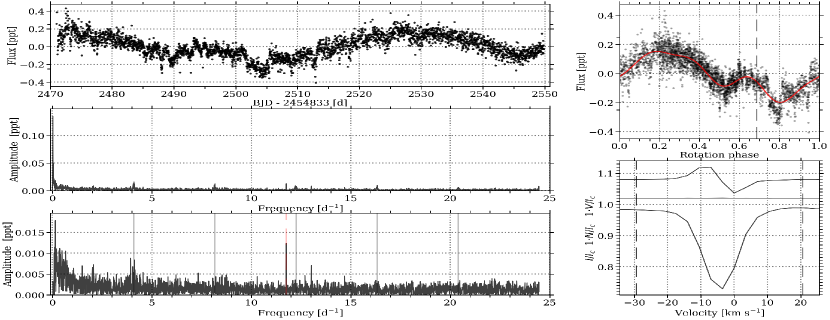
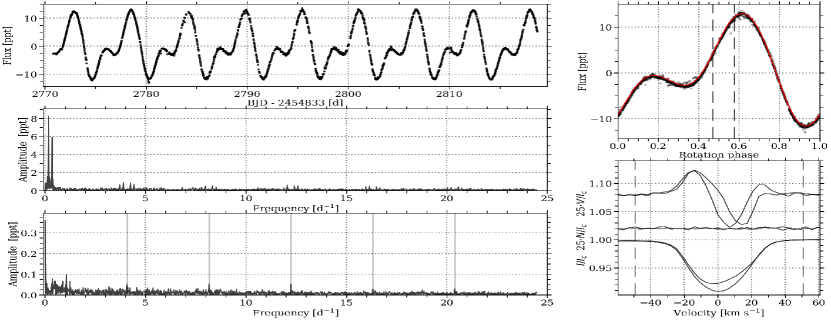
We computed a Lomb-Scargle periodogram (Lomb, 1976; Scargle, 1982) for each of the 13 K2 light curves. The dominant variability for all 13 light curves occurs in the low-frequency regime, which consists of a few significant frequency harmonics. These periodograms are indicated in the top and middle panels of the left column of Fig. 1 (similar figures for the other stars are depicted in Appendix A). We attribute this variability to rotational modulation, due to surface abundance inhomogeneities. Instead of iteratively prewhitening this variability, we performed a Least-Squares (LS) fit to the light curve with a fourth-order sine model:
| (1) |
where and are the amplitude and phase of the th harmonic and is a constant offset. This fitting procedure has the advantage that the exact rotation frequency, , and its (higher) frequency harmonics are simultaneously enforced. We truncated the series at the fourth order, because this was the highest frequency harmonic encountered in the periodograms. The fitting process was a two-step approach. First, was kept fixed to the estimated value from a ten times oversampled Lomb-Scargle periodogram to estimate , , and . In the second step, all parameters, including , were set as free fitting parameters, where was allowed to vary within the Rayleigh resolution limit. We show the final fit to the K2 light curve in the top right panel of Fig. 1 for HD 107000 and provide all 13 determined rotation periods in Table 3. We propagated the Rayleigh limit as a conservative uncertainty for each .
Several of the stars in our sample have previously been monitored to investigate their periodic variability. We compared the literature values for the rotation period with the values derived in this work (see Table 3). Most agreed well with only two exceptions. For HD 107000, we recovered twice the literature value. This may occur if Wraight et al. (2012) performed a frequency extraction instead of fitting a high-order sine model to the stereo light curve in the time domain. Our value for the rotation period of HD 107000 offers a better fit to the K2 light curve. The other exception is HD 177765, for which Mathys (2017) indicated a rotation period longer than 5 years due to the lack of variability in the mean magnetic field modulus. The variability in the K2 light curve has a small amplitude and does not contain two full cycles of the derived rotation period (56 days). We cannot exclude that this photometric variability has a different (possibly instrumental) origin other than rotation.
| Star | [d] | [d] | Note |
|---|---|---|---|
| This work | Literature | ||
| HD 97859 | b | ||
| HD 107000 | b | ||
| HD 134759 | b | ||
| HD 139160 | b | ||
| HD 152366 | |||
| HD 152834 | d | ||
| HD 155127 | d | ||
| HD 158596 | c | ||
| HD 164224 | |||
| HD 165972 | d | ||
| HD 166804 | d | ||
| HD 173406 | a | ||
| HD 173657 | d | ||
| HD 177013 | a | ||
| HD 177562 | |||
| HD 177765 | years | e,∗ |
4.2 Remaining periodic variability
By removing the rotation signal from the K2 photometry, we drastically reduced the power in the Lomb-Scargle periodograms (e.g., the bottom left panel of Fig. 5). The strongest remaining signal within the periodogram of the residuals falls within one of the following categories:
-
•
Low-frequency power excess related to imperfectly reduced and corrected K2 photometry. This might have been caused by stitching different K2 (sub)-campaigns together into one light curve or because of an incomplete removal of long-term instrumental variability. HD 152834 and HD 165792 show examples of this power excess in the periodogram of the residuals.
-
•
Remaining aliasing structure around the 6 h K2 thruster fire frequency (or its harmonics) or at the harmonics of the 6 h thruster fire frequency itself. A clear example of the former was observed for HD 173657.
-
•
Remaining structure around the rotation frequency or its frequency harmonics. This is observed, for example, for HD 155127, HD 158596, or HD 166804. The surface abundance inhomogeneities are anticipated to be stable over the time scale of the light curves, as they are linked to the stable large-scale magnetic fields. However, spot migration could have occurred, but is considered to be unlikely.
Three stars are exceptions to these results with significant power in their residual periodograms. Both HD 158596 and HD 177765 show a clear, isolated frequency peak at d-1 and d-1, respectively. These could be Nyquist aliases of unresolved, high-frequency pulsation modes in the rare subgroup of roAp stars (Kurtz, 1982). Alentiev et al. (2012) discussed the detection of a 61.01 d-1 roAp pulsation in the spectroscopy of HD 177765, supporting the hypothesis that we may indeed be dealing with an alias in the photometry. We cannot exclude that the frequency peak for HD 158596 originates in the fainter secondary component. Finally, we note that HD 164224 reveals a low-frequency power excess, which could be due to unresolved g-mode pulsation frequencies or internal gravity waves, which are predicted in stars with convective cores (e.g., Aerts & Rogers, 2015).
We did not find evidence of frequency peaks related to stellar oscillations driven by the -mechanism for any of the 13 targets.
5 Estimation of stellar parameters
To perform the magnetometric analysis, we required estimates for the effective temperature, , and the surface gravity, , to construct average spectra with the Least-Squares Deconvolution (LSD) technique (Donati et al., 1997). This method drastically increased the S/N of a possible Zeeman signature in the (LSD) Stokes V profile.
As a first step, we deduced the projected rotational velocity and the radial velocity for each star by fitting a rotation profile (see e.g., Gray, 2005) convolved with a Gaussian profile to an unblended Fe or Si line. The Gaussian profile captures the non-rotational broadening acting upon the absorption line, due to macro-turbulence, micro-turbulence, waves, etc. We followed the goodness-of-fit approach by Simón-Díaz & Herrero (2014) to derive the values and confidence intervals for and and report the results in Table 1, keeping in mind that these two parameters are correlated.
Next, we determined and for each star by fitting pre-computed syntv local thermodynamical equilibrium synthetic spectra (Tsymbal, 1996) for llmodels atmosphere models (Shulyak et al., 2004) using the Grid Search in Stellar Parameters (gssp, Tkachenko, 2015) software to the observations. Because of the significant chemical peculiarities for these stars, we performed the fitting simultaneously to the H and H lines, while keeping the overall metallicity fixed at [M/H] = 0.0 and the micro-turbulent velocity at km s-1. Moreover, both the line broadening and the radial velocity were fixed at the values in Table 1. The grid of stellar parameters for gssp spanned from = 6000 K up to 15000 K, with steps of 500 K, and from 3.0 dex up to 4.5 dex, with a step of 0.1 dex. The determined values for and , as well as their statistical uncertainties, are also listed in Table 1. These errors on and should be considered as a lower limit of the confidence intervals, because Ap stars are known to have a core-wing anomaly for their hydrogen lines (see e.g., Cowley et al., 2001; Kochukhov et al., 2002). For the stars with unresolved binary components, the values given may have contributions from both stars. However, the difference in as a result of this would not significantly affect our conclusions.
Although the secondary components of HD 134759, HD 139160, and HD 158596 should be well within the fiber area of ESPaDOnS, we did not find a clear indication of the presence of the secondary in the spectra. Therefore, we also fitted their respective observations with a single-star synthetic spectrum to estimate the stellar parameters.
6 Magnetometry
| Star | HJD | S/N | int. range | Det. | ||||||
|---|---|---|---|---|---|---|---|---|---|---|
| -2450000 | line mask | |||||||||
| [d] | [s] | [K] | [dex] | [nm] | [km s-1] | [G] | ||||
| HD97859 | 2457881.78364 | 14000 | 4.0 | 4829 | 1.192 | 519.13 | DD | |||
| HD107000 | 2457475.92214 | 7750 | 3.5 | 2836 | 1.210 | 519.94 | DD | |||
| 2457497.87935 | 3047 | 1.210 | 518.95 | DD | ||||||
| HD134759 | 2457799.17433 | 12000 | 4.0 | 4941 | 1.183 | 520.89 | DD | |||
| 2457801.17550 | 5056 | 1.183 | 521.12 | DD | ||||||
| HD139160 | 2457820.00404 | 13000 | 4.0 | 3133 | 1.177 | 520.43 | ND | |||
| primary | ND | |||||||||
| secondary | ND | |||||||||
| HD152366 | 2457818.06147 | 10000 | 3.5 | 2843 | 1.196 | 518.52 | DD | |||
| HD152834 | 2457818.08468 | 10000 | 3.5 | 1769 | 1.188 | 511.72 | DD | |||
| HD155127 | 2457818.10943 | 8000 | 3.5 | 1812 | 1.201 | 511.06 | DD | |||
| HD158596 | 2457818.15110 | 11000 | 4.0 | 2744 | 1.182 | 525.24 | DD | |||
| HD164224 | 2457817.15008 | 8750 | 3.5 | 1373 | 1.197 | 515.58 | DD | |||
| HD165972 | 2457905.94729 | 13000 | 4.0 | 3144 | 1.185 | 518.54 | DD | |||
| HD166804 | 2457883.11294 | 13000 | 4.0 | 3095 | 1.180 | 517.88 | DD | |||
| 2457886.92179 | 3066 | 1.180 | 518.47 | DD | ||||||
| 2457890.13132 | 2468 | 1.180 | 519.00 | DD | ||||||
| HD173406 | 2457500.13798 | 13000 | 4.0 | 1882 | 1.174 | 519.73 | ND | |||
| HD173657 | 2457554.98727 | 11000 | 4.0 | 3631 | 1.164 | 508.96 | ND | |||
| HD177013 | 2457905.96915 | 12000 | 4.5 | 963 | 1.163 | 511.23 | MD | |||
| HD177562 | 2457553.02367 | 13000 | 3.5 | 4572 | 1.176 | 524.93 | ND | |||
| HD177765 | 2457554.99870 | 8500 | 4.5 | 1001 | 1.204 | 513.89 | DD | |||
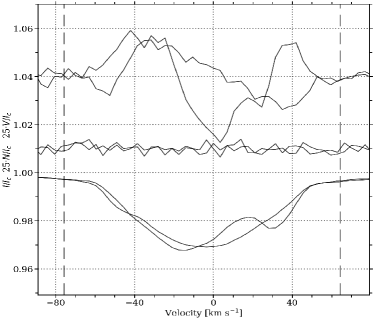
To boost the signal-to-noise ratio (S/N) of the possible Zeeman signatures in the Stokes V spectrum, we constructed an average line profile using the LSD technique. A precomputed vald3 line mask (Ryabchikova et al., 2015) with parameters close to the estimated stellar parameters was used for each star, and is listed in Table 4. All hydrogen lines and all spectral lines blended with hydrogen lines, telluric features, and known diffuse interstellar bands were removed from the line masks. Furthermore, the depths of the lines in the masks were adjusted to match the observations (a process so-called “tweaking”, see e.g., Grunhut et al., 2017). The resulting LSD profiles are shown in the bottom right panel of Fig. 1 for HD 107000 and in Appendix A for the other stars.
Most of the LSD Stokes I profiles show some sort of distortion. We attributed this profile variability to the surface abundance inhomogeneities, because the corresponding K2 photometry displays rotational modulation.
6.1 Zeeman signature
The False Alarm probability (FAP; Donati et al., 1992; Donati et al., 1997) was utilized to determine the presence of a Zeeman signature in the LSD Stokes V profile. Non-detections (NDs) have been assigned for a FAP , definite detections (DDs) for FAP , and marginal detections correspond to FAP . Using these criteria, eleven stars have a DD, while four have a ND and one a MD. We mark the detection status in Table 4.
For each spectropolarimetric observation, we also determined the longitudinal magnetic field (Rees & Semel, 1979) as:
| (2) |
where and are the LSD Stokes V and I profiles, respectively, for a given velocity in km s-1. The mean Landé factor, , and the mean wavelength (in nm), , result from the LSD technique. The speed of light, , is given in km s-1 and the longitudinal magnetic field, , in Gauss. The integration range spans the full width of the Zeeman signature and the mean absorption line profile. We report the values for , , the integration range, and the calculated longitudinal magnetic field in Table 4.
The determined values are well in line with the expectations for magnetic hot stars with a polar strength of at least several 100 G (where the polar strength is at least 3.5 times the measured longitudinal magnetic field; Preston, 1967). Stars for which we obtained a ND also have a measured compatible with zero within the 2 confidence interval. In addition, Zeeman splitting is observed in individual lines (Stokes I) of HD 177765 (as already clearly indicated in Figure 4 of Mathys et al., 1997), confirming that the star hosts a strong field of several kG. This strong magnetic field agrees with the long rotation period for the star (out of the studied sample) when considering magnetic braking.
Nearly all of the detected Zeeman profiles have a typical appearance for large-scale magnetic fields with a simple geometry (dominantly dipolar), where the exact shape depends on the rotation phase and on the unknown inclination and obliquity angles. Distortions of the Zeeman signature due to the distorted LSD Stokes I profile did occur for several stars, such as HD 166804. However, the signature was sufficiently clear that these distortions did not cause any issues with the detection. Moreover, the rotation periods are sufficiently long compared to the total exposure time of the spectropolarimetric sequence, so that the measured values were not affected by these distortions.
6.2 Binary systems
As mentioned earlier, three stars of our sample are part of binary systems. A component of two of these (i.e., HD 134759 and HD 158596) clearly host a large-scale magnetic field. The spectropolarimetric sequence of HD 139160, however, led to a ND. Here, we consider several explanations.
-
•
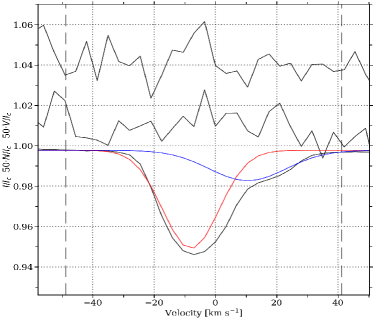
The ND could be caused by the binary nature of HD 139160. The distortions in the LSD Stokes I profile could be due to the presence of the nearby companion, classifying HD 139160 as SB2 system, instead of the previously claimed surface abundance inhomogeneities. By means of LS fitting, we described the LSD Stokes I profile with two Gaussian functions to represent the individual components (see Fig. 4). After subtracting either one of the Gaussian profiles, we isolated the individual components in the Stokes I profile. We then used these two profiles to redetermine the FAP for a Zeeman signature (in the LSD Stokes V) and recomputed the longitudinal magnetic field (see Table 4). Again, we did not detect a signature of a large-scale magnetic field for the individual components. Hence, the binary nature is probably not the cause of the ND.
-
•
HD 139160 has a rather short orbital period of 5.28 d, according to the modelling efforts of Levato et al. (1987) to the measured radial velocities. As magnetic hot stars seem to be less common in binary systems with short orbital periods (as inferred from the BinaMIcS results, Alecian et al., 2015), this could explain the ND. Yet, spectropolarimetric data with a much higher S/N are needed to exclude the possibility of a weak magnetic field.
-
•
As indicated earlier, two sub-groups of He-weak stars exist. The He-weak stars related to the HgMn stars do not host a large-scale magnetic field. We compared the Stokes I spectrum with the synthetic syntv + llmodels (with solar abundances) spectrum, but did not find clear evidence of strong P or Ga absorption lines, which would associate HD 139160 to this non-magnetic sub-group of He-weak stars. We did, however, note the substantially weaker He I lines. Thus, HD 139160 may host a large-scale magnetic field, but that is weaker than our detection threshold.
7 Discussion
7.1 Rotation period
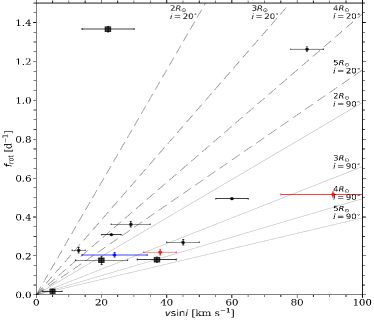
The determined rotation periods indicate that all stars are slow to moderate rotators. This result was expected because of a known bias introduced in the sample star selection since we required to obtain high S/N, high-resolution spectropolarimetry with reasonable exposure times. Nevertheless, rotation periods of a few days are typical of Ap/Bp stars. We compare the determined rotation frequencies with the derived values for in Fig. 2. No strict relation is present, as expected due to differences in stellar radii and the anticipated random distribution of inclination angles. HD 97859 and HD 164224 seem closer to (rotation) pole-on than the others, as they are situated in the upper part of the diagram. The two probable roAp stars do not reside in a particular region of Fig. 2. The variety in the inclination angle , and the obliquity angle , is further supported by the different shapes of the rotational modulation in the K2photometry.
7.2 Magnetic detections and non-detections
Out of the 16 expected magnetic stars in our sample, we directly detected the presence of a strong, large-scale magnetic field for 11 stars. This is the first firm detection for 9 of these stars and the first for all 11 stars employing high-resolution spectropolarimetry. We have a 69 % detection rate in our sample, with no obvious correlation with the stellar properties for the detection status. The spectropolarimetric measurements for the four stars with a ND and the one MD are of similar quality as the other 11 stars with detected magnetic fields. Moreover, it seems unlikely that the NDs/MDs were due to particularly unfavourable rotation phases where the field is seen in a cross-over configuration (see top right panels of Figures in Appendix A).
Two of the stars with a ND, namely HD 173406 and HD 173657, show stable rotational modulation over the duration of their K2 light curves. Because of the poor quality light curve of HD 177562, we could not confirm the presence of rotational modulation for this star with a ND. Yet, the comparison of the ESPaDOnS spectra with their respective synthetic spectra suggests chemical peculiarities, as claimed by the Renson & Manfroid (2009) catalogue. Therefore, it is likely that these three stars are indeed Ap/Bp stars with expected, stable surface abundance inhomogeneities, and thus host a large-scale magnetic field. It may be that these stars host a weaker large-scale magnetic field than what is typically anticipated for Ap/Bp stars, which is in agreement with the increased number of detections of such weak large-scale magnetic fields (e.g., HD 5550; Alecian et al., 2016). These weaker magnetic fields could be an evolutionary consequence if the stars have burned a considerable amount of their hydrogen, while still undergoing hydrogen core burning, leading to an increased stellar radius and assuming magnetic flux conservation (e.g., Landstreet et al., 2008). This scenario could be further enhanced if magnetic field decay has occurred (as determined by Fossati et al., 2016, for the most massive magnetic stars).
The distortions of the LSD Stokes I profile of HD 173657 (see bottom right panel of Fig. 14) could be due to a resolved SB2 system, instead of surface abundance inhomogeneities. However, this star is not known to be a binary system and we only obtained one observation. More spectroscopic observations are needed to corroborate this hypothesis.
We also did not detect the presence of a large-scale magnetic field for the He-weak star HD 139160. We explored the possibility of a large-scale magnetic field in the individual components of the binary system, but again obtained a ND for both components. Since we did not note any strong P or Ga lines in the spectroscopic observations, HD 139160 is inferred to be unrelated to be related to the non-magnetic HgMn stars. Thus, the presence of a large-scale magnetic field is anticipated, that is likely weaker than what was expected when computing the exposure time for the spectropolarimetric sequences.
7.3 Lack of heat-driven stellar oscillations
We found no evidence for the presence of stellar oscillations produced by the mechanism in any of the Ap/Bp stars studied in this work. Some of our target stars do reside in the theoretical -driven instability regions. Although only a small fraction of the stars in these regions are known to have observable oscillations at current detection thresholds, the fact that none of our targets show such pulsations is significant. These results provide support for the theoretical predictions that strong large-scale magnetic fields change the nature of waves and may even completely suppress them (Lecoanet et al., 2017).
Two stars in our sample (HD 158596 and HD 177765) show statistically-significant peaks in their periodograms with strong evidence that there are Nyquist aliases of high-frequency roAp pulsations. Furthermore, HD 164224 shows a significant low-frequency power excess that is unlikely to be explained by instrumental effects and could be caused by unresolved g-mode pulsation modes or internal gravity waves. Extended observations of all these candidate pulsators will be extremely useful in characterising the exact nature of their observed variability in the K2 photometry.
Several pulsating magnetic hot stars are known, such as Cep (Shibahashi & Aerts, 2000; Henrichs et al., 2013), V2052 Oph (Neiner et al., 2012a; Handler et al., 2012; Briquet et al., 2012), CMa (Shultz et al., 2017), HD 43317 (Pápics et al., 2012; Briquet et al., 2013; Buysschaert et al., 2017), HD 188774 (Neiner & Lampens, 2015), Cen Ab (Alecian et al., 2011; Pigulski et al., 2016), and Pup (Neiner et al., 2017). However, all these stars host a rather weak magnetic field. The only strongly magnetic star exhibiting variations interpreted as -driven pulsations known at present is the He-strong star HD 96446, with a dipolar field strength of about 5 kG (Neiner et al., 2012b; Järvinen et al., 2017).
8 Summary and conclusions
We observed 16 chemically peculiar hot stars with space-based high-precision photometry to study their periodic variability, and with modern high-resolution optical spectropolarimetry to detect the signatures of a large-scale magnetic field. The investigated stars are all slow to moderate rotators, with large-scale magnetic fields being easier to detect from spectropolarimetry in slowly-rotating stars compared to fast rotators. Although our sample of stars was biased towards slow rotators, the observed rotation periods are typical of Ap/Bp stars. It is known that gravity-mode oscillations are easier to detect in slowly-rotating OB-type stars (Aerts & De Cat, 2003; Aerts et al., 2017). Therefore, our sample bias should favour the detection of such oscillations.
In our sample, 13 stars have a high-quality K2 light curve and all of them show evidence of rotational modulation. We detected a large-scale magnetic field for 69% of our sample stars and found no obvious correlation between this detection and the stellar parameters, such as binarity, rotation rate, or occurrence of possible stellar pulsations. All four non-magnetic stars, HD 139160, HD 173406, HD 173657, and HD 177562 show either rotational modulation, peculiar chemical surface abundances, or both, and therefore likely host an undetected weak large-scale magnetic field.
No -driven oscillations were detected in any of the targets in oursample. Two stars, namely HD 158596 and HD 177765, show an isolated high-frequency peak in their periodogram, which we interpret as the Nyquist alias of high-frequency roAp pulsations. One star, HD 164224, shows a significant low-frequency power excess in its periodogram which could be evidence of convectively-driven internal gravity waves. Further observations and analyses of these candidate pulsators are needed to fully test these hypotheses, since we are too limited by the length and cadence of the K2 space photometry.
We conclude that, after major efforts with the K2 mission and modern spectropolarimetry, the best stars to try and perform in-depth magneto-asteroseismic modelling are those with a moderate magnetic field which does not suppress -driven modes. The best target for this is and remains the CoRoT target HD 43317, for which a series of gravity modes with consecutive radial order has been found in the CoRoT photometry (Pápics et al., 2012; Briquet et al., 2013) and whose magnetic field detection and modelling led to fully consistent results between the seismically and magnetically derived rotation frequency of the star (Buysschaert et al., 2017).
Acknowledgements
B.B. would like to thank Dr. Andrew Tkachenko for the useful discussions on GSSP.
This work has made use of the VALD database, operated at Uppsala University, the Institute of Astronomy RAS in Moscow, and the University of Vienna. This research has made use of the SIMBAD database operated at CDS, Strasbourg (France), and of NASA’s Astrophysics Data System (ADS). Some of the data presented in this paper were obtained from the Mikulski Archive for Space Telescopes (MAST). STScI is operated by the Association of Universities for Research in Astronomy, Inc., under NASA contract NAS5-26555. Support for MAST for non-HST data is provided by the NASA Office of Space Science via grant NNX09AF08G and by other grants and contracts. This paper includes data collected by the Kepler mission. Funding for the Kepler mission is provided by the NASA Science Mission directorate. Part of the research leading to these results has received funding from the European Research Council (ERC) under the European Union’s Horizon 2020 research and innovation programme (grant agreement N∘670519: MAMSIE) and from the Research Foundation Flanders (FWO, grant agreement G.0B69.13).
References
- Aerts & De Cat (2003) Aerts C., De Cat P., 2003, SSRv, 105, 453
- Aerts & Rogers (2015) Aerts C., Rogers T. M., 2015, ApJl, 806, L33
- Aerts et al. (2010) Aerts C., Christensen-Dalsgaard J., Kurtz D. W., 2010, Asteroseismology. Springer, Heidelberg
- Aerts et al. (2017) Aerts C., Van Reeth T., Tkachenko A., 2017, ApJl, 847, L7
- Aigrain et al. (2015) Aigrain S., Hodgkin S. T., Irwin M. J., Lewis J. R., Roberts S. J., 2015, MNRAS, 447, 2880
- Aigrain et al. (2016) Aigrain S., Parviainen H., Pope B. J. S., 2016, MNRAS, 459, 2408
- Aigrain et al. (2017) Aigrain S., Parviainen H., Roberts S., Reece S., Evans T., 2017, MNRAS, 471, 759
- Alecian et al. (2011) Alecian E., et al., 2011, A&A, 536, L6
- Alecian et al. (2015) Alecian E., et al., 2015, in IAU Symposium. p. 330 (arXiv:1409.1094), doi:10.1017/S1743921314007030
- Alecian et al. (2016) Alecian E., Tkachenko A., Neiner C., Folsom C. P., Leroy B., 2016, A&A, 589, A47
- Alentiev et al. (2012) Alentiev D., Kochukhov O., Ryabchikova T., Cunha M., Tsymbal V., Weiss W., 2012, MNRAS, 421, L82
- Bernhard et al. (2015) Bernhard K., Hümmerich S., Otero S., Paunzen E., 2015, A&A, 581, A138
- Bohlender & Monin (2011) Bohlender D. A., Monin D., 2011, AJ, 141, 169
- Borra & Landstreet (1979) Borra E. F., Landstreet J. D., 1979, ApJ, 228, 809
- Bowman et al. (2018) Bowman D. M., Buysschaert B., Neiner C., Pápics P. I., Oksala M. E., Aerts C., 2018, A&A, Submitted
- Briquet et al. (2012) Briquet M., et al., 2012, MNRAS, 427, 483
- Briquet et al. (2013) Briquet M., Neiner C., Leroy B., Pápics P. I., MiMeS Collaboration 2013, A&A, 557, L16
- Browning et al. (2004) Browning M. K., Brun A. S., Toomre J., 2004, ApJ, 601, 512
- Buysschaert et al. (2017) Buysschaert B., Neiner C., Briquet M., Aerts C., 2017, A&A, 605, A104
- Cowley et al. (2001) Cowley C. R., Hubrig S., Ryabchikova T. A., Mathys G., Piskunov N., Mittermayer P., 2001, A&A, 367, 939
- Cramer & Maeder (1979) Cramer N., Maeder A., 1979, A&A, 78, 305
- Cramer & Maeder (1980a) Cramer N., Maeder A., 1980a, A&As, 41, 111
- Cramer & Maeder (1980b) Cramer N., Maeder A., 1980b, A&A, 88, 135
- Donati et al. (1992) Donati J.-F., Semel M., Rees D. E., 1992, A&A, 265, 669
- Donati et al. (1997) Donati J.-F., Semel M., Carter B. D., Rees D. E., Collier Cameron A., 1997, MNRAS, 291, 658
- Donati et al. (2006) Donati J.-F., Catala C., Landstreet J. D., Petit P., 2006, in Casini R., Lites B. W., eds, Astronomical Society of the Pacific Conference Series Vol. 358, Astronomical Society of the Pacific Conference Series. p. 362
- ESA (1997) ESA ed. 1997, The HIPPARCOS and TYCHO catalogues. Astrometric and photometric star catalogues derived from the ESA HIPPARCOS Space Astrometry Mission ESA Special Publication Vol. 1200
- El’kin (1998) El’kin V. G., 1998, Contributions of the Astronomical Observatory Skalnate Pleso, 27, 452
- Ferraro (1937) Ferraro V. C. A., 1937, MNRAS, 97, 458
- Fossati et al. (2016) Fossati L., et al., 2016, A&A, 592, A84
- Gray (2005) Gray D. F., 2005, The Observation and Analysis of Stellar Photospheres. Cambridge University Press
- Grunhut et al. (2017) Grunhut J. H., et al., 2017, MNRAS, 465, 2432
- Handler et al. (2012) Handler G., et al., 2012, MNRAS, 424, 2380
- Heintz (1982) Heintz W. D., 1982, A&As, 47
- Henrichs et al. (2013) Henrichs H. F., et al., 2013, A&A, 555, A46
- Howell et al. (2014) Howell S. B., et al., 2014, PASP, 126, 398
- Hümmerich et al. (2016) Hümmerich S., Paunzen E., Bernhard K., 2016, AJ, 152, 104
- Järvinen et al. (2017) Järvinen S. P., Hubrig S., Ilyin I., Schöller M., Briquet M., 2017, MNRAS, 464, L85
- Jaschek & Jaschek (1974) Jaschek M., Jaschek C., 1974, Vistas in Astronomy, 16, 131
- Kochukhov et al. (2002) Kochukhov O., Bagnulo S., Barklem P. S., 2002, ApJL, 578, L75
- Kurtz (1982) Kurtz D. W., 1982, MNRAS, 200, 807
- Kurucz (1979) Kurucz R. L., 1979, ApJs, 40, 1
- Landstreet et al. (1975) Landstreet J. D., Borra E. F., Angel J. R. P., Illing R. M. E., 1975, ApJ, 201, 624
- Landstreet et al. (1979) Landstreet J. D., Borra E. F., Fontaine G., 1979, MNRAS, 188, 609
- Landstreet et al. (2008) Landstreet J. D., et al., 2008, A&A, 481, 465
- Lecoanet et al. (2017) Lecoanet D., Vasil G. M., Fuller J., Cantiello M., Burns K. J., 2017, MNRAS, 466, 2181
- Levato et al. (1987) Levato H., Malaroda S., Morrell N., Solivella G., 1987, ApJs, 64, 487
- Lomb (1976) Lomb N. R., 1976, AP&SS, 39, 447
- Martin et al. (2018) Martin A. J., et al., 2018, MNRAS, 475, 1521
- Mathis & Zahn (2005) Mathis S., Zahn J.-P., 2005, A&A, 440, 653
- Mathys (2017) Mathys G., 2017, A&A, 601, A14
- Mathys et al. (1997) Mathys G., Hubrig S., Landstreet J. D., Lanz T., Manfroid J., 1997, A&As, 123, 353
- Michaud (1970) Michaud G., 1970, ApJ, 160, 641
- Morel et al. (2015) Morel T., et al., 2015, in Meynet G., Georgy C., Groh J., Stee P., eds, IAU Symposium Vol. 307, New Windows on Massive Stars. pp 342–347 (arXiv:1408.2100), doi:10.1017/S1743921314007054
- Moss (1992) Moss D., 1992, MNRAS, 257, 593
- Neiner & Lampens (2015) Neiner C., Lampens P., 2015, MNRAS, 454, L86
- Neiner et al. (2012a) Neiner C., Alecian E., Briquet M., Floquet M., Frémat Y., Martayan C., Thizy O., Mimes Collaboration 2012a, A&A, 537, A148
- Neiner et al. (2012b) Neiner C., Landstreet J. D., Alecian E., Owocki S., Kochukhov O., Bohlender D., MiMeS Collaboration 2012b, A&A, 546, A44
- Neiner et al. (2015) Neiner C., Mathis S., Alecian E., Emeriau C., Grunhut J., BinaMIcS MiMeS Collaborations 2015, in Nagendra K. N., Bagnulo S., Centeno R., Jesús Martínez González M., eds, IAU Symposium Vol. 305, Polarimetry. pp 61–66 (arXiv:1502.00226), doi:10.1017/S1743921315004524
- Neiner et al. (2016) Neiner C., Wade G., Marsden S., Blazère A., 2016, preprint, 1611.03285
- Neiner et al. (2017) Neiner C., Wade G. A., Sikora J., 2017, MNRAS, 468, L46
- Norris (1971) Norris J., 1971, ApJs, 23, 213
- North & Cramer (1984) North P., Cramer N., 1984, A&As, 58, 387
- Oksala et al. (2015) Oksala M. E., et al., 2015, MNRAS, 451, 2015
- Pápics et al. (2012) Pápics P. I., et al., 2012, A&A, 542, A55
- Pigulski et al. (2016) Pigulski A., et al., 2016, A&A, 588, A55
- Power (2007) Power J., 2007, Master’s thesis, Queen’s University, Canada
- Press (1981) Press W. H., 1981, ApJ, 245, 286
- Preston (1967) Preston G. W., 1967, ApJ, 150, 547
- Rees & Semel (1979) Rees D. E., Semel M. D., 1979, A&A, 74, 1
- Renson & Manfroid (2009) Renson P., Manfroid J., 2009, A&A, 498, 961
- Romanyuk & Kudryavtsev (2008) Romanyuk I. I., Kudryavtsev D. O., 2008, Astrophysical Bulletin, 63, 139
- Romanyuk et al. (2014) Romanyuk I. I., Semenko E. A., Kudryavtsev D. O., 2014, Astrophysical Bulletin, 69, 427
- Romanyuk et al. (2015) Romanyuk I. I., Semenko E. A., Kudryavtsev D. O., 2015, Astrophysical Bulletin, 70, 444
- Ryabchikova et al. (2015) Ryabchikova T., Piskunov N., Kurucz R. L., Stempels H. C., Heiter U., Pakhomov Y., Barklem P. S., 2015, PhyS, 90, 054005
- Sargent (1964) Sargent W. L. W., 1964, ARA&A, 2, 297
- Scargle (1982) Scargle J. D., 1982, ApJ, 263, 835
- Shibahashi & Aerts (2000) Shibahashi H., Aerts C., 2000, ApJl, 531, L143
- Shultz et al. (2015) Shultz M., et al., 2015, MNRAS, 449, 3945
- Shultz et al. (2017) Shultz M., Wade G. A., Rivinius T., Neiner C., Henrichs H., Marcolino W., MiMeS Collaboration 2017, MNRAS, 471, 2286
- Shulyak et al. (2004) Shulyak D., Tsymbal V., Ryabchikova T., Stütz C., Weiss W. W., 2004, A&A, 428, 993
- Sikora et al. (2017) Sikora J., Wade G. A., Power J., 2017, preprint, (arXiv:1712.02811)
- Simón-Díaz & Herrero (2014) Simón-Díaz S., Herrero A., 2014, A&A, 562, A135
- Spruit (1999) Spruit H. C., 1999, A&A, 349, 189
- Stibbs (1950) Stibbs D. W. N., 1950, MNRAS, 110, 395
- Tkachenko (2015) Tkachenko A., 2015, A&A, 581, A129
- Tsymbal (1996) Tsymbal V., 1996, in Adelman S. J., Kupka F., Weiss W. W., eds, Astronomical Society of the Pacific Conference Series Vol. 108, M.A.S.S., Model Atmospheres and Spectrum Synthesis. p. 198
- Villebrun et al. (2016) Villebrun F., Alecian E., Bouvier J., Hussain G., Folsom C. P., 2016, in Reylé C., Richard J., Cambrésy L., Deleuil M., Pécontal E., Tresse L., Vauglin I., eds, SF2A-2016: Proceedings of the Annual meeting of the French Society of Astronomy and Astrophysics. pp 199–202
- Wade et al. (2016) Wade G. A., et al., 2016, MNRAS, 456, 2
- Watson et al. (2006) Watson C. L., Henden A. A., Price A., 2006, Society for Astronomical Sciences Annual Symposium, 25, 47
- Wraight et al. (2012) Wraight K. T., Fossati L., Netopil M., Paunzen E., Rode-Paunzen M., Bewsher D., Norton A. J., White G. J., 2012, MNRAS, 420, 757
- Zahn (2011) Zahn J.-P., 2011, in Neiner C., Wade G., Meynet G., Peters G., eds, IAU Symposium Vol. 272, IAU Symposium. p. 14, doi:10.1017/S1743921311009926
Appendix A Figures
Figures, showing the K2 photometry, rotational modulation, and the LSD profiles for all stars except HD 107000, are provided here. HD 107000 is shown in Fig. 1.