Gazing at the ultra-slow magnetar in RCW 103 with NuSTAR and Swift
Abstract
We report on a new NuSTAR observation and on the ongoing Swift XRT monitoring campaign of the peculiar source 1E 161348–5055, located at the centre of the supernova remnant RCW 103, which is recovering from its last outburst in June 2016. The X-ray spectrum at the epoch of the NuSTAR observation can be described by either two absorbed blackbodies ( 0.5 keV, 1.2 keV) or an absorbed blackbody plus a power law ( 0.6 keV, 3.9). The observed flux was 9 10-12 erg s-1cm-2, 3 times lower than what observed at the outburst onset, but about one order of magnitude higher than the historical quiescent level. A periodic modulation was detected at the known 6.67 hr periodicity. The spectral decomposition and evolution along the outburst decay are consistent with 1E 161348–5055 being a magnetar, the slowest ever detected.
keywords:
stars: neutron – stars: magnetars – stars: individual: 1E 161348–50551 Introduction
The discovery of 1E 161348–5055 (1E 1613 hereafter) dates back to the year 1980, when the Einstein observatory detected a point-like X-ray source laying close to the geometrical centre of the young ( 2 kyr; Carter et al. 1997) supernova remnant (SNR) RCW 103 (Tuohy & Garmire, 1980). 1E 1613 was identified as the first radio-quiet, cooling isolated neutron star (NS) in a SNR, characterized by soft thermal X-ray emission, lack of counterparts at other wavelengths and no detected pulsations. Since then, a few objects with similar properties had been observed in other SNRs and grouped in the class of ‘central compact objects’ (CCOs; see De Luca 2017 for a review). To date, this class includes a dozen of sources, including the recently CCO identified outside the Milky Way in the SNR 1E 0102.2-7219 (Vogt et al., 2018). Pulsations have been detected for three of them only, unveiling fast periods ( 0.5 s) and a weak dipolar magnetic field at the surface ( 1011 G).
During the last two decades, however, some remarkable features were observed in 1E 1613, separating it from the CCOs. Firstly, unlike the other CCOs that have generally a steady emission, 1E 1613 shows a strong flux variability on a month/year time scale. In 1999 it experienced an outburst that yielded an increase in flux by a factor of 100 (Garmire et al., 2000). Secondly, thanks to a long ( 90 ks) XMM–Newton observation that caught the source in a low state, a periodicity of 6.67 0.03 hr was revealed with a strong, almost sinusoidal modulation (De Luca et al., 2006). Although the 6.67 hr periodicity could be recognized in all the long-enough data sets, the corresponding pulse profile changed according to the source flux level: from sine-like shape when the source is in a low state (observed 0.5 – 8 keV flux 10-12 erg s-1cm-2) to more complex, multi-peaked configurations in high state ( 10-11 erg s-1cm-2). The long-term variability and the long periodicity have contributed to build a unique phenomenology in the NS scenario. Based on these characteristics, two main interpretations were put forward: 1E 1613 could be either a low-mass X-ray binary (LMXB) in a SNR (Bhadkamkar & Ghosh, 2009) or a peculiar isolated object with a rotational period of 6.67 hr (Li, 2007; De Luca et al., 2006). In the former hypothesis, the 6.67 hr periodicity would be the orbital period of the system. To explain the intriguing behaviour, an unusual double accretion mechanism, involving wind and accretion disk, was suggested (De Luca et al., 2006). On the other hand, considering the isolated-object hypothesis, the magnetar scenario would naturally account for the flux and pulse shape variations. Magnetars, isolated NSs powered by ultra-strong magnetic fields (typically 1013-14 G), are characterized by high-energy flaring events (e.g. short bursts and outbursts) and spin periods in the range 0.3 – 12 s (see Kaspi & Beloborodov 2017 for a review). An efficient braking mechanism needs to be invoked in order to slow down 1E 1613 from a fast birth period ( 0.5 s) to such a long rotational period in 2 kyr. Most models consider a propeller interaction with a fall-back disk that can provide an additional spin-down torque besides that due to dipole radiation. Ho & Andersson (2017) predict a remnant disk of 10-9 M⊙ around a rapidly rotating NS that initially is in an ejector phase, and after hundreds of years its rotation becomes slow enough to allow the onset of a propeller phase, during which strong slow-down torques cause an increase of the spin period. In order to reproduce the observational properties (the period of 6.67 hr and the young age), 1E 1613 is found to have a slightly higher magnetic field than known magnetars, 5 1015 G (for the surface dipolar component). Tong et al. (2016) considered a similar model but obtained a larger disk mass of 10-5 M⊙ and a comparable magnetic field strength.
Recently, a new event shed light on the nature of this source: on 2016 June 22 a short magnetar-like burst of hard X-rays from the direction of RCW 103 triggered the Neil Gehrels Swift Observatory (Swift) Burst Alert Telescope (BAT). The Swift X-ray Telescope (XRT) was observing the source till 20 minutes before the BAT trigger and detected a 1 – 10 keV flux enhancement of a factor of 100 with respect to the quiescent level ( 10-12 erg s-1cm-2), measured one month before (D’Aì et al., 2016a; Rea et al., 2016). Target of Opportunity observations were performed a few days later with Chandra and the Nuclear Spectroscopic Telescope Array (NuSTAR). NuSTAR detected a hard X-ray, non-thermal component up to 30 keV, modelled by a power law with photon index = 1.20 0.25 and pulsed till 20 keV; on the other hand, the soft Chandra spectrum is well described by two blackbodies (Rea et al., 2016). The light curves exhibit two peaks per cycle, in contrast with the sinusoidal shape observed during the quiescent state (Esposito et al., 2011). This outburst prompted new searches for an infrared counterpart. The Hubble Space Telescope observed 1E 1613 twice after the burst (Tendulkar et al., 2017). The images disclosed a new object in the Chandra position ellipse, not detected in previous observations acquired in 2002. The counterpart properties rule out the binary scenario: the 2002 upper limits and the new detection would be consistent with a compact hydrogen atmosphere white dwarf as a companion; the high surface gravity of this object implies a star radius 5000 km. This radius is smaller than the orbital radius (1.7 106 km) and the corresponding Roche lobe radius for a binary system of a white dwarf and a NS orbiting with a 6.67 hr period. As a consequence, accretion cannot occur and power the X-ray flux variations. Furthermore, the X-ray to infrared fluence ratio of 105 is compatible with the one measured for magnetars (Mignani 2011; see also the McGill Magnetar Catalog111 http://www.physics.mcgill.ca/~pulsar/magnetar/main.html). However, it is not clear whether the emission comes from the NS magnetosphere or from a fall-back disk. The properties of the outbursts, the discovery of a non-thermal hard component in the spectrum and an infrared counterpart, the pulse profile variability in time and energy are all hints that point towards the magnetar scenario.
Here we report on a new NuSTAR observation of 1E 1613, performed 345 days after its last outburst, and a long-term Swift XRT monitoring campaign, focusing on the observations carried out from the onset of the 2016 outburst till October 2017. Data reduction is described in Section 2; analysis and results follow in Section 3. Finally, our findings are discussed in Section 4.
2 Observations and data reduction
1E 1613 was observed simultaneously with NuSTAR and Swift on 2017 June 2. In addition, a Swift XRT monitoring campaign has been carried out since 2006 with monthly observations. Data reduction was performed using tools incorporated in heasoft (version 6.22). We report uncertainties at 1 confidence level for a single parameter of interest, unless otherwise noted. Throughout this work we use the most accurate position of 1E 1613 derived by De Luca et al. (2008) from Chandra data, and (J2000.0), and a distance of 3.3 kpc (Caswell et al., 1975).
2.1 NuSTAR
NuSTAR is the first focusing hard X-ray space observatory, launched on 2012 June 13 (Harrison et al., 2013). It consists of two co-aligned optics focused onto two focal planes (FPMA and FPMB), observing the sky in the energy range from 3 to 79 keV. Its effective collecting area peaks at 900 cm2 around 10 keV, adding up the two modules. It achieves an energy resolution of 400 eV at 10 keV and an angular resolution of 18′′ full width at half maximum.
NuSTAR observed 1E 1613 between 2017 June 2 and 3, for a total dead-time corrected on-source exposure time of 59.7 ks and 57.9 ks for FPMA and FPMB, respectively (observation ID: 30301017002222Both modules are contaminated by stray light (photons that are not reflected by the focusing mirror); the pattern is more evident on a chip different from that of the source.). We reprocessed the data using the calibration files caldb version 20171002. We ran the tool nupipeline to generate cleaned event lists and remove the passages of the observatory through the South Atlantic Anomaly. Afterwards, we referred the photon arrival times to the Solar system barycentre reference frame by means of the barycorr task, using the Solar system ephemeris DE200, the Chandra CCO position and version 75 of the NuSTAR clock correction file that accounts for drifts caused by temperature variations. We extracted the source photons from a circular region of radius 40′′ and the background counts through two different regions, a 60′′- and 100′′-radius circles, far from the source location, but on the same chip. Due to the nuproducts script, we produced light curves, background-subtracted spectra and the corresponding redistribution matrices and ancillary response files separately for both focal plane modules. The energy channels outside the range 3 – 79 keV were flagged as bad.
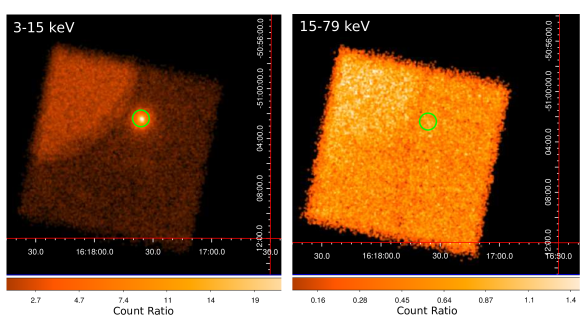
We studied the signal-to-noise ratio (S/N) of the point source with XIMAGE in energy bands of increasing width (3 – 10 keV, 3 – 11 keV, etc.). We detected 1E 1613 with a S/N 64 in the 3 – 15 keV energy range. Above 15 keV the S/N ceased to increase, implying that the source emission starts to be comparable to the background level at this energy. The source net count rates were 0.057 0.001 counts s-1 and 0.051 0.001 counts s-1 for FPMA and FPMB, respectively, in the 3 – 15 keV energy range. Figure 1 shows the exposure corrected-images in two different energy bands (3 – 15 keV and 15 – 79 keV) for the combined event file of FPMA and FPMB data.
2.2 Swift
Swift XRT is a focusing X-ray telescope with a 110 cm2 effective area at 1.5 keV and a 24-arcmin field of view, sensitive to photons in the energy range 0.2 – 10 keV (Burrows et al., 2005). Its CCD detector can be operated in two main readout modes: photon counting (PC) and windowed timing (WT). PC mode retains full imaging resolution with a time resolution of 2.51 s; while in WT mode only one dimensional information is preserved with a 1.77 ms time resolution.
1E 1613 was observed by XRT 52 times since the onset of its last outburst on 2016 June 22 and until 2017 October 16333On 2017 June 2, simultaneously to NuSTAR, XRT observed 1E 1613 for a total dead-time corrected on-source time of 6.4 ks in WT mode and 160 s in PC mode (observation ID: 00088149001). To study the SNR contamination in the WT mode data, we extracted its spectrum from different regions and found that the SNR emission is still bright over 2 keV, making it challenging to discern properly the source contribution. Therefore, we preferred not to include this observation in our analysis.. The single exposure lengths varied between 0.4 and 6.4 ks, summing up to a total of 41.8 ks of dead-time corrected on-source exposure time. The monitoring campaign was rather intensive until the end of 2016 October (about 2 – 4 observations per week), when the source entered a solar constraint. Observations resumed in 2017 mid-January, and were subsequently performed on a monthly cadence as part of our approved monitoring program (PI: De Luca). The XRT was configured in PC mode in all observations.
We reprocessed the data with standard screening criteria, generated exposure maps with the task xrtpipeline and referred the photon arrival times to the Solar system reference frame using the barycorr tool and the best source position. Source and background counts were extracted adopting the same regions as in Rea et al. (2016, see also ): a circle of radius 10 pixels for the source photons and an annulus of inner and outer radii of 10 and 20 pixels for the background counts (1 XRT pixel corresponds to about 2.36 arcsec). We extracted the corresponding spectra using xselect and created auxiliary files with the xrtmkarf tool. The response matrice version ‘20130101v014’ available in the XRT calibration database was assigned to each spectrum.
3 Analysis and results
3.1 Timing analysis
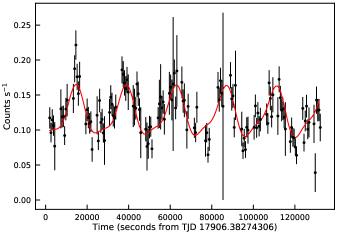
The 3 – 15 keV NuSTAR events were used to study the timing properties of the source. To obtain a rough estimate of the period, we fitted the source light curve with a constant plus two sinusoidal functions (see Figure 2). The significance for the inclusion of the first harmonic was evaluated via the -test. This yielded a probability of 5 10-4 (3.6), showing that such a component was statistically required to improve the fit. The best fit gave a fundamental period of 24061 130 s (the first harmonic period was forced to be half of the period). We refined this result using an epoch folding search technique. We found a period = 24030 40 s, where the error was evaluated as the 1 sigma uncertainty on the width of the best-fitting Gaussian function used to model the peak in the trial period distribution. The value is compatible with the solution reported by Esposito et al. (2011).
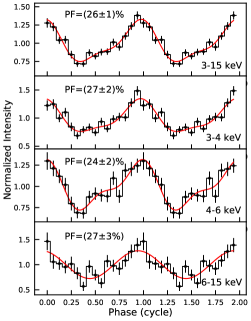
We then folded the background-subtracted and exposure-corrected light curves, sampled in 16 phase bins, on the best period . We studied the pulse profile in different energy bands, as shown in Figure 3. The pulse profile changes shape as the energy increases. In the 3 – 4 keV and 4 – 6 keV energy ranges two sinusoidal functions are necessary to model properly the data (-test probability of 0.003 and 3 10-5, respectively), while in the 6 – 15 keV energy band only one sinusoid is sufficient (-test probability of 0.6 for the inclusion of the first harmonic). The pulsed fraction, defined as the semi-amplitude of the fundamental component divided by the source average count rate, did not show any dependency on the energy, being consistent within the errors in the different ranges considered and varying between 25 and 28 per cent without a clear tend. In the 3 – 15 keV band the pulsed fraction inferred value was (25.6 1.2) per cent, a factor of 2 higher than the value measured at the outburst onset, (14.0 0.7) per cent.
Moreover, hardness ratios were computed considering different energy ranges with a comparable photon count statistics, and revealed no significant spectral variations along the rotational phase cycle.
3.2 Spectral analysis
All the background-subtracted spectra were grouped in order to have at least 20 photon counts in each energy channel. The spectral modelling was performed within the xspec analysis package (version 12.9.1m, Arnaud 1996) and using the statistics. To describe the absorption by the interstellar medium along the line of sight, the tbabs model was adopted with photoionization cross-sections from Verner et al. (1996) and chemical abundances from Wilms, Allen & McCray (2000). Once a best fit was found, we applied the convolution model cflux to calculate the observed, unabsorbed fluxes and associated uncertainties.
3.2.1 Phase-averaged spectral analysis
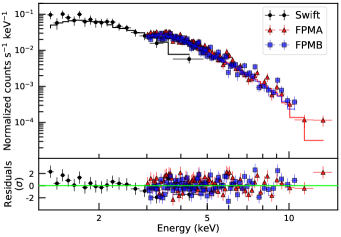
To model the spectra in a wider energy range than the one covered by NuSTAR alone, we fit simultaneously the spectra for both NuSTAR FPMs together with a Swift XRT spectrum acquired 14 days later (ID: 00030389061). We restricted the energy range to 1 – 15 keV, where the source was not background dominated.
At the outburst peak (2016 June 25), the 1 – 30 keV spectrum was well described by a three-component model consisting of two blackbodies with temperatures = 0.52 0.01 keV and = 0.93 0.05 keV, and inferred radii = 2.7 0.7 km and = 0.4 0.2 km, with the addition of a power law with photon index = 1.20 0.25 to model the hard X-ray tail (2BB+PL hereafter; Rea et al., 2016). As a first step, we tried to fit the new spectra with the above-mentioned model, freezing all the parameters at the outburst peak values and including an overall constant to take into account the decay in flux. This approach led to an unacceptable fit (reduced chi-square = 2.34 for 190 degrees of freedom (dof)); residuals show an overestimation of the emission at high energies ( 6 keV). Allowing all the parameters to vary, we found the following results for the blackbody components: = 0.54 0.02 keV, = 1.46 km, = 1.17 keV, and = 0.09 km; while the power law component was not constrained (= 1.08 for 184 dof). These outcomes suggested that the spectral shape has simplified since the outburst onset, without the need for a third spectral component to model the data.
Therefore, as a next step, we tested the combination of two blackbodies (2BB) and the superposition of a blackboby and a power law (BB+PL). For all spectral fits, a renormalization factor was included to account for calibration uncertainties between different instruments and flux differences. We note that the XRT observation is much shorter than a phase cycle ( 1/8) and, thus, samples a small interval of the rotational phase cycle. In view of the large flux modulation along the profile, XRT data could deviate from the averaged flux probed by NuSTAR. For the XRT spectrum the factor was kept equal to 1, while for NuSTAR spectra it was allowed to vary and was found to be consistent with 1 within the errors for both FPMs.
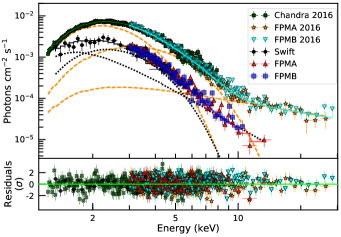
To better constrain the hydrogen column density , we fit simultaneously the new data sets with those acquired in 2016 at the outburst peak (see Rea et al., 2016, for details about the data reduction). This parameter was tied across all the six spectra; its inferred value was (2.3 0.1) 1022 cm-2 for the 2BB model and (2.4 0.1) 1022 cm-2 for the BB+PL model. The 2BB and BB+PL models provided a statistically equivalent fit with a = 1.09 for 861 dof. For the former, the best fit gave the following results: = 0.51 0.01 keV, = 1.71 km, = 1.17 keV, and = 0.10 0.02 km. We note that the hotter blackbody has a temperature higher than that at the outburst onset and the corresponding hotspot had shrunk of a factor of 4. This component is most likely mimicking residual emission at higher energy; Figure 5, left panel, shows the spectra fitted with this model and the post-fit residuals. Adopting the BB+PL model, the spectra are described by a blackbody with = 0.57 0.01 keV and = 1.07 km, plus a soft power law with = 3.9 0.1 and normalization of (1.7 0.4) 10-2. The 0.5-30 keV observed flux was (9.3 0.3) 10-12 erg s-1cm-2, with a fractional contribution of 98% from the 0.5 – 10 keV energy band. The corresponding unabsorbed flux was (1.99 0.08) 10-11 erg s-1cm-2 which translates into a luminosity of (2.6 0.1) 1034 erg s-1. These results are indicative of an anisotropic distribution of the surface temperature, as already observed in other magnetars and theoretically predicted (Perna et al., 2013). For the 2016 data sets we retained the 2BB+PL model and obtained results consistent within the errors with those presented in our previous work for the two blackbody components, whereas we got a slightly steeper power law with a photon index = 1.8 0.2 and a normalization of (5.7) 10-4. Figure 5, right panel, shows the unfolded spectra relative to the latest observations and to the outburst onset, fitted simultaneously, and the residuals with respect to the BB+PL model for the former and the 2BB+PL model for the latter.
In order to check if the random sampling of the Swift data along the phase cycle could affect the spectral fitting results, we performed again the analysis including the XRT spectrum collected 15 days before the NuSTAR data (ID: 00030389060). Also this XRT observation has an exposure time equal to 1/8 of the rotational period. The values of the spectral parameters are compatible within the errors with those reported above. Moreover we verified that the spectral modelling results were not affected by the size and location of the background extraction region. Table 1 summarises the spectral fitting results; for a discussion about the physical interpretations of the adopted models see Section 4.
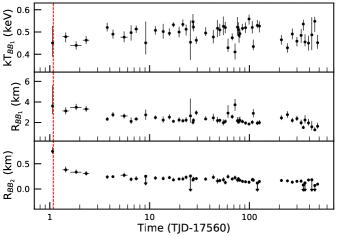
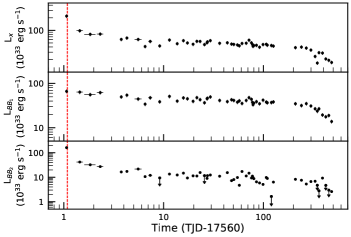
While the individual Swift observations do not have the photon statistics necessary for a detailed spectral analysis, they are useful to study the luminosity evolution of the source. We restricted the spectral modelling to the 1 – 10 keV energy band and adopted a two-component model, without including the hard power law discovered at the outburst peak. This non-thermal component is a transient feature of the source spectrum and its contribution to the source flux was significant above 10 keV, i.e. outside the energy interval covered by XRT. We fit all the spectra together, fixing the absorption value to be the same among all of them. We chose an absorbed double blackbody model in order to follow the evolution of the hotter component, that is possibly linked to the outburst mechanism. The effective temperature for the hotter blackbody was initially left free to vary across the data sets; however it was found to be poorly constrained in the single exposures. Therefore we decided to tie the hotter blackbody temperature across all the spectra, to better constrain the time evolution of the size of the emitting region for the hotter component. We obtained an acceptable description of the data ( for 2511 dof), with cm-2, keV. We measured a shrinking of the hotter blackbody emitting area: the inferred radius decreased from 0.7 km, measured at the onset, to 0.1 km, about 480 days later. The time evolution of the best-fitting model parameters, the luminosities of the single components and of the total emission (all in the 0.5 – 10 keV energy band) are shown in Figure 4.
| Model | / | /PL norma | (dof) | |||||
|---|---|---|---|---|---|---|---|---|
| (1022 cm-2) | (keV) | (km) | (keV)/- | (km)/(10-2) | (10-12 erg s-1cm-2) | (1034 erg s-1) | ||
| 2BB | 2.3 0.1 | 0.51 0.01 | 1.71 | 1.17 | 0.10 0.02 | 9.1 0.1 | 2.5 0.1 | 1.09 (861) |
| BB+PL | 2.4 0.1 | 0.57 0.01 | 1.07 | 3.9 0.1 | 1.7 0.4 | 9.3 0.3 | 2.6 0.1 | 1.09 (861) |
-
a
The power law normalization is in units of photons/keV/cm2/s at 1 keV.
3.2.2 Phase-resolved spectral analysis
To study the spectral variation as a function of the rotational phase, we produced a normalized energy versus phase image for the combined FPMA and FPMB event file, binning the source counts in 100 rotational phase bins and 150 energy channels, and then normalizing it to the pulse profile and phase-averaged spectrum. The energy range was narrowed to 3 – 15 keV, where the source was detected, and we used our best period ( = 24030 s) to calculate the phase. This method allowed us to investigate the presence of spectral feature that vary with the phase and/or energy (as observed in the magnetar SGR 0418+5729; Tiengo et al. 2013), without assuming a specific spectral energy distribution. No significant features were detected in the normalized image; we also tried different binnings and found the same result.
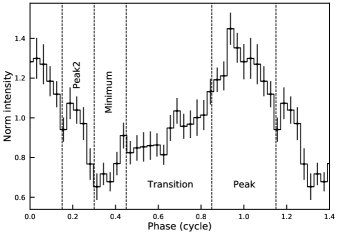
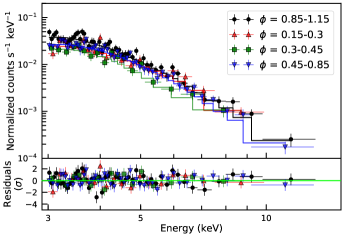
We then carried out a phase-resolved spectroscopy for NuSTAR FMPA data to analyse distinct features in the pulse profile. We divided the phase cycle in four intervals: 0.3 – 0.45 (corresponding to the minimum of the modulation), 0.45 – 0.85 (referred to as a transition region), 0.85 – 1.15 (related to the main peak) and 0.15 – 0.3 (where a second, less prominent peak of marginally significance is present; see Figure 6, left panel).
The spectral analysis was performed assuming the BB+PL model in the energy range 3 – 15 keV and the was fixed to the phase-averaged value ( = 2.4 1022 cm-2). Firstly, we only left the normalizations of each component free to vary, while the blackbody temperature and photon index were fixed to their best fit values for the phase-averaged spectrum. This fit gave a satisfactory description of the spectra with a = 0.94 (130 dof); we note that the size of the blackbody emitting area increases along the phase cycle, while the normalization of the power law is consistent within the error for the different phase-resolved spectra. Allowing all the parameters to vary among the spectra yielded a statistically equivalent fit (= 0.93 for 130 dof). The spectral parameters do not show any significant variability as a function of the 24-ks periodicity.
4 Discussion
We reported on a new NuSTAR observation (the second performed so far in the hard X-rays) of the compact object at the center of the SNR RCW 103, 1E 1613, performed 345 days after the onset of its last outburst, as well as on a Swift XRT monitoring campaign that covered a timespan of 480 days of the outburst decay. The monitoring campaign resumed at the beginning of 2018 with one observation per month (PI: De Luca); the updated results will be available at the Magnetar Outburst Online Catalogue444http://magnetars.ice.csic.es (Coti Zelati et al., 2018).
About one year after the last flaring event, the source is above the background level up to 15 keV. The X-ray spectrum can be well reproduced by an absorbed blackbody with the addition of another component at higher energy (either a second blackbody or a power law), with no need for an additional power-law like component (as detected up to 30 keV at the outburst peak; Rea et al. 2016). This clearly indicates a softening of the source emission with time. The colder blackbody component attains a relatively constant temperature 0.5 – 0.6 keV during the outburst decay, whereas the corresponding emitting region is shrinking. The inferred 0.5 – 10 keV observed flux at the epoch of the NuSTAR observation was 9 10-12 erg s-1cm-2, about one order of magnitude higher than the historical quiescent level measured by Chandra in 1999 (Garmire et al., 2000) and smaller by a factor of 3 than what was observed at the outburst onset, in June 2016.
4.1 Comparison with magnetars
The superposition of two blackbodies or a blackbody plus a power law is usually applied to describe soft X-ray emission from magnetars (see Coti Zelati et al., 2018, Table 2). In magnetars, this is generally interpreted as the thermal emission associated with the cooling of the NS surface that could be distorted by resonant cyclotron scattering of thermal photons from the surface onto the charged particles flowing in a twisted magnetosphere. Thermal photons produced at the surface gain energy through repeated scatterings with charged particles that flow along the magnetic field lines, leading to the formation of a tail at higher energy, that often is modelled with a power law.
Considering the similarities between the members of the magnetar class
and this source, we performed a fit of the most recent NuSTAR data with
a more physical model, the NTZ model, that accounts for resonant
cyclotron up-scattering of the soft seed photons
(Nobili, Turolla & Zane, 2008a, b). This model assumes a
uniformly heated NS surface and a globally twisted magnetosphere. We
obtained a satisfactory description of the data (= 1.08 for
186 dof) by leaving all the parameters free to vary, deriving
constraints for the bulk velocity of the charged particles in the
magnetosphere ( = 0.205) and the
twist angle ( = 0.48 0.02 rad), while the values
inferred for the hydrogen column density and the surface temperature
are consistent with the results presented in Section
3.2.1. For comparison we also fit the NTZ model to the data
sets acquired at the outburst onset. In this case, an additional power
law component was required to model the hard non-thermal tail. We
obtained an acceptable modelling of the spectra (= 1.14 for
676 dof). The bulk velocity was consistent with the previous
measurement, while the twist angle was 0.72 0.02 rad. The fact
that the NTZ model provides a good fit at both epochs is an indication
of the presence of some magnetospheric distortion (e.g. twisted
magnetic field lines). Although some caveats should be adopted in
interpreting the time evolution of the parameters inferred from the
NTZ model (as it assumes a global twist of the magnetosphere), the
decrease in the twist angle suggests a gradual untwisting of the star
magnetosphere, as expected for magnetars while recovering from their
outburst.
Furthering the magnetar analogy, the detection of a small hot spot on
the NS surface at the outburst peak (Rea et al., 2016) is
suggestive of a scenario in which the magnetic twist is localized in a
limited area of the magnetosphere, most likely in the form of a
current-carrying bundle of field lines
(Beloborodov, 2009). Once formed due to crust
displacements (triggered by internal magnetic stresses, Thompson &
Duncan 1995; Perna &
Pons 2011),
the bundle has to decay to support its own currents and its gradual dissipation
leads to a reduction of the region at the footprints of the
twist. This interpretation is in agreement with the shrinking of the
hotter thermal component, qualitatively observed thanks to the
Swift monitoring campaign. Furthermore, when the bundle untwists,
the charged particle density decreases, as well as the scattering
optical depth, making the resonant cyclotron scattering less
efficient. This implies that the hard X-ray tail filled up by
up-scattered thermal photons becomes less populated, producing an
overall softening of the spectrum during the outburst decay. This
behaviour is commonly observed in other magnetar outburst decays
(Rea &
Esposito, 2011; Coti Zelati et al., 2018).
The prolonged Swift XRT monitoring allowed us to refine the empirical modelling of the outburst decay light curve. Following Rea et al. (2016) and Coti Zelati et al. (2018), we fitted to the data points a double exponential function plus a constant term of the form:
| (1) |
where represents the -folding time and can be used as an estimate of the time scale of the decay. In the fit, was fixed to the quiescent value measured with Chandra in 1999 September, erg s-1. Best fitting parameters were d, d, erg s-1, erg s-1. We consider d as the fundamental time scale of the outburst decay, as it traces the long-term evolution of the light curve after the faster but short-lived (on a characteristic time scale d ) flux decrease observed immediately after the onset of the outburst. Extrapolation of this phenomenological model up to the approximate epoch of return to the quiescent state ( 2021, as predicted by the model) leads to an estimated released energy of about erg. This is only slightly lower than the value computed using a smaller number of data points (Coti Zelati et al., 2018).
1E 1613 clearly follows several different correlations observed in magnetars (see Fig. 3, 6 and 8 by Coti Zelati et al. 2018). For example, it follows the anti-correlation between the quiescent X-ray luminosity and the outburst luminosity increase. This relation strongly suggests that magnetars in outburst cannot exceed a luminosity of erg s-1 at the peak; 1E 1613 reached a maximum luminosity of erg s-1 in its last outburst, a factor of above the quiescent X-ray luminosity. For magnetars a correlation between the total energy emitted during the outburst and the maximum luminosity reached at the outburst onset is significant at 4, implying that the more energetic outbursts reach a larger peak luminosity. Moreover, the total outburst energy correlates with the time scale of the decay, meaning that the longer the outburst, the more energetic. The above-mentioned updated and refined values for the total energy and the decay time scale further corroborate a (phenomenological) classification of 1E 1613 as a magnetar. In fact, although 1E 1613 has not reached its quiescent level yet, the energy released of 2 1042 erg and the decay time scale of 400 d are so far in agreement with what is expected from magnetars, following the above-mentioned correlation. We point out that 1E 1613 represents the only case so far that allows us to highlight such a phenomenological link between the members of the CCO class and magnetars, since all other known CCOs are steady X-ray emitters. Future detections of outbursts from known CCOs might help strengthen such a connection.
Acknowledgements
The results reported in this article are based on observations obtained with Swift and NuSTAR. Swift is a NASA mission with participation of the Italian Space Agency and the UK Space Agency. The NuSTAR mission is a project led by the Californian Institute of Technology. AB, PE and NR are supported by an NWO Vidi Grant (PI: Rea). FCZ and NR are supported by grants AYA2015-71042-P and SGR 2014-1073. We thank the PHAROS COST Action (CA16214) for partial support and the referee for the comments.
References
- Arnaud (1996) Arnaud K. A., 1996, in Jacoby G. H., Barnes J., eds, Astronomical Society of the Pacific Conference Series Vol. 101, Astronomical Data Analysis Software and Systems V. p. 17
- Beloborodov (2009) Beloborodov A. M., 2009, ApJ, 703, 1044
- Bhadkamkar & Ghosh (2009) Bhadkamkar H., Ghosh P., 2009, A&A, 506, 1297
- Burrows et al. (2005) Burrows D. N., et al., 2005, Space Sci. Rev., 120, 165
- Carter et al. (1997) Carter L. M., Dickel J. R., Bomans D. J., 1997, PASP, 109, 990
- Caswell et al. (1975) Caswell J. L., Murray J. D., Roger R. S., Cole D. J., Cooke D. J., 1975, A&A, 45, 239
- Coti Zelati et al. (2018) Coti Zelati F., Rea N., Pons J. A., Campana S., Esposito P., 2018, MNRAS, 474, 961
- D’Aì et al. (2016a) D’Aì A., et al., 2016a, MNRAS, 463, 2394
- D’Ai et al. (2016b) D’Ai A., et al., 2016b, The Astronomer’s Telegram, 9180
- De Luca (2017) De Luca A., 2017, Journal of Physics: Conference Series, 932, 012006
- De Luca et al. (2006) De Luca A., Caraveo P. A., Mereghetti S., Tiengo A., Bignami G. F., 2006, Science, 313, 814
- De Luca et al. (2008) De Luca A., Mignani R. P., Zaggia S., Beccari G., Mereghetti S., Caraveo P. A., Bignami G. F., 2008, ApJ, 682, 1185
- Esposito et al. (2011) Esposito P., Turolla R., de Luca A., Israel G. L., Possenti A., Burrows D. N., 2011, MNRAS, 418, 170
- Garmire et al. (2000) Garmire G. P., Garmire A. B., Pavlov G., Burrows D. N., 2000, in AAS/High Energy Astrophysics Division #5. p. 1237
- Harrison et al. (2013) Harrison F. A., et al., 2013, ApJ, 770, 103
- Ho & Andersson (2017) Ho W. C. G., Andersson N., 2017, MNRAS, 464, L65
- Kaspi & Beloborodov (2017) Kaspi V. M., Beloborodov A. M., 2017, ARA&A, 55, 261
- Li (2007) Li X.-D., 2007, ApJ, 666, L81
- Mignani (2011) Mignani R. P., 2011, Advances in Space Research, 47, 1281
- Nobili et al. (2008a) Nobili L., Turolla R., Zane S., 2008a, MNRAS, 386, 1527
- Nobili et al. (2008b) Nobili L., Turolla R., Zane S., 2008b, MNRAS, 389, 989
- Perna & Pons (2011) Perna R., Pons J. A., 2011, ApJ, 727, L51
- Perna et al. (2013) Perna R., Viganò D., Pons J. A., Rea N., 2013, MNRAS, 434, 2362
- Rea & Esposito (2011) Rea N., Esposito P., 2011, Astrophysics and Space Science Proceedings, 21, 247
- Rea et al. (2016) Rea N., Borghese A., Esposito P., Coti Zelati F., Bachetti M., Israel G. L., De Luca A., 2016, ApJ, 828, L13
- Tendulkar et al. (2017) Tendulkar S. P., Kaspi V. M., Archibald R. F., Scholz P., 2017, ApJ, 841, 11
- Thompson & Duncan (1995) Thompson C., Duncan R. C., 1995, MNRAS, 275, 255
- Tiengo et al. (2013) Tiengo A., et al., 2013, Nature, 500, 312
- Tong et al. (2016) Tong H., Wang W., Liu X. W., Xu R. X., 2016, ApJ, 833, 265
- Tuohy & Garmire (1980) Tuohy I., Garmire G., 1980, ApJ, 239, L107
- Verner et al. (1996) Verner D. A., Ferland G. J., Korista K. T., Yakovlev D. G., 1996, ApJ, 465, 487
- Vogt et al. (2018) Vogt F. P. A., Bartlett E. S., Seitenzahl I. R., Dopita M. A., Ghavamian P., Ruiter A. J., Terry J. P., 2018, preprint, (arXiv:1803.01006)
- Wilms et al. (2000) Wilms J., Allen A., McCray R., 2000, ApJ, 542, 914