The Next Generation Fornax Survey (NGFS): IV. Mass and Age Bimodality of Nuclear Clusters in the Fornax Core Region
Abstract
We present the analysis of 61 nucleated dwarf galaxies in the central regions () of the Fornax galaxy cluster. The galaxies and their nuclei are studied as part of the Next Generation Fornax Survey (NGFS) using optical imaging obtained with the Dark Energy Camera (DECam) mounted at Blanco/CTIO and near-infrared data obtained with VIRCam at VISTA/ESO. We decompose the nucleated dwarfs in nucleus and spheroid, after subtracting the surface brightness profile of the spheroid component and studying the nucleus using PSF photometry. In general, nuclei are consistent with colors of confirmed metal-poor globular clusters, but with significantly smaller dispersion than other confirmed compact stellar systems in Fornax. We find a bimodal nucleus mass distribution with peaks located at and . These two nucleus sub-populations have different stellar population properties, the more massive nuclei are older than Gyr and have metal-poor stellar populations (), while the less massive nuclei are younger than Gyr with metallicities in the range . We find that the nucleus mass () vs. galaxy mass () relation becomes shallower for less massive galaxies starting around and the mass ratio shows a clear anti-correlation with for the lowest masses, reaching . We test current theoretical models of nuclear cluster formation and find that they cannot fully reproduce the observed trends. A likely mixture of in-situ star formation and star-cluster mergers seem to be acting during nucleus growth over cosmic time.
1 Introduction
Dwarf galaxies dominate the galaxy number density in dense environments. Whether they contain a compact stellar nucleus at their centers, or not, is an important distinction among the dwarf galaxy population. Nuclear clusters are very dense stellar systems with sizes similar to globular cluster (GCs, pc) (Böker et al., 2004; Côté et al., 2006; Turner et al., 2012; den Brok et al., 2014; Georgiev & Böker, 2014; Puzia et al., 2014) but with a broader range of masses (e.g., Walcher et al., 2006; Georgiev et al., 2016; Spengler et al., 2017). Nuclei are a common characteristic in galaxies, from dwarfs to giants. The nucleation fraction can reach around 70-80 and is independent of the galaxy morphology (Böker et al., 2004; Côté et al., 2006; Georgiev et al., 2009; Turner et al., 2012; den Brok et al., 2014; Georgiev & Böker, 2014; Muñoz et al., 2015; Eigenthaler, et al., 2018). However, the nucleation fraction decreases with luminosity (e.g., Muñoz et al., 2015), going from as high as for galaxies brighter than mag to for mag. This may be related to instrument sensitivity limits, beyond which it becomes harder to detect the lowest surface brightness spheroids and, thus, to associate a nucleus with a low-surface-brightness galaxy spheroid. Towards the bright galaxy regime, it has been noticed that nuclei are no longer detected for galaxies with mag. This might be related to the fact that the central parsecs of bright galaxies can have complex surface brightness profiles, which makes it difficult to separate the galaxy light from the nucleus light, if at all present (e.g. Côté et al., 2006; Turner et al., 2012). Another reason is that central super massive black holes (SMBHs) co-existing with nuclear clusters can dissolve the central cluster if the SMBH is massive enough, increasing its sphere of influence to radii similar to those of the nuclear cluster (e.g. Antonini, 2013).
Nuclear cluster studies have revealed several correlations between nuclei and their host galaxy, such as the nucleus to galaxy mass relation, their velocity dispersion and galaxy mass111For late-type galaxies, this would be the bulge mass., and the size-luminosity relation (Böker et al., 2004; Turner et al., 2012; Georgiev & Böker, 2014; den Brok et al., 2014; Spengler et al., 2017). These correlations indicate a connection between the nucleus and the formation of its parent galaxy. Furthermore, the stellar population properties of nuclei seem to be more complex than first thought, revealing multiple stellar populations rather than being old and metal-poor objects. Using spectra, Rossa et al. (2006) found in a sample of 40 late-type galaxies (LTGs) that the luminosity weighted ages of half of the nuclei is younger than 1 Gyr, within a range from 10 Myr to very old ages Gyr (see also Walcher et al., 2006). For 26 early-type galaxies (ETGs) in the Virgo cluster, Paudel et al. (2011) found spectroscopic evidence that the age distribution of nuclei is dominated by young ages. In terms of metallicity, their work revealed a broad metallicity distribution of the nuclei, from dex to dex, which was wider compared to the host galaxy metallicity range. When analyzing age and metallicity distributions in radial profiles using bins along the major axis of the dwarf galaxies, Paudel et al. found that the inner bins are dominated by young ages and broader metallicity distributions than outer regions. Spengler et al. (2017) observed in Virgo cluster galaxies that, on average, the nuclei and host galaxies have similar metallicities with a mean metallicity of dex, but if they exclude the galaxies that deviate from the mass-metallicity relation then nuclei are on average dex more metal-rich than their host galaxies. Clearly, conducting deep, homogeneous, panchromatic nuclear cluster searches, based on wide-field imaging data will allow us to focus on the faint and bright nucleated galaxy regime at the same time and may help put some of these seemingly contradicting observations in context.
Considerable observational efforts were recently undertaken to map the nearby galaxy cluster regions in Virgo and Fornax, with deep, homogeneous, wide-field surveys reaching low surface-brightness dwarf galaxies ( mag arcsec-2, see e.g. Ferrarese et al., 2012; Mihos et al., 2005, 2017; Muñoz et al., 2015; Eigenthaler, et al., 2018). This is the case for the Next Generation Fornax Survey (NGFS) that covers a large area of the Fornax galaxy cluster with optical and near-infrared observations. The NGFS team has identified 258 dwarf galaxy candidates in the central Fornax regions ( kpc). From the total sample (258) only 75 dwarfs are nucleated (29%) (Eigenthaler, et al., 2018). So far, the faintest nucleated dwarf candidate in the NGFS sample has an absolute magnitude of mag, indicating that the luminosity ratio between the nucleus and the host spheroid is significantly higher for the faint galaxies than previously thought. Earlier studies of bright ETGs found in Fornax (Turner et al., 2012) and for Virgo (Côté et al., 2006). The NGFS sample pushes the study of galaxy nuclei into the faint luminosity regime. In dense galaxy cluster environments, nucleated galaxies have been studied up to now in galaxies brighter than mag in Fornax and Virgo (Turner et al., 2012; Côté et al., 2006) using the Advance Camera Survey (ACS) in the Hubble Space Telescope (HST), with a sample of 31 and 45 nuclei, respectively.
In this work we explore, for the first time, the faint nucleated dwarf galaxy luminosity regime in terms of their photometric properties and scaling relations. We assume a distance modulus of mag for Fornax, which corresponds to a distance of Mpc (Blakeslee et al., 2009). The derived magnitudes in optical passbands are all in the AB system and the NIR magnitudes where transformed from Vega to the AB system using mag and mag (Blanton & Roweis, 2007).
2 Observations
The Next Generation Fornax Survey (NGFS) is an ongoing deep multi-wavelength survey that covers the entire Fornax galaxy cluster out to its virial radius (1.5 Mpc). NGFS uses the Cerro Tololo Inter-American Observatory (CTIO) 4-meter Blanco telescope in combination with the Dark Energy Camera (DECam Flaugher et al., 2015) for optical photometry, as well as the European Southern Observatory (ESO) 3.7-meter VISTA telescope and VIRCam (Sutherland et al., 2015) for near-infrared (NIR) photometry. The current NGFS survey footprint covers 50 deg2 with 19 DECam tiles of 2.65 deg2 each, and detects point-sources at S/N down to , , , and AB mag, which corresponds to the GC luminosity function (GCLF) turnover at mag (e.g., Rejkuba, 2012).
Details on the reduction process and photometry will be provided in a forthcoming paper (Puzia et al. 2018, in prep.). In the following, we give a brief summary of the main survey characteristics. The DECam data have been processed using the basic calibrated images delivered by the DECam Community pipeline (v2.5.0 Valdes et al., 2014), which were corrected for bias, flat fielding, and image crosstalk. In subsequently steps, we applied our custom background subtraction strategy. The astrometry, photometric calibration and stacking were performed with the software SCAMP (v2.2.6, Bertin, 2006), Source Extractor (SE, v2.19.5, Bertin & Arnouts, 1996) and SWARP (v2.19.5 Bertin et al., 2002). The reference stars are from the 2MASS Point Source Catalog (Skrutskie et al., 2006) and the SDSS stripe 82 standard star frames (Abazajian et al., 2009). Our optical-passband photometry was also cross-validated, using previous catalogs of the same sky area, specifically with the data provided in the work of Kim et al. (2013), who obtained photometry in the and passbands, taken with Mosaic II camera at the 4-meter Blanco telescope at CTIO. The average seeing on the stacked images is ″, ″, and ″ in the , , and filter, respectively. The pixel scale of our final DECam image stacks is 0.263″ which corresponds to 25.5 pc at the distance of the Fornax cluster.
The near-IR VIRCAM observations were processed from scratch starting with the raw data, for which we developed a custom pipeline to do the basic calibration as well as the background modeling and subtraction, photometry, astrometric calibration, and the final image stacking. This was done with the same software packages as described for the optical DECam data reduction. The average seeing on the stacked and images is ″ and ″, respectively. The spatial resolution of the VISTA data is 0.34″/pix pc at the distance of Fornax. The survey information and data reduction process of the near-infrared and the optical observations will be presented in a forthcoming paper (Puzia et al. in prep.).
3 Analysis
3.1 Sample selection
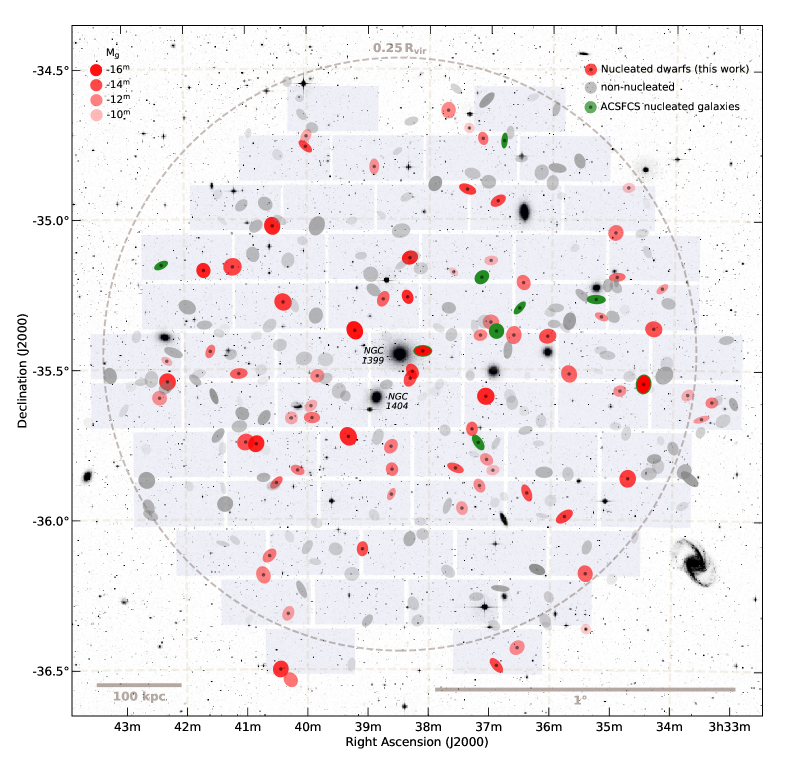
The nucleated dwarf galaxy sample of this work originates in the NGFS sample studied by Eigenthaler, et al. (2018) which consists of 258 dwarf galaxies in the inner 25% of the virial radius of the Fornax cluster ( kpc; Drinkwater et al., 2001), centered on the cD galaxy NGC 1399 (see Fig. 1). Of this total dwarf galaxy population, we consider 75 () to be nucleated based on the following selection criteria: (i) the central object is located at the photometric centre of the spheroid or slightly offset (), (ii) the nuclear cluster is detected in at least two filters, and (iii) the central object appears as a point source. From the 75 nucleated dwarfs, we could further analyze 61 nuclei. For six galaxies the surface brightness profile fits of their spheroid light did not converge to robust solutions, due to contamination by nearby objects or/and too low surface brightness values. For eight of them that have good spheroid profile fits, we encountered unstable solutions in the very inner regions, mainly due to saturation of nearby sources, too-low S/N, and/or stacking artifacts in the area. Since we are primarily interested in robust panchromatic photometry, we, therefore, exclude these objects from the subsequent analysis. Two nucleated dwarf galaxies in our sample overlap with the ACS Fornax Cluster Survey sample (Côté et al., 2006), FCC202 and FCC136, which are shown in Figure 1 as red ellipses with green edges.
Even with sub-arcsecond seeing, the spatial resolution of DECam (1 pix pc) and VISTA (1 pix pc) all nuclei at the Fornax distance are unresolved point sources. Nucleus detections in the central NGFS dataset for each filter reach these magnitudes: mag, mag, mag, mag, and mag. The faintest nucleated dwarf galaxy detected in the Fornax central region has an absolute magnitude of mag.
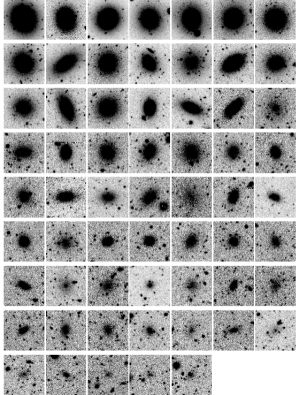
Figure 2 shows the gallery of -band images of our nucleated dwarf galaxy sample, ordered by decreasing luminosity of their spheroid component from top left to bottom right. It is worth noting that the spheroid axis ratios and position angles of the dwarf galaxies are mostly consistent with rounded systems (; see Eigenthaler, et al., 2018). Although the ellipticity distributions of the spheroid light components222This considers only the spheroid light component of the dwarf galaxy, excluding the nuclear star cluster. of nucleated and non-nucleated dwarfs cover a similar range, Eigenthaler, et al. showed that the nucleated dwarfs are systematically round than their nucleus-devoid counterparts by . In addition, the spheroids of nucleated dwarfs have on average larger half-light radii ( kpc) than non-nucleated dwarfs.
We also observe that towards lower galaxy luminosities, the nucleus luminosity becomes more prominent compared to the luminosity of the galaxy spheroid, something that contrasts with the relation found for bright galaxies (Turner et al., 2012). Our main goal in this article is, therefore, to characterize the faint population of nuclear star clusters in the dwarf galaxies in the central Fornax region in terms of the information provided by their luminosities and colors using the broad SED coverage of our NGFS filter set.
3.2 Spatial distribution
Figure 1 shows how our nucleated dwarf sample improves the sample size in terms of spatial coverage and luminosity range compared to previous studies in the same region, in particular those based on the ACSFCS observations which included nine nucleated dwarf galaxies. The spatial distribution of the nucleated dwarfs in the central Fornax region follows the spatial distribution of the non-nucleated dwarf galaxy population, with a slight anisotropy in the east-west direction where the dwarf galaxy surface density appears to be mildly elevated compared to the north-south direction and with individual density peaks that follow the distribution of the giant galaxies (see Muñoz et al., 2015). Our earlier studies indicated that there may be a higher clustering of dwarf galaxies on length scales below kpc. In galactocentric distance from NGC 1399, the non-nucleated sample show a flat distribution out to kpc, meanwhile the nucleated dwarfs have a peak in surface number density at a cluster-centric radius of kpc and declining outwards. Thus, data from the full NGFS survey footprint is required to understand the overall nucleated vs. non-nucleated galaxy distribution in the Fornax galaxy cluster. Some intriguing results on this topic from the sample presented in this work will be addressed in the discussion section below.
3.3 Nucleation fraction
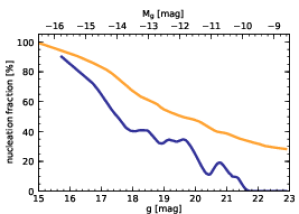
The nucleation fraction () according to the previous work of Turner et al. (2012) for the Fornax region is 72% with galaxy luminosities of their sample reaching as low as mag, thus, only covering the bright galaxy regime. The NGFS nucleated dwarf galaxy sample extends this limit to mag. In Muñoz et al. (2015), we have found that depends strongly on the galaxy luminosity. In Figure 3 we use the NGFS dwarf galaxy sample to estimate cumulative and differential as a function of galaxy luminosity in a window of 20 galaxies and smooth it using a Locally Weighted Scatterplot Smoothing (LOWESS) fit (e.g., Cleveland, 1981) to inspect the general trend. The blue and the orange lines show the differential and cumulative distributions, i.e. and respectively. For the bright NGFS dwarf galaxies ( mag) reaches . On the other hand, fainter galaxies show systematically lower values, reaching zero at absolute magnitudes mag. Although finding nucleated dwarfs towards fainter magnitudes depends on both the point-source detection limit (see values in Sect. 3.1) and the surface brightness limit of our NGFS data ( mag arcsec-2, see Muñoz et al., 2015; Eigenthaler, et al., 2018), it is unclear whether ultra-low surface brightness spheroids are nucleated or not, as there may be detected nuclei in our NGFS point-source catalogues for which our photometry failed to detect the surrounding ultra-low surface brightness spheroid. However, given the relatively faint point-source detection limit, we have a strong indication that for the sample of detected low surface brightness dwarf galaxy spheroids in Fornax, the nucleation stops at a well-defined galaxy luminosity ( mag), corresponding to a galaxy stellar mass of (Eigenthaler, et al., 2018).
3.4 Morphological decomposition of nucleus and spheroid
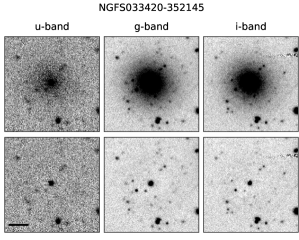
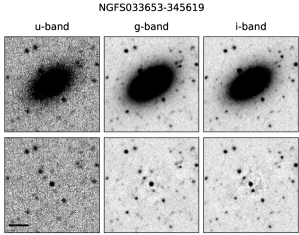
Nuclei studies are affected by the host galaxy luminosity, and, therefore, it is necessary to subtract the galaxy spheroid light in order to study their intrinsic properties. To accomplish this, we have developed an iterative approach to surface brightness profile fitting of dwarf galaxies using galfit (v3.0.5; Peng et al., 2002) and Sérsic models in the bands (for more details, see Eigenthaler, et al., 2018) and in the bands. The process to fit the light of a nucleated dwarf requires more iterations to achieve the best residual image, where the nucleus and spheroid are clearly separated. The procedure to fit dwarf galaxies is as follows: i) a cutout image centered in the dwarf galaxy is created with size of ( kpc kpc); ii) a mask image is created to cover all the sources around the dwarf, thus, creating a ”dwarf-only” image; iii) galfit is run over the cutout image using a PSF model (created with PSFex) and the mask. If the nucleus is present, a compact stellar object is left at or near the dwarf galaxy center; iv) the residual image is used to construct a new mask with the nucleus included; v) the steps from ii) to iv) are repeated at least three times to obtain the best nucleus-spheroid decomposition, leaving a residual image including the nucleus only. Examples of the galaxy fitting process for two dwarf galaxies with different spheroid surface brightness levels and ellipticities are shown in Figure 4. The dwarf galaxy images in the filters are shown in the top-row panels, while the bottom-row panels show the corresponding residual images after the subtraction of the spheroid component. The nucleus of each dwarf is clearly visible in the center of each residual image. In several cases, other compact objects are found near the nucleus, which could be potential satellite globular clusters. The analysis of the nucleus neighborhood and its constituent stellar populations will be presented in a forthcoming paper (Ordenes-Briceño et al., in prep.).
3.5 Photometry
After the spheroid-nucleus fitting procedure we run SE with the corresponding PSF model and generate a catalog with the PSF photometry in all filters for each nucleus. From the 61 dwarf galaxies (see Fig. 2), 60 nuclei remain with reliable -band, 59 with -band, 28 with - and -band photometry, 43 have good -band. The reasons for this inhomogeneity are partially or non-overlapping DECam and VISTA field of views, bad S/N and/or stacking in that area due to small overlap of the individual images, saturated or simply too faint nuclei. Photometry in is available for 28 nuclei. Table 1 shows the coordinates, photometry, and stellar masses for the 61 nuclei. The photometry is corrected for foreground Galactic extinction with values taken from the latest Schlafly & Finkbeiner (2011) recalibration of the Schlegel et al. (1998) dust reddening maps. Reddening values for the different filters are calculated assuming the Fitzpatrick (1999) reddening law with . The average foreground extinction towards the central region of Fornax measured according to the brightest galaxies, i.e. , , , , .
| Nucleus | RA (J2000) | Dec(J2000) | ) | |||||
|---|---|---|---|---|---|---|---|---|
| hh:mm:ss.ss | dd:mm:ss.s | [AB mag] | [AB mag] | [AB mag] | [AB mag] | [AB mag] | [] | |
| NGFS033322-353620n | 03:33:22.19 | 35:36:20.2 | - | 24.0780.023 | 23.3680.023 | - | - | 5.370 |
| NGFS033332-353942n | 03:33:32.16 | 35:39:42.3 | - | 24.5430.033 | 24.0720.044 | - | - | 5.184 |
| NGFS033346-353455n | 03:33:46.05 | 35:34:56.0 | - | 25.3350.084 | - | - | - | - |
| NGFS033412-351343n | 03:34:12.18 | 35:13:42.6 | - | 25.0460.052 | 23.7350.036 | 23.2220.101 | - | 5.490 |
| NGFS033420-352145n | 03:34:20.17 | 35:21:44.7 | - | 21.7120.004 | 21.0500.004 | 20.7400.010 | - | 6.310 |
| NGFS033444-355141n | 03:34:44.17 | 35:51:41.4 | 23.1730.034 | 22.1690.008 | 21.4900.006 | 21.2890.014 | 21.8950.053 | 6.087 |
| NGFS033446-345334n | 03:34:46.13 | 34:53:34.2 | - | 25.3510.087 | 24.0250.062 | - | - | 5.395 |
| NGFS033453-353411n | 03:34:52.74 | 35:34:10.7 | - | 25.8830.116 | 24.9420.096 | - | - | 4.804 |
| NGFS033456-351127n | 03:34:56.49 | 35:11:27.0 | 24.3600.085 | 23.1950.015 | 22.4940.014 | 22.4150.041 | 22.5200.096 | 5.658 |
| NGFS033458-350235n | 03:34:58.21 | 35:02:33.9 | - | 22.4240.007 | 21.7360.007 | 21.5330.024 | - | 6.010 |
| NGFS033512-351923n | 03:35:11.50 | 35:19:22.6 | 25.0200.162 | 23.6380.018 | 22.9970.018 | 22.7750.052 | 22.7240.101 | 5.460 |
| NGFS033524-362150n | 03:35:24.08 | 36:21:50.7 | - | - | 19.6450.004 | 19.5550.008 | 19.6320.013 | 6.562 |
| NGFS033525-361044n | 03:35:25.20 | 36:10:44.2 | 24.7960.113 | 23.6620.020 | 22.9110.019 | 22.3900.049 | 18.2020.003 | 5.655 |
| NGFS033543-353051n | 03:35:42.79 | 35:30:50.7 | 24.2580.066 | 23.2450.019 | 22.5870.013 | 22.3620.033 | 22.8490.108 | 5.636 |
| NGFS033546-355921n | 03:35:46.30 | 35:59:21.4 | 22.3220.013 | 21.3930.003 | 20.6790.003 | 20.4100.008 | 20.9730.024 | 6.405 |
| NGFS033604-352320n | 03:36:04.05 | 35:23:19.7 | 23.9680.060 | 22.9170.011 | 22.1910.013 | - | 21.9730.054 | 5.759 |
| NGFS033624-355442n | 03:36:23.64 | 35:54:40.8 | 24.4830.086 | 23.4050.013 | 22.6640.012 | 22.4210.048 | 23.0810.164 | 5.627 |
| NGFS033628-351239n | 03:36:27.96 | 35:12:38.4 | - | 24.5690.044 | 23.8470.042 | 23.2510.090 | - | 5.340 |
| NGFS033632-362537n | 03:36:32.21 | 36:25:37.3 | - | 22.4190.007 | 21.6530.006 | 21.4230.057 | - | 6.087 |
| NGFS033637-352309n | 03:36:37.27 | 35:23:09.1 | 22.4120.015 | 21.3660.005 | 20.6990.0032 | 20.3200.006 | 20.9090.020 | 6.438 |
| NGFS033653-345619n | 03:36:53.26 | 34:56:18.1 | 23.0560.021 | 21.8360.005 | 21.0930.0038 | 20.8060.012 | - | 6.202 |
| NGFS033657-355011n | 03:36:57.12 | 35:50:11.4 | - | 25.1440.060 | 24.2660.0491 | - | - | 5.035 |
| NGFS033700-350816n | 03:36:59.85 | 35:08:15.4 | - | 25.0620.051 | 24.5630.0676 | 23.9170.182 | - | 5.050 |
| NGFS033700-352035n | 03:36:59.83 | 35:20:36.0 | 23.4930.029 | 22.5380.007 | 21.9140.0065 | 21.5190.017 | 21.9840.053 | 5.918 |
| NGFS033703-354802n | 03:37:03.42 | 35:48:02.1 | - | 24.7840.041 | 23.6960.0295 | 22.9950.073 | - | 5.461 |
| NGFS033708-344353n | 03:37:08.16 | 34:43:52.4 | 24.2080.067 | 22.7910.010 | 22.1210.0117 | 21.6550.038 | 21.6970.091 | 5.857 |
| NGFS033710-352312n | 03:37:10.04 | 35:23:11.8 | - | 24.5370.090 | 23.6640.0386 | 22.9140.059 | - | 5.539 |
| NGFS033710-355317n | 03:37:10.35 | 35:53:16.9 | - | 25.3360.072 | 24.6080.0793 | - | - | 4.867 |
| NGFS033718-354157n | 03:37:17.93 | 35:41:57.3 | 23.7080.049 | 22.7110.010 | 21.9290.0082 | 21.4390.018 | 21.8350.047 | 5.972 |
| NGFS033727-355747n | 03:37:27.49 | 35:57:46.8 | - | 24.9450.046 | 25.0170.0928 | - | - | 5.023 |
| NGFS033734-354945n | 03:37:34.04 | 35:49:44.9 | 24.6320.095 | 23.4510.015 | 22.7540.0142 | 22.4490.048 | 22.8790.133 | 5.565 |
| NGFS033742-343816n | 03:37:41.97 | 34:38:15.7 | - | 21.6010.004 | 20.9610.0031 | 20.6700.028 | - | 6.203 |
| NGFS033817-353028n | 03:38:16.64 | 35:30:27.5 | 24.3320.089 | 23.2760.017 | 22.6370.0145 | 22.4580.043 | 22.5880.094 | 5.586 |
| NGFS033837-355002n | 03:38:36.63 | 35:50:02.1 | - | 25.8750.105 | 24.8990.0889 | 22.1740.034 | - | 5.671 |
| NGFS033837-355502n | 03:38:37.23 | 35:55:01.5 | - | 26.1910.153 | 25.0570.1063 | 22.6300.057 | - | 5.440 |
| NGFS033838-354527n | 03:38:37.66 | 35:45:27.6 | 23.5020.031 | 22.5440.007 | 21.8660.0057 | 21.3460.015 | 22.0840.058 | 5.997 |
| NGFS033845-351600n | 03:38:45.40 | 35:15:59.6 | 24.4320.074 | 23.5780.015 | 22.8830.0141 | 22.3410.038 | 23.0530.156 | 5.611 |
| NGFS033854-344932n | 03:38:54.26 | 34:49:32.4 | - | 24.0960.021 | 23.3070.0243 | - | - | 5.377 |
| NGFS033906-360557n | 03:39:05.77 | 36:05:56.2 | 22.5840.018 | 21.5260.004 | 20.7860.003 | 20.4400.008 | 21.0800.030 | 6.368 |
| NGFS033913-352217n | 03:39:13.32 | 35:22:16.8 | 22.0800.014 | 21.2740.005 | 20.5260.0037 | 20.2290.006 | 20.7750.018 | 6.486 |
| NGFS033920-354329n | 03:39:19.69 | 35:43:28.6 | 22.9460.024 | 22.0730.006 | 21.3560.0055 | 21.0360.011 | 21.8400.045 | 6.156 |
| NGFS033950-353122n | 03:39:50.08 | 35:31:22.1 | 24.0620.074 | 23.2560.014 | 22.7060.015 | 22.2490.032 | 22.9850.126 | 5.640 |
| NGFS033955-353943n | 03:39:55.44 | 35:39:42.9 | - | 25.2510.063 | 24.2270.0465 | - | - | 5.127 |
| NGFS033956-353721n | 03:39:56.45 | 35:37:20.7 | 24.1240.055 | 23.1660.011 | 22.4190.01 | 22.1060.033 | 22.6040.090 | 5.699 |
| NGFS034001-344323n | 03:40:00.56 | 34:43:23.3 | 23.8170.057 | 23.1030.013 | 22.2440.011 | 22.3020.067 | 22.2640.169 | 5.798 |
| NGFS034010-355011n | 03:40:09.77 | 35:50:10.1 | - | 24.2340.029 | 23.7350.03 | 23.2710.128 | - | 5.214 |
| NGFS034019-361850n | 03:40:19.35 | 36:18:49.9 | - | 24.5790.033 | 23.8190.0315 | - | - | 5.127 |
| NGFS034023-351636n | 03:40:23.52 | 35:16:35.7 | 22.5560.016 | 21.5930.004 | 20.8320.0028 | 20.6760.008 | 21.1870.029 | 6.380 |
| NGFS034027-362957n | 03:40:26.99 | 36:29:55.8 | - | 21.7090.006 | 20.9780.0048 | - | - | 6.318 |
| NGFS034031-355241n | 03:40:30.65 | 35:52:40.7 | - | - | 23.8780.0505 | 22.7410.068 | - | 5.735 |
| NGFS034034-350122n | 03:40:33.83 | 35:01:22.3 | 22.7020.038 | 21.5970.006 | 20.7680.0041 | 20.6560.011 | 21.1210.036 | 6.421 |
| NGFS034038-360716n | 03:40:37.76 | 36:07:16.4 | - | 24.6550.038 | 23.9030.0386 | - | - | 5.127 |
| NGFS034044-361108n | 03:40:43.85 | 36:11:07.7 | - | 24.0810.025 | 23.5090.0293 | 23.0490.191 | - | 5.235 |
| NGFS034050-354454n | 03:40:50.40 | 35:44:54.4 | 20.7880.005 | 19.6030.002 | 18.7180.0011 | 18.3890.002 | 18.7710.003 | 7.255 |
| NGFS034101-354434n | 03:41:00.78 | 35:44:33.2 | 21.9950.010 | 20.9590.003 | 20.2720.0019 | 19.9930.007 | 20.5460.018 | 6.558 |
| NGFS034107-353052n | 03:41:07.23 | 35:30:51.9 | - | 24.3550.035 | 23.7060.0335 | 23.2040.115 | - | 5.310 |
| NGFS034113-350932n | 03:41:12.87 | 35:09:31.3 | 21.8790.010 | 20.8900.003 | 20.2230.0024 | 20.2120.010 | 20.6740.029 | 6.490 |
| NGFS034135-352625n | 03:41:35.06 | 35:26:24.3 | - | 23.7360.018 | 22.8820.0143 | - | - | 6.318 |
| NGFS034217-353227n | 03:42:17.25 | 35:32:26.6 | - | 20.5620.003 | 19.8010.0018 | - | - | 6.780 |
| NGFS034218-352819n | 03:42:17.83 | 35:28:18.7 | - | 25.4470.082 | 24.5450.0717 | - | - | 4.938 |
| NGFS034225-353541n | 03:42:25.22 | 35:35:41.5 | - | 24.2080.024 | 23.4210.0212 | - | - | 5.127 |
4 Results
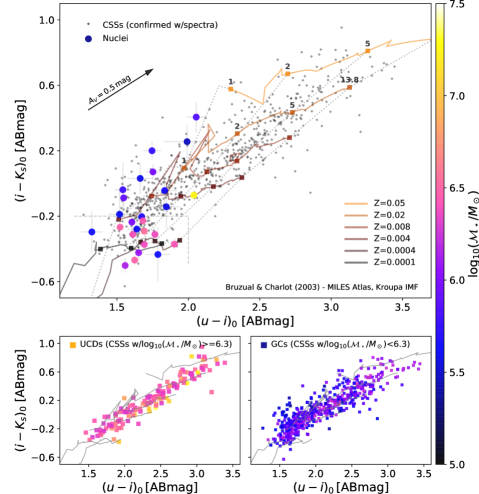
4.1 Color-magnitude and color-color diagrams
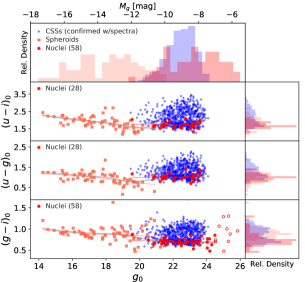
Figure 5 illustrates the color-magnitude diagrams (CMDs) in the filter combinations , and vs. . The nuclei of this work are shown as red circles and their host galaxy spheroid components as orange squares. For comparison, we plot also radial-velocity confirmed compact stellar systems (CSSs, i.e. GCs and UCDs) near the cD galaxy, NGC 1399 from the clean compilation catalog in Wittmann et al. (2016) as blue symbols.
The nuclei occupy the bluest parts of the CSS distribution in all three colors with mean values , , compared to CSSs that cover a significantly broader range of colors with mean values , , . The broader distribution for CSSs and their extension to redder colors is mainly due to their larger spread in metal content reaching super-solar values (e.g. Kissler-Patig et al., 1998). On the other hand, both samples have similar luminosity distributions. One of the key findings here is that the NGFS nuclei show a flat color-magnitude relation (CMR). Whether this is due to no significant changes in the stellar population content as a function of stellar mass will be discussed below. We point out that this is opposite to other results from studies focused on nuclei in the brighter nucleated dwarf galaxy regime, where a CMR for nuclei was found in the magnitude range mag, while for nucleated galaxies brighter than mag the relation becomes flatter again (Côté et al., 2006; Turner et al., 2012; Spengler et al., 2017).
| Linear wLSQ fits | |||
|---|---|---|---|
Note. — The left column shows the weighted least-square fits for nuclei and spheroids in various filter combinations (see Fig. 5), the second column gives the correlation coefficient () and the next the -value for the hypothesis that the CMR has zero slope, while the last column is the standard error of the gradient. The relations for the spheroids are valid in the range , while the corresponding relations for the nuclei are valid in the range mag.
In comparison to the nuclei, the spheroid components of their host galaxies show a shallow but measurable CMR with the spheroid colors becoming redder for brighter systems. Table 2 summarizes the numerical properties of the weighted linear least-square fits to the CMR of nuclei and spheroids in various filter combinations. The CMR of the red-sequence galaxies (including dwarfs) in Virgo and Fornax was recently shown to become flatter going from brightest galaxies towards the faint dwarf luminosity regime (Roediger et al., 2017; Eigenthaler, et al., 2018). The CMR is usually interpreted as a mass-metallicity relation (MZR) due to deeper potential wells retaining more metals produced by stars during the secular evolution of the galaxy compared to their less massive counterparts (e.g. Kodama & Arimoto, 1997; Tremonti et al., 2004; Kewley & Ellison, 2008; Torrey et al., 2017, and references therein). In relation to the flat CMR of the nuclei we find at the overlap luminosity of mag an offset of and , but a relatively small offset in the optical color of . These color offsets have implications for the differences in stellar population contents between nuclei and the surrounding galaxy spheroids and provide constraints for the formation mechanisms of galaxy nuclei and the build-up of galaxies and CSSs in galaxy clusters. We will come back to this point in the discussion section.
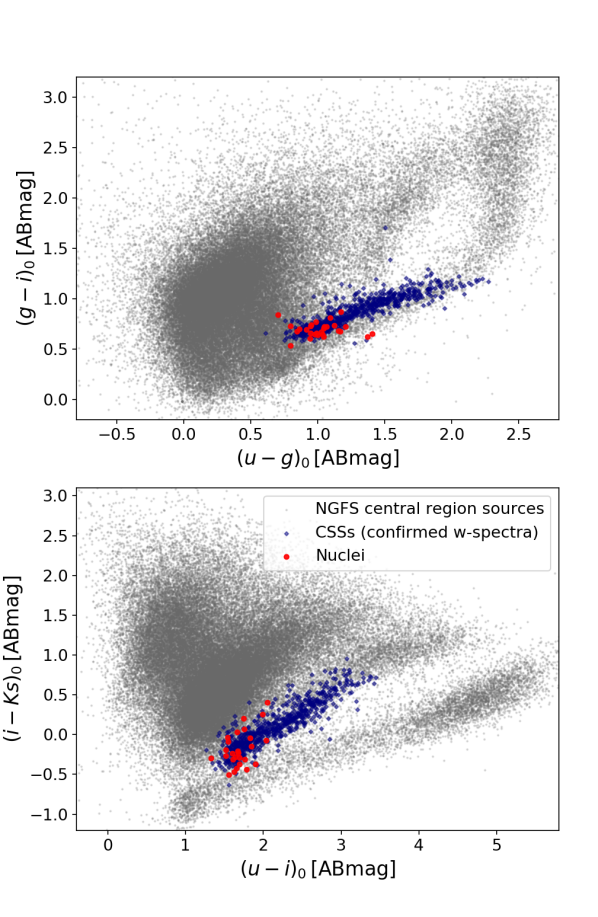
Figure 6 shows two color-color diagrams, i.e., vs. or (top panel) and vs or (bottom panel), where gray dots represent all the detected NGFS sources for which PSF-based photometry could be obtained in the central region of Fornax (Fig. 1). These color-color diagrams, in particular the plane with its broad SED coverage, are powerful tools to distinguish among different object types, such as foreground stars, background galaxies and CSSs (Muñoz et al., 2014). The upper-left cloud of objects in both diagrams shows the location of red-shifted background galaxies, while in the lower parts of the diagram, a tight sequence holds for individual foreground stars and star clusters, but in the diagram even these objects are separated into two sequences. Here the central sequence marks the star cluster sequence, as it is shown by the confirmed CSSs (blue symbols) from the very central parts of the Fornax cluster. Our nuclei sample (red filled circles) is located in the same color-color region and confined to the bluest parts of the star cluster sequence, as was already seen in the color-magnitude diagrams (see Fig. 5). The analysis of the complete star-cluster photometry catalog in the central Fornax region with the new GCs and UCDs candidates will be reported in a future work. In the subsequent analysis we focus on the dwarf galaxy nuclei.
4.2 Stellar mass estimates
Stellar masses for our NGFS nuclei are estimated using a minimization approach to fit stellar population synthesis models to the photometric information from the NGFS filters , , or , according to the photometry available for each nucleus. We exclude the -band photometry due to its sensitivity to very young stellar populations with low mass fractions and/or potential AGN emission components, if any. The mass errors are estimated with Monte-Carlo simulations by drawing one thousand random values from a normal probability distribution function with a mean corresponding to the observed magnitude and a standard deviation equal to the magnitude error, and propagating these values through the following calculations. SSP models from Bruzual & Charlot (2003, hereafter BC03) with the 2016 update333http://www.bruzual.org/gbruzual/bc03/Updated_version_2016/, MILES atlas (Sánchez-Blázquez et al., 2006), and an initial mass function (IMF) from Kroupa (2001) are used to estimate luminosity weighted stellar masses. We consider metallicities in the range and ages older than 1 Gyr to avoid the stochasticity typically found at younger ages (e.g. Cerviño et al., 2002; Cerviño & Luridiana, 2004; Fouesneau & Lançon, 2010). The stellar mass distribution of our nuclei covers the range with uncertainties ranging from 8% to 43% and a mean uncertainty of , propagated from the photometric errors. We point out that there are systematic uncertainties of the mass estimates related to the choice of population synthesis models and the set of filters used to compute the mass-to-light conversion (see Powalka et al., 2016a, 2017; Zhang et al., 2017), which for our sample we estimate to be at most dex.
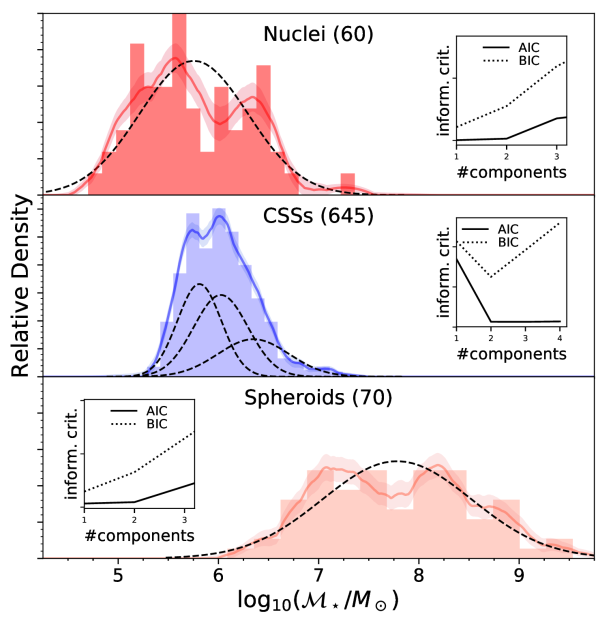
The stellar mass distribution for the NGFS nuclei is illustrated in Figure 7, together with the distribution of the confirmed CSSs in the Fornax region, for which we estimate their masses with the same procedure applied to our nuclei, as well as the nucleated NGFS dwarf spheroids 444Note that we consider the spheroid mass alone, i.e. the nucleated spheroid mass does not include the nucleus., for which we use the mass measurements estimated in Eigenthaler, et al. (2018), which are based on the parametrizations of the mass-to-light ratios as a function of various colors given in Bell et al. (2003). We point out that our sample dwarf spheroids do not show any signs of star formation activity and, hence, their optical colors serve as good indicators for their stellar masses (see Zhang et al., 2017, for the numerical accuracy of these conversions). An Epanechnikov-kernel probability density estimate (KDE) is overplotted for each distribution together with its 1- uncertainties.
We observe that the mass distributions for the three populations are quite different morphologically and cover different mass ranges. At the low-mass end, this is due to differences in the respective selection functions. The NGFS nuclei sample reaches lower masses than the CSS sample, because the spectroscopic selection function for the radial-velocity confirmation of CSSs in Fornax has a brighter cut-off (Wittmann et al., 2016) than the NGFS point-source detection limit (see Sect. 3.1). The mass distribution of dwarf spheroids is limited at the lower-mass end by the surface brightness detection limit of these systems (see Eigenthaler, et al., 2018). The nuclei population spans more than two orders of magnitude in stellar mass and shows a bimodal distribution, for which the peaks are located at and , the latter value is consistent with ultra-compact dwarf (UCD) masses (e.g., Misgeld & Hilker, 2011). Although the AIC marginally prefers one over two components, the Epanechnikov density distribution favors two components. We find that the CSS distribution is formally trimodal555We point out that the AIC has a minimum at three components, but the AIC for two components is numerically very close to the formal minimum. In addition, the BIC gives two as the most likely number of components, which indicates that bimodality or trimodality are equally likely representations of the CSS mass distribution. with its peaks located at and , with the last component extending towards higher masses, reminiscent of UCDs as well. We will not discuss this interesting feature of the Fornax globular cluster mass function in this work, as it requires an in-depth analysis of the sample selection function, but keep our focus on the dwarf galaxy spheroids and nuclei. The dwarf spheroid mass distribution occupies a broad range of more than three magnitudes with a mild, but statistically non-significant bimodality ( and ), with its single-Gaussian peak at . To our knowledge this is the first time such hints for multi-modalities in the nucleated spheroid mass and the nucleus mass distribution have been detected. Together they may give us hints at the importance of different formation mechanisms of stellar nuclei.
4.3 Stellar population properties
Color information in combination with population synthesis model predictions can be used to understand the stellar population properties of the nuclei, such as age, metallicity, and correlations with their mass. The diagram helps minimize the age-metallicity degeneracy that affects broadband filters. Figure 8 illustrates the diagram with over-plotted SSP models from BC03, showing iso-metallicity tracks for the range with equivalent ages of and Gyr. Filled circles stand for NGFS nuclei color-coded by their stellar masses. As in the previous figures, radial-velocity confirmed CSSs are shown for comparison purposes. We observe that the NGFS nuclei occupy approximately the bluer half of the CSSs spread, which is consistent with sub-solar metallicities () and/or a young stellar age component. This is in line with the measurements of Paudel et al. (2011), who find from spectroscopy of relatively bright Virgo dwarf galaxies () that their nuclei () cover a large range of metallicities from slightly super-solar ( dex) to significantly sub-solar ( dex) values. However, it is still challenging to disentangle ages and metallicities for stellar systems older than a few Gyr at any metallicity based on photometry alone. The inversion of broadband color information into stellar population parameters is notoriously difficult (Hansson et al., 2012; Powalka et al., 2016a, 2017) and is facing limitations in light of potentially as yet to be understood systematics related to the galaxy cluster environment (Powalka et al., 2016b). Given the previous considerations, we refrain from assigning numerical age and metallicity values to the nuclei, but analyze them in groups.
4.3.1 Bimodality in nucleus stellar population properties
Although there is no clear mass-color relation, the mass bimodality of our NGFS nuclei is seen as mainly two groups in the plane, hereafter referred to as groups and , and indicates a bimodality in their stellar population parameters. The nuclei in group have stellar masses M⊙ and lie in the bluest color-color region of the plane with mag and mag. Nuclei in group cover a more extended color space with redder average colors, i.e., mag, and comprise objects with stellar masses M⊙666One exception in group is the massive nucleus in the center of dwarf NGFS034050-354454 with a stellar mass of and colors consistent with and Gyr (yellow symbol in Fig. 8). The mean masses for the groups are close to the masses of the two peaks in the nuclei stellar mass distribution, but it is worth noticing that from the total sample, 26 nuclei have high-quality photometry to robustly estimate their color-color distribution. This is mainly the reason for the slightly different peaks between the bimodal mass distribution and the mean masses of the two groups considered here. In any case, it is clear that according to the nucleus mass distribution from Figure 7, there is a bimodality of nuclei which is also reflected in the diagram and that bimodality correlates with stellar population parameters specific for two nuclei sub-groups.
Assuming SSP-like stellar populations, we observe that our NGFS nuclei in group host very metal-poor stellar populations () with luminosity-weighted ages older than Gyr. In contrast, the nuclei in group show colors equivalent to metallicities in the range (), and ages younger than Gyr. The reddening vector in Figure 8 illustrates how an intrinsic reddening of mag, equivalent to for a Milky Way reddening curve, would affect the color-color space. The reddening direction points towards increasing metallicity values, but does not affect the age significantly – if anything, it pushes the colors towards older equivalent ages. Alternatively, chemical abundance ratios different from the ones assumed in the solar-scaled BC03 models may bias the age and metallicity estimates. Evidence that this is indeed the case comes from the study of Paudel, et al. (2010) who found super-solar [/Fe] ratios in nuclei of Virgo dwarfs. In their photometric study of compact stellar systems in the Virgo cluster, Powalka et al. (2016b) found intriguing offsets in multi-color relations pointing towards younger ages of some Virgo GCs. Although test showed the influence of increased [/Fe] on colors, the team found that typical -element enhancements of Local Group GCs were producing too small color offsets to match the observations at old ages. We, therefore, tentatively conclude that the younger ages of the nuclei in group are not primarily due to intrinsic reddening and [/Fe] variations, but likely due to genuinely younger and more metal-rich stellar populations, which lie in terms of stellar mass in the low-mass mode of the nucleus stellar-mass bimodality. Overall, these results point to different formation histories and perhaps different mechanisms of nucleus formation between the two groups. We will come back to this in the discussion section.
4.3.2 Comparison of nuclei with confirmed UCDs
The nuclei masses are shown in color-code in the color-color diagram in Figure 8 (top panel) and are compared to the corresponding stellar mass distribution of radial-velocity confirmed CSSs in Fornax (bottom panels). From this CSS sample, UCDs are selected with a stellar-mass cut so that (e.g. Taylor et al., 2010; Mieske et al., 2013), avoiding any restriction in color (i.e. metallicity), while GCs are selected with from the same parent CSS sample. The final UCD sample exhibits stellar masses within the range , whereas the GCs cover the mass range , which is limited at the low-mass end by the spectroscopic selection function of the CSS sample (Wittmann et al., 2016). The majority of our NGFS nuclei are less massive than with the exception of three objects with a stellar mass of (see Fig. 7), only one of which has a color and is plotted in Figure 8.
Comparing the stellar masses and stellar population parameters of nuclei with those of UCDs reveals that the members of the low-mass mode of our sample nuclei cannot be the progenitors of Fornax UCDs. These dwarf nuclei have simply too low masses to be considered a parental population. However, nuclei that are members of the high-mass mode could potentially be considered progenitors of metal-poor Fornax UCDs. Considering that the initial mass of UCD progenitors may be even higher than their current mass and given their likely mass evolution, as suggested in some UCD formation scenarios that involve stripping (e.g. Zinnecker et al., 1988; Bassino et al., 1994; Bekki et al., 2001, 2003; Goerdt et al., 2008; Pfeffer & Baumgardt, 2013), even this evolutionary connection may be questionable given the similar present-day masses of high-mass dwarf nuclei and metal-poor UCDs. This may not be the case for the most massive dwarf nucleus in our sample, NGFS034050-354454n, which qualifies as a potential intermediate-metallicity Fornax UCD seed, even after 90% of its present-day mass is lost. In any case, our data suggest that the progenitors of the massive, metal-rich UCDs in Fornax have long been destroyed and have no present-day counterparts in dwarf galaxy nuclei. This is consistent with previous spectroscopic studies (Evstigneeva et al., 2007; Francis et al., 2012).
4.3.3 Comparison of nuclei with confirmed GCs
The picture is different when we compare the properties of nuclei and GCs. Essentially all of our nuclei can be considered potential future GCs, once the spheroid envelopes surrounding them are stripped during their dynamical evolution within the Fornax cluster (Goerdt et al., 2008; Bekki et al., 2003; Smith et al., 2013, 2015). Such potential nuclei remnants may become future members of the Fornax GC system. The younger stellar ages of the low-mass mode nuclei indicate extended star formation histories and, therefore, prolonged chemical enrichment processes that may lead to signficant abundance spreads, especially in Fe-peak elements. Such future GCs could be clearly identified with the next-generation of 30m class telescopes via their spreads in stellar iron abundances, something that has been measured in numerous Milky Way star clusters (e.g., Willman & Strader, 2012). Alternatively, high-spatial resolution imaging allows one to identify remnant nuclei candidates in the half-light radius vs. luminosity parameter space, which has been done for the Local Group star clusters (Ma et al., 2006). Furthermore, the characteristic age-metallicity relation found for a subset of Galactic GCs (VandenBerg et al., 2013; Leaman et al., 2013) is consistent with our observation of decreasing stellar ages in more metal-rich nuclei. This suggests that at least the Galactic GC sub-population with a significant age-metallicity relation could have in part their origins in the cores of nucleated dwarf galaxies (see also Marín-Franch et al., 2009; Forbes & Bridges, 2010; Dotter et al., 2011; de Boer et al., 2015).
4.4 Differences between nuclei and galaxy spheroids
The color difference in various filter combinations between the nucleus and its host galaxy spheroid is shown in Figure 9 as a function of nucleus luminosity () and galaxy spheroid luminosity (). The nucleus-to-galaxy mass ratio is encoded by the symbol color and has a range from . The color differences are more correlated with the spheroid light than with the nucleus luminosity, which implies that the mechanisms that lead to the color offsets must be acting more on galaxy scales rather than nucleus scales. One can think of processes that are correlated with the total dwarf galaxy mass which, for instance, lead to more massive galaxies holding on more efficiently and longer to their gas supply than their small-mass counterparts; this is especially true in the galaxy cluster environment.
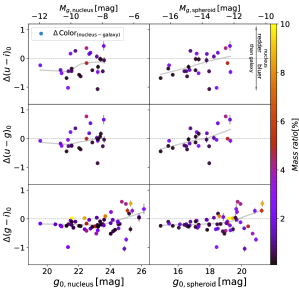
We find relations for the color differences and vs. and . These near-UV+optical colors map a broader SED range which is more sensitive to changes in stellar population parameters, while a shallower trend in is consistent with the narrower SED coverage. This is mainly due to the enhanced sensitivity of the u-band to the Balmer break flux compared to the redder filters. Bright nuclei (), on average, , , and mag bluer than their host galaxy, indicative of younger and/or more metal-poor stellar populations (see Fig. 8). According to the BC03 models, these color differences correspond consistently to an age difference of at old absolute ages ( Gyr) and low metallicities ([Fe/H] to dex), and an age difference of at young absolute ages ( Gyr) and solar metallicities. It can also be attributed to a metallicity difference of dex at old absolute ages ( Gyr) and intermediate-to-low metallicities ([Fe/H] to dex) and to dex at solar metallicities, respectively. These metallicity differences change at young absolute ages ( Gyr) to dex at intermediate to low metallicities and dex at solar metallicities, respectively. Similar color differences have been reported in previous studies (see Lotz et al., 2004; Côté et al., 2006; Turner et al., 2012). However, owing the depth of the present data, we find that there is a transition point around mag () or mag (), where the average offset becomes insignificant at the expense of an increasing galaxy-to-nucleus color variance. This feature is noticeable in and colors already at brighter nucleus luminosities around mag () or mag ().
Another important feature is the steep relation seen in the and colors vs. : here we observe that low nucleus-to-galaxy mass ratios () only occur up to a magnitude mag () where we find almost exclusively blue nuclei, while for fainter dwarfs we have a mixture of nucleus-galaxy color differences and nucleus-to-galaxy mass ratios. We note that all the trends described here are not due to photometric uncertainties, but stellar population properties that vary substantially from nucleus to nucleus.
These results paint the following picture: as a dwarf nucleus begins to grow, starting with a low nucleus-to-galaxy mass ratio, its stellar population content is dominated by more metal-poor and/or younger stars than the typical star in its host spheroid. Nuclei with higher nucleus-to-galaxy mass ratios must have either reached higher metal enrichment at similar ages or were formed earlier with enough time for their stellar populations to evolve and redden sufficiently. A distinction between these two scenarios could easily be made using spectroscopically determined [/Fe] ratios, which are indicators of star formation timescales (e.g., Matteucci & Greggio, 1986), allowing us to discern between prolonged star formation histories vs. short and early star-formation bursts (e.g., Tsujimoto et al., 1995; Matteucci & Recchi, 2001), which may be driven by the environment (e.g., Thomas et al., 2005; Puzia et al., 2005).
| Fit | Parameters | Fornax | NGFS dwarfs + ETGs | NGFS dwarfs + LTGs |
|---|---|---|---|---|
| Linear regression | ||||
| Polynomial-fit degree=3 | ||||
| Linear regression | ||||
| Polynomial-fit degree=3 | ||||
Note. — For the nucleus vs. galaxy mass relation () we set and . For the mass ratio () relation as a function of galaxy mass () we define and .
5 Discussion
5.1 Formation mechanisms
The astrophysical mechanisms responsible for the differences in stellar population content of the galaxy spheroid and the nucleus are numerous, but can be categorized to be mainly due to two processes: i) the inflow of gas into the nuclear regions which triggers star formation processes (e.g., van den Bergh, 1986; Antonini et al., 2015), and ii) the accretion of GCs into the galaxy central regions via dynamical friction (e.g., Tremaine et al., 1975; Lotz et al., 2001). However, the relatively shallow dwarf galaxy potentials can be easily affected by environmental and secular processes. Secular processes such as stellar winds, supernova (SN) and black-hole (BH) feedback can affect the nucleus formation and evolution, for instance, by helping with gas supply to the nuclear regions through stellar winds from newly formed stars (radiation drag, Kawakatu & Umemura, 2002) or slowing down the nucleus growth due to SN-driven winds contributing to the mass loss in dwarf galaxies and likely changing the dynamical friction timescales for orbiting star clusters to sink to the center (Lotz et al., 2001), or dynamically heating the nuclear cluster due to a massive central BH (Antonini et al., 2015). Whether the gas comes from disk instabilities, galaxy mergers (with some gas content) or primordial gas, the dynamical timescales for the gas to sink down to the nuclear reservoir depend on the size of the galaxy, being longer with increasing galaxy size and, thus, mass (Eigenthaler, et al., 2018). Therefore, in more massive galaxies the inflowing material would have more time to fragment and undergo star-formation, leaving smoother and relatively steeper stellar population gradients imprinted in the spheroid component. Consequently, the spheroids of low-mass dwarfs would have smaller and more stochastic population gradients due to gas and/or GCs having shorter sink-in timescales, leading to a more stochastic color difference between nucleus and host galaxy than for more massive dwarfs. This is exactly what we observe in Figure 9 for and mag.
5.2 Scaling relations
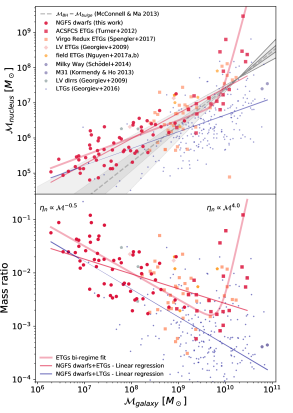
One of the physical scaling relations that nuclei follow is the nucleus-to-galaxy mass relation (see Fig. 10) which has been shown to hold for bright ETGs (e.g., Spengler et al., 2017). To test whether such a relation applies to our dwarf galaxy sample we use the masses derived for the nuclei in this work (Sect. 4.2) and their spheroid masses from Eigenthaler, et al. (2018). In order to compare our sample with nucleated galaxies at higher masses and those located in different environments, we make use of literature data. For the bright nucleated galaxies in the Fornax cluster sample from ACSFCS (Turner et al., 2012), the corresponding nucleus masses are estimated with the same method described in Section 4.2 using their photometry. For their host galaxies the magnitudes were obtained from HyperLEDA and together with the relations from Bell et al. (2003) we estimate the masses in a self-consistent procedure as for the NGFS dwarf galaxies (Eigenthaler, et al., 2018). For the Virgo cluster, we use the masses estimated in the Virgo Redux work (Spengler et al., 2017) for nuclei and hosts. In addition, we include the results of recent studies by Nguyen et al. (2017a, b) for field ETGs to estimate the dynamical mass for their central BH and their nuclear star cluster. In Nguyen et al. (2017a), the central SMBH dynamical mass for NGC 404 was estimated to be . In Nguyen et al. (2017b) four field ETGs were studied. Three of them were found to contain BHs with masses of (M32), (NGC 5102) and (NGC 5206). The catalog of nucleated late-type galaxies (LTGs) comes from Georgiev et al. (2016) with 228 moderately inclined spiral galaxies with morphological type code or later than Sb at distances Mpc. Nuclei from Local Volume (LV) dwarf irregular (dIrr) and early-type dwarf galaxies come from Georgiev et al. (2009). For the Milky Way and Andromeda nuclear star clusters we use from Schödel et al. (2014) and from Kormendy & Ho (2013).
The relation between nucleus and host galaxy stellar mass is shown in Figure 10 (top panel), where we see a clear mass correlation between nuclei and their host galaxies across the entire galaxy mass range (). For ETGs, this relation is shallower for lower-mass galaxies compared to the massive galaxy regime with a break in slope around . The relation for dwarf galaxies scales as , while for massive ellipticals it follows a much steeper relation, . The discussion of the astrophysical reasons for these two regimes go far beyond the scope of this paper.
Compared to ETGs, there is a higher dispersion and a less inclined slope for the LTG relation, which is more noticeable in the massive galaxy range, as was already pointed out by Georgiev et al. (2016). This indicates that the nuclei in LTGs are on average less massive at a fixed host galaxy mass than nuclei in ETGs. The weighted linear and polynomial least-square fits are shown in Table 3. Based on considerations that the mechanisms, that are responsible for the build-up of the central massive objects are similar for nuclei and massive BHs, previous studies have discussed their possible evolutionary connection (e.g., Ferrarese et al., 2006; Neumayer & Walcher, 2012). For the purpose of comparison, we illustrate the black-hole-galaxy mass relation from McConnell & Ma (2013) with its and uncertainty limits. This relation was obtained from fitting the compilation of 35 ETGs with dynamical measurements of the bulge stellar mass, with mass range of . Their sample is well populated for bulges more massive than (see their Figure 3). Assuming that we can extrapolate to lower bulge masses, we see in Figure 10 that the scaling relation for BHs and their ETG hosts is similar to the relation between nuclei and their host galaxy mass down to . For galaxies with lower masses the nucleus-to-galaxy mass relation becomes flatter.
The mass ratio between nucleus and its host galaxy () as a function of galaxy mass is shown at the bottom panel of Figure 10. We find a clear anti-correlation of vs. over the entire galaxy mass range, i.e. the lower the galaxy mass the more significant becomes the nucleus. In the massive galaxy regime () we note a large scatter in the relation, which is the main reason why previous studies assumed a constant equivalent luminosity ratio for their samples, like for instance, the ACS Virgo nucleated galaxies with (Côté et al., 2006), for the ACS Fornax nucleated galaxies (Turner et al., 2012) and for LTGs (Georgiev et al., 2016). However, in the faint dwarf galaxy regime () there appears a clear and strong trend, reaching to for a dwarf galaxy with a stellar mass of . The four low-mass ETGs studied by Nguyen et al. (2017a, b) have values up to , which are in agreement with the general trend. The extension of the vs. anti-correlation towards the faint dwarf galaxy population appears to be similar for ETGs and LTGs. This, in turn, suggests that nuclei at the smallest masses are subject to localized processes that work on parsec scales within the galaxy core regions independent of galaxy type.
5.3 Comparison with theoretical predictions
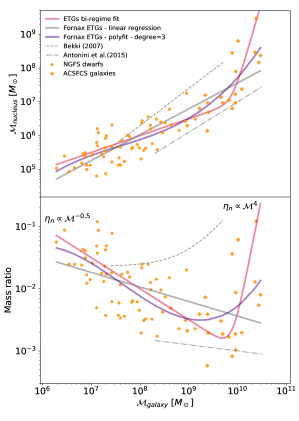
The two proposed formation scenarios for nuclei are globular cluster infall due to dynamical friction (Tremaine et al., 1975) and in situ star formation (van den Bergh, 1986). The latter needs a mechanism to funnel gas into the galaxy center. Some studies suggest mechanism to carry the gas inwards to be galaxy mergers between two disk galaxies (Mihos & Hernquist, 1994), supernova feedback outflows that become stalled because the intergalactic medium (IGM) pressure prevents the gas from escaping the dwarf galaxy (Babul & Rees, 1992), and gas disks embedded in an old stellar spheroid (Bekki, 2007). Observational studies for ETGs have argued that the predominant mechanism for nucleus formation in more massive galaxies are dissipative processes, sinking gas to the central galaxy regions with star formation occurring in situ, while for low-mass galaxies nucleus formation occurs via GC infall due to short dynamical timescales (e.g. Lotz et al., 2004; Côté et al., 2006; Turner et al., 2012). In this context, we note that in the Virgo cluster, more than 50% of the bright early-type dwarfs were found to show underlying disk features, with the disk fraction decreasing to only a few % for such dwarfs fainter than mag (Lisker et al., 2006a), corresponding to (see Fig. 7 in Eigenthaler, et al., 2018). Moreover, about 15% of the Virgo early-type dwarfs brighter than mag reveal blue centers, which were spectroscopically shown to correspond to recent star formation (Lisker et al., 2006b). In a more recent work, Spengler et al. (2017) have compared their multi-band photometry of nuclei with scaling relation predictions from Bekki (2007) and Antonini et al. (2015) and inferred that there is no single preferred formation scenario for nuclei, suggesting a mix of processes instead (see also Da Rocha et al., 2011). We proceed to compare the nucleus sample available for the Fornax cluster (NGFS and ACSFCS nuclei) with scaling relation predictions for different formation scenarios in a similar approach as in Spengler et al. (2017). Figure 11 illustrates the comparison of empirical results with theoretical predictions.
5.3.1 Bekki (2007) model predictions
Pure dissipative models such as the one put forward by Bekki (2007), which takes into account feedback from SNe and super-massive BHs, depend mainly on the spheroid mass (), the initial gas mass fraction (), the spheroid surface brightness (SB), and the chosen IMF (bottom or top-heavy). Some of the more relevant nucleus properties in the numerical results of this model are that can reach up to 5%, more massive spheroids have more metal-rich nuclei and less massive spheroids can hold a young nucleus due to longer timescales of nucleus formation. Compared to the Fornax nucleated galaxy sample, the Bekki model (gray-dashed curves in Fig. 11) reproduces the values for galaxies with masses of , but predicts too massive nuclei in more massive galaxies relative to the observations. The predicted trend in the -galaxy mass relation is too steep for massive nucleated galaxies in contrast to the empirical results. Although the observed mass ratios reach up to 10%, they do so only at the lowest () and highest sampled masses (), while the model reaches those values at smaller masses. For masses of the order of , the mass ratio for our sample is about one order of magnitude smaller than the predicted values. Clearly the theoretical ingredients of the Bekki (2007) model ought to be adjusted to better reproduce the observed hockey-stick trend of the relation, where stronger suppression within the model framework of the nucleus mass accumulation process at intermediate masses () seems necessary. In light of the relatively high fraction of disk components in intermediate-mass dwarfs (see Lisker et al., 2006a), this may be accomplished by either an enhanced disk/spheroid growth mode and/or suppression of the nuclear mass accumulation mechanism, e.g. via advective angular momentum transport, bar instabilities, and/or the presence of a central black hole (Curir et al., 2008, 2010; Foyle et al., 2010; Goz et al., 2015; James & Percival, 2018).
5.3.2 Antonini et al. (2015) model predictions
An hybrid approach to modeling the formation of galaxy nuclei was undertaken by Antonini et al. (2015) where two nucleus formation models are considered. The first model is the cluster-inspiral (CliN) model, which simulates star cluster mergers in the center of an isolated galaxy with a pre-existing central BH. The second is a galaxy formation (GxeV) model, which tracks the evolution of baryonic structures in dark-matter merger trees. The GxeV model includes galaxy evolution, dissipative processes, mergers between galaxies, tidal interactions, and coexistence with super-massive BHs. This hybrid approach considers two possibilities for nucleus growth from high-redshift to the present-day by migration of star clusters and/or in situ formation. Both models, CliN and GxeV, have similar scaling relations but GxeV has a larger dispersion in the nucleus masses than CliN does. In addition, CliN cannot form nuclei more massive than a few , but GxeV can. Antonini et al. tested the case without BH heating and found that both models still are able to form massive nuclei without any constraint on velocity dispersion or galaxy mass. One interesting prediction is that nuclei can be formed with one mechanism alone, the in situ star formation. However, a shallower slope is then obtained for the nucleus-galaxy mass relation relative to the scenario when both mechanisms are at work.
When comparing the predictions (CliN and GxeV are similar in this parameter space, dash-dotted lines in Fig. 11) with Fornax nucleated galaxies, the predicted masses tend to be a factor of a few smaller than the observed ones over the mass range covered by the models ranging from to . Antonini et al. notice the offset and argue that the underweight of model nuclei is due to the interaction of the nucleus with the central massive BH, which makes the nucleus lose stars faster, in addition to galaxy mergers, where BH binaries form and efficiently eject surrounding stars. These effects have a greater impact in more massive galaxies than in low-mass dwarfs. The overall prediction by Antonini et al. (2015) is that both mechanisms are likely active during nucleus growth and that their relative contribution depends on the star-cluster formation efficiency. These models show that for galaxies less massive than in situ star formation contributes of the nucleus mass and becomes more important for more massive galaxies. This suggests that massive galaxies are more efficient in driving the gas flows to the galaxy core regions than are low-mass galaxies. This gas funneling allows for subsequent star formation to progress to more advanced stages with implications for the resulting chemical makeup of the stellar populations, which would exhibit lower [/Fe] element ratios.
In any case, the Antonini et al. (2015) models require modification in order to reproduce the sharp upturn of the observed relation.
5.4 Correlation of the nucleation strength with the spatial distribution in Fornax
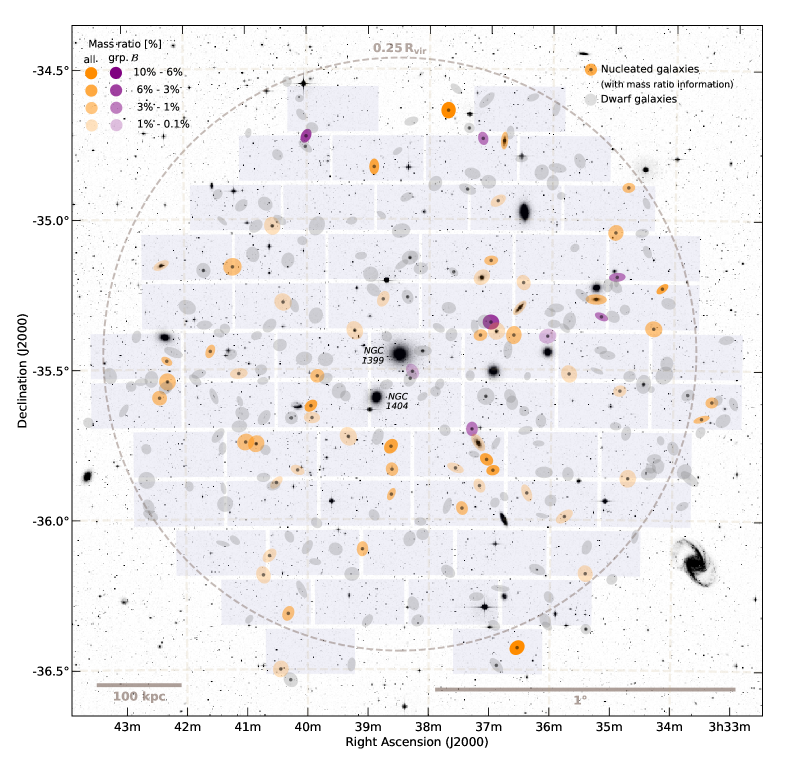
Figure 12 shows the spatial distribution of the galaxies in the central region of the Fornax cluster, where the nucleated galaxies from the NGFS and ACSFCS sample with mass ratio information are shown in orange symbols, while the rest of the dwarf galaxies are indicated by gray symbols. In this plot, the transparency of the symbols for the nucleated dwarfs is parameterized by the nucleus-to-galaxy mass ratio () as indicated in the legend in the top left corner. We find that dwarfs located closer to massive galaxies have mass ratios below 1%. However, we see that the dwarfs with the highest mass ratios in our sample are located on the edges of the field of view at North and South direction.
In Section 4.3 we introduced two nucleated dwarf groups according to their stellar population parameters derived from SSP model predictions in the diagram. We defined group of nuclei that appear younger and more metal-rich than the nuclei of group , which appear, on average, older and more metal-poor. The nuclei from group are marked with purple ellipses in Figure 12, which reveals a strong asymmetry in their spatial distribution, where virtually all of the younger and metal-rich nuclei are located in an overdensity westwards of the Fornax center. This suggests that dwarf galaxies in different regions of the Fornax cluster must have experienced different formation histories. We will test the significance of this overdensity once the dwarf sample from the entire NGFS footprint is available.
6 Conclusions
We have characterized 61 nuclear star clusters in the Fornax cluster region (). We used deep and homogeneous photometry to obtain information on their luminosity and color distributions. In the following we summarize our main results.
-
•
The nucleation fraction () depends strongly on the galaxy luminosity, reaching for the bright NGFS dwarf galaxies ( mag) and dropping to zero at absolute galaxy magnitudes fainter than mag. The galaxy luminosity at which the nucleation stops corresponds to a stellar mass of . As the NGFS data have a very faint point source detection limits ( mag) this is an astrophysical effect and clearly not related to observational constraints.
-
•
Color-magnitude diagrams using various filter combinations show that nuclei occupy the bluest parts in color space, but have a comparable luminosity coverage to the distribution of compact stellar systems (CSSs) in Fornax. The latter distribution is significantly broader, which is mainly due to the large spread in metal content. Nuclei in dwarf galaxies show a flat color-magnitude relation, which is opposite to the trend found for UCDs and the dwarf galaxy spheroids which both show a positive color-luminosity relation.
-
•
We derive stellar masses for our nuclei with a mean uncertainty of and find that the nucleus stellar mass distribution covers the range of . We find that the nucleus mass distribution is bimodal, with peaks located at and . The second peak is consistent with UCD masses. We derive stellar masses for our CSS comparison dataset, which is limited at the low-mass end by the spectroscopic selection function.
-
•
The combination of the diagram with SSP model predictions reveals a bimodality in the stellar population parameters of nuclei, which is congruent with the two groups in the mass distribution function of NGFS nuclei. We define two groups with group comprising nuclei with colors mag and mag, which according to SSP models is consistent with metal-poor stellar populations () and ages older than 2 Gyr. The nuclei in group have stellar masses . Group contains less massive objects and covers a more extended region in the color space with redder average colors, an indication of a larger range in metallicity and ages younger than 2 Gyr. With the exception of one object the masses of the group nuclei are all .
-
•
Dividing the CSS sample confirmed by radial velocity into GCs and UCDs using a stellar mass cut at shows that the low-mass mode of our sample nuclei (group ) cannot be progenitors of Fornax UCDs. On the other hand, the high-mass mode nuclei located in bright galaxies could be potential progenitors of metal-poor UCDs. Notwithstanding, our NGFS nuclei could all be considered as potential future GCs, once their host galaxy spheroids are stripped due to the dynamical evolution of the system inside the Fornax cluster environment.
-
•
Color differences between the nucleus and its parent galaxy spheroid correlate more with the spheroid light than with the nucleus luminosity. Therefore, the mechanism that produces these color offsets is more likely to be acting on galaxy scales. Colors with a wide SED coverage, such as and , are more sensitive to changes in stellar populations and show a steeper relation with spheroid luminosity than . Bright nuclei tend to be bluer than their host galaxy. Nonetheless, as we sample fainter galaxy luminosities, we find a transition point where the color offset becomes more stochastic and we find both bluer and redder nuclei than their host. This transition occurs at or for and or for and .
-
•
Scaling relations such as the nucleus-to-galaxy mass relation ( vs. ) show a clear mass correlation between nuclei and their host galaxy over the entire mass range of our NGFS sample. This relation shows a break in the slope at where we find a shallower slope for dwarf galaxies relative to their more massive counterparts. Comparing with the BH-galaxy mass relation, we find that it has a similar relation to the nuclei and their host galaxy mass down to . For galaxies with lower masses, their nucleus-galaxy mass scaling relation becomes flatter than the BH-galaxy mass relation. For the nuclei-to-galaxy mass ratio vs. galaxy mass relation () an interesting anti-correlation is found. The lower the galaxy mass the more prominent becomes the nucleus with a scaling . For masses higher than the break at we find a positive correlation of the form . These relatively strong trends for low-mass and high-mass galaxies reach values up to for dwarf galaxies with a stellar mass of and massive ellipticals at .The low-mass anti-correlation seems to be similar for ETGs and LTGs, suggesting that it is independent of galaxy type.
-
•
The spatial distribution of the Fornax nucleated dwarfs shows that they are preferentially distributed along the East-West direction. Knowing the location of the nucleated dwarfs with highest values, we observe that they lie at the edges of the central NGFS footprint to the North and South. We also find that the nuclei that are members of group that are relatively metal-rich and have ages younger than 2 Gyr lie predominantly westward of NGC 1399, suggesting a more extended star formation history of nuclei in that direction.
Our NGFS study has extended the galaxy nucleus research towards the faint galaxy luminosity regime down to , finding nucleus-galaxy scaling relations that are quite different compared to the results obtained from bright galaxies. Theoretical models still fail to explain the observed scaling relations for the low-mass regime and do not account for the apparent transition between low-mass and high-mass galaxies. However, we find that the models by Bekki (2007) and Antonini et al. (2015) appear to frame our observations, which may indicate that a combination of their prescriptions may best represent reality. Overall our NGFS nucleus sample gives crucial insights into the formation mechanism at work, showing that nuclei are likely formed via two different mechanisms, i.e., formation via dynamical friction acting on GCs sinking to the center and star formation processes in the central regions. The full NGFS footprint will provide a larger sample and help us to better understand the fascinating properties and the formation mechanisms of the nucleus population in dwarf galaxies.
CTIO (4m Blanco/DECam).
References
- Abazajian et al. (2009) Abazajian, K. N., Adelman-McCarthy, J. K., Agüeros, M. A., et al. 2009, ApJS, 182, 543-558
- Antonini (2013) Antonini, F. 2013, ApJ, 763, 62
- Antonini et al. (2015) Antonini, F., Barausse, E., & Silk, J. 2015, ApJ, 812, 72
- Astropy Collaboration et al. (2013) Astropy Collaboration, Robitaille, T. P., Tollerud, E. J., et al. 2013, A&A, 558, A33
- Babul & Rees (1992) Babul92, A., & Rees, M. J. 1992, MNRAS, 255, 346
- Bassino et al. (1994) Bassino, L. P., Muzzio, J. C., & Rabolli, M. 1994, ApJ, 431, 634
- Bekki (2007) Bekki, K. 2007, PASA, 24, 77
- Bekki et al. (2001) Bekki, K., Couch, W. J., & Drinkwater, M. J. 2001, ApJ, 552, L105
- Bekki et al. (2003) Bekki, K., Couch, W. J., Drinkwater, M. J., & Shioya, Y. 2003, MNRAS, 344, 399
- Bell et al. (2003) Bell, E. F., McIntosh, D. H., Katz, N., & Weinberg, M. D. 2003, ApJS, 149, 289
- Bertin (2006) Bertin, E. 2006, in Astronomical Society of the Pacific Conference Series, Vol. 351, Astronomical Data Analysis Software and Systems XV, ed. C. Gabriel, C. Arviset, D. Ponz, & S. Enrique, 112
- Bertin & Arnouts (1996) Bertin, E., & Arnouts, S. 1996, A&AS, 117, 393
- Bertin et al. (2002) Bertin, E., Mellier, Y., Radovich, M., et al. 2002, in Astronomical Society of the Pacific Conference Series, Vol. 281, Astronomical Data Analysis Software and Systems XI, ed. D. A. Bohlender, D. Durand, & T. H. Handley, 228
- Blakeslee et al. (2009) Blakeslee, J. P., Jordán, A., Mei, S., et al. 2009, The Astrophysical Journal, 694, 556.
- Blanton & Roweis (2007) Blanton, M. R., & Roweis, S. 2007, The Astronomical Journal, 133, 734.
- Boch & Fernique (2014) Boch, T., & Fernique, P. 2014, in Astronomical Society of the Pacific Conference Series, Vol. 485, Astronomical Data Analysis Software and Systems XXIII, ed. N. Manset & P. Forshay, 277
- Böker et al. (2004) Böker, T., Sarzi, M., McLaughlin, D. E., et al. 2004, AJ, 127, 105
- Bonnarel et al. (2000) Bonnarel, F., Fernique, P., Bienaymé, O., et al. 2000, A&AS, 143, 33
- Bruzual & Charlot (2003) Bruzual, G., & Charlot, S. 2003, Monthly Notices of the Royal Astronomical Society, 344, 1000.
- Cerviño & Luridiana (2004) Cerviño, M., & Luridiana, V. 2004, A&A, 413, 145
- Cerviño et al. (2002) Cerviño, M., Valls-Gabaud, D., Luridiana, V., & Mas-Hesse, J. M. 2002, A&A, 381, 51
- Cleveland (1981) Cleveland, W. 1981, The American Statistician,, 35, 54
- Côté et al. (2006) Côté, P., Piatek, S., Ferrarese, L., et al. 2006, ApJS, 165, 57
- Curir et al. (2008) Curir, A., Mazzei, P., & Murante, G. 2008, A&A, 481, 651
- Curir et al. (2010) Curir, A., de Romeri, V., & Murante, G. 2010, Ap&SS, 327, 259
- Da Rocha et al. (2011) Da Rocha, C., Mieske, S., Georgiev, I. Y., et al. 2011, A&A, 525, A86
- de Boer et al. (2015) de Boer, T. J. L., Belokurov, V., & Koposov, S. 2015, MNRAS, 451, 3489
- den Brok et al. (2014) den Brok, M., Peletier, R. F., Seth, A., et al. 2014, MNRAS, 445, 2385
- Dotter et al. (2011) Dotter, A., Sarajedini, A., & Anderson, J. 2011, ApJ, 738, 74
- Drinkwater et al. (2001) Drinkwater, M. J., Gregg, M. D., & Colless, M. 2001, ApJ, 548, L139
- Eigenthaler, et al. (2018) Eigenthaler, P., Puzia, T. H., Taylor, M. A., et al. 2018, ApJ, 855, 142.
- Evstigneeva et al. (2007) Evstigneeva, E. A., Gregg, M. D., Drinkwater, M. J., & Hilker, M. 2007, AJ, 133, 1722
- Ferrarese et al. (2006) Ferrarese, L., Côté, P., Dalla Bontà, E., et al. 2006, ApJ, 644, L21
- Ferrarese et al. (2012) Ferrarese, L., Côté, P., Cuillandre, J.-C., et al. 2012, ApJS, 200, 4
- Fitzpatrick (1999) Fitzpatrick, E. L. 1999, PASP, 111, 63
- Flaugher et al. (2015) Flaugher, B., Diehl, H. T., Honscheid, K., et al. 2015, AJ, 150, 150
- Forbes & Bridges (2010) Forbes, D. A., & Bridges, T. 2010, MNRAS, 404, 1203
- Fouesneau & Lançon (2010) Fouesneau, M., & Lançon, A. 2010, A&A, 521, A22
- Foyle et al. (2010) Foyle, K., Rix, H.-W., & Zibetti, S. 2010, MNRAS, 407, 163
- Francis et al. (2012) Francis, K. J., Drinkwater, M. J., Chilingarian, I. V., Bolt, A. M., & Firth, P. 2012, MNRAS, 425, 325
- Georgiev & Böker (2014) Georgiev, I. Y., & Böker, T. 2014, MNRAS, 441, 3570
- Georgiev et al. (2016) Georgiev, I. Y., Böker, T., Leigh, N., Lützgendorf, N., & Neumayer, N. 2016, MNRAS, 457, 2122
- Georgiev et al. (2009) Georgiev, I. Y., Hilker, M., Puzia, T. H., Goudfrooij, P., & Baumgardt, H. 2009, MNRAS, 396, 1075
- Goerdt et al. (2008) Goerdt, T., Moore, B., Kazantzidis, S., et al. 2008, MNRAS, 385, 2136
- Goz et al. (2015) Goz, D., Monaco, P., Murante, G., & Curir, A. 2015, MNRAS, 447, 1774
- Hansson et al. (2012) Hansson, K. S. A., Lisker, T., & Grebel, E. K. 2012, MNRAS, 427, 2376
- Hunter (2007) Hunter, J. D. 2007, Computing In Science & Engineering, 9, 90
- Ivezić et al. (2014) Ivezić, Ž., Connolly, A., Vanderplas, J., & Gray, A. 2014, Statistics, Data Mining and Machine Learning in Astronomy (Princeton University Press)
- James & Percival (2018) James, P. A., & Percival, S. M. 2018, MNRAS, 474, 3101
- Jones et al. (2001–) Jones, E., Oliphant, T., Peterson, P., et al. 2001–, SciPy: Open source scientific tools for Python, , , [Online; accessed ¡today¿].
- Kawakatu & Umemura (2002) Kawakatu, N., & Umemura, M. 2002, MNRAS, 329, 572
- Kewley & Ellison (2008) Kewley, L. J., & Ellison, S. L. 2008, ApJ, 681, 1183
- Kim et al. (2013) Kim, H.-S., Yoon, S.-J., Sohn, S. T., et al. 2013, ApJ, 763, 40
- Kissler-Patig et al. (1998) Kissler-Patig, M., Brodie, J. P., Schroder, L. L., et al. 1998, AJ, 115, 105
- Kodama & Arimoto (1997) Kodama, T., & Arimoto, N. 1997, A&A, 320, 41
- Kormendy & Ho (2013) Kormendy, J., & Ho, L. C. 2013, ARA&A, 51, 511
- Kroupa (2001) Kroupa, P. 2001, MNRAS, 322, 231
- Lisker et al. (2006a) Lisker, T., Grebel, E. K., & Binggeli, B. 2006a, AJ, 132, 497
- Lisker et al. (2006b) Lisker, T., Glatt, K., Westera, P., & Grebel, E. K. 2006b, AJ, 132, 2432
- Leaman et al. (2013) Leaman, R., VandenBerg, D. A., & Mendel, J. T. 2013, MNRAS, 436, 122
- Lotz et al. (2004) Lotz, J. M., Miller, B. W., & Ferguson, H. C. 2004, ApJ, 613, 262
- Lotz et al. (2001) Lotz, J. M., Telford, R., Ferguson, H. C., et al. 2001, ApJ, 552, 572
- Ma et al. (2006) Ma, J., van den Bergh, S., Wu, H., et al. 2006, ApJ, 636, L93
- Marín-Franch et al. (2009) Marín-Franch, A., Aparicio, A., Piotto, G., et al. 2009, ApJ, 694, 1498
- Matteucci & Greggio (1986) Matteucci, F., & Greggio, L. 1986, A&A, 154, 279
- Matteucci & Recchi (2001) Matteucci, F., & Recchi, S. 2001, ApJ, 558, 351
- McConnell & Ma (2013) McConnell, N. J., & Ma, C.-P. 2013, ApJ, 764, 184
- Mieske et al. (2013) Mieske, S., Frank, M. J., Baumgardt, H., et al. 2013, A&A, 558, A14
- Mihos et al. (2005) Mihos, J. C., Harding, P., Feldmeier, J., & Morrison, H. 2005, ApJ, 631, L41
- Mihos et al. (2017) Mihos, J. C., Harding, P., Feldmeier, J. J., et al. 2017, ApJ, 834, 16
- Mihos & Hernquist (1994) Mihos, J. C., & Hernquist, L. 1994, ApJ, 437, L47
- Misgeld & Hilker (2011) Misgeld, I., & Hilker, M. 2011, MNRAS, 414, 3699
- Muñoz et al. (2014) Muñoz, R. P., Puzia, T. H., Lançon, A., et al. 2014, ApJS, 210, 4
- Muñoz et al. (2015) Muñoz, R. P., Eigenthaler, P., Puzia, T. H., et al. 2015, ApJ, 813, L15
- Neumayer & Walcher (2012) Neumayer, N., & Walcher, C. J. 2012, Advances in Astronomy, 2012, 709038
- Nguyen et al. (2017a) Nguyen, D. D., Seth, A. C., den Brok, M., et al. 2017a, ApJ, 836, 237
- Nguyen et al. (2017b) Nguyen, D. D., Seth, A. C., Neumayer, N., et al. 2017b, ArXiv e-prints, arXiv:1711.04314
- Paudel, et al. (2010) Paudel, S., Lisker, T. & Janz, J. 2010, ApJ, 724, L64
- Paudel et al. (2011) Paudel, S., Lisker, T., & Kuntschner, H. 2011, MNRAS, 413, 1764
- Pedregosa et al. (2012) Pedregosa, F., Varoquaux, G., Gramfort, A., et al. 2012, JMLR, 12, 2825
- Peng et al. (2002) Peng, C. Y., Ho, L. C., Impey, C. D., & Rix, H.-W. 2002, AJ, 124, 266
- Pfeffer & Baumgardt (2013) Pfeffer, J., & Baumgardt, H. 2013, MNRAS, 433, 1997
- Powalka et al. (2016a) Powalka, M., Lançon, A., Puzia, T. H., et al. 2016a, ApJS, 227, 12
- Powalka et al. (2016b) Powalka, M., Puzia, T. H., Lançon, A., et al. 2016b, ApJ, 829, L5
- Powalka et al. (2017) Powalka, M., Lançon, A., Puzia, T. H., et al. 2017, ApJ, 844, 104
- Puzia et al. (2005) Puzia, T. H., Kissler-Patig, M., Thomas, D., et al. 2005, A&A, 439, 997
- Puzia et al. (2014) Puzia, T. H., Paolillo, M., Goudfrooij, P., et al. 2014, ApJ, 786, 78
- Rejkuba (2012) Rejkuba, M. 2012, Ap&SS, 341, 195
- Roediger et al. (2017) Roediger, J. C., Ferrarese, L., Côté, P., et al. 2017, ApJ, 836, 120
- Rossa et al. (2006) Rossa, J., van der Marel, R. P., Böker, T., et al. 2006, AJ, 132,1074
- Sánchez-Blázquez et al. (2006) Sánchez-Blázquez, P., Peletier, R. F., Jiménez-Vicente, J., et al. 2006, MNRAS, 371, 703
- Schlafly & Finkbeiner (2011) Schlafly, E. F., & Finkbeiner, D. P. 2011, ApJ, 737, 103
- Schlegel et al. (1998) Schlegel, D. J., Finkbeiner, D. P., & Davis, M. 1998, ApJ, 500, 525
- Schödel et al. (2014) Schödel, R., Feldmeier, A., Kunneriath, D., et al. 2014, A&A, 566, A47
- Skrutskie et al. (2006) Skrutskie, M. F., Cutri, R. M., Stiening, R., et al. 2006, AJ, 131, 1163
- Smith et al. (2013) Smith, R., Sánchez-Janssen, R., Fellhauer, M., et al. 2013, MNRAS, 429, 1066
- Smith et al. (2015) Smith, R., Sánchez-Janssen, R., Beasley, M. A., et al. 2015, MNRAS, 454, 2502
- Spengler et al. (2017) Spengler, C., Côté, P., Roediger, J., et al. 2017, ApJ, 849, 55
- Sutherland et al. (2015) Sutherland, W., Emerson, J., Dalton, G., et al. 2015, A&A, 575, A25
- Taylor et al. (2010) Taylor, M. A., Puzia, T. H., Harris, G. L., et al. 2010,ApJ, 712, 1191
- Thomas et al. (2005) Thomas, D., Maraston, C., Bender, R., & Mendes de Oliveira, C. 2005, ApJ, 621, 673
- Torrey et al. (2017) Torrey, P., Vogelsberger, M., Marinacci, F., et al. 2017, ArXiv e-prints, arXiv:1711.05261
- Tremaine et al. (1975) Tremaine, S. D., Ostriker, J. P., & Spitzer, Jr., L. 1975, ApJ, 196, 407
- Tremonti et al. (2004) Tremonti, C. A., Heckman, T. M., Kauffmann, G., et al. 2004, The Astrophysical Journal, 613, 898.
- Tsujimoto et al. (1995) Tsujimoto, T., Nomoto, K., Yoshii, Y., et al. 1995, MNRAS, 277, 945
- Turner et al. (2012) Turner, M. L., Côté, P., Ferrarese, L., et al. 2012, ApJS, 203, 5
- Valdes et al. (2014) Valdes, F., Gruendl, R., & DES Project. 2014, in Astronomical Society of the Pacific Conference Series, Vol. 485, Astronomical Data Analysis Software and Systems XXIII, ed. N. Manset & P. Forshay, 379
- van den Bergh (1986) van den Bergh, S. 1986, AJ, 91, 271
- VandenBerg et al. (2013) VandenBerg, D. A., Brogaard, K., Leaman, R., & Casagrande, L. 2013, ApJ, 775, 134
- VanderPlas et al. (2012) VanderPlas, J., Connolly, A. J., Ivezic, Z., & Gray, A. 2012, in Proceedings of Conference on Intelligent Data Understanding (CIDU), pp. 47-54, 2012., 47–54
- Walcher et al. (2006) Walcher, C. J., Böker, T., Charlot, S., et al. 2006, ApJ, 649, 692
- Wenger et al. (2000) Wenger, M., Ochsenbein, F., Egret, D., et al. 2000, A&AS, 143, 9
- Willman & Strader (2012) Willman, B., & Strader, J. 2012, AJ, 144, 76
- Wittmann et al. (2016) Wittmann, C., Lisker, T., Pasquali, A., Hilker, M., & Grebel, E. K. 2016, Monthly Notices of the Royal Astronomical Society, 459, 4450.
- Zhang et al. (2017) Zhang, H.-X., Puzia, T. H., & Weisz, D. R. 2017, ApJS, 233, 13
- Zinnecker et al. (1988) Zinnecker, H., Keable, C. J., Dunlop, J. S., Cannon, R. D., & Griffiths, W. K. 1988, in IAU Symposium, Vol. 126, The Harlow-Shapley Symposium on Globular Cluster Systems in Galaxies, ed. J. E. Grindlay & A. G. D. Philip, 603