Complex Lyman- Profiles in Redshift 6.6 ultraluminous Lyman Alpha Emitters11affiliation: Based on data collected at the Subaru Telescope, which is operated by the National Astronomical Observatory of Japan. 22affiliation: The W. M. Keck Observatory is operated as a scientific partnership among the California Institute of Technology, the University of California, and NASA, and was made possible by the generous financial support of the W. M. Keck Foundation.
Abstract
We report on a search for ultraluminous Ly emitting galaxies (LAEs) at using the NB921 filter on Hyper Suprime-Cam on the Subaru telescope. We searched a area around the North Ecliptic Pole, which we observed in broadband and and narrowband NB816 and NB921, for sources with NB921 and -NB921 . This corresponds to a selection of (Ly erg s-1. We followed up seven candidate LAEs (out of thirteen) with the Keck DEIMOS spectrograph and confirmed five LAEs, one AGN with a broad Ly line and a strong red continuum, and one low-redshift ([O III]5007) galaxy. The five ultraluminous LAEs have wider line profiles than lower luminosity LAEs, and one source, NEPLA4, has a complex line profile similar to that of COLA1. In combination with previous results, we show that the line profiles of the ultraluminous LAEs are systematically different from those of lower luminosity LAEs at this redshift. This result suggests that ultraluminous LAEs generate highly ionized regions of the intergalactic medium in their vicinity that allow the full Ly profile of the galaxy—including any blue wings—to be visible. If this interpretation is correct, then ultraluminous LAEs offer a unique opportunity to determine the properties of the ionized zones around them, which will help in understanding the ionization of the intergalactic medium. A simple calculation gives a very rough estimate of 0.015 for the escape fraction of ionizing photons, but more sophisticated calculations are needed to fully characterize the uncertainties.
Subject headings:
cosmology: observations — galaxies: distances and redshifts — galaxies: evolution — galaxies: starburst1. Introduction
Enormous progress is being made in finding and characterizing galaxies at very high redshift (e.g., McLure et al. 2013; Bouwens et al. 2015; Finkelstein et al. 2015). As well as their intrinsic interest, and the light they can shed on galaxy evolution, such high-redshift galaxy populations have the potential to allow the exploration of one of the key stages of cosmic history, the epoch of reionization (EoR) when the intergalactic gas (IGM) transitioned from being neutral to being very highly ionized. In particular, since Ly emission emerging from galaxies can be modified by the radiative damping wings of a neutral IGM, the presence of Ly emitting galaxies (LAEs) at can potentially pinpoint when reionization occurred (e.g., Fontana et al. 2010; Stark et al. 2010).
The neutral hydrogen fraction in the surrounding IGM affects both the strength and the shape of Ly emission from distant galaxies (Haiman 2002; Haiman & Cen 2005). For the purposes of identifying when reionization occurred, the Ly luminosity function (LF) itself is not enough, since both it and the UV continuum LF will change as the star formation rate density (SFRD) evolves. However, the LAE fraction—the number of LAEs relative to the number of continuum-selected galaxies—is invariant to the SFRD evolution and has the potential to be a strong indicator of the reionization boundary (e.g., Robertson et al. 2010), as do the properties of the individual Ly lines.
However, it is also possible that any evolution of the LAE fraction may be driven by changes in the intrinsic properties of the galaxy population rather than by an increasing neutrality of the IGM (e.g., Stark et al. 2015; Sobral et al. 2017). Modeling shows that outflows lead to a redshifted Ly emission line profile, while inflows produce a blueshifted profile, which will be preferentially scattered by the IGM (e.g., Neufeld 1990).
Thus, the gas kinematics in these high-redshift galaxies is a key element in determining how the Ly emission interacts with the IGM and what the final Ly profile will look like. Most high-redshift LAEs show an asymmetric profile with a red tail and a fast cutoff to the blue, but this asymmetry could reflect either the output shape from the galaxy, or the IGM cutting off the blue side of an initially more symmetric profile. In addition, the width of the line depends on the inflow and outflow velocities, and changes in the width will modify the amount of IGM scattering. Evolution in the galaxy properties can therefore reproduce the observed LAE evolution with a much smaller change in the neutral fraction in the IGM (e.g., Stark et al. 2015).
Substantial samples of LAEs out to have now been found using narrowband searches (e.g., Hu et al. 2010; Ouchi et al. 2010; Matthee et al. 2015; Santos et al. 2016; Bagley et al. 2016; Konno et al. 2017; Zheng et al. 2017), and a handful of sources have been detected at (Konno et al. 2014). The highest redshift securely detected LAE is at (Zitrin et al. 2015). All groups find the Ly LF at lower luminosities () to be declining with increasing redshift, and it may be dropping very rapidly at (Zheng et al. 2017). There is also evidence of a drop in the LAE fraction beyond that has been interpreted as evidence for a rapid change in the IGM neutral hydrogen fraction near this redshift (e.g., Stark et al. 2010; Konno et al. 2014). At these lower luminosities, the shapes and velocity widths of the Ly lines are all extremely similar and show little evolution with redshift between and (Hu et al. 2010; Matthee et al. 2017b).
However, recent work has suggested that the behavior of the very highest luminosity LAEs may be different. First, their LF may show little evolution over the range (Santos et al. 2016). Second, Stark et al. (2017) have found Ly emission in all of a sample of four luminous galaxies at selected on the basis of their IRAC colors (which indicates probable nebular emission; Roberts-Borsani et al. 2016). Thus the most luminous galaxies may have less evolution in their LAE fraction than the lower luminosity samples.
What is even more intriguing is that the most luminous LAE—COLA1 at with erg s-1 (Hu et al. 2016)—is the first source near the EoR to show a complex LAE profile with a stronger red and weaker blue component (though there has been debate over whether it might be a lower redshift emission line; Matthee et al. 2017b). We shall loosely refer to such sources as blue-wing LAEs; however, without an accurate measure of the systemic velocities, we do not know if the blue component is at a negative velocity with respect to the galaxy. These data may suggest that the H II regions being generated around the highest luminosity LAEs are ionized enough to permit the transmission of Ly, allowing the LAE to be visible even as the IGM as a whole becomes more fully neutral (e.g., Matthee et al. 2015). If this is correct, then we may be able to estimate the escaping ionizing photon production in the parent galaxy from the required properties of the H II region. The key to determining this is to obtain large samples of the most luminous LAEs and to measure spectroscopically their Ly line properties as a function of luminosity.
This is one of the goals of our HEROES survey, which aims to survey a area around the North Ecliptic Pole (NEP). HEROES will provide a large homogeneous galaxy sample with which to determine the properties of LAEs at and over a volume large enough to enable us to find significant samples of the most luminous LAEs ( erg s-1) and to determine the Ly line properties using follow-up spectroscopy. This search requires a very large area survey but only a relatively modest depth in flux sensitivity.
In the present paper, we describe our candidate selection of LAEs with NB921 brighter than 23.5 (AB) in the first region of HEROES. Out of our 13 candidates, we have followed up spectroscopically the 7 with -band detections (since we are secure that these are not spurious) and have confirmed most of them as LAEs. We find that these ultra-luminous LAEs have wider and more complex profiles than the lower luminosity LAEs. We have also discovered a second LAE with a blue wing profile similar to COLA1.
We assume , , and km s-1 Mpc-1 throughout. All magnitudes are given in the AB magnitude system, where an AB magnitude is defined by . Here is the flux of the source in units of erg cm-2 s-1 Hz-1.
2. Data
The images used in this work were obtained as part of our HEROES survey (Hasinger et al. 2018, in preparation), which uses the wide-field capability ( diameter field-of-view) of the Hyper Suprime-Cam camera (HSC; Miyazaki et al. 2012) on the Subaru 8.2 m telescope to map an area of 120 around the NEP. The survey was designed to match the deepest X-ray observations that will be obtained with the eROSITA mission (Merloni et al. 2012). HEROES includes broadband and images and narrowband NB816 and NB921 images with HSC and and images with MegaPrime/MegaCam and WIRCam on the 3.6 m Canada-France-Hawaii Telescope (CFHT). The and data were taken with the HSC-r2 and HSC-i2 filters, installed in 2016.
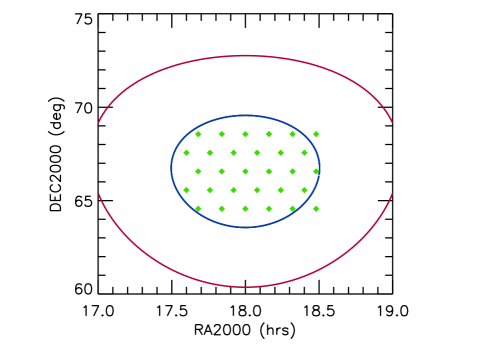
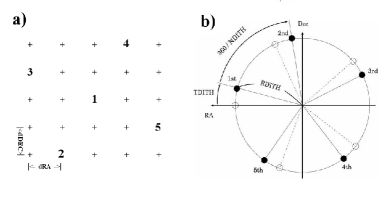
The HSC observations of the NEP field were taken in a close packed set of observation stepped at 1 deg offsets. We show the stepping pattern in Figure 1. At each position we observed using a 5-point mosaic pattern in N-shot mode (see Figure 2). The 5 positions spaced equally around a circle of radius (RDITH =120) from the field center, with the first position rotated clockwise by (TDITH = 15) from the east-west line (R.A. offset east of the center).
Given the diameter field-of-view of HSC, the combination of our stepping pattern of staggered offsets between field centers and the N-Shot mosaic pattern with NDITH = 5 gives slightly more uniform field coverage over the wide NEP region than any other possible pattern. This approach ensures that every point in the center of the grid of the currently observed NEP field is also covered by the mosaic observations at four adjacent pointings centered at corners diagonally away from the center pointing, and that as the outer regions of the sample field get expanded with new observations, this also holds true for the extended field.
The HSC observations with the NB921 filter were taken on UT dates 2016-08-02, 2016-08-03, and 2016-08-05, and again on 2017-06-22. During 2016, on the first night, when the first 14 positions were taken, the median seeing in NB921 was , and on the second night, or better. On the third night, there was heavy extinction (4 mags) with median seeing of . As a result, this part of the field was re-observed in NB921 on UT 2017-06-22, which was a photometric night with median seeing of .
Matching observations were obtained on UT dates 2016-07-06, 2016-07-11, 2016-08-05, and 2017-06-28, with median seeing of , , , and , respectively.
All HSC images were reduced with the Pan-STARRS Image Processing Pipeline (IPP, Magnier et al. 2017). We chose to use this rather than the HSC pipeline because it is already set up and tested on our computer system. However, both rely on the Pan-STARRS data for astrometric and photometric calibration and we expect that there will be little difference between the final calibrated images. The IPP pipeline is well tested, and, with only minor configuration additions, can operate on any imaging data set. In addition, the availability of a dedicated computer cluster allows the large data volume to be processed quickly. The details of pixel processing are presented in Waters et al. (2016). Briefly, each exposure has the instrument signal removed, and then photometry is performed on the individual exposures. The objects detected are matched against the Pan-STARRS reference catalog to determine the astrometric and photometric calibration for the exposure.
From these solutions, individual exposures that have good seeing and transparency are transformed to a common pixel grid and co-added into stacked frames. For this analysis, the seeing limit excluded any input with PSF FWHM greater than , and the transparency limit excluded any input with a measured zeropoint 0.3 mag brighter than the median. The stacking process removes non-astronomical artifacts, such as reflection glints, while enhancing the signal to noise (S/N) of faint sources. These faint sources are measured by additional stack photometry run across all filters simultaneously (Magnier et al. 2016). Measurements are forced in all filters if a significant source is detected in any single band.
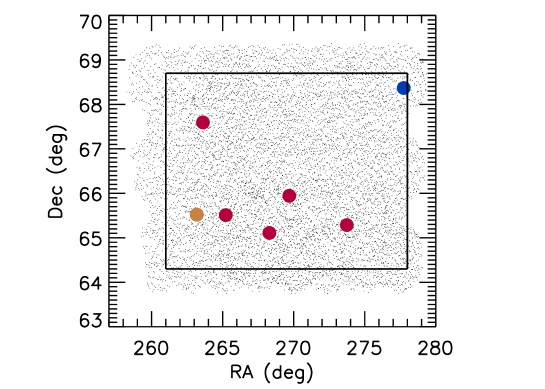
Only the central observations covering 45 have been obtained so far (Figures 1 and 3). The catalog of objects detected with S/N in any band throughout this area contains 23.9 million objects. From this catalog, we selected 2.8 million objects with NB921 Kron magnitudes brighter than 23.5 lying in the most uniformly covered area of the field (, ), shown with the rectangle in Figure 3. The final sample used in this paper was taken from the most uniform area of 30 .
The exposure time in NB921 varies throughout the 30 area, depending on the overlap and on edge effects. The mean exposure per pixel is 5600 s with a range from 2200 s to 9000 s; the lowest exposures are at the edges. The noise in a diameter aperture ranges from 25.4 to 26.1. The adopted 23.5 mag selection in NB921 of LAE candidates provides a criterion throughout the area and a much higher S/N (mean of ) through most of the area. The corresponding -band observations have exposure times from 2100 s to 9600 s (mean of 6200 s) and a noise of 26.2 to 27.0 (mean of 26.7 in a diameter aperture).
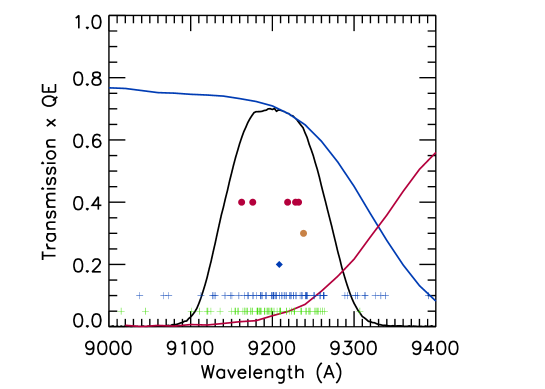
We next measured the magnitudes for all of the bands using diameter apertures centered on the NB921 positions and searched for LAE candidates with (NB921) that were not detected above a level in any of the , and bands. The filter bandpass is generally to the blue of NB921 (Figure 4), but the red end covers NB921 and provides a reasonable continuum measurement. The half maximum of the transmission corresponds to a redshift range of , which we use in combination with the area to measure the comoving volume of the survey ( Mpc3). This is the largest volume yet surveyed for ultraluminous LAEs. It is roughly 40% larger than the SILVERRUSH survey of Konno et al. (2017).
The LAE candidate sample chosen in this way still contains numerous artifacts from contamination by bright stars, moving objects, glints, etc. We next visually inspected the narrowband and broadband images of each of the LAE candidates and removed artifacts. At this stage, we also visually inspected a noise-weighted sum of the , , and bands and eliminated sources where we could see the narrowband source in the combination of these bluer bands.
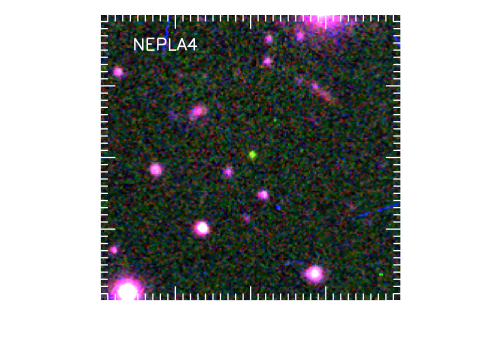
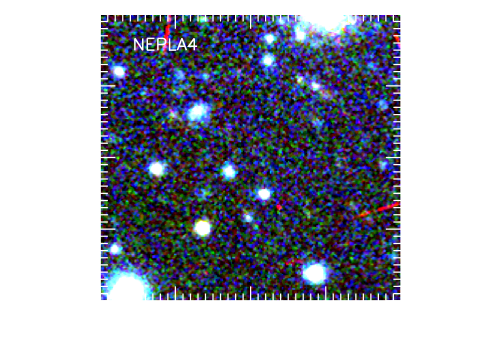
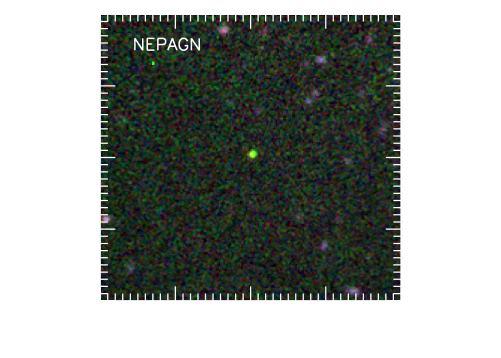
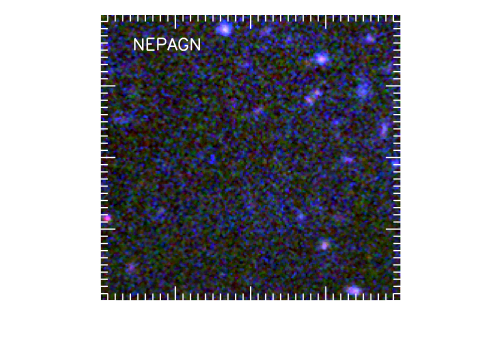
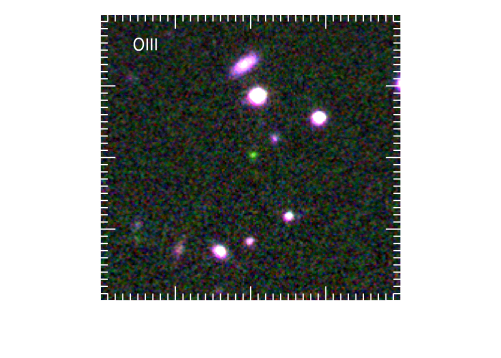
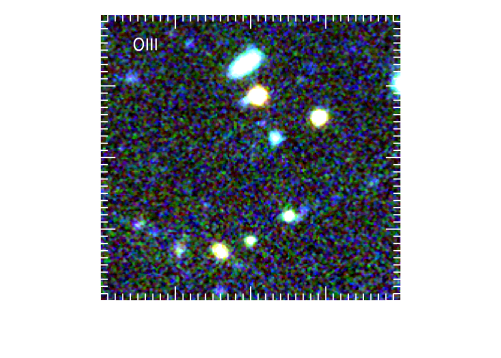
In the left panels of Figure 5, we show images of some of our candidates (NB921 in green, in red, and in blue). In the right panels, we show the same sources in (blue), (green), and (red). These broadband data are much deeper than the narrowband data, and one can see that the candidates are absent in these images.
We prioritized the candidates that are also detected in the -band for spectroscopic follow-up, since we are secure that these are not spurious. This gives a sample of seven primary sources, which we show in Figure 3 and summarize in Table 1. There are a further six possible candidates faint in . Since these sources are only detected in NB921, they are more questionable and may correspond to unidentified artifacts. We have not yet observed them spectroscopically which would be necessary to confirm them. However, they could, in principle, raise the LAE numbers to eleven vs. the current five. We postpone a discussion of the bright end LAE LF until we have completed the spectroscopic follow-up of the full sample, but we note that, based on the photometric sample, our results are roughly consistent with the Konno et al. (2017) LF at but low compared with that of Santos et al. (2016).
3. Spectroscopic follow-up
We obtained spectroscopy with DEIMOS on Keck II of the seven primary targets in Table 1 during observing runs in June, August, October 2017 and March 2018. The observations were made with the G830 grating using a slit, giving a resolution measured from the sky lines of 83 km s-1 for the LAEs. Each exposure consisted of three 20 min sub-exposures dithered by along the slit in order to obtain precise sky subtraction, which is critical given the ghosting in this grating configuration. Total exposures ranged from hr. The seeing was generally , and conditions were photometric, except for the observations of NEPLA2 when there was variable transmission. The data were reduced with our standard pipeline (Cowie et al. 1996). The three most luminous galaxies in the extended COSMOS field - CR7 and MASOSA (Sobral et al. 2015) and COLA1 (Hu et al. 2016) - were observed in the same configuration, allowing a detailed comparison of their spectra with the spectra of the present NEP sources.
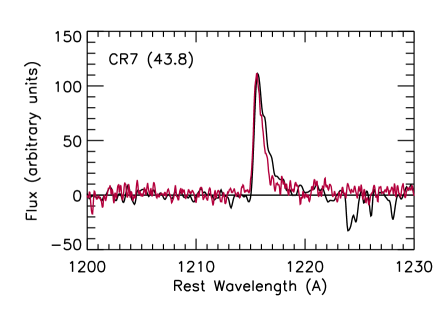
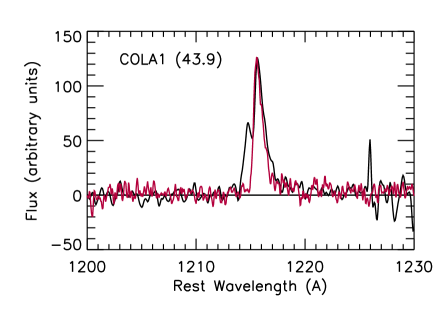

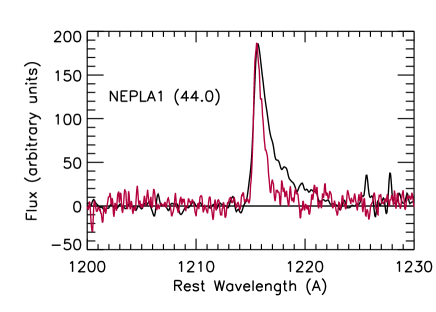
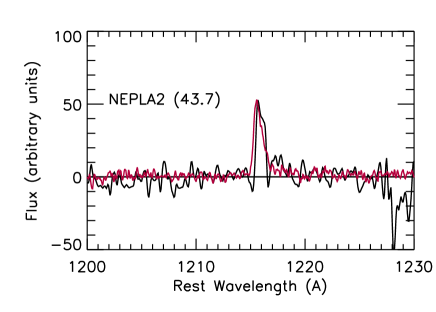
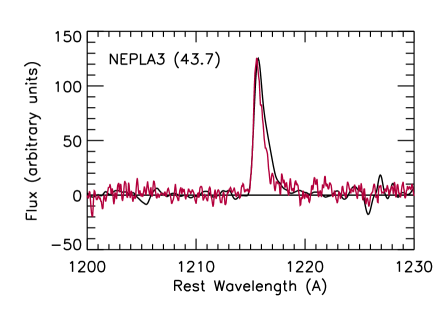
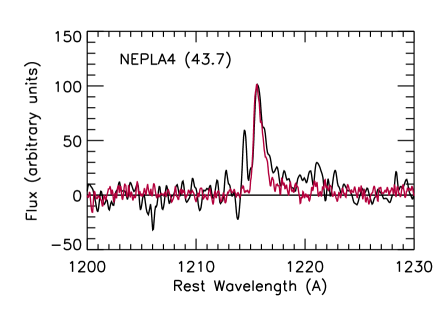
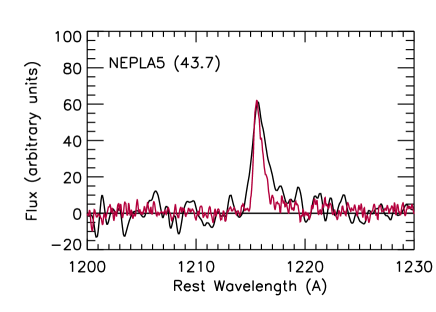

Five of the seven observed candidates were identified as LAEs. We show their spectra in Figure 6, along with those of CR7, MASOSA and COLA1111The observations of NEPLA2 are of poorer quality, and we consider this source more questionable than the other four NEP LAEs.. The measured redshifts corresponding to the peak of the profiles are given in Table 1. In each case, we compare the line profile (black) with the stacked spectra of lower luminosity LAEs at () from Hu et al. (2010) (red). It is apparent from Figure 6 that most of the lines in these ultraluminous galaxies are broader than those in lower luminosity LAEs. In some cases, they have more extended red wings.
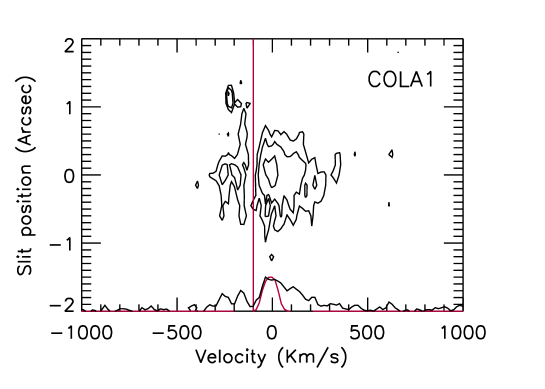
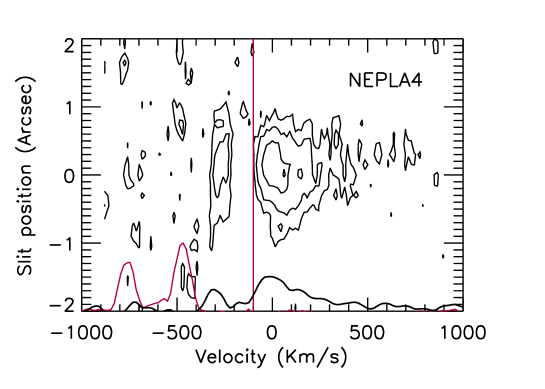
NEPLA4 has a complex profile with red and blue peaks and bears a strong resemblance to COLA1. In Figure 7, we compare the two-dimensional spectra of COLA1 and NEPLA4. In NEPLA4, the blue component is at a more negative velocity, and the red wing is more extended. In both cases, the spatial profile of the blue wing along the slit matches that of the red wing, suggesting we are seeing light from a single source rather than from two overlapping galaxies at slightly separated redshifts.
In Figure 8, we compare the spectral profile of NEPLA4 with the profiles of two blue-wing LAEs at lower redshift, one at from Yamada et al. (2012) and one at from C. Scarlata et al. (2018, in preparation). NEPLA4 shows the same characteristic double peak structure as the lower redshift sources, with a strong dip between the peaks. It also shows the same stronger and wider red peak. In all cases, the red wing has an asymmetric profile extending to higher velocities, which is characteristic of LAEs. We will return to a quantitative analysis of the line profiles in Section 6.
One of the remaining two sources is a very high equivalent width [O III]5007 emitter at . The continuum in this source is not detected in any of the blue bandpasses, making this type of source hard to remove with a purely photometric selection (see Figure 5). [O III] emitters are the primary contaminant and a significant source of uncertainty in photometrically selected LAE samples without follow-up spectroscopy (e.g., Konno et al. 2017, and references therein).
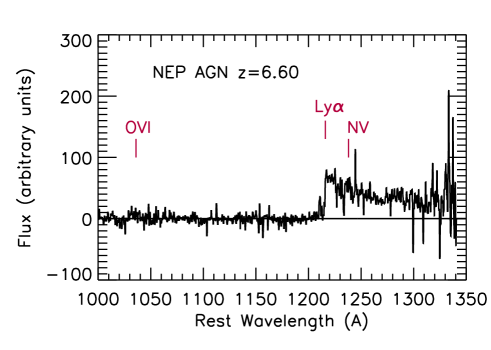
The second source is a AGN (Figure 9). In this case, the Ly forest break below the Ly emission suppresses most of the light in the -band, making this a narrowband-excess source. Sources like this can be distinguished from LAEs if the -band is sufficiently deep to measure the longer wavelength continuum.
Luminosities were computed using the redshifts and the NB921 and -band magnitudes. In Table 1, we give the magnitudes measured in a diameter aperture. An average correction of 0.3 mag was applied to correct to total magnitudes. The spectrum was approximated with a single narrow line at the observed Ly wavelength and a flat continuum above this. We then folded this spectrum through the transmission profiles for NB921 and (see Figure 4) and matched to the magnitudes to determine the line flux and continuum normalization. The luminosities were then computed from the line flux using the adopted cosmology, and are given in Table 1. We have not corrected the Ly fluxes to allow for IGM scattering losses, since it is unclear what correction to apply for these sources. However, this could increase the luminosities by as much as a factor of two.
4. Contamination by Low-Redshift Emitters
We must be concerned about the possibility of confusion with lower redshift emission line galaxies for these high flux sources. In a purely photometric selection, the primary contaminants are [O III]5007 emitters, as we discuss below. However, with spectroscopic follow-up, the [O III]5007 emitters are easily identified, given the wide doublet separation, and the main worry becomes misidentifying lower redshift [O II]3727 emitters as high-redshift LAEs. The reason for this is that the small doublet separation in [O II]3727 could produce spectra that look like complex Ly profiles if there are multiple velocity components in the emission line galaxy.
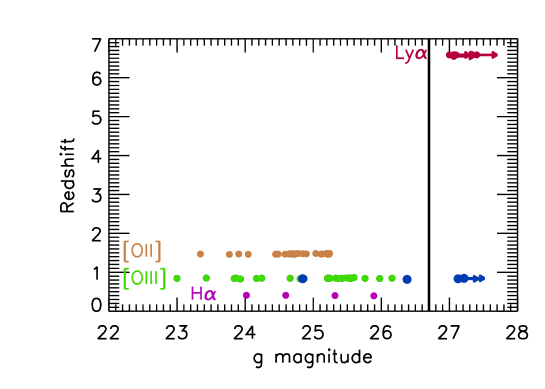
Since we can target only one LAE candidate per DEIMOS mask, we were able to explore more thoroughly the likelihood of contamination by strong emitters at low redshifts by filling the remainder of each mask with sources having NB921 and NB921 but no other selection. In this way, we found 62 [O II]3727 emitters, 53 [O III]5007, and 26 H emitters. In Figure 10, we plot these, along with the 6 spectroscopically observed LAE candidates from our primary sample (Table 1, excluding only the high-redshift AGN) versus magnitude. We show sources not detected in at the upper limits with right-pointing arrows. This includes all five spectroscopically confirmed LAEs and two of the [O III] emitters, including the one we observed as part of our primary sample. The other faint [O III] emitter is detected in the combined + + data, and we did not include it in our primary sample.
These extreme [O III] emitters are the only sources, apart from the LAEs, that are faint in , and they are the only group that includes sources that also satisfy the LAE selection criterion of NB921 (blue circles in Figure 10). However, they are easily picked out with spectroscopy, because of the wide doublet separation (as would also be the case for C IV or Mg II emitters).
The [O II]3727 emitters are all easily detected in . In contrast, the LAE with a complex profile, NEPLA4, is not detected in (Figure 7) with a limit of 27.1. It is also redder than NB921 , which none of the [O II] emitters reach. It would therefore be highly anomalous photometrically if the line we identified as Ly were instead [O II]3727.
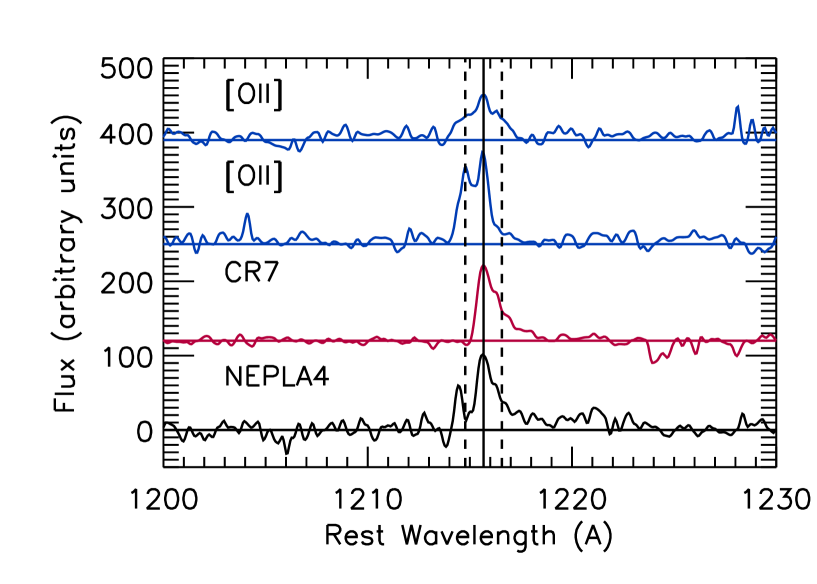
However, we can make an even more compelling argument against the line being [O II]3727 using the shape of the emission line profile. In Figure 11, we show the line profiles of NEPLA4 and CR7, and, for comparison, of two very strong [O II]3727 emitters in the field. One of these [O II] emitter profiles is a simple doublet, while the other has a more complex profile with two velocity components. The latter is the type of source most likely to be confused with a high-redshift blue-wing LAE. Since we do not know the systemic velocities of the galaxies, we measure the redshifts at the peaks of the profiles and assume that they are at zero velocity (solid vertical line). For the [O II] emitters (top two panels), we draw two dashed vertical lines to show where the second member of the doublet would lie, depending on which member of the doublet is assumed to correspond to the peak.
We can see right away that the velocity separation between the blue wing and the peak in NEPLA4 is larger than the [O II]3727 doublet separation (i.e., the difference between the solid line and one of the dashed lines). Furthermore, NEPLA4 has the strong red tail characteristic of LAEs (see, e.g., the CR7 spectrum in Figure 11), and this is not seen in the [O II]3727 emitters. We conclude that NEPLA4 is not a lower redshift [O II] emitter.
5. Line structure
From Figure 6, we can see that the line profiles of the ultraluminous LAEs are wider than those of the lower luminosity LAEs, and that, in two cases, they have complex profiles (COLA1 and NEPLA4). (MASOSA also has structure in its red tail). If these are interpreted as blue-wing LAEs, then roughly one-third of the ultraluminous LAEs fall into this category. However, with the present small numbers, the fraction is quite uncertain, with a 68% confidence range from 0.12 to 0.77.
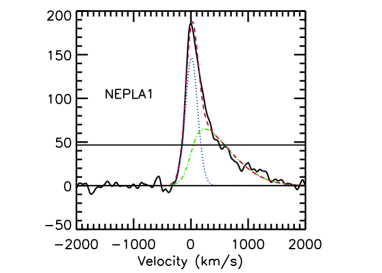
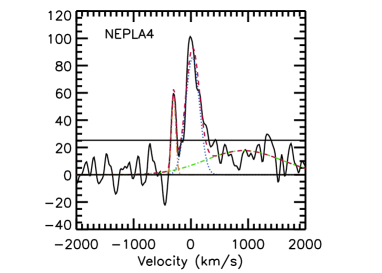
In Hu et al. (2010), we fitted the spectral profiles with a single demi-Gaussian (a Gaussian cut away on the blue side) convolved through the instrument profile. However, the present spectral profiles are more complex, so we have instead fitted them with either two (for the non-blue-wing LAEs) or three (for the blue-wing LAEs) Gaussians. We provide these fits in Table 2 where we give the amplitude, central velocity, and for each component. Again, we choose the zero velocity to correspond to the peak of the profile. We show two examples of the fits in Figure 12.
For the non-blue-wing LAEs, we also fitted the spectral profiles with two truncated Gaussians with cutoffs below the zero velocity. We provide the parameters of these fits in Table 2 in the lines labeled “cutoff”. All of these fits make assumptions about the properties of the lines, so we have also given two simple measures of the line widths—the full-width at half-maximum (FWHM) and the full-width at quarter-maximum (FWQM)—in columns (2) and (3). For the FWQMs, we restricted to velocities within of the peak.
In order to compare with the lower luminosity LAE sample, we measured the FWQMs for the LAEs in Hu et al. (2010) with high enough S/N for this quantity to be well defined. We also measured the FWQM for the stacked spectrum of all quality 1 sources in Hu et al. (2010); we provide these results and fits as the last entries in Table 2.
In Figure 13, we compare the FWQMs for the lower luminosity LAE sample (black squares for the individual points, and black line for the stacked spectrum) with those from the ultraluminous LAE sample (red diamonds for the non-blue-wing LAEs, and blue circles for the blue-wing LAEs). We find those for the lower luminosity LAE sample to be systematically lower. For the blue-wing LAEs, we show both the FWQM (upper point) and the result once we exclude the blue wing (lower point).
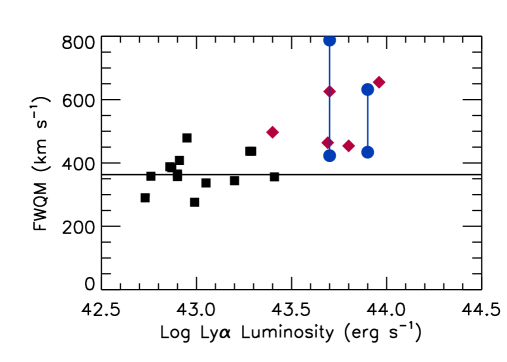
The transition between the relatively uniform lower luminosity LAE sample and the wider range of the ultra-luminous LAE sample corresponds very roughly to , though with the present relatively small sample the transition point is quite uncertain, at least at the 0.1-0.2 dex level (see Figure 13). However, the difference between the high- and low-luminosity samples is highly significant. A Mann-Whitney test give a two tailed probability of 0.0027 for the LAEs being drawn from the same sample as the LAEs. If we divide instead at 43.4, then the two tailed probability is 0.0034.
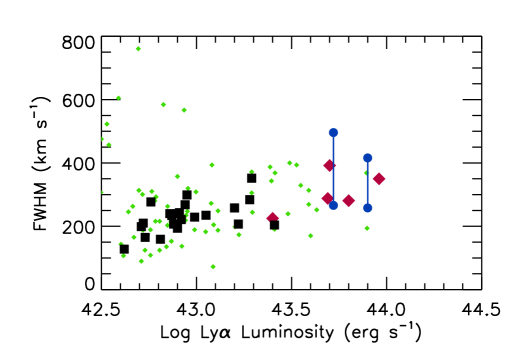
This difference is le thenss clearly seen in the FWHMs, which we show in the lower panel of Figure 13. In this panel, in addition to comparing with the Hu et al. (2010) sample (black squares) we also compare with the compilation of Matthee et al. (2017b) (excluding CR7 and MASOSA, which otherwise would appear twice). The Matthee compilation shows more scatter, possibly partly reflecting more variation in the quality of the spectra, but both this and the Hu sample show a somewhat smoother rise in the FWHM widths as we move to higher luminosities than is seen in the FWQMs. It appears that the changes in the profiles are mostly in the red tails (see Figure 6), and the FWQMs provide a better characterization of the red tails than the FWHMs.
| R.A. (2000) | Decl. (2000) | NB921 | -band | FluxaaFluxes and luminosities are only given for confirmed LAEs. | )aaFluxes and luminosities are only given for confirmed LAEs. | Redshift | Name |
|---|---|---|---|---|---|---|---|
| (deg) | (deg) | (AB) | (AB) | (erg cm-2 s-1) | (erg s-1) | ||
| (1) | (2) | (3) | (4) | (5) | (6) | (7) | (8) |
| 273.73837 | 65.285995 | 22.75 | 25.16 | 1.9 | 43.96 | 6.5942 | NEPLA1 |
| 263.17966 | 65.520416 | 22.91 | 24.39 | … | … | 6.6000 | NEPAGN |
| 277.74066 | 68.367943 | 23.17 | 24.57 | … | … | 0.8439 | OIII |
| 263.61490 | 67.593971 | 23.20 | 25.31 | 1.2 | 43.76 | 6.5835? | NEPLA2 |
| 265.22437 | 65.510361 | 23.42 | 25.23 | 1.0 | 43.69 | 6.5915 | NEPLA3 |
| 268.29211 | 65.109581 | 23.30 | 25.42 | 1.1 | 43.72 | 6.5480 | NEPLA4 |
| 269.68964 | 65.944748 | 23.47 | 24.95 | 1.0 | 43.70 | 6.5367 | NEPLA5 |
| Component 1 | Component 2 | Component 3 | |||||||||
|---|---|---|---|---|---|---|---|---|---|---|---|
| (main) | (red tail) | (blue wing) | |||||||||
| FWHM | FWQM | amp | amp | amp | |||||||
| () | () | () | () | () | () | () | () | ||||
| (1) | (2) | (3) | (4) | (5) | (6) | (7) | (8) | (9) | (10) | (11) | (12) |
| CR7 | 281 | 454 | 86 | -3 | 68 | 53 | 175 | 154 | … | … | … |
| cutoff | 281 | 454 | 181 | -39 | 67 | 76 | 32 | 228 | … | … | … |
| MASOSA | 225 | 497 | 82 | -19 | 80 | 32 | 219 | 150 | … | … | … |
| cutoff | 225 | 497 | 241 | -77 | 92 | 34 | 213 | 150 | … | … | … |
| NEPLA3 | 288 | 464 | 95 | -5 | 79 | 56 | 169 | 154 | … | … | … |
| cutoff | 288 | 464 | 219 | -60 | 83 | 86 | 28 | 216 | … | … | … |
| NEPLA1 | 350 | 655 | 153 | 32 | 122 | 52 | 443 | 36 | … | … | … |
| cutoff | 350 | 655 | 378 | -100 | 138 | 73 | 0 | 613 | … | … | … |
| NEPLA5 | 392 | 626 | 50 | 34 | 152 | 10 | 520 | 516 | … | … | … |
| cutoff | 392 | 626 | 131 | -100 | 145 | 19 | 0 | 658 | … | … | … |
| COLA1 | 416 | 632 | 70 | 8 | 69 | 55 | 67 | 236 | 40 | -242 | 594 |
| NEPLA4 | 496 | 788 | 85 | 28 | 120 | 17 | 919 | 667 | 57 | -300 | 36 |
| Lower Lum. | |||||||||||
| Stacked | 221 | 366 | 15 | -15 | 66 | 9 | 136 | 150 | … | … | … |
| cutoff | 221 | 366 | 38 | -52 | 68 | 14 | 0 | 209 | … | … | … |
6. Discussion
6.1. Complex line profiles
In contrast to the lower luminosity LAEs at , which show very little variation in either the line profiles or the line widths (Hu et al. 2010), we have found that the LAEs at show both wider and more complex profiles. At lower redshifts (), Konno et al. (2015) and Matthee et al. (2017b) suggest that most LAEs are associated with AGNs. However, at , Matthee et al. argue that the relative narrowness of the Ly lines (see Alexandroff et al. 2013; Matsuoka et al. 2016) and the absence of C IV 1550 Å suggest that the sources may primarily be powered by star formation rather than by AGN activity. We note that COLA1 also shows no sign of CIV in a deep MOSFIRE observation of the -band (A. Barger et al. 2018, in preparation). Nevertheless, we must keep in mind the possibility that the ultraluminous LAEs may have contributions to their emission from AGNs.
While the wider profiles in the ultraluminous LAEs might be understood as being caused by higher velocity outflows in these more luminous galaxies, the presence of the more complex profiles suggests that a more likely explanation is that these LAEs lie in highly ionized regions. This allows the full Ly emission line profile of the galaxy itself to be visible. The absence of IGM scattering near the LAE would both increase the observed width of the line and allow the blue wing to be visible.
Another line of evidence that ultraluminous LAEs may lie in different environments comes from Matthee et al. (2015) and Bagley et al. (2016), who find little evolution in the ultraluminous LAE LF between and and between and , respectively. In contrast, the lower luminosity ( erg s-1) LAE LF evolves significantly (by a factor of in normalization) over the redshift range and (Hu et al. 2010; Ouchi et al. 2010). Matthee et al. and Bagley et al. argue that if the evolution of the lower luminosity LAE LF is at least partly driven by the increasing neutrality of the IGM with increasing redshift, then a relative lack of evolution in the ultraluminous LAE LF could be due to these sources lying in large H II regions that protect them from changes in the IGM neutrality. However, we caution that the normalization of the ultraluminous LAE LF at used by Matthee et al. has been questioned by Konno et al. (2017).
Unfortunately, understanding Ly profiles is not easy at any redshift (e.g., Verhamme et al. 2012). In particular, modeling Ly profiles requires making assumptions about the underlying galaxy and the amount and phase structure of outflows and inflows (although the kinematics of the high-redshift LAEs may be explored directly with ALMA observations of the [C II] fine structure line, as Matthee et al. 2017a have shown for CR7). Thus, rather than trying to compare with models, we instead compare with lower redshift LAEs. This also involves assumptions, since the galaxy properties and the relative importance of outflows and inflows may change with redshift, but it is relatively straightforward.
Based on the present NEP observations and the previous data from the COSMOS field (Hu et al. 2016), we estimate that the fraction of blue-wing LAEs in the ultraluminous LAEs is %, where the subscript and superscript give the 68% confidence range. With the present relatively small number of sources, the uncertainty is large, but this is broadly consistent with the results at lower redshifts, where about 30% of LAEs at show multi-component profiles (Kulas et al. 2012). (Yamada et al. 2012 give an even higher fraction of around 50% at , but this may be biased upwards owing to the noise in the spectra. The Yamada region is also significantly overdense and this might also affect the properties of the LAEs.) Scarlata et al. (2018, in preparation) see a similar fraction of about 30% blue-wing LAEs in a LAE sample observed with the COS spectrograph on HST. We do not expect these LAEs to be strongly affected by IGM opacity, so this percentage could be applicable to high-redshift galaxies enclosed in giant H II regions, if the underlying galaxy properties are similar.
Since we do not have measurements of other optical or UV lines, we cannot establish an absolute velocity scale for the Ly lines. However, the variety of profiles appears very similar to what is seen in LAEs at lower redshift. Even for the pure red-tail sources, such as NEPLA1 and CR7, there are many similar low-redshift sources with red tails and sharp cutoffs on the blue side with which to compare; this type of profile can therefore arise without the presence of IGM scattering.
For the complex profile LAEs (i.e., NEPLA4 and COLA1), we measure the peak-to-peak velocity separations between the main and blue wing components to be 300 and 270 , respectively. These are smaller than the values seen in the sample, where Kulas et al. (2012) find a median peak-to-peak separation of 757 in the multi-peak sources, but similar to the values seen in the sample of Scarlata et al. (2018), where the median peak-to-peak separation is 339 . This might suggest that the LAEs are better analogs to the LAEs in terms of their inflow and outflow properties.
Both NEPLA4 and COLA1 have Ly profiles with strong blue sides: the ratios of the peak of the blue wing component to the peak of the red tail component are 0.6 and 0.5, respectively. These are stronger than those generally seen in low-redshift samples. The mean ratio in the Scarlata et al. (2018) sample is 0.35, though the maximum value is 0.66. The strong blue sides at suggest that we must be seeing significant infall. This, in turn, suggests that these may be young galaxies in the early stages of formation and consistent with CR7, which Sobral et al. (2015) have argued is young and metal-poor.
6.2. Escape fraction
In Hu et al. (2016), we discussed what can be inferred about the escape of ionizing photons if the ionized regions around the LAEs transition from optically thick to optically thin at a characteristic Ly luminosity. The intrinsic ionizing photon production rate of a galaxy is related to its intrinsic Ly luminosity through (e.g., Matthee et al. 2015), assuming only that case B is appropriate, that the IMF has a Salpeter power law at high mass, and that the Ly luminosity is not significantly reduced in the galaxy itself. If the last assumption is violated, then will be higher.
If the transition from optically thick to optically thin occurs at around , as the data suggest, then the ionizing photon rate is , where is the fraction of ionized photons that escape from the galaxy into the IGM222Note that there is a typographical error in Hu et al. (2016), where this is given as . The remainder of their discussion is correct.. We expect that the ionized region generated from this will be large enough that radiation damping wings from neutral gas in the IGM outside the ionized region may be neglected, unless the IGM is substantially neutral (Miralda-Escudé 1998; Haiman 2002). Thus, the crucial quantity is the scattering of the Ly profile by the residual neutral gas in the ionized region (Haiman 2002; Haiman & Cen 2005). Only the neutral gas at velocities lower than the galaxy matters, and this scatters the blue side of the Ly line.
The fraction of neutral hydrogen in the ionized zone is given by
| (1) |
where is the clumping factor, is the radial distance from the galaxy, the recombination coefficient is computed at a temperature of K, and the mean ionization cross section is that given by Cen & Haiman (2000). This rises toward the outside edge of the zone and is smallest near the LAE itself.
If we neglect density fluctuations of the gas inside the ionized region and use the calculations of Haiman (2002) corresponding to , then there is a very significant opacity of at the wavelength of the blue wing (solid line in Figure 1 of Haiman (2002)). However, density fluctuations within the ionized region reduce the average opacity, and a more realistic treatment of this effect reduces the value of to at the wavelength of the blue wing (long dashed line in Figure 1 of Haiman (2002)). If we assume the transition from optically thick to optically thin ionized bubbles occurs at an optical scattering depth of , then we can scale the Haiman results to . Combining this with our estimate of the ionizing photon rate at the transition, we find . However, the uncertainty in the calculation of the reduction arising from density fluctuations is significant and should be borne in mind.
7. Summary
We have so far surveyed a area (out of planned) around the North Ecliptic Pole using the NB921 filter on HSC on the Subaru telescope as part of our HEROES program to search for ultraluminous LAEs at . Our follow-up observations of seven candidate LAEs (out of 13) with the DEIMOS spectrograph on Keck II showed that the spectral profiles of the five confirmed LAEs are wider than those of lower luminosity LAEs at this redshift. We also found that one galaxy, NEPLA4, has a complex profile with an apparent blue wing that is similar to, but slightly wider than, the complex profile of the COLA1 galaxy found by Hu et al. (2016) in the extended COSMOS field.
Combining our results from the NEP and COSMOS fields, we find that, above a Ly luminosity of (Ly erg s-1, roughly a quarter (2 out of 8) of the LAEs have complex profiles with apparent blue wings. This fraction is very similar to the fraction of LAEs with blue wings at , where IGM scattering is not significant, allowing the full profile emerging from the galaxy to be visible. The peak-to-peak velocity separations between the main and blue wing components are also similar to those seen in the LAEs, suggesting that they may be good analogs in terms of their inflow and outflow properties.
We can understand the existence of such complex Ly profiles at if the ultraluminous LAEs are generating ionized zones around themselves with low enough neutrality that they do not significantly scatter the blue wings (e.g., Haiman 2002; Matthee et al. 2015). Then the full Ly line would be able to emerge from the galaxy and be seen, even if the general IGM is substantially neutral (e.g., Cen & Haiman 2000; Haiman 2002).
We also found that the Ly profiles of the ultraluminous LAEs at are wider relative to those at lower luminosities at the same redshift, suggesting that the more luminous LAEs have larger inflow and outflow velocities than the lower luminosity LAEs.
Using calculations by Haiman (2002), we matched the ionizing photon rate that corresponds to the Ly luminosity at the transition from optically thick to optically thin ionization bubbles with what would be required to keep the optical scattering depth less than one, in order to estimate the escape fraction of ionizing photons generated in the LAE. We found a value of . However, more sophisticated calculations of the density structure in the ionized regions are clearly needed.
The present samples are small, but spectroscopic follow-up of ultraluminous LAEs at selected from HSC observations is continuing. In particular, the final HEROES sample should yield about 20 such galaxies and about 7 additional blue-wing LAEs similar to NEPLA4 and COLA1. Future modeling of the profiles should allow us to begin to determine the kinematic structure of galaxies at these redshifts.
References
- Alexandroff et al. (2013) Alexandroff, R., Strauss, M. A., Greene, J. E., et al. 2013, MNRAS, 435, 3306
- Bagley et al. (2016) Bagley, M. B., Scarlata, C., Dai, Y. S., et al. 2016, in American Astronomical Society Meeting Abstracts, Vol. 227, American Astronomical Society Meeting Abstracts, 342.52
- Bouwens et al. (2015) Bouwens, R. J., Illingworth, G. D., Oesch, P. A., et al. 2015, ApJ, 803, 34
- Cen & Haiman (2000) Cen, R., & Haiman, Z. 2000, ApJ, 542, L75
- Cowie et al. (1996) Cowie, L. L., Songaila, A., Hu, E. M., & Cohen, J. G. 1996, AJ, 112, 839
- Finkelstein et al. (2015) Finkelstein, S. L., Ryan, Jr., R. E., Papovich, C., et al. 2015, ApJ, 810, 71
- Fontana et al. (2010) Fontana, A., Vanzella, E., Pentericci, L., et al. 2010, ApJ, 725, L205
- Haiman (2002) Haiman, Z. 2002, ApJ, 576, L1
- Haiman & Cen (2005) Haiman, Z., & Cen, R. 2005, ApJ, 623, 627
- Hu et al. (2010) Hu, E. M., Cowie, L. L., Barger, A. J., et al. 2010, ApJ, 725, 394
- Hu et al. (2016) Hu, E. M., Cowie, L. L., Songaila, A., et al. 2016, ApJ, 825, L7
- Konno et al. (2015) Konno, A., Ouchi, M., Nakajima, K., et al. 2015, ArXiv e-prints, arXiv:1512.01854
- Konno et al. (2014) Konno, A., Ouchi, M., Ono, Y., et al. 2014, ApJ, 797, 16
- Konno et al. (2017) Konno, A., Ouchi, M., Shibuya, T., et al. 2017, ArXiv e-prints, arXiv:1705.01222
- Kulas et al. (2012) Kulas, K. R., Shapley, A. E., Kollmeier, J. A., et al. 2012, ApJ, 745, 33
- Magnier et al. (2017) Magnier, E. A., Schlafly, E. F., Finkbeiner, D. P., et al. 2017, ArXiv e-prints, arXiv:1612.05242
- Magnier et al. (2016) Magnier, E. A., Sweeney, W. E., Chambers, K. C., et al. 2016, ArXiv e-prints, arXiv:1612.05244
- Matsuoka et al. (2016) Matsuoka, Y., Onoue, M., Kashikawa, N., et al. 2016, ApJ, 828, 26
- Matthee et al. (2015) Matthee, J., Sobral, D., Santos, S., et al. 2015, MNRAS, 451, 400
- Matthee et al. (2017a) Matthee, J., Sobral, D., Boone, F., et al. 2017a, ApJ, 851, 145
- Matthee et al. (2017b) Matthee, J., Sobral, D., Darvish, B., et al. 2017b, MNRAS, 472, 772
- McLure et al. (2013) McLure, R. J., Dunlop, J. S., Bowler, R. A. A., et al. 2013, MNRAS, 432, 2696
- Merloni et al. (2012) Merloni, A., Predehl, P., Becker, W., et al. 2012, ArXiv e-prints, arXiv:1209.3114
- Miralda-Escudé (1998) Miralda-Escudé, J. 1998, ApJ, 501, 15
- Miyazaki et al. (2012) Miyazaki, S., Komiyama, Y., Nakaya, H., et al. 2012, in Proc. SPIE, Vol. 8446, Ground-based and Airborne Instrumentation for Astronomy IV, 84460Z
- Neufeld (1990) Neufeld, D. A. 1990, ApJ, 350, 216
- Ouchi et al. (2010) Ouchi, M., Shimasaku, K., Furusawa, H., et al. 2010, ApJ, 723, 869
- Roberts-Borsani et al. (2016) Roberts-Borsani, G. W., Bouwens, R. J., Oesch, P. A., et al. 2016, ApJ, 823, 143
- Robertson et al. (2010) Robertson, B. E., Ellis, R. S., Dunlop, J. S., McLure, R. J., & Stark, D. P. 2010, Nature, 468, 49
- Santos et al. (2016) Santos, S., Sobral, D., & Matthee, J. 2016, MNRAS, 463, 1678
- Sobral et al. (2017) Sobral, D., Matthee, J., Best, P., et al. 2017, MNRAS, 466, 1242
- Sobral et al. (2015) Sobral, D., Matthee, J., Darvish, B., et al. 2015, ApJ, 808, 139
- Stark et al. (2010) Stark, D. P., Ellis, R. S., Chiu, K., Ouchi, M., & Bunker, A. 2010, MNRAS, 408, 1628
- Stark et al. (2015) Stark, D. P., Walth, G., Charlot, S., et al. 2015, MNRAS, 454, 1393
- Stark et al. (2017) Stark, D. P., Ellis, R. S., Charlot, S., et al. 2017, MNRAS, 464, 469
- Verhamme et al. (2012) Verhamme, A., Dubois, Y., Blaizot, J., et al. 2012, A&A, 546, A111
- Waters et al. (2016) Waters, C. Z., Magnier, E. A., Price, P. A., et al. 2016, ArXiv e-prints, arXiv:1612.05245
- Yamada et al. (2012) Yamada, T., Matsuda, Y., Kousai, K., et al. 2012, ApJ, 751, 29
- Zheng et al. (2017) Zheng, Z.-Y., Wang, J., Rhoads, J., et al. 2017, ApJ, 842, L22
- Zitrin et al. (2015) Zitrin, A., Labbé, I., Belli, S., et al. 2015, ApJ, 810, L12