Supplemental Material for
“Static friction boost in edge-driven incommensurate contacts”
Davide Mandelli
Department of Physical Chemistry, School of Chemistry,
The Raymond and Beverly Sackler Faculty of Exact Sciences and The
Sackler Center for Computational Molecular and Materials Science,
Tel Aviv University, Tel Aviv 6997801, Israel
Roberto Guerra
Center for Complexity and Biosystems, Department of Physics, University of Milan, 20133 Milan, Italy
Wengen Ouyang
Department of Physical Chemistry, School of Chemistry,
The Raymond and Beverly Sackler Faculty of Exact Sciences and The
Sackler Center for Computational Molecular and Materials Science,
Tel Aviv University, Tel Aviv 6997801, Israel
Michael Urbakh
Department of Physical Chemistry, School of Chemistry,
The Raymond and Beverly Sackler Faculty of Exact Sciences and The
Sackler Center for Computational Molecular and Materials Science,
Tel Aviv University, Tel Aviv 6997801, Israel
Andrea Vanossi
CNR-IOM Democritos National Simulation Center, Via Bonomea 265, 34136 Trieste, Italy
International School for Advanced Studies (SISSA), Via Bonomea 265, 34136 Trieste, Italy
S1 Aubry transition in the infinite 2D FK model
The main scope of the present study is to test the conditions under which elasticity effects may
hamper the superlubricity phenomenon in incommensurate contacts under non-uniform drivings.
To model this scenario care must be taken in the choice of the model parameters. In fact, it has been
reported Mandelli2015; Mandelli2017; Brazda2018 that infinite two dimensional incommensurate contacts
undergo an Aubry-like phase transition Aubry1983 – where static friction turns from zero to finite,
and superlubricity is lost – when the substrate potential strength (see equation (3) in the main text)
exceeds a critical value . In Ref. Mandelli2015 it was shown that a signature of the
Aubry transition in underdense interfaces () is the appearance of a network of dislocations
separating domains where the monolayer snaps to commensuration with the substrate. Moreover, the value of
was found to depend on the misalignment angle between the contacting lattices.
In order to select a value of , safely within the superlubric regime of our interest,
we performed test simulations of infinite interfaces adopting periodic boundary conditions (pbc).
We considered three supercells realizing misalignment angles of , , and .
The latter corresponds to the optimal (Novaco-McTague) angle predicted to be energetically
favorable Novaco1977 for our chosen overdense interface lattice mismatch ratio
(), and spring constants ratio .
The method adopted to construct the supercells is found in Ref. Mandelli2015.
For each supercell we considered increasing values in the
range – , and we relaxed the positions of all atoms via damped dynamics. Finally, for each relaxed
configurations, we established the presence/absence of a finite static friction force by applying
a uniform driving, following the procedure outlined in Section II.B of the main text. We used a step
to increase adiabatically the external force per atom. We note here that due
to computational limitations we could not investigate smaller values of within reasonable simulation times.
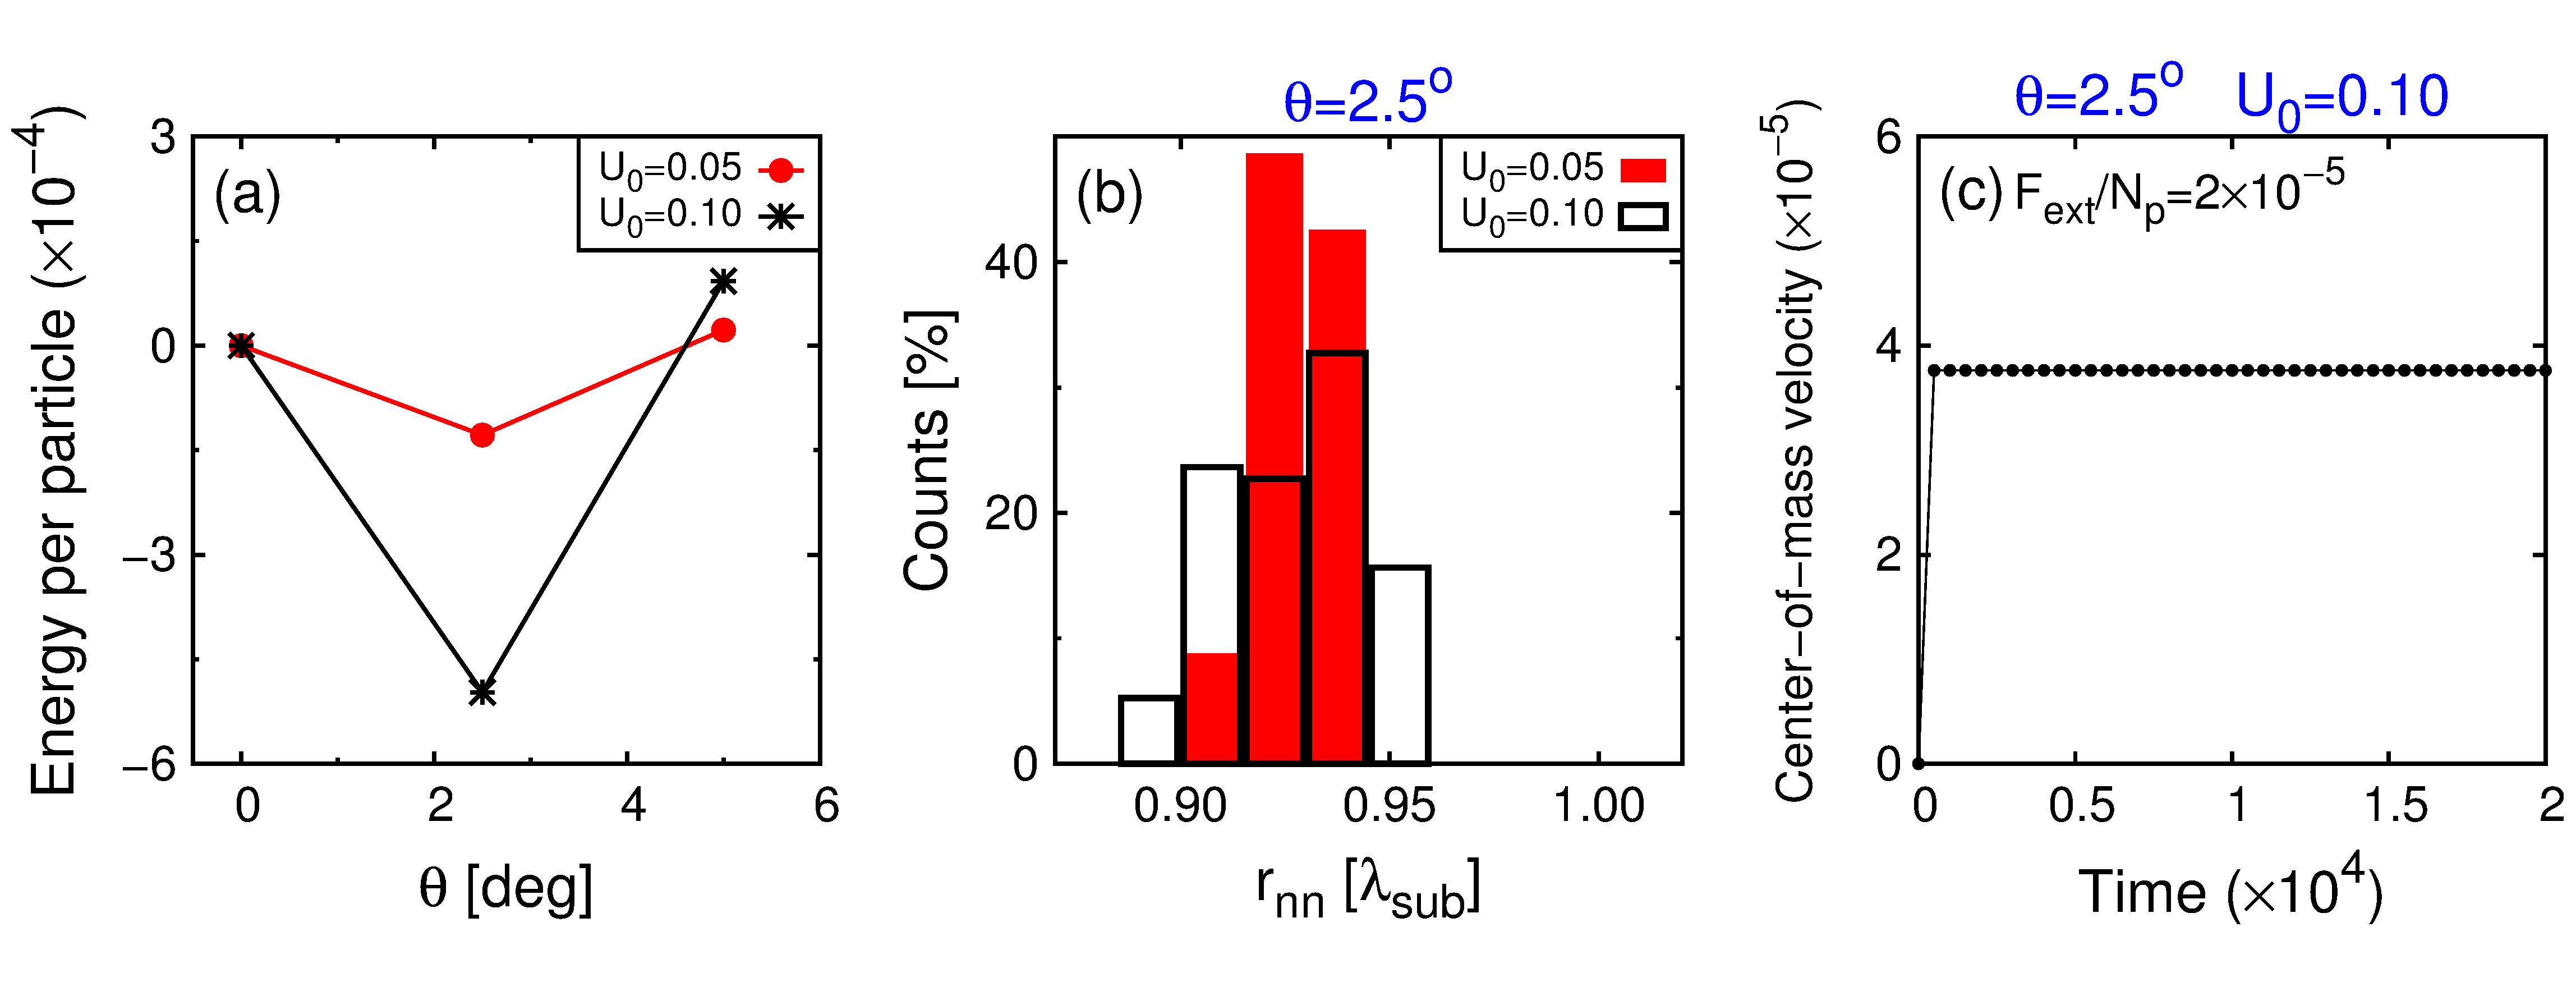
Up to , results show that:
(i) The orientation is
energetically favorable (see Fig. S1a below), demonstrating that the system is in the linear
response regime expected for weak substrate corrugation strengths Novaco1977;
(ii) The relaxed configurations at rest () do
not show any localized commensurate dislocation, the final distribution of the nearest neighbor distances
being narrow and peaked around the equilibrium value
(see Fig. S1b);
(iii) At each misalignment angle, all the monolayers are free to slide already at the smallest value of the applied
external force, (see Fig. S1c).
We conclude that the value of adopted in the simulations discussed in the main text is reasonably
below the critical threshold for the breakdown of superlubricity induced by the
Aubry transition. This ensures that the bulk of the circular islands effectively model a superlubric contact,
and they would move freely under the action of any arbitrarily small external force if it was not for the pinning
effects introduced by the presence of the edges.
Hello
Figure S1: (a) Total energy per particle as a function of the misalignment angle in the simulations
in pbc. The energy of the aligned configuration at is used as reference value.
Red and black curves are results obtained for two different substrate potential strengths of
and , respectively. The minimum of the total energy energy coincides with the optimal
Novaco-McTague angle predicted by linear response theory Novaco1977.
(b) Distributions of the nearest-neighbor distances (in units of the substrate periodicity
) obtained in the simulations in pbc at .
Filled red boxes and empty black boxes are results for two different substrate potential strengths of
and , respectively. Both distributions are narrow and peaked around the
equilibrium value, . Local commensuration () is absent.
(c) The velocity of the center-of-mass of the monolayer in pbc at misalignment
, and substrate potential strength , sliding subject
to a small external force of .
After an initial transient, steady-state is reached and the monolayer slides at constant
velocity, proving that static friction is vanishingly small. For comparison, note that the
single particle static friction force is four
orders of magnitude larger than the smallest external force (per particle) considered here. All simulations
were performed adopting the following set of parameters of our 2D FK model: , , ,
. For the sliding simulations we adopted
a viscous damping , which is necessary in order to reach steady state.
S2 Estimation of in the 2D FK model and in the atomistic simulations
The core width of interfacial edge dislocations in our 2D FK model is given by Sharp2016
(1)
where and are the lattice spacing and shear modulus of the slider, and is the maximum shear
stress imposed by the substrate potential. For the values of and used
in the simulations one has . We computed the shear modulus using the
relation Jasiuk1994, where and are the 2D Young modulus and Poisson’s
ratio, respectively. For our chosen square lattice of spring constants , , and lattice spacing
, one has , , , yielding .
For our considered case of gold islands sliding over graphene Eq. 1 becomes
(2)
where Å is the gold lattice spacing along loading direction, meV/Å is the maximum force along imposed by graphene on an Au atom placed at Å (the average value of a large resting island), and and (4.26 Å and 2.46 Å, respectively) are the graphene lattice spacings along and .
We have estimated GPa (compared with a bulk value of GPa), and
meV/Å3, which, assuming the bulk value of , yield
nm .
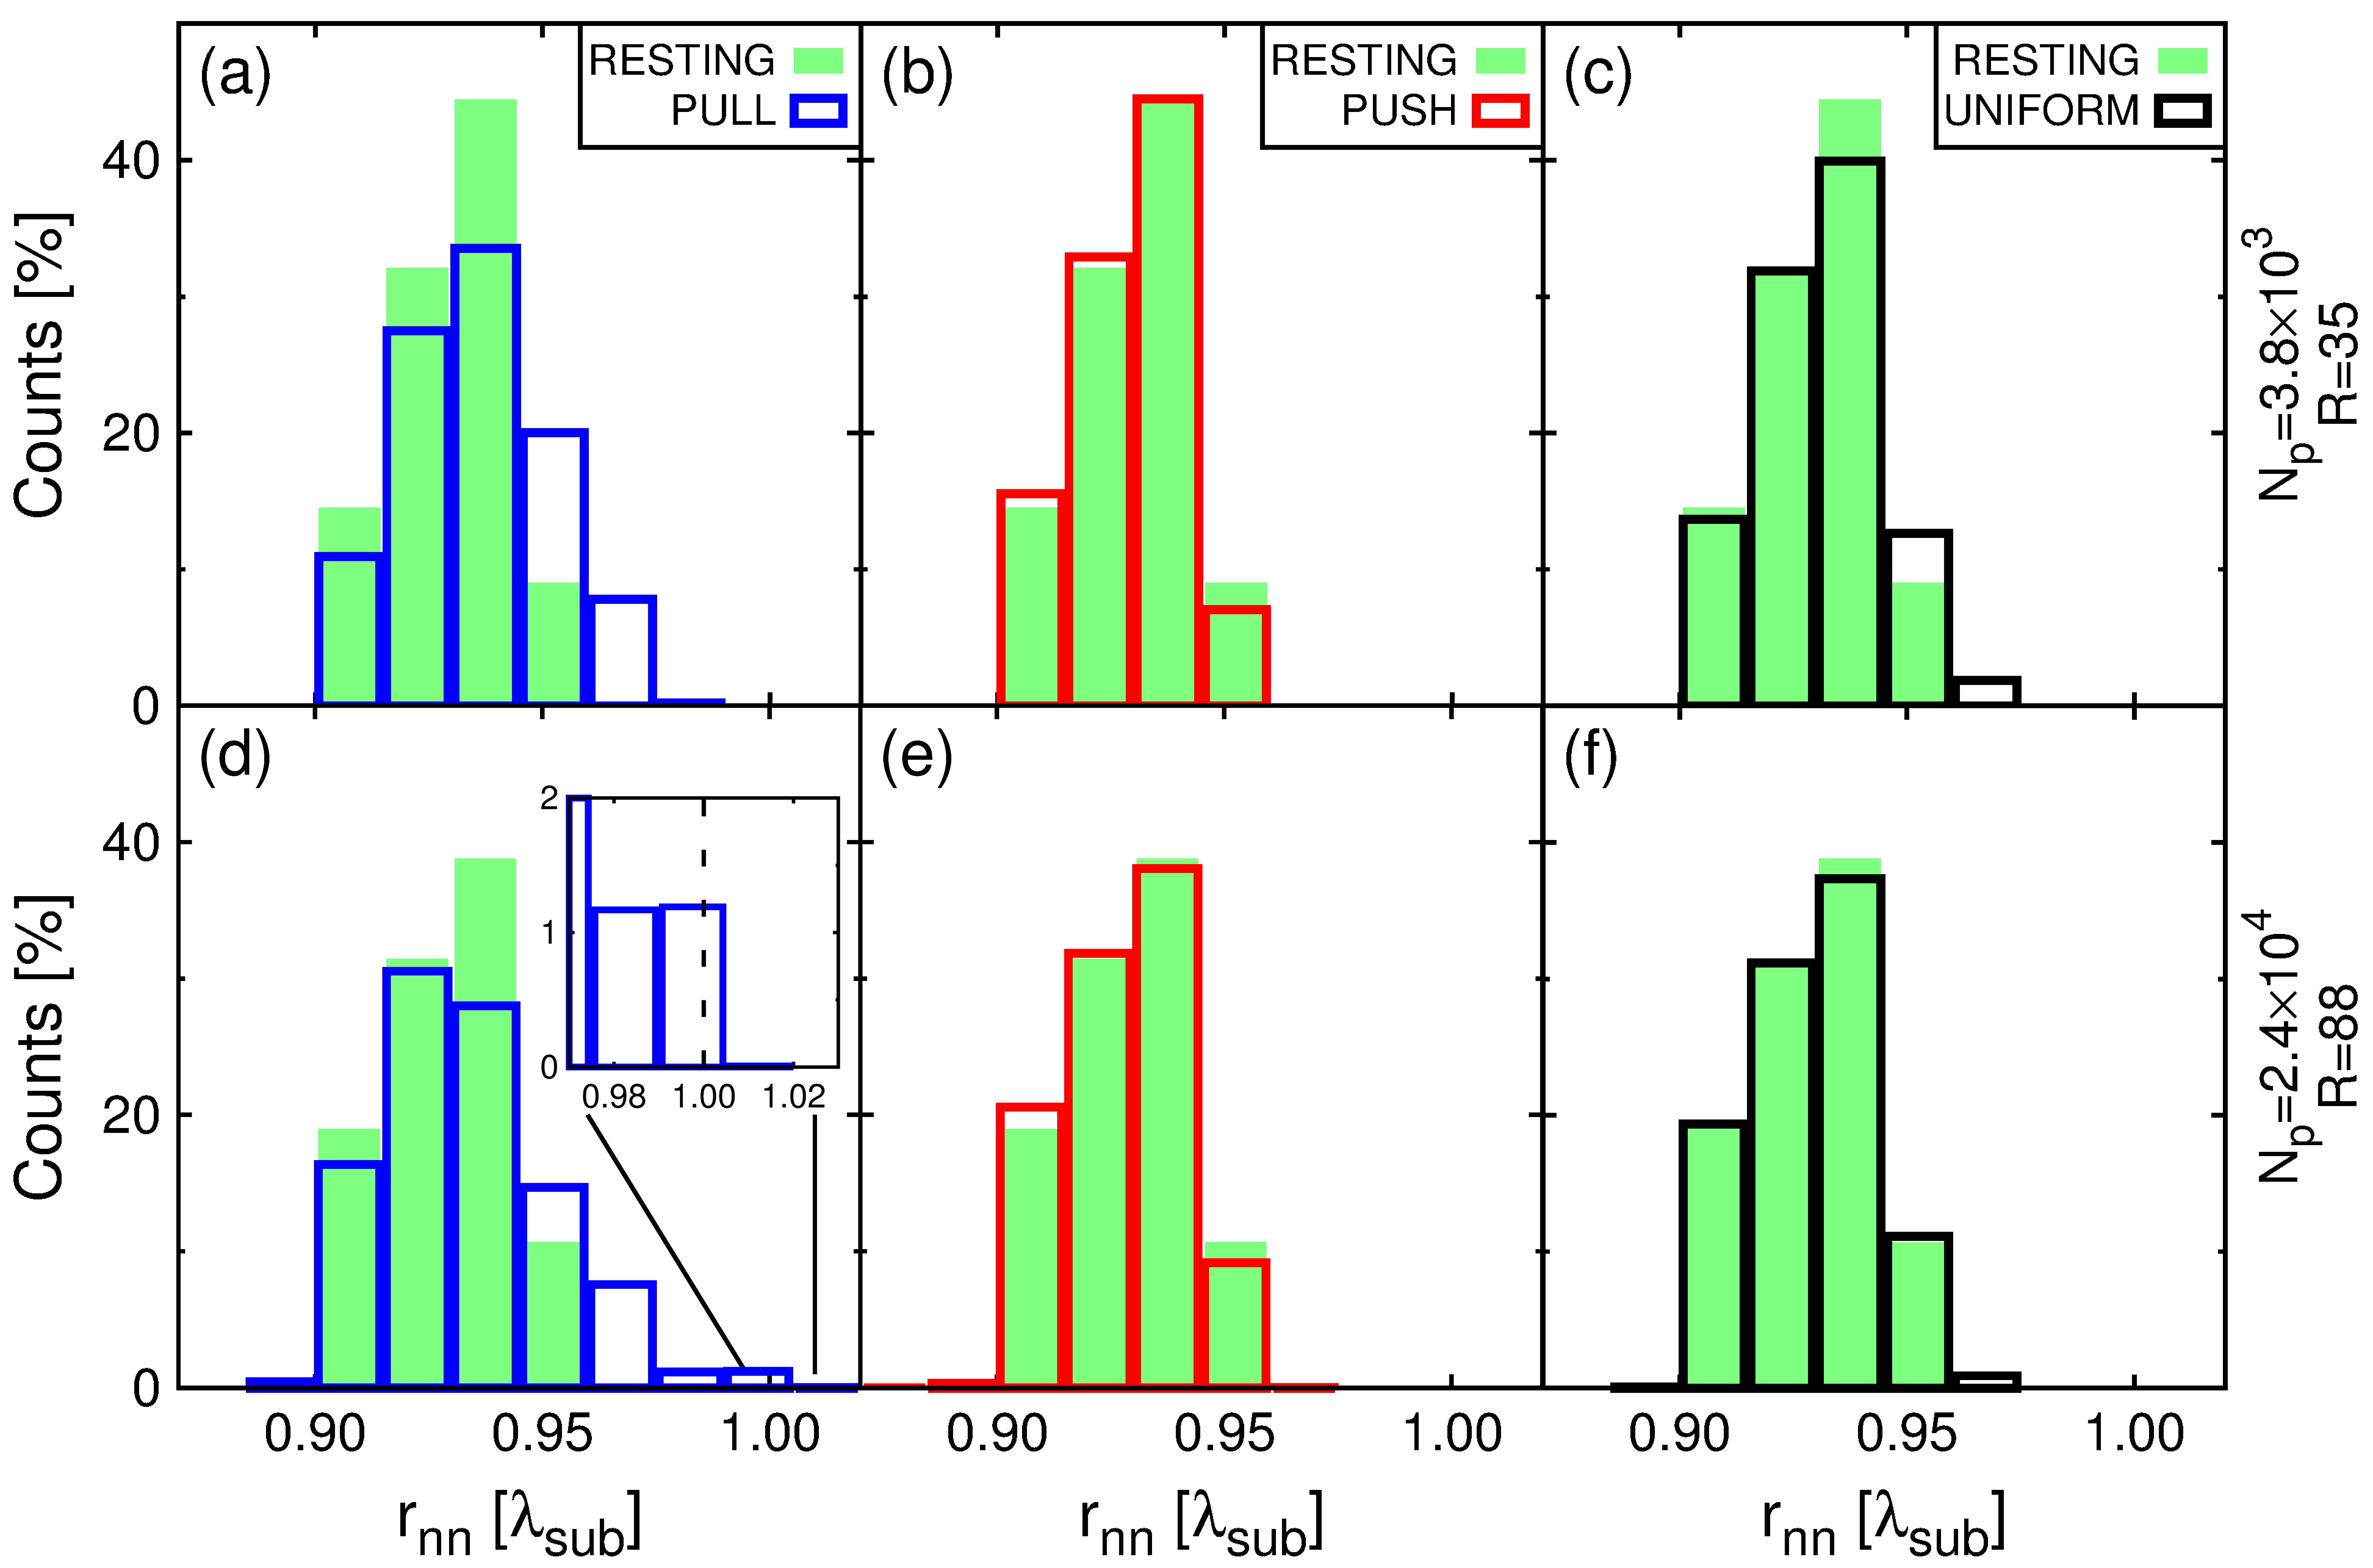
S3 Bond-length distributions in the finite 2D FK model
Figure S2 reports the distributions of the nearest-neighbor distances
measured in the circular islands of sizes (top panels) and
(bottom panels), respectively below and above the critical value
for the nucleation of a commensurate
dislocation. In both cases, the pulling protocol induces relatively large bond elongations
(see panels (a),(d)), which, in the larger island, reach local commensuration (, see
inset in panel (d)).
Compared to the bond distributions at rest, pushing is responsible for small compressions
(see panels (b),(e)), while a uniform driving results in mild elongations (see panels (c),(f)).
Figure S2: Distributions of the nearest-neighbor distances (in units of the substrate periodicity
), measured in the circular islands of size (panels (a),(b),(c))
and (panels (d),(e),(f)).
From left to right, empty boxes are histograms obtained during pulling (blue), pushing (red), and
uniform driving (black) at an applied external force , just before depinning.
For comparison, the histograms (filled green boxes) corresponding to the
relaxed configurations at rest () are also reported. All simulations
were performed adopting the following set of parameters of our 2D FK model: , , , , .
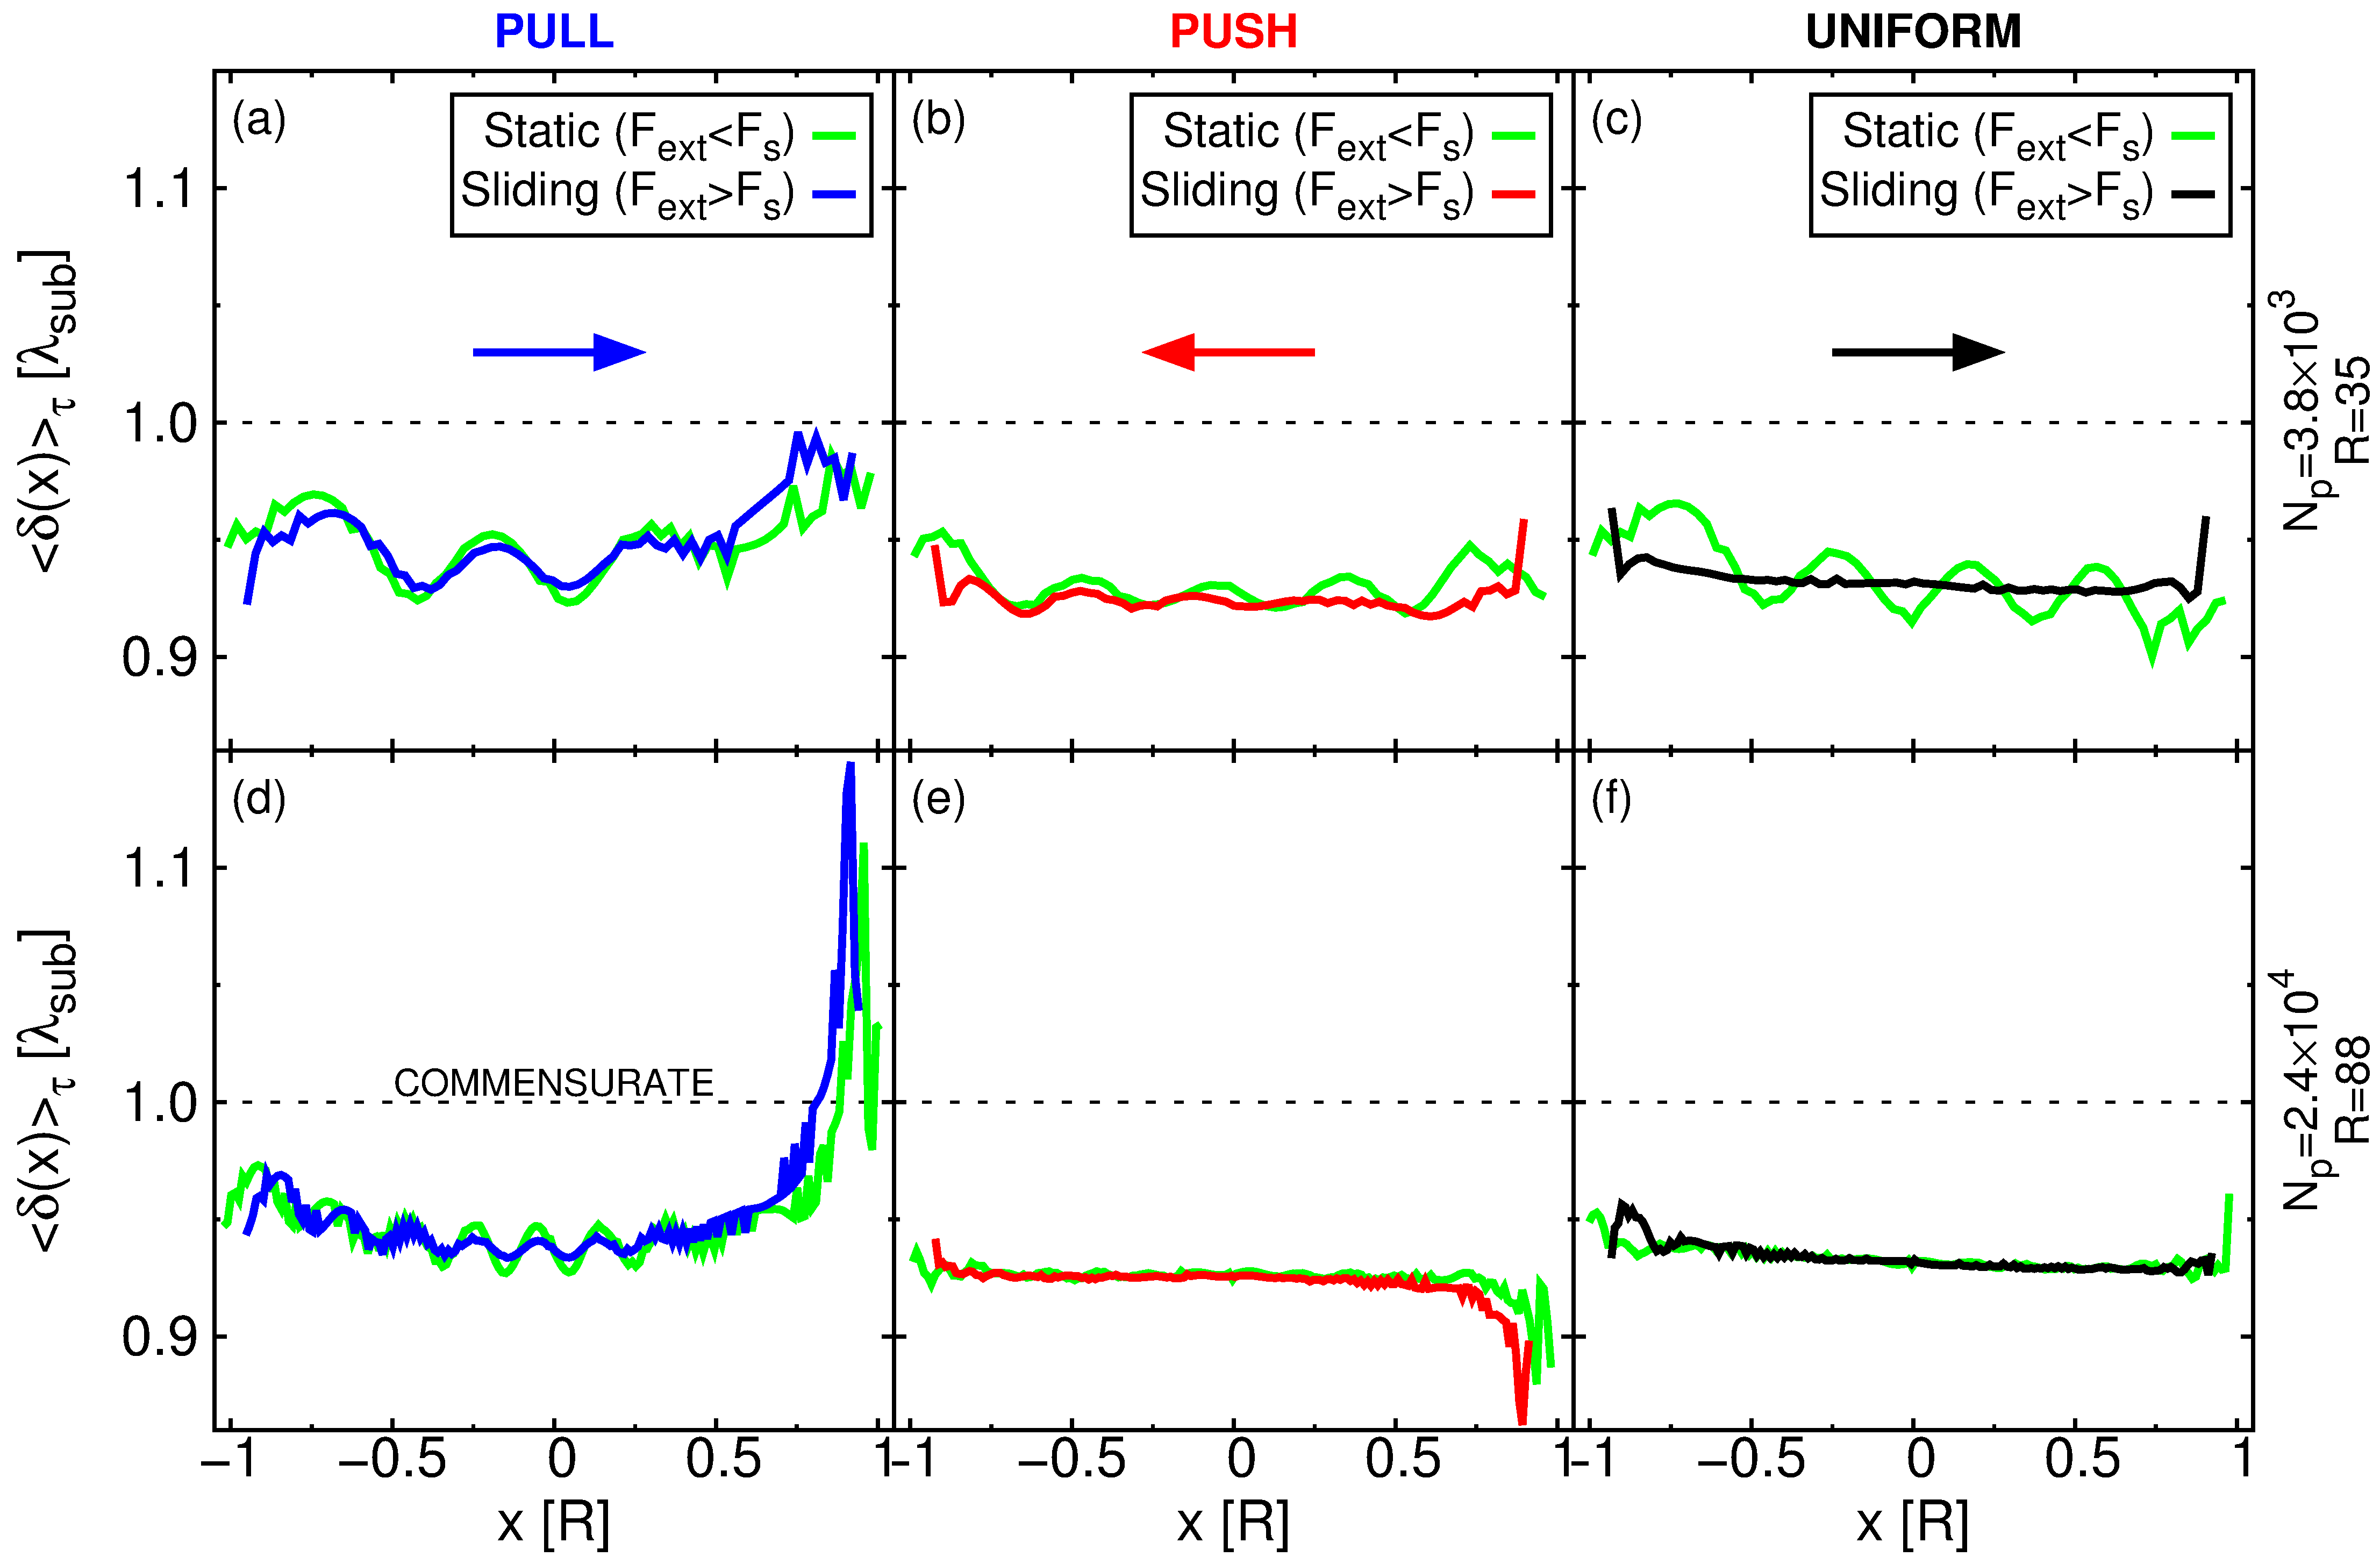
S4 Deformations under sliding in the finite 2D FK model
Figure S3 reports the time average of the local
mismatch measured under steady-sliding of the circular islands of sizes (top panels)
and (bottom panels). Compared to the static configurations before the onset of motion
(green lines in Fig. S3), we observe a general enhancement
of the local lattice distortions. A localized commensurate dislocation appears only under edge-pulling of the
larger island. During sliding, the dislocation moves towards the bulk, but remains
close to the leading edge (see panel (d)). A similar behavior was observed up to the largest size investigated.
Figure S3: The averaged local mismatch (see main text for defiinition) of two circular islands of
the 2D FK model simulations is shown. A value of indicates local commensuration
to the substrate. Panels (a),(b),(c) and (d),(e),(f) are results for two sizes of
and particles, corresponding respectively to radii of and .
From left to right: blue, red, and black lines show the time average
computed under steady sliding for the pulling, pushing, and uniform protocol.
For comparison, in each panel we also report the static values of (green lines)
measured before the onset of motion, at
an applied external force , just below the depinning threshold. Arrows indicate the
direction of in the three protocols.
All simulations were performed adopting the following set of parameters of our 2D FK model:
, , , . For the sliding simulations we adopted
a viscous damping , which is necessary in order to reach steady state.
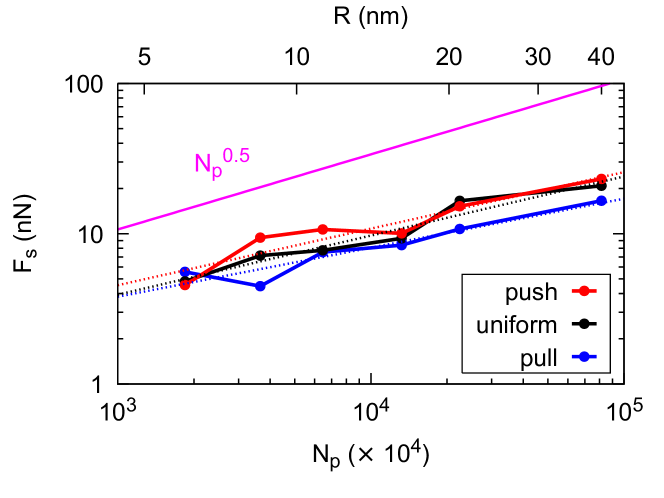
S5 Scaling exponents in the atomistic simulations
Figure S4 is a Log-Log plot of the size scaling of static friction in the
gold-graphene system. A linear fit of the data yielded the following scaling exponents:
, , and .
The limited amount of data do not allow to obtain accurate values of , that are affected by
relative errors of .
Figure S4: Log-Log plot showing the size scaling of the static friction force as a function of the number of
particles (bottom -axis) and of the radius (upper -axis) of model gold islands sliding
over graphene. Blue, black, and red lines are results obtained during the pulling, uniform, and pushing
protocols, respectively. Dotted lines are linear regressions of each data set.
The magenta line shows the square root scaling law ,
corresponding to the maximum value of the scaling exponent, expected for
incommensurate superlubric contacts.
References
(1)
D. Mandelli, A. Vanossi, M. Invernizzi, S. Paronuzzi, N. Manini, and E. Tosatti, Phys. Rev. B 92, 134306 (2015).
(2)
D. Mandelli, A. Vanossi, N. Manini, and E. Tosatti, Phys. Rev. B 95, 245403 (2017).
(3)
T. Brazda, A. Silva, N. Manini, A. Vanossi, R. Guerra, E. Tosatti, and C. Bechinger, Phys. Rev. X 8, 011050 (2018).
(4)
S. Aubry and P. Y. Le Daeron, Physica D 8, 381 (1983).
(5)
A.D. Novaco and J.P. Mc Tague, Phys. Rev. Lett. 38, 1286 (1977).
(6)
T. A. Sharp, L. Pastewka, and M.O. Robbins, Phys. Rev. B 93, 121402(R) (2016).
(7)
I. Jasiuk, J. Chen, and M. F. Thorpe, Appl. Mech. Rev. 47, S18 (1994).