Robustness and fragility of the susceptible-infected-susceptible epidemic models on complex networks
Abstract
We analyze two alterations of the standard susceptible-infected-susceptible (SIS) dynamics that preserve the central properties of spontaneous healing and infection capacity of a vertex increasing unlimitedly with its degree. All models have the same epidemic thresholds in mean-field theories but depending on the network properties, simulations yield a dual scenario, in which the epidemic thresholds of the modified SIS models can be either dramatically altered or remain unchanged in comparison with the standard dynamics. For uncorrelated synthetic networks having a power-law degree distribution with exponent , the SIS dynamics are robust exhibiting essentially the same outcomes for all investigated models. A threshold in better agreement with the heterogeneous rather than quenched mean-field theory is observed in the modified dynamics for exponent . Differences are more remarkable for where a finite threshold is found in the modified models in contrast with the vanishing threshold of the original one. This duality is elucidated in terms of epidemic lifespan on star graphs. We verify that the activation of the modified SIS models is triggered in the innermost component of the network given by a -core decomposition for while it happens only for in the standard model. For , the activation in the modified dynamics is collective involving essentially the whole network while it is triggered by hubs in the standard SIS. The duality also appears in the finite-size scaling of the critical quantities where mean-field behaviors are observed for the modified, but not for the original dynamics. Our results feed the discussions about the most proper conceptions of epidemic models to describe real systems and the choices of the most suitable theoretical approaches to deal with these models.
I Introduction
Network science has been marked by its interdisciplinary nature since its consolidation as a new branch Barabási and Pósfai (2016); Albert and Barabási (2002), especially the investigation of dynamical processes on networked substrates Barrat et al. (2008). Epidemic spreading, one of the most prominent and widely investigated issues, is usually investigated by means of stochastic agent-based models Pastor-Satorras et al. (2015). Despite several advances in the understanding of epidemic models on networks Pastor-Satorras et al. (2015); Chatterjee and Durrett (2009); Durrett (2010); Castellano and Pastor-Satorras (2010); Gleeson (2013); Kitsak et al. (2010); Newman (2002); Boguñá et al. (2013), it remains target of recent intensive investigations Ferreira et al. (2016); Mata and Ferreira (2015); de Arruda et al. (2017); St-Onge et al. (2018); Cai et al. (2016); Wei et al. (2017); Castellano and Pastor-Satorras (2017); Chen et al. (2018).
One of the most basic but still not fully understood epidemic processes on networks is the susceptible-infected-susceptible (SIS) model Pastor-Satorras et al. (2015), which consists of agents lying on the vertices of a network which can be infected or susceptible. Infected individuals become spontaneously healed (susceptible) with rate and transmit the disease to their susceptible contacts with rate . In principle, the SIS dynamics can exhibit a phase transition between a disease-free (absorbing) state and an active stationary phase, in which the epidemics persists in an endemic state. The transition occurs at an epidemic threshold . However, for uncorrelated random networks with a power-law degree distribution , it was rigorously proved Chatterjee and Durrett (2009) and later put in sound physical grounds Boguñá et al. (2013) that the absorbing phase is unstable in the thermodynamic limit implying that the epidemic threshold is formally zero.
Considering that both real and computationally generated networks are finite, the finite-size dependence of the epidemic variables is a fundamental issue. Analytically, it is frequently accessed by mean-field approximations that take into account the network heterogeneity, but truncate at some level the dynamical correlations Gleeson (2013). Two classes of mean-field theories are mostly used. The degree-based theory Pastor-Satorras and Vespignani (2001a, b), termed as heterogeneous mean-field (HMF) Barabási and Pósfai (2016); Barrat et al. (2008), is a coarse-grained mixing approach, in which the vertex degree is the relevant quantity. This method is closely related to the annealed network regime where the connections are rewired in time scales much shorter than those of the dynamical processes taking place on the top of the network Dorogovtsev et al. (2008); Pastor-Satorras et al. (2015). The individual-based theory Wang et al. (2003); Van Mieghem (2012); Chakrabarti et al. (2008), termed quenched mean-field (QMF) Castellano and Pastor-Satorras (2010), considers the network structure without mixing using its adjacency matrix Barabási and Pósfai (2016). These theories predict equivalent epidemic thresholds of the SIS dynamics on uncorrelated random networks with power-law degree distribution of exponent but are sharply conflicting for Castellano and Pastor-Satorras (2010), for which HMF predicts finite thresholds whereas QMF vanishing ones as . The latter is asymptotically in agreement with the exact results Durrett (2010); Chatterjee and Durrett (2009) and supported by stochastic simulations Ferreira et al. (2012); Mata and Ferreira (2013); Boguñá et al. (2013). For , both theories state a null threshold as but the way that the asymptotic value is approached and, thus, the effective finite-size thresholds are different. Improvements of these theories including dynamical correlations by means of pairwise approximations Gleeson (2013) do not change the foregoing scenarios Mata and Ferreira (2013); Mata et al. (2014); Cai et al. (2016).
Recently, a criterion formerly conceived for SIS model Boguñá et al. (2013) was applied to determine the nature of epidemic thresholds of generic processes on networks with power-law degree distributions Ferreira et al. (2016). The criterion involves the recovering time of an epidemics on a star graph, consisting of a central vertex connected to leaves of degree 1 that mimics the hubs of a network, and the time that the hubs take to mutually transmit the infection to each other. If , hubs remain active for times sufficiently long to infect each other and the epidemics is triggered by the mutual activation of hubs, leading to a vanishing threshold in the thermodynamic limit. If , the mutual reinfection is knocked out and the transition to an endemic phase can only take place collectively involving a finite fraction of the network and happens at a finite threshold. In Ref. Ferreira et al. (2016), this criterion notably predicted that waning immunity Anderson and May (1992), in which infected individuals are temporarily immunized before to become susceptible, leads to a finite threshold for which disagrees with the prediction of QMF approximation, but in agreement with extensive numerical simulations.
A fundamental question naturally arises. How robust is the hub mutual activation mechanism of the standard SIS dynamics? In the present work, we tackle this problem comparing slightly modified versions of the standard SIS model, preserving the spontaneous healing and infection capacity increasing proportionally to the vertex degree. All modified and original models have the same thresholds in both HMF and QMF theories. However, the criterion of mutual reinfection time of hubs Ferreira et al. (2016); Boguñá et al. (2013) predicts a finite threshold in the thermodynamic limit for the modified models in uncorrelated networks Catanzaro et al. (2005) with , in contrast with the standard SIS. Stochastic simulations Cota and Ferreira (2017) on large networks corroborate this prediction. For , we observed that the modified dynamics present a vanishing threshold in better agreement with HMF than QMF. For , the SIS infection mechanism is robust and all models have essentially the same epidemic threshold. This duality is explained in terms of epidemic activation mechanisms Kitsak et al. (2010); Castellano and Pastor-Satorras (2012); Ferreira et al. (2016).
Our results gathered with previous reports of Ref. Ferreira et al. (2016), in which waning immunity can drastically change the threshold behavior, lead to the following take-home messages. Firstly, the metastable, localized, and active states of the standard SIS dynamics necessary to sustain the endemic activity for any infection rate for are not universal and their realizations in real epidemic processes may be unrealistic. Second, for the widely more frequent case of networks with , the null threshold is a robust feature, obtained irrespectively of the existence of locally self-activated star subgraphs. In such an absence, epidemics is triggered in the innermost, densely connected component of the network given by a -core decomposition Dorogovtsev et al. (2006), while for the original SIS model it happens only for Castellano and Pastor-Satorras (2012). Last but not least, the HMF theory Pastor-Satorras and Vespignani (2001a); Barrat et al. (2008); Pastor-Satorras et al. (2015), which has been frequently pretermitted due to its failure in capturing the asymptotically null epidemic threshold of the standard SIS for Wang et al. (2003); Castellano and Pastor-Satorras (2010); Van Mieghem (2012), is more accurate than the QMF theory for the present modified SIS models and also in other models as contact processes Mata et al. (2014) and SIRS Ferreira et al. (2016). The origins of this worse performance of the QMF theory is discussed in our conclusions.
The remaining of the paper is organized as follows. Section II describes the investigated models, and their mean-field theories are discussed in Sec. III. Epidemic thresholds obtained in numerical simulations are presented and compared with mean-field theories in Sec. IV. The finite-size scaling of the critical quantities are provided in Sec. V. We draw our concluding remarks and prospects in Sec. VI. Appendices A, B, and C complement the paper with analytical and numerical details.
II Epidemic models
We investigate three epidemic dynamics where each vertex of the network can be either infected or susceptible. The infected ones are spontaneously healed with rate in all models. In the standard SIS, hereafter called SIS-, an infected vertex infects each susceptible nearest-neighbor with rate . In the SIS- model, infection is a threshold process where susceptible vertices are infected with rate if they have at least one infected nearest-neighbor111This is an asynchronous version of the model investigated in seminal papers Pastor-Satorras (2002); Pastor-Satorras and Vespignani (2001a) dealing with epidemic spreading on networks.. Finally, SIS- is a modification of the contact process Marro and Dickman (1999) where the infected vertices simultaneously infect all susceptible neighbors with rate . The symbols , , and make reference to standard, threshold, and all in the model definitions. The models rules and some details of their computer implementations described in Appendix A are summarized in Table 1.
| SIS- (threshold) Dickman and Burschka (1988); Böttcher et al. (2018) | SIS- (all) Sander et al. (2009); de Oliveira et al. (2016) | SIS- (standard) Pastor-Satorras et al. (2015) |
| Infected vertices are | Infected vertices are | Infected vertices are |
| spontaneously healed | spontaneously healed | spontaneously healed |
| with rate | with rate | with rate |
| Susceptible vertices become | Infected vertices infect | Infected vertices |
| infected with rate | at once all susceptible | independently infect |
| if they have at least one | neighbors with | each susceptible neighbor |
| infected neighbor | rate | with rate |
| GA infection probability | GA infection probability | GA infection probability |
| GA time step | GA time step | GA time step |
The modified dynamics preserve two central features of the standard SIS model: spontaneous healing and infection capacity of a vertex increasing proportionally to its degree. All models have their counterparts in regular lattices with a fixed coordination number : SIS- can be mapped in the contact process (CP) Harris (1974); Marro and Dickman (1999), in which infected vertices transmit to a nearest-neighbor chosen at random with rate and heals spontaneously, using . SIS- was investigated in Refs. Sander et al. (2009); de Oliveira et al. (2016) while SIS- was investigated in Refs. Dickman and Burschka (1988); Böttcher et al. (2018). In lattices, all models belong to the directed percolation universality class Marro and Dickman (1999).
Figure 1 shows two important situations where the modified models differ from the standard SIS. Consider an infinitesimal time interval and an infected vertex (the center) surrounded by susceptible neighbors (leaves); see Fig. 1(a). The probability that leaves are infected by the center for both SIS- and SIS- is
| (1) |
while for SIS- it is
| (2) |
where is the Kronecker delta symbol. Note that both expressions produce the same mean number of infected leaves . Now, the probability that a susceptible center surrounded by infected leaves, Fig. 1(b), is infected is given by
| (3) |
for SIS- and SIS- while for SIS- it becomes
| (4) |
So, while the infection of leaves by the center in SIS- is equivalent to SIS-, the infection of the center by leaves in SIS- is equivalent to SIS-.

The simulations of these models were performed using the algorithms described in Appendix A, which include phantom processes Cota and Ferreira (2017) in the statistically exact Gillespie algorithm (GA) Gillespie (1976) for the simulations of general Markovian stochastic processes. Some important implementation details are highlighted in Table 1. The equivalence between optimized prescriptions and the original GA as well as their computational performances for several models, including SIS-, can be found in Ref. Cota and Ferreira (2017). The implementations of SIS- and can be derived in an analogous way.
III Mean field analysis
The HMF theory consists in dynamical equations for the probability that a vertex of degree is infected and disregards the stochasticity of the process. The probability that a neighbor of a vertex of degree is infected reads as Pastor-Satorras (2002) where is the probability that a neighbor of a vertex with degree has degree . So, evolves as
| (5) |
where for SIS- and SIS-, and for SIS-. The QMF theory consists of dynamical equations for the probability that a vertex is infected and reads as
| (6) |
where for SIS- and SIS-, and
for SIS-, in which and the adjacency matrix is given by if and are connected and otherwise. The multiple simultaneous infections in SIS- do not play a role in these one-vertex mean-field theories since there are no multiple connections. It is worth to mentioning that the HMF theory of SIS- for uncorrelated networks with Pastor-Satorras et al. (2001) was recently investigated Morita (2016).
The mean-field epidemic thresholds can be obtained with the stability analysis and linearization of Eqs. (5) and (6) around the fixed points or , respectively. The linearized equations are the same for the three models
| (7) |
and
| (8) |
where . The HMF and QMF thresholds are obtained when the largest eigenvalue of the respective Jacobians and are zero. For the HMF theory, it is given by Boguñá and Pastor-Satorras (2002)
| (9) |
where is the largest eigenvalue of . For uncorrelated networks we obtain
| (10) |
where . For the QMF theory, we obtain Castellano and Pastor-Satorras (2010)
| (11) |
where is the largest eigenvalue of the adjacency matrix .
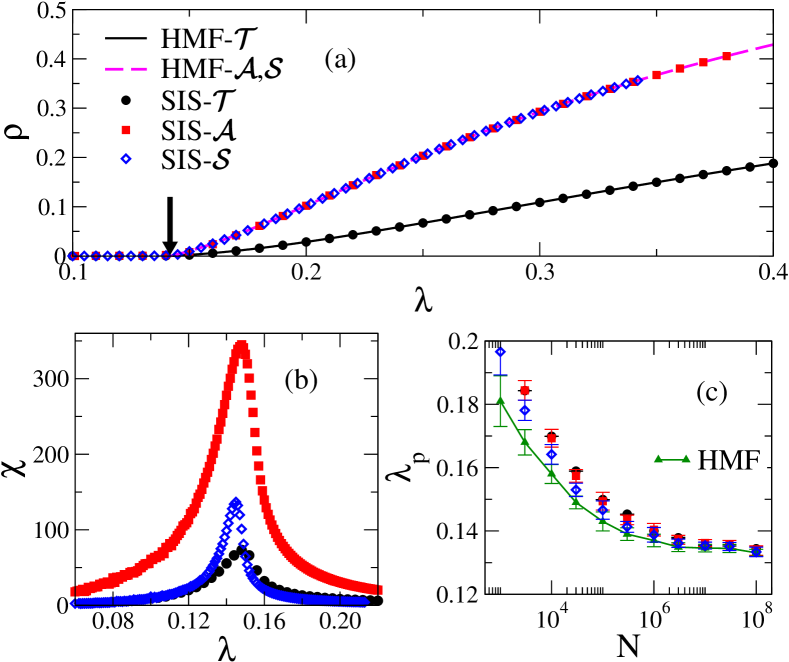
The HMF theory on uncorrelated networks was compared with the numerical simulations on annealed networks (see Appendix A), for which this theory exactly predicts the threshold and average density of infected vertices in the thermodynamic limit Dorogovtsev et al. (2008); Boguñá et al. (2009). Simulations with absorbing states near the transition need special techniques Cota and Ferreira (2017). We use here the standard quasistationary (QS) method described in Ref. Sander et al. (2016), in which the averaging is constrained to the active states and converges to the actual stationary phase in the thermodynamic limit. The threshold in finite networks can be estimated using the principal peak of the dynamical susceptibility defined in the QS state as Ferreira et al. (2012)
| (12) |
Figures 2(a) and (c) confirm the agreement between simulations on annealed networks and HMF theory for the stationary densities and the thresholds, respectively, in all investigated models. However, the fluctuations of the order parameter are different as shown by the susceptibility curves in Fig. 2(b). See also Sec. V.
IV SIS models on synthetic quenched networks
IV.1 Epidemic thresholds
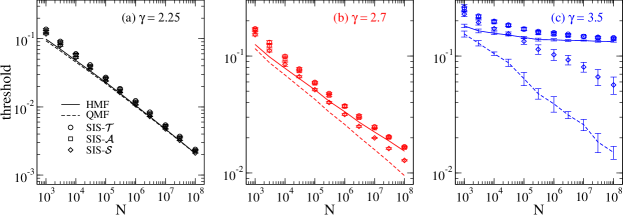
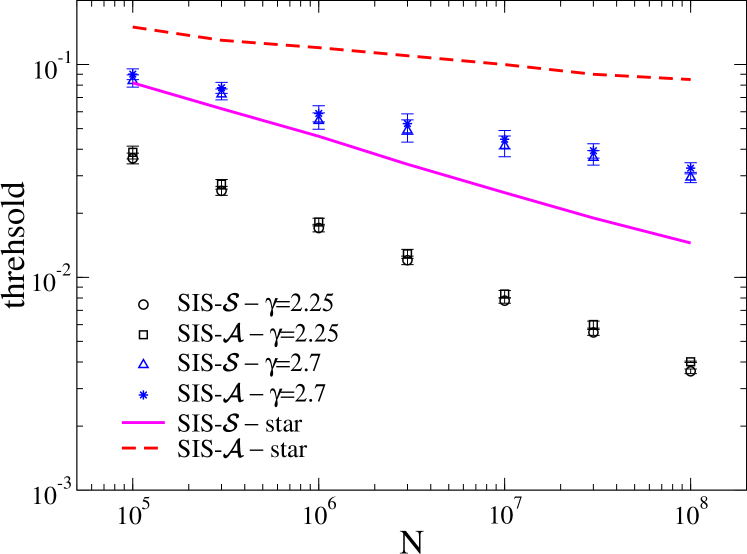
We investigate networks having power-law degree distribution , generated with the uncorrelated configuration model (UCM) Catanzaro et al. (2005) with minimal vertex degree and structural upper cutoff , granting the absence of degree correlations Boguñá et al. (2004) permitting, therefore, comparison with the HMF epidemic threshold given by Eq. (10). The thresholds obtained in simulations are compared with HMF and QMF theories in Fig. 3.
For , here represented by in Fig. 3(a), all models have approximately the same threshold well described by both HMF and QMF theories, which have already been reported for SIS- Ferreira et al. (2012).
For , represented by in Fig. 3(b), SIS- and SIS- have essentially the same threshold whose scaling is very well fitted by the HMF theory and deviates from QMF. The threshold of the standard SIS- vanishes with a scaling deviating from both HMF and QMF scalings. A good agreement between the threshold of the standard SIS for can be recovered with the pairwise QMF theory of Ref. Mata and Ferreira (2013) but not with the pairwise HMF theory of Refs. Mata et al. (2014); Cai et al. (2016); see Appendix B.
The results for modified SIS models are markedly contrasting with the standard one222In the case of multiple peaks, which can be observed in SIS- on large UCM networks with Ferreira et al. (2012); Mata and Ferreira (2013), the principal peak is the one that provide a threshold closest to the lifespan divergence and matches the threshold of the lifespan method proposed in Ref. Boguñá et al. (2013); see Ref. Mata and Ferreira (2015). for , represented by in Fig. 3(c). The modified SIS- and dynamics present a finite threshold in very satisfactory accordance with HMF theory and contrasting with the original SIS- that presents the well-known threshold approaching zero as the size increases. Note, however, that the thresholds of SIS- have a scaling incompatible with QMF for the investigated size range that cannot be reckoned by neither pairwise QMF Mata and Ferreira (2013) or HMF Mata et al. (2014); Cai et al. (2016) theories (see Appendix B). The latter still predicts a finite threshold, inconsistent with simulations and the rigorous results Chatterjee and Durrett (2009) for SIS-.
IV.2 Activation mechanisms for
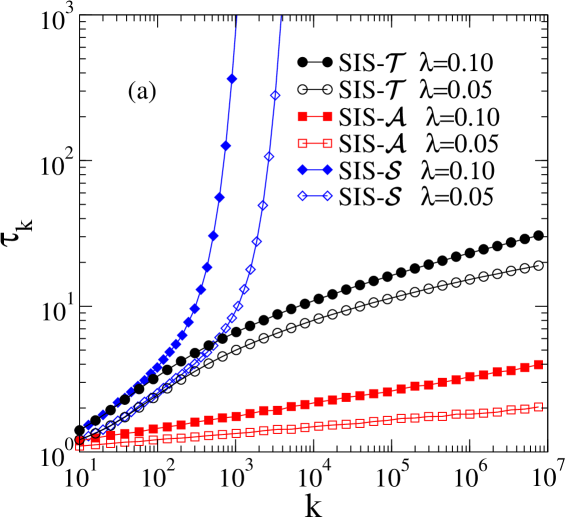
To clarify the antagonistic results for , we consider the recovering time of the epidemics on star graphs for small values of . Figure 4(a) shows the epidemic lifespan for the distinct SIS models as a function of the star graph size. For standard SIS-, we see an exponential growth predicted by the approximated discrete time dynamics of Ref. Boguñá et al. (2013) (also Ref. Ferreira et al. (2016)) given by ; see Appendix C. However, SIS- and SIS- present epidemic lifespans increasing very slowly with graph size, consistent with a logarithmic growth. Applying the discrete time approach, a finite lifespan is obtained for SIS- and, after some refinement of the theory, a logarithmic increase is found for SIS-; see Appendix C for details. Indeed, the activities in SIS- are more correlated, and this has a significant effect on the probability of hub activation.
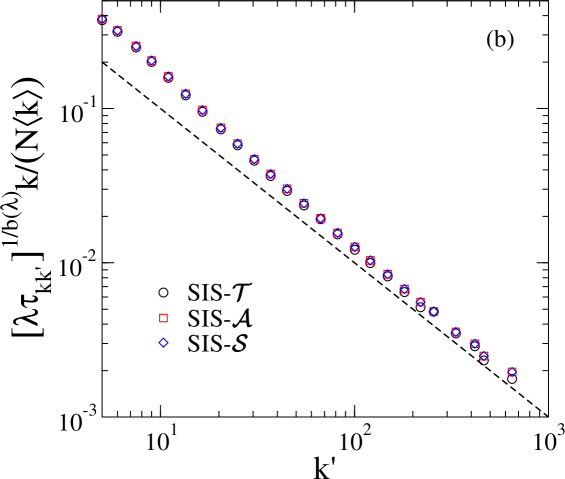
An upper bound for the long-range infection times of hubs of degrees and , denoted by , for uncorrelated networks can be obtained following the same steps of Ref. Boguñá et al. (2013) (also Ref. Ferreira et al. (2016)). The result is the same for all investigated SIS models and given by
| (13) |
where and . Even being rigorously an upper bound, the right-hand side of Eq (13) works very accurately for and such that we can adopt as done for SIS- Boguñá et al. (2013) and other epidemic models Ferreira et al. (2016). This agreement is confirmed in Fig. 4(b) for . The simulation is run keeping one single vertex of degree always infected (never heals) and computing the time for the infection to reach for the first time each vertex of the network, limited to a maximal time . Vertices that were not reached are not included in the averages but they represent a tiny fraction.
With the approximation given by the right-hand side of Eq. (13), we have that where is the largest degree of the network that scales as for UCM networks with Boguñá et al. (2004). Also, we have that is finite since converges to a constant as for , providing an algebraic increase of with . The condition is obeyed such that epidemics in the modified SIS models cannot be activated by hubs when and a collective phase transition at finite threshold is expected Ferreira et al. (2016) in contrast with of the standard SIS, in which the hub activation mechanism is at work and the threshold is null in the thermodynamic limit.
IV.3 Activation mechanisms for
For , the hubs are sufficiently close Hołyst et al. (2005) to infect each other even if their activity lifespans are not too large (exponential) and the threshold goes to zero for all models as . However, there exists a difference in the threshold scaling for but does not for . It has been claimed Kitsak et al. (2010) that the most effective spreaders in an epidemic processes lie in a subset containing the innermost core of the networks identified by the maximal index of the -core decomposition333A -core decomposition consists of the following pruning process. Remove all vertices with degree plus their edges and all other vertices that possess a degree after the removal until no more vertices of degree appear in the process. Next, the procedure is repeated for all vertices of degree and so on until all vertices are removed. The maximal -core corresponds to the subset of vertices and edges removed in the last step of the decomposition. Dorogovtsev et al. (2008, 2006). For SIS-, this mechanism is claimed to hold for uncorrelated networks with but the case has activation ruled by the hubs Castellano and Pastor-Satorras (2012). Since hubs cannot be activated in isolation for arbitrarily small in SIS- and SIS-, we propose that the epidemic threshold should be ruled by the subgraph identified by the maximal -core for the whole range of scale-free networks with .
To check this conjecture we ran SIS models on subgraphs containing only the vertices belonging to either the maximum -core or the star graph centered on the most connected vertex of the network with degree . Figure 5(a) shows that the SIS- and SIS- essentially have the same activation threshold for the maximal -core for both values of and while the activation of the stars centered on the most connected vertex happens in very different thresholds for these models. The same analysis holds in the not shown data for SIS-. Therefore, the following framework can be drawn. For , the -core is activated first than hubs and the epidemic activation is triggered in the maximal -core for all models. For , the hubs are activated firstly for SIS- while -core is activated firstly in the other models such that the epidemic activation is due to hubs for the standard model and still -core for the modified dynamics.
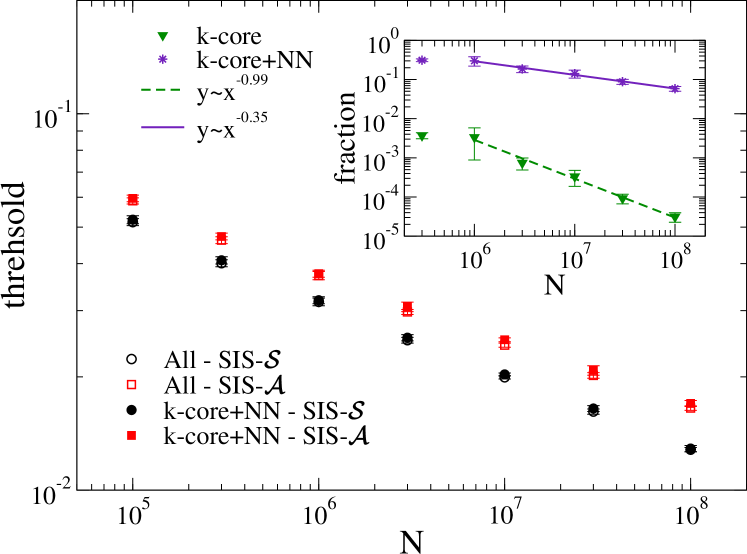
For , the effective epidemic thresholds for the entire networks are smaller than those calculated using only the maximal -core or star centered on the largest hub even with these subgraphs being associated with the activation of the epidemics. We performed simulations in a subgraph with the maximal -core plus their nearest-neighbors, which still represents a sub-extensive fraction of the network as shown in the inset of Fig. 6. The epidemic thresholds in this subset are essentially the same as those of the whole network for all models, as shown in Fig. 6 for SIS- and SIS-. The trimming of edges reduces the epidemic activity in the subset containing only the maximal -core while the -core mediates the mutual interactions among hubs in the activation driven by them. We see that a large fraction of the network is redundant for the epidemic threshold independently if hub (SIS-) or -core activation (SIS- and ) is at work. In both cases, the relevant region to reproduce the numerical threshold includes the maximal -core plus its nearest-neighbors.
Returning to the case , UCM networks do not present a -core structure in the sense that the decomposition provides a single component containing the whole network Dorogovtsev et al. (2006). So, since hubs cannot sustain activity for , the phase transition happens collectively involving a finite fraction of the network, at a finite threshold Ferreira et al. (2016).
V Finite-size scaling of critical quantities
The transition between endemic and disease-free phases can be suited as an absorbing state phase transition Marro and Dickman (1999); Henkel et al. (2008). The finite-size scaling (FSS) at the critical point (or epidemic threshold) is fundamental for the characterization of the transition and its critical exponents Marro and Dickman (1999); Henkel et al. (2008). Several studies concerned with the universality of the phase transition of the contact process Marro and Dickman (1999) on complex networks have been performed both numerically and analytically Castellano and Pastor-Satorras (2006, 2008); Hong et al. (2007); Boguñá et al. (2009); Noh and Park (2009); Ferreira et al. (2011a, b); Mata et al. (2014); Ferreira and Ferreira (2013). For SIS-, numerical analyses have been done Ferreira et al. (2012); Sander et al. (2016). A basic approach is to fit the critical QS density and susceptibility to power-laws in the forms
| (14) |
and
| (15) |
where and are the critical exponents related to FSS.
| Model | ||||||
|---|---|---|---|---|---|---|
| — | ||||||
| — | ||||||
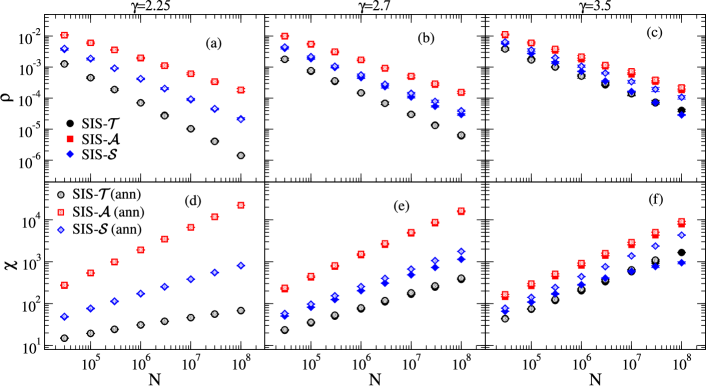
We considered simulations on annealed networks with same degree distributions as the quenched ones to represent the mean-field counterpart; see Appendix A for algorithms. Figure 7 presents the FSS of and at the effective, size-dependent epidemic threshold of the three SIS models on both UCM and annealed networks. For , we used a hard cutoff that prevents outliers in the degree distribution and multiple peaks in the susceptibility curves of quenched networks Ferreira et al. (2012); Mata and Ferreira (2015) making, thus, the determination of the transition point much more accurate; see Refs. Cota and Ferreira (2017); Mata and Ferreira (2015) for further discussion. For the structural cutoff was used. The FSS exponents obtained by simple power-law regressions for are shown in Table 2. Uncertainties were calculated using different fit regions aiming at establishing equivalences or discrepancies between annealed and quenched simulations rather than accurate estimates of the asymptotic exponents.
The FSS of the critical quantities provides a scenario in consonance with that observed for the thresholds. The FSS of both SIS- and are in full agreement with the annealed simulations showing their mean-field behaviors for all values of investigated. Moreover, the agreement between quenched and annealed networks is also found for SIS- for . For , the dichotomy with respect to SIS- is again present. A significant difference in the scaling happens for and a sharp difference is obtained for . In the latter, we can see a susceptibility of the SIS- bending downwardly for the quenched network, which has been associated to a smearing of the phase transition Cota et al. (2016), while in the annealed network a power-law typical of an ordinary critical phase transition is seen. No sign of smearing is observed for SIS- and .
The FSS provides different exponents for distinct models. So, despite being described by the same mean-field equations, the role played by stochastic fluctuations depends on the model. Further analytical studies are required to clarify the distinction among the exponents.
VI Discussion
Conception of theoretical frameworks for epidemic processes frequently passes over the model’s fine-tuning due to the belief that universality takes over and all central features, related to the leading properties and symmetries of a system, will be obtained irrespective of the specific details. However, this does not seem to be always the case when the substrate carrying out the process is a complex network. The standard SIS model, called SIS- in this work, is an example that behaves very differently from most of other related processes. For example, while many fundamental models on random networks with a power-law degree distribution (susceptible infected recovered (SIR) model Moreno et al. (2002), Ising model Dorogovtsev et al. (2002); Herrero (2004), synchronization Rodrigues et al. (2016), etc) have a finite order parameter for any value of the control parameter only for degree exponent Barrat et al. (2008), this happens for any value of in SIS- Chatterjee and Durrett (2009); Castellano and Pastor-Satorras (2010). A dichotomy also appears in the two basic mean-field theories for SIS-, namely, QMF and HMF, which predict different outcomes for the epidemic threshold for Castellano and Pastor-Satorras (2010); Ferreira et al. (2012), being only QMF in agreement with the asymptotically null threshold for .
One could naturally wonder if these peculiar characteristics of SIS- are universal features observed in many other processes. We investigated two slightly different versions of the standard SIS, termed SIS- and SIS-, in which the spontaneous healing and the unlimited infection capacity of a vertex are preserved. These alternative models present exactly the same thresholds of the SIS- in both QMF and HMF theories. Stochastic simulations on uncorrelated synthetic networks, however, show a dual scenario where the three models have essentially the same vanishing thresholds for but disparate results are found for . In particular, a finite threshold is observed for in both modified models, in contrast with the asymptotically null threshold of the standard case. This same framework was observed for SIRS model in Ref. Ferreira et al. (2016), in which an individual acquires temporary immunity when the agents cannot neither transmit infection nor be infected. The dissonance is explained in terms of self-sustained, long-lived activation of hubs for any finite value of Boguñá et al. (2013) that holds for SIS- but does not for the other models. The epidemic lifespan of hubs with the modified dynamics increases slowly (algebraically or logarithmically) with the hub degree in contrast with the exponential increase of the standard case. The last one permits the long-range mutual activation or reactivation of hubs Boguñá et al. (2013); Ferreira et al. (2016).
We also analyzed the activation mechanisms of the epidemic phase on uncorrelated networks. While the activation for SIS- occurs in the innermost, densely connected core of the network, determined by the largest index of a -core decomposition, for and in hubs for Castellano and Pastor-Satorras (2012), this happens for the whole range of scale-free networks with for SIS- and SIS-. Absence of a -core organization Dorogovtsev et al. (2006) and a short-lived activity in star subgraphs as for suggests that the activation of the epidemic phase in the modified SIS models is collective, involving essentially the whole network Ferreira et al. (2016), and occurs at a finite threshold.
The aforementioned dichotomy is also observed in the finite-size scaling of the quasi-stationary density and susceptibility computed at the epidemic threshold. Agreements between simulations on quenched and annealed versions of the investigated networks are observed for SIS- and SIS- irrespective of the degree exponent. In turn, they deviate in the hub activated regime with in SIS-, being more marked for where the transition observed for quenched networks seems to be smeared Cota et al. (2016), in contrast with a regular critical transition in the annealed case.
Here, we also comment the nature of the epidemic activation in processes with spontaneous healing with uniform rates and a bounded infection produced by a vertex, differing from the three SIS models investigated here and from SIRS Ferreira et al. (2016). In these bounded infection models, the epidemic lifespan on stars is finite for any value of the infection rate Ferreira et al. (2016) and the epidemics can be activated only collectively in a finite threshold for any value of , as observed in simulations of the contact process on quenched networks Castellano and Pastor-Satorras (2006); Hong et al. (2007); Ferreira et al. (2011a), for example. Table 3 summarizes the activation mechanism of the different epidemic models investigated or discussed in the present work.
| Model | |||
|---|---|---|---|
| SIS- | Max -core | Hub | Hub |
| SIS- | Max -core | Max -core | Collective |
| SIS- | Max -core | Max -core | Collective |
| SIRS | Max -core | Max -core | Collective |
| CP | Collective | Collective | Collective |
An interesting point observed in our analysis is that the HMF theory was more accurate than QMF theory in all investigated cases, except for SIS-. Dynamical correlations are neglected in both approaches assuming that the states of interacting vertices, in case of QMF, or interacting compartments, in the case of HMF, are independent. This approximation becomes more problematic for QMF since we explicitly reckon the interactions with the actual nearest-neighbors of each vertex and assume that their states are independent. The leading approximation in HMF is to assume that the probability to be infected depends only on the vertex degree, neglecting the local structure of the network. As an effect, HMF theory may not be able to capture localized activity due to specific motifs as those observed for star subgraphs in the SIS- model. Finally, QMF theory is not a genuine mean-field approach since it does not present mixing of vertices while HMF does through the degree compartmentalization. Our results thus reinforces the belief that mean-field approaches with heterogeneous mixing are suitable approximations for most dynamical processes on networks with a small-world property, in which the average distance between vertices increases logarithmically with the system size Barabási and Pósfai (2016).
Our results gathered with previous reports raise an important question on the modeling of epidemic processes on networks. Once details may matter, which would be the actual mechanisms used in models that correspond to real epidemics and which would be the best approaches to analytically investigate real epidemic processes? The summary presented in Table 3 suggests that the hub activation mechanism, intensively investigated recently Chatterjee and Durrett (2009); Castellano and Pastor-Satorras (2010); Goltsev et al. (2012); St-Onge et al. (2018); Wei et al. (2017); Boguñá et al. (2013); Lee et al. (2013); Mata and Ferreira (2015); Ferreira et al. (2016), seems to be more a peculiarity than a rule in epidemic spreading. We expect that our results will guide the analysis of other classes of the dynamical process on networks such as the complex contagion models Granovetter (1978); Centola and Macy (2007); Campbell and Salathé (2013); Karsai et al. (2014) where activation requires more than one interaction to be effected.
Acknowledgements.
This work was partially supported by the Brazilian agencies CAPES, CNPq, and FAPEMIG. We thank the support from the program Ciência sem Fronteiras - CAPES under project No. 88881.030375/2013-01. This is a preprint version of the published article at Physical Review E 98, 012310 (2018).Appendix A Computer implementations of the epidemic models
To build the computer implementations, all involved rates are reckoned using statistically exact prescriptions based on the Gillespie algorithms Gillespie (1976). We consider phantom processes that do nothing but counting for time increments. These ideas are detailed in Ref. Cota and Ferreira (2017). Below we present recipes for the models investigated in the present work.
A.1 SIS-
The SIS- dynamics in a network of size with infection and healing rates and can be efficiently simulated as follows. A list with all infected vertices, their number , and the number of edges emanating from them are recorded and constantly updated. Each time step involves the following procedures. (i) With probability
| (16) |
an infected vertex is selected with equal chance and healed. (ii) With complementary probability , an infected vertex is selected with probability proportional to its degree. A neighbor of the selected vertex is chosen with equal chance and, if susceptible, is infected. Otherwise, no change of state is implemented (it is a phantom process). (iii) The time is incremented by
| (17) |
where is a pseudo random number uniformly distributed in the interval and the simulation runs to the next step.
A.2 SIS-
This model implementation is very similar to the contact process Marro and Dickman (1999). A list with the infected vertices and their number is built and constantly updated. At each time step, the rules are the following. (i) With probability
| (18) |
an infected vertex is randomly chosen and healed. (ii) With complementary probability , all susceptible neighbors of a randomly chosen infected vertex are infected at once. (iii) The time is incremented by
| (19) |
A.3 SIS-
As in SIS- and , a list containing the infected vertices and their number is built and constantly updated. We have also to maintain an auxiliary list including the number of infected neighbors of each vertex and the total number of susceptible vertices that have at least one infected neighbor. At each time step, the rules are the following. (i) With probability
| (20) |
an infected vertex is selected with equal chance and healed. (ii) With complementary probability , an infected vertex is selected with probability proportional to its degree and one of its neighbors is randomly chosen. If the selected neighbor is susceptible it is accepted and infected with probability . The procedure of choosing a susceptible vertex is repeated until one of them is found. (iii) The time is incremented by
| (21) |
A.4 Simulation on uncorrelated annealed networks
On uncorrelated annealed networks, the unique difference in SIS- and SIS- with respect to the quenched case is that the choice of the neighbors to be infected is done by selecting any vertex of the network with probability proportional to its degree.
For SIS-, however, the algorithm becomes trickier and, consequently, very slow. The probability that a susceptible vertex becomes infected is given by
| (22) |
where is the degree of vertex and is the probability that a randomly selected neighbor (at the other side of the edge) is infected in the annealed network. Let us define a total rate that one tries to infect a susceptible vertex as , which is larger than the real one since only the susceptible vertices that have at least one infected neighbor can actually be infected and this happens with probability . The total rate that a vertex is healed is . The algorithm becomes the following. (i) An infected vertex is randomly chosen and healed with probability . (ii) With probability , a susceptible vertex is randomly chosen and infected with probability . (iii) The time is incremented by .
The exactness of these algorithms is confirmed in Fig. 2 where simulations on annealed networks are compared with the integration of the HMF equations.
Appendix B Pairwise approximations for SIS-
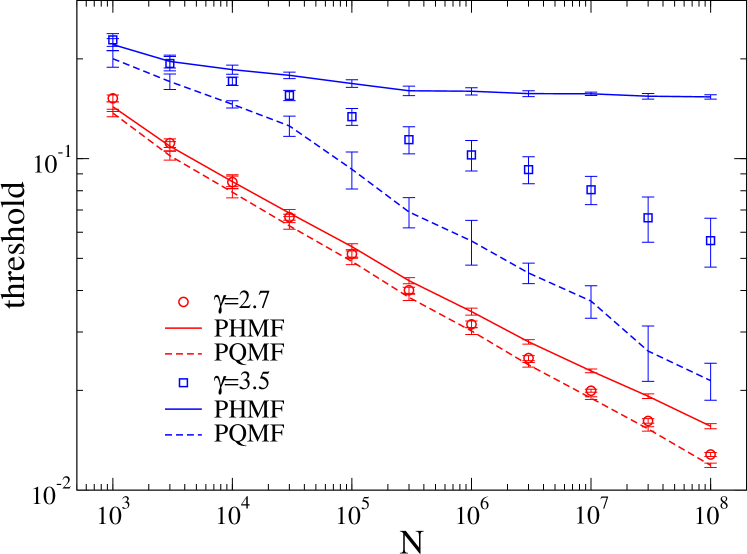
The pairwise heterogeneous mean-field (PHMF) approximation for SIS- with on uncorrelated networks provides a threshold Mata et al. (2014)
| (23) |
The threshold of the pairwise quenched mean-field approximation (PQMF) is obtained when the largest eigenvalue of the matrix Mata and Ferreira (2013),
| (24) |
is null. Figure 8 shows the thresholds of the pairwise theories computed for UCM networks.
Appendix C Approximated expressions for epidemic lifespan on star graphs
To obtain approximated expressions for the lifespan of the SIS epidemic processes (, , and ) on a star graph with leaves, we consider the following discrete time dynamics based in Ref. Ferreira et al. (2016):
(i) At time , the center is infected and all leaves are susceptible.
(ii) At a time , the center is healed and leaves are simultaneously infected with probability .
(iii) At time , the center is reinfected and all leaves become simultaneously susceptible. This occurs with probability .
The probability that the dynamics survives after this sequence is
| (25) |
and the probability that the dynamics ends up at the th step is . So, the average number of steps is
| (26) |
Next, we define the times and probabilities () for each model.
The steps for standard SIS Boguñá et al. (2013); Ferreira et al. (2016) are reproduced here as a guide to the other models. We chose , which is the average time that a vertex takes to be healed. The probability that the center infects a leaf before healing is Boguñá et al. (2013), which is the same for all leaves. So, the probability that leaves were infected at time becomes
| (27) |
The probability that at least one leaf reinfects the center before healing at time is
| (28) |
Plugging Eqs. (27) and (28) in (25) we obtain
| (29) |
where the approximation holds for the regime , in which were are interested in. Now, substituting Eq. (29) into Eq. (26), we obtain
| (30) |
The prediction is an exponential increase with the star size.
For SIS-, since all leaves are simultaneously infected before healing with probability we have that and the other variables are assumed to be the same. So, we have which leads to and the epidemic lifespan
| (31) |
for . The prediction is a finite lifespan.
For SIS- we have the same expression of SIS- for while the probability that center is reinfected is simply , irrespective of . So, as in SIS-. However, since infection rate of the center is independent of how many infected leaves are present, we must use the average time for all leaves to be healed instead of the average time for a single leaf to be healed. Considering the healing processes of each leaf as being an independent Poisson process and neglecting the possibility of reinfections of leaves during this process, the average time for leaves to be healed is
| (32) |
The term between brackets is the probability that one single leaf is infected at time , is the probability that it heals at time , and the saddle point approximation was used to compute the integral assuming . So, replacing by the average number of infected leaves in part (ii), , to estimate , we obtain
| (33) |
for . The prediction is a logarithmic increase with the star size.
References
- Barabási and Pósfai (2016) A.-L. Barabási and M. Pósfai, Network science (Cambridge University Press, Cambridge, 2016).
- Albert and Barabási (2002) R. Albert and A.-L. Barabási, “Statistical mechanics of complex networks,” Rev. Mod. Phys. 74, 47 (2002).
- Barrat et al. (2008) A. Barrat, M. Barthélemy, and A. Vespignani, Dynamical Processes on Complex Networks (Cambridge University Press, Cambridge, 2008).
- Pastor-Satorras et al. (2015) R. Pastor-Satorras, C. Castellano, P. Van Mieghem, and A. Vespignani, “Epidemic processes in complex networks,” Rev. Mod. Phys. 87, 925 (2015).
- Chatterjee and Durrett (2009) S. Chatterjee and R. Durrett, “Contact processes on random graphs with power law degree distributions have critical value 0,” Ann. Probab. 37, 2332 (2009).
- Durrett (2010) R. Durrett, “Some features of the spread of epidemics and information on a random graph,” Proc. Natl. Acad. Sci. USA 107, 4491 (2010).
- Castellano and Pastor-Satorras (2010) C. Castellano and R. Pastor-Satorras, “Thresholds for Epidemic Spreading in Networks,” Phys. Rev. Lett. 105, 218701 (2010).
- Gleeson (2013) J. P. Gleeson, “Binary-State Dynamics on Complex Networks: Pair Approximation and Beyond,” Phys. Rev. X 3, 021004 (2013).
- Kitsak et al. (2010) M. Kitsak, L. K. Gallos, S. Havlin, F. Liljeros, L. Muchnik, H. E. Stanley, and H. a. Makse, “Identification of influential spreaders in complex networks,” Nat. Phys. 6, 888 (2010).
- Newman (2002) M. E. J. Newman, “The spread of epidemic disease on networks,” Phys. Rev. E 66, 016128 (2002).
- Boguñá et al. (2013) M. Boguñá, C. Castellano, and R. Pastor-Satorras, “Nature of the Epidemic Threshold for the Susceptible-Infected-Susceptible Dynamics in Networks,” Phys. Rev. Lett. 111, 068701 (2013).
- Ferreira et al. (2016) S. C. Ferreira, R. S. Sander, and R. Pastor-Satorras, “Collective versus hub activation of epidemic phases on networks,” Phys. Rev. E 93, 032314 (2016).
- Mata and Ferreira (2015) A. S. Mata and S. C. Ferreira, “Multiple transitions of the susceptible-infected-susceptible epidemic model on complex networks,” Phys. Rev. E 91, 012816 (2015).
- de Arruda et al. (2017) G. F. de Arruda, E. Cozzo, T. P. Peixoto, F. A. Rodrigues, and Y. Moreno, “Disease Localization in Multilayer Networks,” Phys. Rev. X 7, 011014 (2017).
- St-Onge et al. (2018) G. St-Onge, J.-G. Young, E. Laurence, C. Murphy, and L. J. Dubé, “Phase transition of the susceptible-infected-susceptible dynamics on time-varying configuration model networks,” Phys. Rev. E 97, 022305 (2018).
- Cai et al. (2016) C.-R. Cai, Z.-X. Wu, M. Z. Q. Chen, P. Holme, and J.-Y. Guan, “Solving the Dynamic Correlation Problem of the Susceptible-Infected-Susceptible Model on Networks,” Phys. Rev. Lett. 116, 258301 (2016).
- Wei et al. (2017) Z.-W. Wei, H. Liao, H.-F. Zhang, J.-R. Xie, B.-H. Wang, and G.-L. Chen, “Localized-endemic state transition in the susceptible-infected-susceptible model on networks,” (2017), arXiv:1704.02925 .
- Castellano and Pastor-Satorras (2017) C. Castellano and R. Pastor-Satorras, “Relating Topological Determinants of Complex Networks to Their Spectral Properties: Structural and Dynamical Effects,” Phys. Rev. X 7, 041024 (2017).
- Chen et al. (2018) X.-H. Chen, S.-M. Cai, W. Wang, M. Tang, and H. E. Stanley, “Predicting epidemic threshold of correlated networks: A comparison of methods,” Phys. A Stat. Mech. its Appl. 505, 500 (2018).
- Pastor-Satorras and Vespignani (2001a) R. Pastor-Satorras and A. Vespignani, “Epidemic spreading in scale-free networks,” Phys. Rev. Lett. 86, 3200 (2001a).
- Pastor-Satorras and Vespignani (2001b) R. Pastor-Satorras and A. Vespignani, “Epidemic dynamics and endemic states in complex networks,” Phys. Rev. E 63, 066117 (2001b).
- Dorogovtsev et al. (2008) S. N. Dorogovtsev, A. V. Goltsev, and J. F. F. Mendes, “Critical phenomena in complex networks,” Rev. Mod. Phys. 80, 1275 (2008).
- Wang et al. (2003) Y. Wang, D. Chakrabarti, C. Wang, and C. Faloutsos, “Epidemic spreading in real networks: an eigenvalue viewpoint,” in 22nd Int. Symp. Reliab. Distrib. Syst. 2003. Proceedings. (IEEE Comput. Soc, 2003) pp. 25–34.
- Van Mieghem (2012) P. Van Mieghem, “Epidemic phase transition of the SIS type in networks,” EPL 97, 48004 (2012).
- Chakrabarti et al. (2008) D. Chakrabarti, Y. Wang, C. Wang, J. Leskovec, and C. Faloutsos, “Epidemic thresholds in real networks,” ACM Trans. Inf. Syst. Secur. 10, 1 (2008).
- Ferreira et al. (2012) S. C. Ferreira, C. Castellano, and R. Pastor-Satorras, “Epidemic thresholds of the susceptible-infected-susceptible model on networks: A comparison of numerical and theoretical results,” Phys. Rev. E 86, 041125 (2012).
- Mata and Ferreira (2013) A. S. Mata and S. C. Ferreira, “Pair quenched mean-field theory for the susceptible-infected-susceptible model on complex networks,” EPL 103, 48003 (2013).
- Mata et al. (2014) A. S. Mata, R. S. Ferreira, and S. C. Ferreira, “Heterogeneous pair-approximation for the contact process on complex networks,” N. J. Phys. 16, 053006 (2014).
- Anderson and May (1992) R. Anderson and R. May, Infectious Diseases of Humans: Dynamics and Control, Dynamics and Control (OUP Oxford, 1992).
- Catanzaro et al. (2005) M. Catanzaro, M. Boguñá, and R. Pastor-Satorras, “Generation of uncorrelated random scale-free networks,” Phys. Rev. E 71, 027103 (2005).
- Cota and Ferreira (2017) W. Cota and S. C. Ferreira, “Optimized Gillespie algorithms for the simulation of Markovian epidemic processes on large and heterogeneous networks,” Comput. Phys. Commun. 219, 303 (2017).
- Castellano and Pastor-Satorras (2012) C. Castellano and R. Pastor-Satorras, “Competing activation mechanisms in epidemics on networks,” Sci. Rep. 2, 371 (2012).
- Dorogovtsev et al. (2006) S. N. Dorogovtsev, A. V. Goltsev, and J. F. F. Mendes, “-core organization of complex networks,” Phys. Rev. Lett. 96, 040601 (2006).
- Pastor-Satorras (2002) R. Pastor-Satorras, “Epidemic dynamics in finite size scale-free networks,” Phys. Rev. E 65, 035108 (2002).
- Marro and Dickman (1999) J. Marro and R. Dickman, Nonequilibrium Phase Transitions in Lattice Models, Collection Alea-Saclay: Monographs and Texts in Statistical Physics (Cambridge University Press, 1999).
- Dickman and Burschka (1988) R. Dickman and M. A. Burschka, “Nonequilibrium critical poisoning in a single-species model,” Phys. Lett. A 127, 132 (1988).
- Böttcher et al. (2018) L. Böttcher, H. J. Herrmann, and M. Henkel, “Dynamical universality of the contact process,” J. Phys. A Math. Theor. 51, 125003 (2018).
- Sander et al. (2009) R. S. Sander, M. M. de Oliveira, and S. C. Ferreira, “Quasi-stationary simulations of the directed percolation universality class in dimensions,” J. Stat. Mech. Theory Exp. 2009, P08011 (2009).
- de Oliveira et al. (2016) M. M. de Oliveira, S. G. Alves, and S. C. Ferreira, “Continuous and discontinuous absorbing-state phase transitions on Voronoi-Delaunay random lattices,” Phys. Rev. E 93, 012110 (2016).
- Harris (1974) T. E. Harris, “Contact Interactions on a Lattice,” Ann. Probab. 2, 969 (1974).
- Gillespie (1976) D. T. Gillespie, “A general method for numerically simulating the stochastic time evolution of coupled chemical reactions,” J. Comput. Phys. 22, 403 (1976).
- Pastor-Satorras et al. (2001) R. Pastor-Satorras, A. Vázquez, and A. Vespignani, “Dynamical and correlation properties of the internet,” Phys. Rev. Lett. 87, 258701 (2001).
- Morita (2016) S. Morita, “Six Susceptible-Infected-Susceptible Models on Scale-free Networks,” Sci. Rep. 6, 22506 (2016), 1508.04451 .
- Boguñá and Pastor-Satorras (2002) M. Boguñá and R. Pastor-Satorras, “Epidemic spreading in correlated complex networks,” Phys. Rev. E 66, 047104 (2002).
- Boguñá et al. (2009) M. Boguñá, C. Castellano, and R. Pastor-Satorras, “Langevin approach for the dynamics of the contact process on annealed scale-free networks,” Phys. Rev. E 79, 036110 (2009).
- Sander et al. (2016) R. S. Sander, G. S. Costa, and S. C. Ferreira, “Sampling methods for the quasistationary regime of epidemic processes on regular and complex networks,” Phys. Rev. E 94, 042308 (2016).
- Boguñá et al. (2004) M. Boguñá, R. Pastor-Satorras, and A. Vespignani, “Cut-offs and finite size effects in scale-free networks,” Eur. Phys. J. B 38, 205 (2004).
- Hołyst et al. (2005) J. A. Hołyst, J. Sienkiewicz, A. Fronczak, P. Fronczak, and K. Suchecki, “Universal scaling of distances in complex networks,” Phys. Rev. E 72, 026108 (2005).
- Henkel et al. (2008) M. Henkel, H. Hinrichsen, and S. Lübeck, Non-Equilibrium Phase Transitions: Volume 1: Absorbing Phase Transitions, Theoretical and Mathematical Physics (Springer Netherlands, 2008).
- Castellano and Pastor-Satorras (2006) C. Castellano and R. Pastor-Satorras, “Non-mean-field behavior of the contact process on scale-free networks,” Phys. Rev. Lett. 96, 038701 (2006).
- Castellano and Pastor-Satorras (2008) C. Castellano and R. Pastor-Satorras, “Routes to thermodynamic limit on scale-free networks,” Phys. Rev. Lett. 100, 148701 (2008).
- Hong et al. (2007) H. Hong, M. Ha, and H. Park, “Finite-size scaling in complex networks,” Phys. Rev. Lett. 98, 258701 (2007).
- Noh and Park (2009) J. D. Noh and H. Park, “Critical behavior of the contact process in annealed scale-free networks,” Phys. Rev. E 79, 056115 (2009).
- Ferreira et al. (2011a) S. C. Ferreira, R. S. Ferreira, C. Castellano, and R. Pastor-Satorras, “Quasistationary simulations of the contact process on quenched networks,” Phys. Rev. E 84, 066102 (2011a).
- Ferreira et al. (2011b) S. C. Ferreira, R. S. Ferreira, and R. Pastor-Satorras, “Quasistationary analysis of the contact process on annealed scale-free networks,” Phys. Rev. E 83, 066113 (2011b).
- Ferreira and Ferreira (2013) R. S. Ferreira and S. C. Ferreira, “Critical behavior of the contact process on small-world networks,” Eur. Phys. J. B 86, 1 (2013).
- Cota et al. (2016) W. Cota, S. C. Ferreira, and G. Ódor, “Griffiths effects of the susceptible-infected-susceptible epidemic model on random power-law networks,” Phys. Rev. E 93, 032322 (2016).
- Moreno et al. (2002) Y. Moreno, R. Pastor-Satorras, and A. Vespignani, “Epidemic outbreaks in complex heterogeneous networks,” Eur. Phys. J. B 26, 521 (2002).
- Dorogovtsev et al. (2002) S. N. Dorogovtsev, A. V. Goltsev, and J. F. F. Mendes, “Ising model on networks with an arbitrary distribution of connections,” Phys. Rev. E 66, 016104 (2002).
- Herrero (2004) C. P. Herrero, “Ising model in scale-free networks: A Monte Carlo simulation,” Phys. Rev. E 69, 067109 (2004).
- Rodrigues et al. (2016) F. A. Rodrigues, T. K. D. Peron, P. Ji, and J. Kurths, “The Kuramoto model in complex networks,” Phys. Rep. 610, 1 (2016).
- Goltsev et al. (2012) A. V. Goltsev, S. N. Dorogovtsev, J. G. Oliveira, and J. F. F. Mendes, “Localization and Spreading of Diseases in Complex Networks,” Phys. Rev. Lett. 109, 128702 (2012).
- Lee et al. (2013) H. K. Lee, P.-S. Shim, and J. D. Noh, “Epidemic threshold of the susceptible-infected-susceptible model on complex networks,” Phys. Rev. E 87, 062812 (2013).
- Granovetter (1978) M. Granovetter, “Threshold Models of Collective Behavior,” Am. J. Sociol. 83, 1420 (1978).
- Centola and Macy (2007) D. Centola and M. Macy, “Complex Contagions and the Weakness of Long Ties,” Am. J. Sociol. 113, 702 (2007).
- Campbell and Salathé (2013) E. Campbell and M. Salathé, “Complex social contagion makes networks more vulnerable to disease outbreaks,” Sci. Rep. 3, 1 (2013).
- Karsai et al. (2014) M. Karsai, G. Iñiguez, K. Kaski, and J. Kertész, “Complex contagion process in spreading of online innovation,” J. R. Soc. Interface 11, 20140694 (2014).