Progress and open problems in evolutionary dynamics
Abstract
Evolution has fascinated quantitative and physical scientists for decades: how can the random process of mutation, recombination, and duplication of genetic information generate the diversity of life? What determines the rate of evolution? Are there quantitative laws that govern and constrain evolution? Is evolution repeatable or predictable? Historically, the study of evolution involved classifying and comparing species, typically based on morphology. In addition to phenotypes on the organismal and molecular scales, we now use whole genome sequencing to uncover not only the differences between species, but also to characterize genetic diversity within-species in unprecedented detail. This diversity can be compared to predictions of quantitative models of evolutionary dynamics. Here, we review key theoretical models of population genetics and evolution along with examples of data from lab evolution experiments, longitudinal sampling of viral populations, microbial communities and the studies of immune repertoires. In all these systems, evolution is shaped by often variable biological and physical environments. While these variable environments can be modelled implicitly in cases such as host-pathogen co-evolution, the dynamic environment and emerging ecology often cannot be ignored. Integrating dynamics on different scales, both in terms of observation and theoretical models, remains a major challenge towards a better understanding of evolution.
Over the centuries, scientists have been cataloging the diversity of life, and through systematic classification based largely on morphological features, uncovered its hierarchical organization. This hierarchical structure prompted the idea that organisms evolve by passing on their phenotypic traits to their offspring with possible modification. On much shorter time scales, plant and animal breeding demonstrated that phenotypic traits can be dramatically altered by consistently selecting for desired types. The advent of genetics and molecular biology in the 20th century established the molecular basis for the inheritance and modification of phenotypic traits. In the 20th century mathematical frameworks were developed to describe genetic diversity within species (population genetics and quantitative genetics) and between species (phylogenetics). However, until recently molecular data to test specific predictions and assumptions have been lacking. The advent of relatively cheap high-throughput sequencing has changed this situation profoundly. The elegant theoretical models, however, often fail to describe the now abundant data sets in a quantitative manner.
These data sets are either observations of natural populations or are obtained from laboratory evolution with microbes or other rapidly reproducing organisms, e.g. flies. Laboratory evolution experiments with microbes have the great advantage over observational studies in animals or plants that population turnover and the spread of mutations happens on observable time scales. Resulting time dependent datasets are much more powerful at differentiating between models than snapshots of natural populations. The only natural ‘measurably evolving‘ populations where observations beyond snapshots can be made used to be pathogenic bacteria, RNA viruses (influenza virus and HIV) and certain cancer types. But time resolved data of commensal and environmental bacterial populations are starting to emerge [1, 2, 3]. Strong selection and rapid mutation are also at play during somatic hypermutation of B-cell receptors. Genetic diversity of entire microbial populations or immune receptors can be characterized by high-throughput sequencing and allows genome wide tracking of mutations at high resolution.
These experiments and observational studies have shown that microbes adapt rapidly to new environments, even if these environments are kept as simple and stable as possible. There are ample opportunities for adaptation and populations are typically diverse with many similar trait modifications competing against each other. Such rapid and diverse responses are at odds with classical population genetics theory, which assumes that adaptive changes are rare and occur sequentially with periods of stasis between so-called selective sweeps.
Furthermore, models typically assume an externally specified environment in which every member of the population competes with everybody else for a common resource. However, even in the simplest experiments that sought to approximate this idealized model, the populations rapidly split into different types that feed on secondary metabolites or specialize in growth at different nutrient densities. In other words, even simple environments seem to rapidly develop internal ecology. Ecological theory, on the other hand, typically ignores evolution and assumes that species are static monomorphic entities that interact with each other. Putting evolution into the context of ecology and vice versa is the major scientific frontier for the field as it goes forward.
Here, we review theoretical models of population genetics and discuss recent data that suggest that the assumptions of many established theoretical models are not met. We discuss theoretical developments that aim at addressing some of the conflicts, and present an overview of the wide open questions that arise when evolution and ecology meet.
Traditional population genetics
Population geneticists and quantitative geneticists in the 20th century attempted to develop these qualitative ideas of heritability, mutation, and selection into a quantitative description of evolution. The models studied in the 20th century can be broadly classified into (i) deterministic dynamical systems, (ii) phenomenological quantitative genetics models, and (iii) stochastic models of frequencies genetic variants segregating within species. Quantitative genetics models describe the response of diverse populations to selection for particular phenotypes without reference to the genetic determinants of the traits [4]. Patterns of genetic diversity and distributions of variant frequencies, on the other hand, require probabilistic models of the processes that introduce and remove genetic variation.
The two prominent models for genetic diversity are the backwards in time “coalescent” [5] or a forward in time diffusion approach [6]. The Kimura diffusion equation describes the distribution of the frequency of a single genetic variant subject to genetic drift and selection in a (haploid) population of size . If individuals with and without variant have on average and offspring, respectively, and the variance in offspring number is , the distribution of the variant frequency evolves according to
| (1) |
The first term on the right accounts for selection with strength ; the second term accounts for demographic stochasticity known as genetic drift. Genetic drift results from the variance in offspring number. In a population of size , the frequency of a variant therefore has a diffusion constant . This relation between offspring number variance and frequency diffusion assumes that fluctuations are uncorrelated across individuals and generations (non-heritable). In most populations, however, many processes affect variant frequencies in an undirected manner but their effects are correlated in time and space. If these correlations are weak and decay sufficiently rapidly, they can be accounted for by introducing an effective population size . The latter is often orders of magnitudes smaller than estimates of the census population size, suggesting that genetic drift in a narrow sense is typically irrelevant.
When fluctuations are correlated over many generations, their multiplicative effect can be dramatic and qualitatively change the stochastic dynamics. In this case, different models outside the universality class of the Kimura diffusion equation are needed. One such example are the effects of other loci in the genome that are under directional selection – known as hitch-hiking or genetic draft: by consistently changing frequencies in the same direction, a selective sweep at a nearby locus can result in macroscopic perturbations to neutral diversity [7].
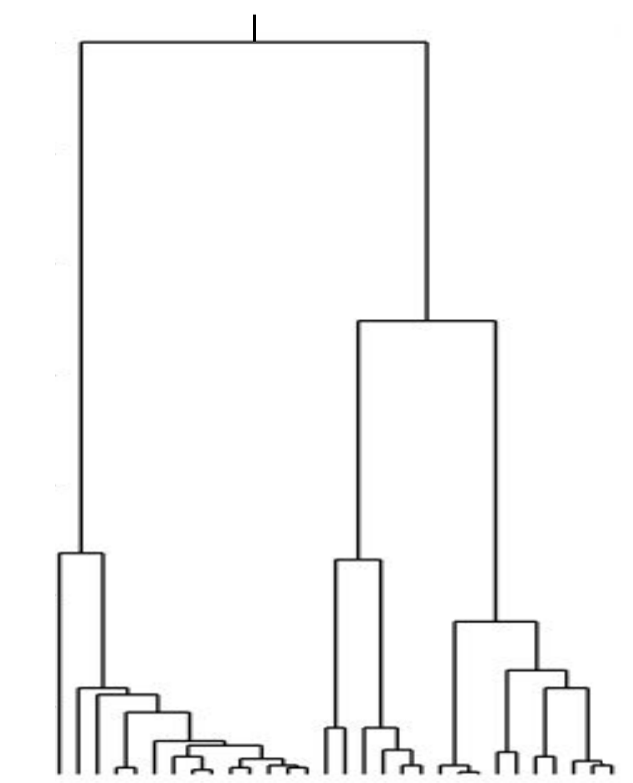
Another popular framework to analyze neutral diversity ( for all variants) is the Kingman coalescent, which models the genealogy of the population backward in time: any pair of lineages merges at random with rate , where is the number of remaining lineages. A typical tree generated by the Kingman process in shown in Fig. 1. The time to the most recent common ancestor () of a large population is on average , where is again the variance in offspring number. The coalescent can be used to predict diversity at many genomic loci and is easy to simulate under a range of demographic models. Diffusion and coalescent descriptions are two dual ways of looking at the same processes, but some questions are more conveniently formulated in one framework than the other.
The basic coalescent model assumes that all individuals are equivalent, i.e., all variation is neutral and there is no population structure. These assumptions can be relaxed by introducing a structured coalescent where individuals have types that restrict who can merge with whom [8]. While Kimura’s diffusion equation readily accommodates positive selection at a single locus, it is challenging to incorporate positive selection into the Kingman coalescent [9].
A different framework that has been explored in some depth is that of a monomorphic population evolving in a static landscape that assigns fitness to all possible genotypes. This approach assumes that mutations are rare enough and fitness differences between neighboring genotypes large enough that the population is monomorphic most of the time. This dynamics results in a Boltzmann distribution with the inverse population size and fitness playing the role of energy and temperature, respectively [10, 11, 12].
Confronting theories with data
While sequencing a single bacterial genome was a major undertaking 20 years ago, a small lab can now sequence hundreds of bacterial genomes in a few days. Thousands of animal, plant, or parasite genomes have been sequenced and observed patterns of genetic diversity in these populations have been compared to predictions of patterns of genetic diversity [13]. Using these data, scientists have estimated demographic parameters such as the , historical population size changes and migrations [14, 15, 16, 17]. The observed patterns are qualitatively consistent with predictions in the sense that large populations tend to harbor more genetic diversity and that there are many more rare than common variants.
However, essentially all sequence data from eukaryotes are static snapshots and our ability to learn dynamical properties from such data is limited. In the best case, inference from static data yields estimates of model parameters relative to an intrinsic time scale of the system, e.g. the above mentioned coalescent time scale (or effective population size). More often, static data are unable to differentiate between models and seemingly good fits of simple models hide the actual dynamics. Any inference from static data is necessarily an average over history. Different ways of calculating expectation values of the same parameters average over different past intervals and can give contrasting results. For example, Bergland et al.[18] surveyed genetic variation in Drosophila populations over several annual cycles and found oscillations of large amplitudes suggesting strong selection pressures (10% or more) that vary with seasons. By contrast, inference from static data suggests selection coefficients of 1% or less [19]. This discrepancy is just one example of how inference from static data can lead to misleading results because the dynamics are not identifiable from static data alone.
To study evolutionary processes in real-time rather than inferring them from snapshots, high throughput sequencing technologies have been applied, for example, to the long term evolution experiment (LTEE) with E. coli conducted by Richard Lenski and colleagues [20], the tracking of millions of lineages over short times intervals [21], and sequencing of serially sampled HIV populations [22], or the global surveillance of influenza viruses [23].
Evolution experiments have the advantage over observational studies that the environments can be controlled and replicated, but the environments used to propagate the populations are typically simple, artificial and stable. As a result, the majority of adaptive mutations that are observed are loss of function mutations, that is inactivation of proteins and pathways that are not necessary in the lab environment. This mode of adaptation is not necessarily representative of evolution in the wild.
Outside the lab, rapid evolution can be directly observed in populations of pathogenic RNA viruses such as HIV or influenza. These viruses continuously evade a co-evolving immune system. The Global Influenza Surveillance and Response System (GISRS) [23] collects thousands of influenza virus samples. The common ancestor of all circulating A/H3N2 viruses is typically only 3 years in the past and in any given year two randomly sampled HA sequences differ on average at positions. This rapid turnover and diversification is driven by increasing human immunity against circulating viruses. New variants with different antigenic properties emerge and reinfect previously immune individuals [24].
Similar dynamics can be observed in HIV populations in infected humans. Shortly after infection, the adaptive immune systems targets the virus and escape mutations quickly spread [25]. Typically, a few strongly selected mutations evading cytotoxic T-lymphocyte responses spread during the first 3 month of infection, followed by a multitude of more weakly selected escape and reversion mutations. While segments of the influenza virus genome are propagated asexually, HIV recombines by crossing over (template switching of the reverse transcriptase [26]). Recombination is rapid enough that different regions of the genome show profoundly different dynamics[27]. Surface proteins exhibit rapid turnover similar to global influenza virus dynamics, while enzymes often slowly accumulate diversity over many years [22, 28].
Good et al [29] recently sequenced 120 samples of each of the 12 lines of the LTEE that evolved in a constant environment for about 60,000 generations. They discovered that multiple lineages co-existed in these cultures for many years. Instead of there being a simple environment with a single fitness optimum, the bacteria partitioned the system into niches creating an environment in which multiple types can coexist.
These three examples, together with many other recent observations of microbial evolution, have demonstrated that diverse populations, in which many variants compete vigorously are the rule rather than the exception. Furthermore, the environments in which microbes evolve change, either because they coevolve with a host or because they generate their own ecology. A quantitative description of these populations requires theoretical frameworks beyond single locus diffusion theory, neutral coalescent models, or static fitness landscapes.
Traveling waves models of rapid adaptation
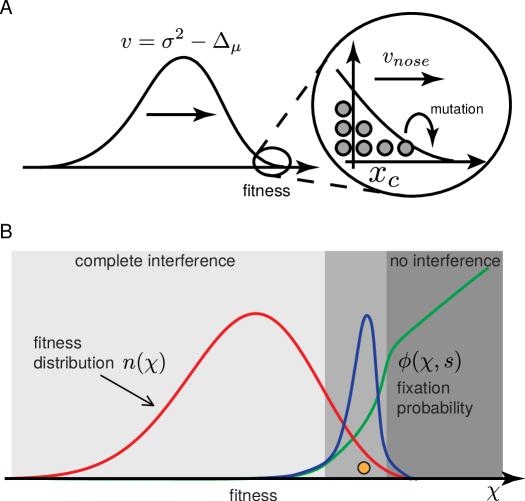
The earliest models of diverse populations under selection were developed to describe plant and animal breeding. In sexual populations with large genomes, quantitative traits typically depend on many loci resulting in an approximately Gaussian distribution of the trait in the population, see Fig. 2A. This model is known as the infinitesimal model with many effectively unlinked loci. The response to selection will then be proportional to the trait variance and the heritability of the trait the breeder is selecting on [4].
Outside of plant or animal breeding programs, natural selection operates on fitness. Individuals at the high fitness end of the fitness distribution increase in frequency, while less fit lineages die out. The dynamics of the bulk of the fitness distribution can often be described by deterministic growth and shrinkage of lineages and the overall rate of adaptation is given by the variance in fitness on which selection can act. This deterministic dynamics describes the short term response to selection, but it cannot explain how fitness variation is maintained over longer times. De-novo mutations that contribute to future fitness variation arise in the high fitness tail of the distribution where only very few individuals reside and stochastic dynamics are important. Fluctuations and stochastic events among these high fitness individuals are amplified exponentially and dominate the bulk of the population after a delay. Almost all individuals that contribute to future populations originate from a narrow zone in the high fitness tail (see Fig. 2). Hence a probabilistic description of the high fitness ’nose’ is essential.
Tsimring et al. [30] studied this problem in a simple model of an adapting RNA virus population: Each individual suffers from many small effect mutations, resulting in a diffusive motion in fitness. The deterministic diffusion/selection equation describes the dynamics of the bulk of the distribution. The stochastic instability in the nose is handled by a cut-off beyond which exponential amplification does not operate. This ad-hoc modification of the model is justified by the idea that “fractional” individuals do not reproduce and no exponential amplification can take place in this part of the distribution. This modification results in a consistent solution that predicts that fitness variance and the speed at which the population adapts depends only logarithmically on the populations size: the fittest individuals grow exponentially and hence need only a time to take over the population. Diversity accumulated over this time determines fitness variation.
Tsimring et al [30] assumed frequent small mutations such that the fitness distribution always remains smooth and no large monomorphic clones exist. At steady state, new mutations generate diversity at the same rate as selection removes diversity through amplification of the fittest individuals [31]. This balance, results in a steady state variance of the fitness distribution
| (2) |
where , is the total mutation rate, and is the second moment of the distribution of fitness effects of novel mutations. The rate of adaptation, i.e. the rate at which fitness increases, is then where is the net effect of mutations. The fitness increase will typically be offset by a co-evolving population or the environment.
If mutation rates are small, yet populations large enough that many variants compete, other models are a more natural starting points [32, 33, 34]. A commonly used model assumes that fitness can increase in discrete steps of size (stair-case model) and the rate of such beneficial mutations is . In this case, the speed of adaptation increases with and qualitatively as [33]
| (3) |
In both models the speed of adaptation depends logarithmically on the population size and the nose of the wave is standard deviations above the mean. Newly arising mutations have a negligible chance of spreading through the population unless they emerge in the very tip of the fitness wave, see Fig. 2B. These features are in stark contrast with traditional models of sequential adaptation, where all individuals equally likely contribute to the future and the rate of adaptation is linear in the mutation rate and population size.
Recombination and adaptation
The above models were restricted to asexual populations, but traveling wave models can be generalized to sexual populations. Many eukaryotic organisms recombine by crossing-over, that is combining contiguous stretches of parental chromosomes while maintaining the order of genes and the gene content. As a result, the rate at which loci are separated via recombination depends on their distance on the chromosome. On top of crossing over, different chromosomes are reshuffled by the random partitioning during meiosis. This sort of reshuffling is also common in segmented viruses like the influenza virus (known as reassortment). Bacteria exchange genetic material via the exchange of fragments (a few thousand bases long) that either replace a homologous copy or add to the gene repertoire of the bacterium [35]. All these different modes of recombination can speed up adaptation dramatically.
Recombination by reshuffling and reassortment is easiest to analyze mathematically. In this case, the rate of recombination is controlled by the frequency at which individuals reproduce sexually vs asexually. At very high rates of recombination, the dynamics at different loci in the genome are completely decoupled and adaptation is linear in population size and beneficial mutation rate . Once the recombination rate drops below typical fitness differentials in the population, clonal subpopulations begin to form and competition between these clones limits adaptation [36, 37]. The rate of adaptation increases quadratically with the recombination rate [38]:
| (4) |
Whenever the recombination rates are smaller than the typical fitness differences between individuals, the rate of adaptation is insensitive to the rate or effect size of beneficial mutations ( and , respectively) but is instead limited by competition between variants.
Recombination by crossing-over implies that distant loci are essentially unlinked, while nearby mutations are inherited together for many generations. Recombination is less effective in speeding up adaptation in this case. Weissman and Barton [39] showed via a scaling argument that the rate of adaptation is linear in the expected number of cross-overs per chromosome when adaptation is dominated by large effect mutations. In the opposite limit of many infinitesimal small mutations, the speed of adaptation increases only with the square root of the recombination rate [40].
Recombination by horizontal transfer is different from other modes of recombination that it affects only a small fraction of the genome, similar to mutations. However, while a de novo mutation is a random sample from a distribution of mostly deleterious mutations, horizontal transfer will preferentially introduce variation from a successful individual. Hence even the exchange of individual loci can dramatically speed up adaptation [41, 38].
Genetic diversity in rapidly adapting populations
Most of the early studies of traveling wave models calculated the speed of adaptation, i.e., the rate at which populations accumulate beneficial variants. Adaptation, however, is difficult to measure and even when measured has limited power to differentiate models. Much more accessible and more informative are patterns of genetic diversity such as the site frequency spectrum (SFS). The SFS is the density of mutations found at different frequency in the population. Since different models make qualitatively different predictions for the SFS, the SFS can potentially be used to differentiate between models.
Neutral diversity at a locus is determined by the genealogical tree: the branch lengths are proportional to the number of mutations and the branching pattern determines how common a mutation has become since its origination. The simplicity of the Kingman coalescent allows for analytic expressions for many neutral diversity statistics, including the SFS.
Recently, similar progress has been made for traveling wave models of adapting populations. Brunet et al. [42] showed that a class of models, in which a population moves as a front in fitness space gives rise to a coalescent process known as the Bolthausen-Sznitman coalescent (BSC). The BSC has intriguing connections to the hierarchical structure of ground states in spin glass models, see Ref. [43] for a comprehensive review. In population models, the BSC emerges naturally if the number of offspring individuals that contribute to the next generation is drawn from a distribution that has a power-law tail (see Ref [44]). Such a long tailed distribution has a diverging variance, immediately suggesting that no effective population size can be defined and that the Kimura diffusion equation is inapplicable.
This same process was later shown to describe populations in traveling wave models of rapid adaptation [45, 46]. A large class of models seems to converge to the same coalescent model after coarse-graining in time [46].
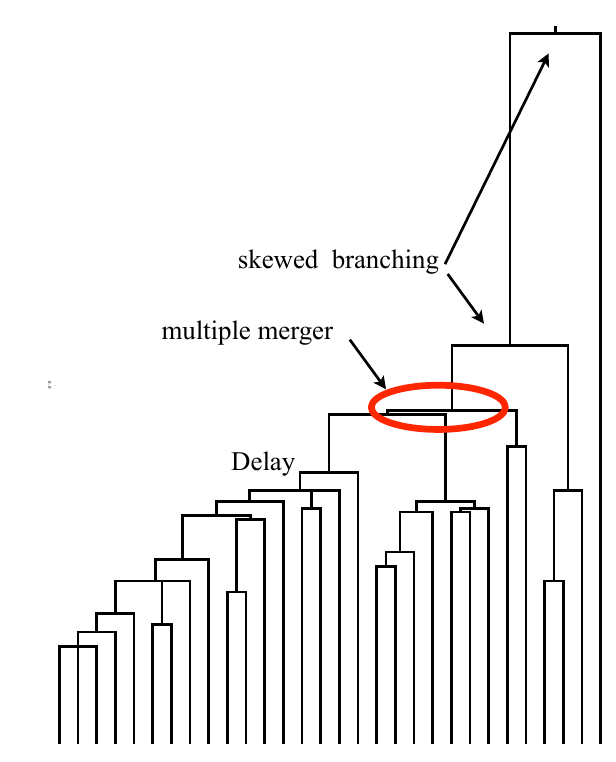
The trees generated by the BSC differ qualitatively from those generated by Kingman coalescent trees (Fig. 1). While Kingman trees tend to branch symmetrically (given lineages, the distribution of leaves is uniform on the dimensional simplex), BSC trees are often very skewed. In Kingman trees, the merger rate is proportional to square of the number of lineages and hence most mergers happen in the recent past. In the BSC, coalescence happens deeper in time and several lineages merge at once in multiple mergers. In traveling wave models of adapting populations, such multiple mergers correspond to exceptionally fit individuals [42, 47].
The BSC is an exchangeable coalescent process, that is all individuals in one generation are equivalent and equally likely to contribute to the next generation – in other words the BSC is a neutral process. How come genetic diversity in traveling waves of adaptation can be described by such a neutral process? This effective neutrality only emerges after suitable coarse-graining in time. Exceptionally fit clones expand exponentially at slightly different rates, but these rate differences are amplified into a long-tailed distribution of offspring after a characteristic time scale [42]. This offspring distribution has a power-law tail and occasionally one lineage takes over a macroscopic fraction of the population. These rare events correspond to characteristic multiple mergers in the tree.
Over this same time scale, the fitnesses of lineages competing against each other in the high fitness nose decorrelate and the dynamics become essentially neutral but with anomalous fluctuations. In essence, heritable variation in fitness (resulting in small systematic differences in offspring number) is exponentially amplified into heavy-tailed iid fluctuations on intermediate time scales.
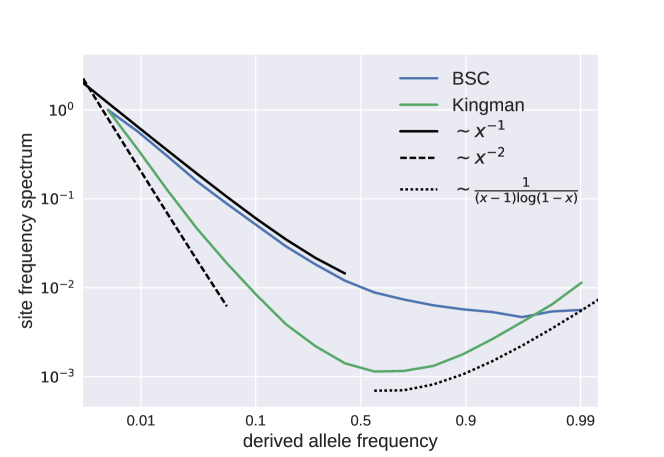
The BSC and the Kingman coalescents make qualitatively different predictions for the SFS (see Fig. 3). Comparing predictions for distributions like the SFS to data is much more powerful than rejecting null hypothesis based on scalar summary statistics such as Tajima’s D. Where as the SFS in the Kingman coalescent is monotonically decreasing, the SFS of rapidly adapting populations is non-monotonic with specific asymptotic behavior both for rare and common variants [46, 48, 49]. Importantly, the SFS in the Kingman coalescent stays monotonic even if the population size changes through time [50].
Qualitative features of the SFS predicted by the BSC have been observed in systems we expect to be under strong positive selection, for example HIV-1 populations of B-cell clones during somatic hypermutation [22, 51, 52]. Interestingly, the B-cell repertoires of healthy individuals also show signatures of selection in their SFS [52], showing that SFS can detect the result of many weaker rounds of selection.
The correspondence between the BSC and models of adaptation requires a large number of mutations that contribute similarly to the organism’s fitness. More typically, a moderate number of mutations contribute most of the fitness variation, which limits the quantitative agreement between models and data. Nonetheless, the BSC as a universal limiting case of rapidly adapting polymorphic populations is a very useful abstraction.
Open problems: genetic diversity in rapidly adapting sexual populations
In asexual populations, the entire genome is described by one genealogical tree. Recombination decouples the histories of different loci resulting in a complicated inter-dependent “forest”. As one traces the history of a sample of genomes back in time, parts are inherited together for a while until recombination separates linked loci and their histories are described by different trees. The ensemble of trees and their connections is known as the ancestral recombination graph (ARG). Inferring ARGs from sequence data is an extremely difficult computational problem and most approaches cannot handle more than a few dozen genomes [53].
In the limit of very rapid recombination (compared to the time scale of selection), different loci in the genome completely decouple and selection operates on individual alleles rather than individuals or genotypes. This reduces the problem to many single locus systems, where residual linkage can be taken into account perturbatively [54].
At lower recombination rates selection and recombination interact in complicated ways and our understanding of genetic diversity in this regime is poor. When recombination operates via crossovers, an effective description in terms of effectively asexual blocks captures much of the phenomenology well [40, 55]. The length of these blocks has to be determined via self-consistent solutions to equations linking recombination, adaptation, and coalescence, but clearly linkage on different distance scales cannot all be lumped into an effective block description. Similarly, occasional chromosome reshuffling/reassortment generates BSC-like patterns of diversity [56], but even models that make drastic approximations are not understood.
Even less is known when the epistasis, that is non-additive effects of different loci, interact with recombination. Recombination then has the tendency to break up co-adapted combinations, which counteracts the benefits of recombination [36], as has for example been observed in the influenza virus [57].
Repeatability and predictability
In addition to comparing diversity to model predictions, reproducibility and predictability of evolutionary dynamics can be used to estimate parameters, test models, and interrogate the redundancies at different levels of the genotype-phenotype map. At the level of phenotypes, the response to selection is extremely reproducible. Selection on quantitative traits in animals and plants, for example, invariably leads to a strong and consistent response. Anti-microbial resistance evolves rapidly. But reproducibility of the accompanying changes in the genotype vary. Strong very specific selection, for example for resistance to drugs with a well defined target, can lead to parallel mutations in the same nucleotide. This happens frequently in viruses like HIV. In bacteria, however, it is more common that drug resistance selection is reproducible at the level of the gene or the biochemical pathway. Toprak et al.[58], for example, observed repeated mutations in the same genes of E. coli in response to antibiotic selection.
One of the biggest systematic studies of repeatability and consistency of molecular evolution was undertaken by Olivier Tenaillon and colleagues [59] who selected many initially identical E. coli populations to reproduce at elevated temperatures. This study revealed a striking parallelism in the genes and pathways that accumulated mutations, while repeatability at the individual nucleotide level remained limited. Only in cases with very specific selection pressures, like selection for drug resistance, or in organisms with very high mutation rates, are repeated mutations the norm.
While the repeatability of pathways hit by mutations has been observed in other instances of microbial adaptation, our ability to predict a priori the genomic responses to particular environmental challenges is essentially non-existing. Instead of predicting where and how adaptation can occur, one could settle for the more modest aim of predicting which of the existing genotypes will prevail and take over. In this case the challenge moves from predicting molecular changes to predicting the changing population composition – ideally from a one-time observation. Several such approaches have been developed to predict influenza virus variants that likely dominate future influenza seasons [60].
Łuksza and Lässig [61] developed a model for virus fitness based on scores for mutations that have been historically associated with antigenic novelty and for mutations that are expected to be detrimental, for example because they destabilize protein structure. Neher et al [47] used an alternative approach that infers fitness of different parts of the tree given the tree topology and branch lengths. This inference is based on a traveling wave fitness model, in which lineages diversify and adapt by many small effect mutations. The distinguishing feature of the latter approach is that it only requires a single time point without any influenza specific input or historical data. The link between tree shape and fitness provided by the traveling wave model allows to infer growth rates without dynamical information. This approach therefore can be applied to systems were historical data are not available and little a priori information of fitness correlates exist [51]. The approach by Łuksza and Lässig, on the other hand, is easier to complement with additional biophysical or antigenic phenotypes. Both approaches now contribute to the biannual vaccine strain selection.
Complex and variable environments
So far we have assumed that populations adapt towards a well defined and fixed goal, for example rapid growth in evolution experiments or immune evasion in host-pathogen systems. More generally, however, the biotic and abiotic environment will change on many time scales and the extent to which lessons learned from studying systems in stable environment are applicable to natural situations is unknown. To address this question researchers studied the evolution of bacteria in the mammalian gut. The rate of molecular evolution was found to depend strongly on the bacterial strain: experiments with a pathogenic hospital strain showed that adaptation to the mouse gut proceeds times slower than in experiments with the laboratory strain K-12 [62]. This difference likely stems from extensive lab adaptation of K-12 since its isolation in the 1920ies, which rendered K-12 unfit in the gut. Starting from a low initial fitness many beneficial mutations are available. Similar patterns have been observed in the lab.
In analogy to in vitro experiments, evolution in the mouse gut exhibits convergence among replicate lineages, mainly at the phenotypic, pathway, and gene level [63, 64, 62]. Furthermore, strain with drastically elevated mutation rates, aka mutators, frequently emerged. While strains with mutator phenotypes have an initial advantage and adapt faster, they accumulate many secondary mutations that are deleterious after the environmental changes and eventually loose out upon transmission and colonisation of new individuals [65].
Theoretical work that focused on constant environments found that the dynamics and interplay between beneficial and deleterious mutations is key for the survival of mutators [66]. Mutators do accumulate many deleterious mutations, but can nevertheless persist at the population level simply because they are continuously produced de novo and are only gradually eliminated from the population. Additionally, even though rare, a beneficial mutation generated by the mutators can increase mutator frequency and deleterious mutations can fix in the population through hitchhiking [20, 67].
Comparison of experiments in vitro and in the mouse gut suggest that drastic environmental changes often result in early mutations in global regulators. Mutations in global regulators are ways of encoding a large phenotypic shift and are more likely to happen when adapting to new environments. Such mutations are very common early mutations in laboratory experiments and did occur in experiments colonizing mice guts with the lab adapted K12 strains[64], but were not observed in the gut with a pathogenic hospital strain [62].
Furthermore, interactions of the microbial population with the host are important. Molecular evolution of E. coli was found to be much slower in immune compromised mice than in healthy wildtype (WT) mice, even though the mutation rates of the bacteria are the same in both environments [64]. The interaction of the microbiota with the immune system is a fascinating example of co-evolution in complex environments, with practical health implications.
Theoretical investigations of evolution in fluctuating environments have shown that environmental fluctuations can amplify demographic fluctuations, which results in more rapid coalescence, lower genetic diversity, and a higher probability that deleterious mutations fix compared to a constant environment [68, 69, 70]. Fluctuations in the environment translate into large fluctuations in the sizes of the different clones that make up the populations. For example, the long tailed clone size distributions observed in adaptive immune repertoires, measured as the abundances of the B or T-cell receptors in a given individual [71, 72], can be explained in terms of strong fluctuations in the pathogenic and self protein environments the repertoire experiences, which translates into strong fitness fluctuations felt by each receptor clone [73].
Organisms can develop strategies to mitigate the effects of fluctuating environments [74, 75]. These strategies have been studied by considering a population of size at time , where individuals are described by the their phenotype or genotype . The environment changes in time between different phenotypic states denoted by . In each generation individuals can switch their phenotype or keep their parents’ but they cannot go extinct. Different phenotypes are better suited for different environments, with the best phenotype guaranteeing more offspring and larger fitness. Different phenotype switching strategies result in different long term population growth rates, , and the optimal strategy depends on the environmental fluctuation statistics [74, 76]. In extended approaches, differentiating between phenotype and genotype leads to considering different modes of inheritance and sensing [77]. In all cases, the optimal strategies are strongly dependent on the timescales of environmental fluctuations. For example, the diversity of vertebrate and microbial forms of immunity can be rationalized using this theoretical framework in terms of the differences between the timescales of the lifetime of the host compared to the pathogen: vertebrates typically have much longer timescales than their pathogens, while microbe lifetimes are similar to those of their invaders [78]. The different immune strategies (such as CRISPR-like vs bet-hedging or adaptive vs innate immunity) then would result from differences in the frequencies of the invading pathogens.
Lastly, it is also worth noting that these frameworks based on considering long term fitness make direct links with stochastic thermodynamics and information flow [79, 80, 81, 82, 75]. The long term fitness can be decomposed into ratios of probability distributions that correspond to knowing the environment and the uncertainly coming from the environment. While these terms are very hard to evaluate in detail, since they account for path integrals over random trajectories, they correspond to well known fluctuation relations in stochastic thermodynamics, such as the Jarzynski equality [83, 84, 85]. Despite certain attempts to link with experiments [86, 87], this body of work remains mainly theoretical, accentuating the rare event nature of evolution and connecting evolution to ideas in sensing and information flow at the formal level.
Empirical fitness landscapes and adaptive paths
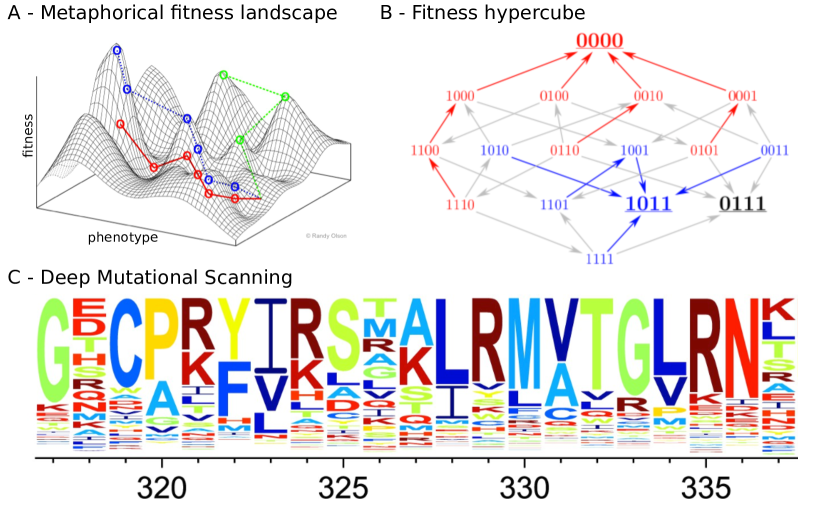
At any given time, the paths along which a population can adapt depend on the environment and the organism’s biology which is a product of billions of years of evolution. The effect of individual mutations, as well as which evolutionary paths are accessible, are therefore contingent on this history. These constraints on evolution are often conceptualized as “fitness landscapes”. Historically, fitness landscapes were depicted in two dimensions as shown in Fig. 4A. These illustrations are a metaphor, but do not capture the structure of the genotype-phenotype map. Explicit genotype-phenotype maps are better represented as a fitness function on the hypercube of genotypes where edges link sequences that differ by a single mutation at one position. One such hypercube for four specific mutations in the fungus Aspergillus niger [90, 88] is illustrated in Fig. 4B. Each pair of sequences that differ by one point mutation are connected by an arrow that points to the genotype of higher fitness. The peaks of the fitness landscape can be identified as sequences with only incoming arrows.
Weinreich et al. [91] determined a similar fitness landscape by reconstructing all possible intermediate mutants between inhibitor sensitive and resistant variants of the TEM-1 beta-lactamase. In contrast to the A. niger landscape, these five mutations are in close proximity in the genome and connect known functional end-points.
Five mutations in this enzyme are enough to increase resistance by fold compared to the wild-type (WT) TEM-1. The authors constructed all mutational paths between the five point mutant and the WT. Most of the 120 paths passed through strongly deleterious genotypes: only 18 were found to avoid them and showed up as feasible evolutionary trajectories. Still, half of the weight of all possible evolutionary trajectories followed just two paths. The preference for these paths arises because the order of mutations is important for their effect: mutations that are beneficial in one mutational background become deleterious in another background. . Szendro et al.[92] review empirical fitness landscapes of this type.
In contrast to the above approaches that investigated all possible combinations of a small number of mutations, deep mutational scanning (DMS) experiments [93] generate close to all possible single mutants of a wildtype protein and measure their relative performance with respect to a specific function (e.g. binding of a ligand, enzymatic activity, stability). An example of the output of a DMS experiment that represents amino acid preferences at specific positions is shown in Fig. 4C.
Inferring fitness and structure from sequence data
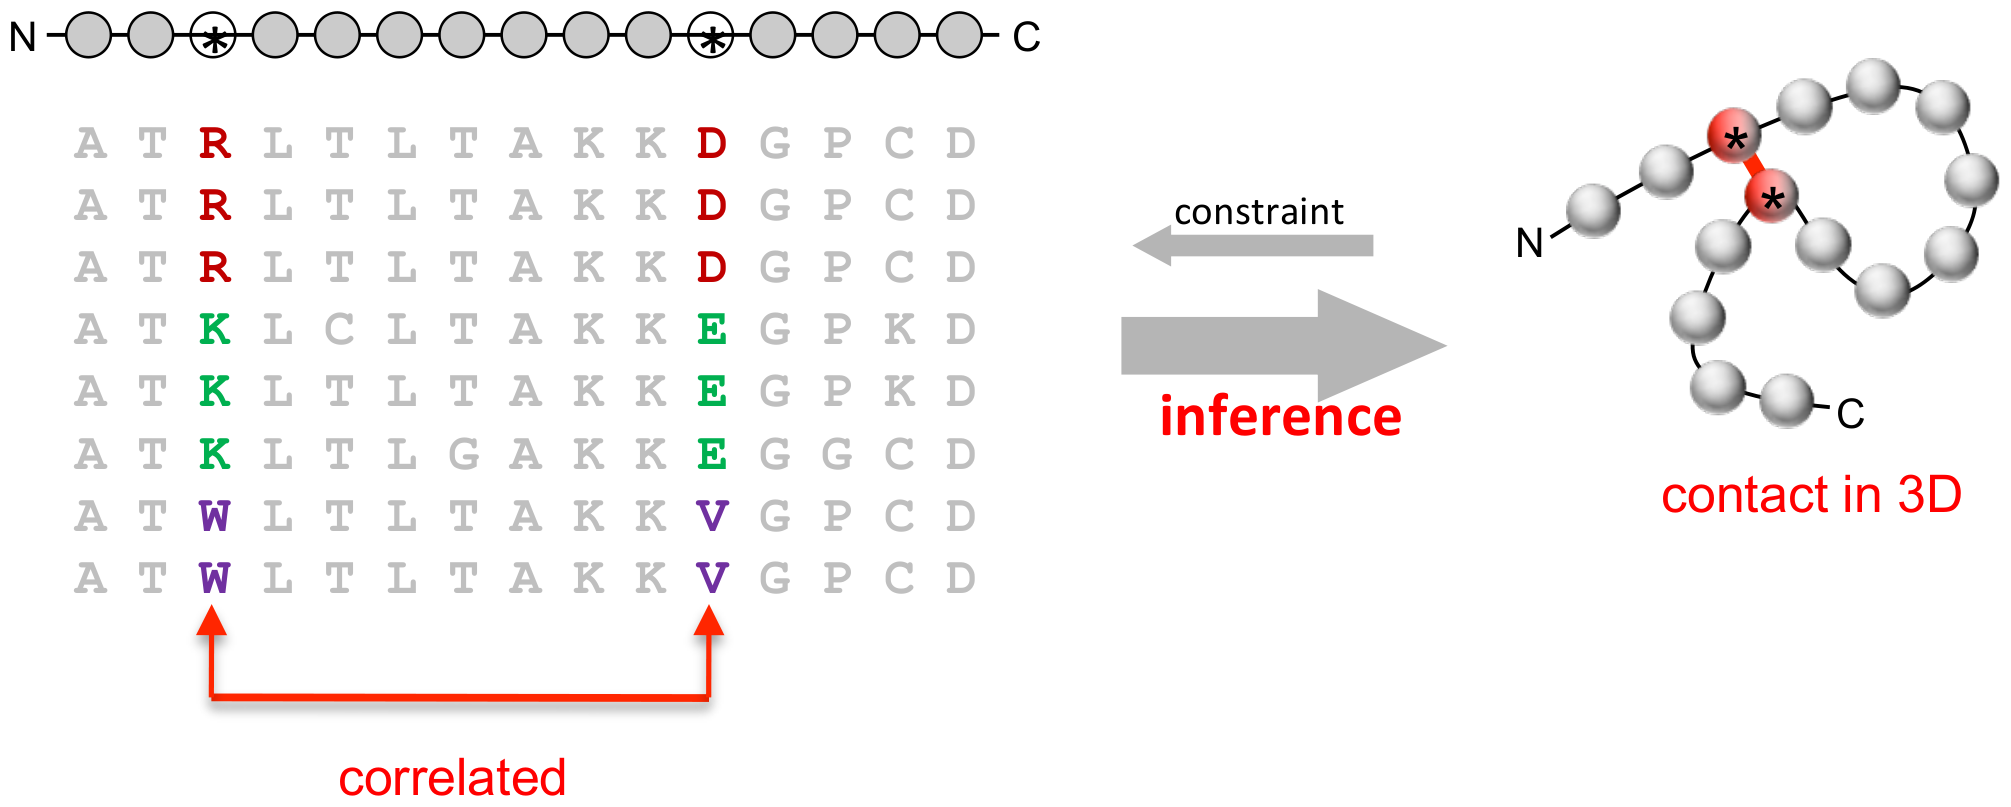
Since it is easier to destroy protein function or a working pathway than to improve function, the majority of mutations in functional regions of a genome are expected to be deleterious. Mutations in these regions are pruned by purifying selection and even distantly related proteins tend to have similar sequence in such regions. From protein families – statistically meaningful ensembles of proteins coming from different organisms that can be aligned to each other since they share an evolutionary history – we can learn how protein structure and function constrain evolution. By analyzing alignments of these families, we see that mutations at certain sites are more common than at others (Fig. 5). Additionally mutations at certain sites are correlated: mutating one amino acid at a certain position may always be accompanied by a mutation at another position [94]. In certain protein families correlations between amino acids in their sequences prove extremely important for their structure and function: a substantial fraction of artificially engineered proteins that constrain the same pairwise correlations as naturally occurring WW domains were shown to fold and have a similar function to WW domains found in nature [95, 96].
These promising results started a whole field of understanding to what degree contacts between amino acids and protein structure can by inferred from pairwise correlations, , between the occurrence of amino acid at position and amino acid at position [97, 98, 99]. These point and pairwise frequencies can be estimated from data, or learned from a model that describes the probability of the whole protein sequence , . Overall, these models and other analysis [100, 101, 102, 103] of ordered proteins show that protein stability mediated by amino acid interactions is an important determinant of fitness.
A model that maximizes the entropy, , of the possible protein sequences, , while constraining the experimentally measured correlation matrix, , and imposing normalization of the probability to see a given protein sequence, , leads to a prediction for the form of the probability to observe a given protein sequence, . denotes amino acid at position and is the matrix encoding the interactions between all possible amino acids at position and .
This framework infers pairwise interactions between specific residues, which can then be used to identify interaction surfaces between proteins [98] and residue pairs in close proximity in the 3D structure [104]. Accurate prediction of residue contacts, in turn, allow inference of 3D protein structure from genetic diversity alone [105].
An alternative approach has also been developed based on a delocalized spectral decomposition of the correlation matrix weighted by positional conservation, , into modes termed “sectors” ordered by their eigenvalues [106, 107]. Positions contributing to dominant “sectors” are contiguous in the tertiary structure, show common biophysical and biochemical properties and form functional units with independent patterns of sequence divergence. These delocalized and localized frameworks have been unified by showing that they are both limiting cases of a more general decomposition in terms of a Hopfield-Potts model, , where correspond to a set of delocalized modes that can be mapped onto sectors, while their summation reproduces the effective interaction matrix [108, 107]. For a full description of protein sequence diversity both small and large scales are needed, although often reduced descriptions do very well.
Knowing that correlations are important motivated researchers to map out the mutational landscape and link specific mutations, and their interactions to phenotypic variables, such as the fitness of the E. coli bacterium carrying a given beta-lactamase TEM-1 mutant [99], or the affinity of antibodies - proteins involved in an immune response - against a specific antigen [109]. These studies, which are examples of deep mutational scans, find that most mutants are detrimental – they reduce the fitness or binding affinity compared to the wild-type protein. They also show the importance of amino-acid interactions – termed epistasis, which is not limited to a few strongly interacting pairs but can take the form of many weakly interacting sites [109]. The epistatic sites contribute substantially to to antibody binding and many of the mutations display positive epistasis [110], potentially enlarging the mutational accessibility of high-affinity antibodies.
Evolving novel functions
Deep mutational scanning experiments probe the neighborhood of a particular wild-type genotype, but typically have little to say about plausible evolutionary paths that are several mutations in length because of epistatic interactions between successive mutations.
Possibly more representative evolutionary trajectories are generated by repeated diversification and selection. Similar to DMS, directed evolution experiments generate a diverse library of genotypes and select the best molecules for a given function, such as binding a specific ligand. The pool of sequences that emerges as “winners” can be analyzed to identify successful mutations and serves as a starting point for the next round of diversification. This artificial selection process is very efficient, but it is unclear whether this combination of very high mutation and strong selection results in similar trajectories as evolution in the wild.
Bloom and Arnold allowed the cytochrome P450 enzyme to accumulate mutations that were neutral for one specific substrate [111]. When they tested the activity of the mutant enzymes to five different substrates they found that some of these mutants showed up to four-fold higher activity to the new substrates than to the original one. The enzyme evolved what is known as cross-reactivity or promiscuity. It has been argued that enzyme promiscuity is a critical starting point for evolution of novel activities [112].
Affinity maturation in B-cells – important actors of the immune system that recognize pathogens – is a natural process that is similar to directed evolution experiments. Affinity maturation starts from a diverse source of immune cells that get selected for their ability to recognize an invading pathogen. The cells that bind more strongly to the pathogenic molecules proliferate faster, undergoing Darwinian evolution: the offspring cells acquire somatic mutations, which then get selected upon in the next round. This way, affinity maturation consists of several rounds of mutations and selection, forming evolutionary lineages just like viruses or microbes, and the affinity of B-cells to pathogenic molecules increases 10-100 fold [113]. At the end, a fraction of the evolved cells are kept in a subcompartment of the immune system called the memory repertoire, which responds rapidly upon re-infection by a similar pathogen, conferring fast protection. Recent experiments have shown that when B-cells are stimulated with a synthetic molecule, a hapten, affinity maturation looks very much like the directed evolution experiment: the B-cell binding affinity for the hapten increases and the diversity of B-cells decreases during the process. However, when B-cells are stimulated with pathogen derived molecules (antigens), binding affinity still increases but diversity remains high [114]. Interestingly, the cells that are kept in the memory pool at the end of affinity maturation are not necessarily the best binders. So it seems that the real life “directed evolution” experiment is more complex than the in-lab version. Of course, natural antigens are much more complex than haptens, since they are composed of many receptor binding regions, termed epitopes. Yet the diversity of epitopes is not the only reason for a diverse response. The strength of the response of different selected clones to a specific epitope can vary by orders of magnitude, with even clones that do not strongly bind the antigen surviving affinity maturation. The diversity of B-cells during affinity maturation also increases with time, as initially rare but better binding clones increase in frequency adding to the frequent initial winners. The detailed experiments exclude obvious explanations such as spatial mixing or recruitment of new naive cells, leaving an open question about how a broad response is up-kept and what are its benefits for protection.
Co-evolution
Analysis of empirical fitness landscapes showed that evolutionary paths within isolated proteins are strongly constrained. Additionally, evolution occurs in the presence of other interaction partners, constraining the fitness landscape of interest by fitness landscapes of interacting organisms and making it dynamic.
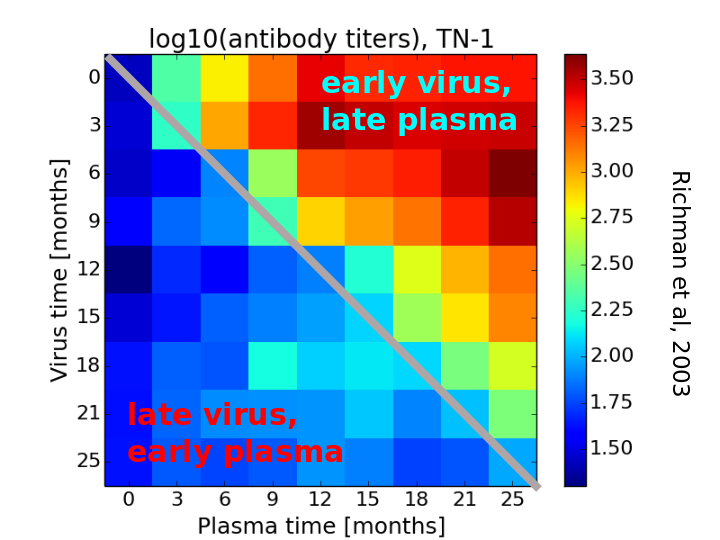
Co-evolution can be readily observed between pathogens and the adaptive immune system. The adaptive immune system consists of a diverse set of B and T-cells that are endowed with specialized receptors able to bind pathogenic molecules, successfully recognize them as foreign to the host organism and trigger an immune response aimed at eliminating them. The diversity of different cells is needed, given the different pathogens a host may encounter. However, as the immune system recognizes pathogens, it exerts pressure on the pathogens that mutate and escape the immune system. In turn this forces the immune system to evolve and chase the pathogens, resulting in an arms-race like co-evolutionary process. Fig. 6 shows on example of this process from a chronic HIV infection. Antibodies in plasma neutralize virus variants that circulated in the past, but the virus population rapidly evolves new variants that escape neutralization. Another good example is the evolution of broadly neutralizing anti-bodies against HIV [115]. Repeated exposure to changing antigens eventually result in antibodies that recognize conserved in-variable features of the virus. Similarly, seasonal influenza viruses evade immunity that gradually builds up in the human population [24].
It is very hard to sample all the possible pathogens that we are exposed to, but thanks to recent high-throughput sequencing technology we can now sample a significant fraction of the immune receptors in a given organism [117, 118, 119, 120, 121, 122, 123]. These experiments combined with an advanced statistical analysis show that non-related healthy people that do not necessarily share the same lifestyle, share as many unique immune receptors as expected by chance, if we use the structure of the repertoire for the random estimate [124, 125]. Outliers from these estimates can be linked to functional selection pressures [126]. Even in such diverse ensembles we can thus identify reproducible patterns also at the genotype level and ask how is diversity constrained, given an appropriate statistical analysis.
Ultimately, the convergence of responses matters at the phenotype level: there are probably many different ways of conferring resistance against a given pathogen. Antigenic landscape maps and neutralization assays are examples of phenotypic assays that address this problem [116, 127], especially for viral evolution (Fig. 6). Different virus strains are exposed to the aliquots from the same blood sample. The ability of the sample to produce protective antibodies is translated into a measure of similarity of viral strains. Lately, high-throughput affinity assays that use specific antigens to “fish out” responding antibodies provide different phenotypic measurements. Linking different phenotypic levels and linking phenotype to genotype remains challenging, although it is necessary if we want describe co-evolution at the genotypic scale.
Co-evolution is not only important for pairs of organisms, but is also observed between interacting components of cells. A number of studies describe how two mutating molecular partners influence each others evolutionary paths, creating a mutual fitness landscape [128, 129, 130]. Anderson et al. reconstructed all possible paths in an ancient transition between two hormone ligands and two binding sites, closed evolutionary paths were opened by permissive mutations occurring in the partner. These mutations allowed the first partner to tolerate mutations that would otherwise be deleterious [130]. Similarly, certain paths were closed by co-evolution. The evolutionary history of the pair depends strongly on the partners history and shows that co-evolution has strong implications on the space of evolutionary paths. Evolutionary paths, in turn, are trajectories conditional on their surroundings.
The hormone-binding site study shows an example of the positive effects of co-evolution opening otherwise certain forbidden paths. However, co-evolution can also involve more than two interacting partners that infer strong negative selection pressures upon each other.
Open problems: constrained viral–immune co-evolution and predictability
The immune system is an example of a fast evolving system, where the frequencies of different receptor species change with time, responding to changes in the antigenic environments. New “species” (receptor variants) are constantly trying to “invade” an the existing population, however their success, or fitness, depends on both the current state of the existing repertoire and the current state of the external environment. The adaptive system functions as a distributed network, and current evidence shows that even intuitive processes such as affinity maturation of B-cells to specific antigens proof to be more complex than we expected. Yet the repeatability of these evolutionary experiments in many organisms gives an opportunity to ask questions that bridge ecology and evolution and quantitatively test theoretical predictions. It is also a good system to push the limits of our ability to predict responses. Current predictions of future virus strains pick winners from candidate strains that are already present at relatively high frequencies. Formulating the problem in this way, is extremely useful. Yet an ideal understanding of viral and immune co-evolution should be able to a priori identify new mutations, albeit probabilistically. This is of course an extremely challenging task. Whenever it fails, it will probably teach us a lot about the limits of predictability, potentially crystallising natural boundaries of these processes.
Ecology
Each species evolves in a dynamic environment shaped not only by abiotic factors but also by other species. This naturally generalizes co-evolution to a larger number of interacting species. Thanks to the advances in sequencing technologies, we can now sample the diversity of microbial communities in the wild, on fermented food or cheese, and in various bodily orifices [131]. We can first ask about the diversity of species living in a given community. The study of different cheese rinds reveals that most of the large bacterial diversity originates from environmental sources, such as the air, as opposed to starter cultures, and that abiotic factors (e.g. salinity, pressure, moisture) shape the community composition [132]. The environment favors certain strains and the growth of these strains changes the environment for the community. Theoretical descriptions of such interactions go back to the 1970s [133] and are described by generalized consumer–resource, or Lotka-Volterra like models. The differences in the assumptions matter, but in general one considers the change in time of a subpopulation of size , due to effective growth , community interactions with other substrains and itself, , and noise, :
| (5) |
Both the effective growth and community interaction terms can additionally depend directly on environmental factors. These approaches allow us to ask questions about timescales, the role of interactions and the environment, and have produced a very large body of work [134, 135, 136]. However until recently [137, 138] they remained mostly disconnected from experiments.
Characterizing diversity gives us a static picture of a community. We can also ask how diversity evolves. From studies of the marine plankton bacterium Prochlorococcus we learn that the changes in the environment can be transmitted to the community through changes in the metabolism of its members [139]. Prochlorococcus lives at different depths in the ocean and its subpopulations have adapted to the levels of light and nutrients available at each immersion depth. The whole population responds to modifications in the external environment, such as light exposure, by a niche constructing chain of adaptation. New ecotypes change their metabolism, chemically modify their environment, which exerts pressure on their co-inhabitants and globally change the diversity of the whole ecosystem[140]. Theoretical studies of interacting Lotka-Volterra like models with random interactions show that these systems have a limited capacity for how many different species they can support [133] and diversity is predicted to exactly surf the allowed bound [141]: a community with initially more species will decrease the number of species until the maximum allowed number survive. This diversity constraint means the system is marginally stable, which is known in spin glass physics to correspond to a highly rugged landscape with many minima. Even small perturbations of the system will lead to large, nonlinear rearrangements of the landscape and a new community composition. These experimental and theoretical results open up a series of questions about the timescales for community rearrangements, their dynamics and whether the communities we observe are stable or transient [142]. How should we interpret the fact that random interaction models often give reasonable expectations?
The adaptation of Prochlorococcus to different environmental niches is also visible at the level of genetic variation. The genetic diversity is huge: in 1ml of water there are hundreds subpopulations and the sequencing of each new organism adds 160 new genes, which corresponds to of the known pan genome [139]. The genetic variation can be linked to niche adaptation. On top of the backbone genome adapted to light, nutrient and temperature variability and shared between organisms in a given niche, each bacterium has many flexible genes, resulting in this very large genomic diversity. Despite large population sizes of , a relatively average mutation rate , but extremely strong environmental selection, no selective sweeps have been reported and the diversity is huge. These observations defy the predictions of traditional population genetics. Why is there so much diversity given the strong selection pressures? Many ideas have been put forward, including co-evolution with predators (phages), recombination, which is extremely common in bacteria in the wild, the potentially complicated role of selective environments, as well as the role of the population structure, which suggest that we should study the whole federation of organisms living in a given ecosystem as selectable units. At this point the list of possibilities means we do yet have an answer.
Cyanobacteria are part of the Prochlorococcus federation. But they also live in hotsprings, where similarly to Prochlorococcus they show huge genetic diversity despite strong selection [143]. However, unlike Prochlorococcus, which despite the within-niche diversity does show a niche structure, these cyanobacterial biofilm genomes form a freely recombining gene pool, where allele frequency correlations between individuals decay on very small length scales along the genome. Selection seems to structure the genomes on short genomic scales, while recombination dominates on longer scales. Only an advanced statistical analysis combined with appropriate sequencing experiments was able to reveal this picture of a community without coherent strain that correspond to genome-wide stable ecotypes.
Open problems: linking ecology and evolution
Linking ecology and evolution is the least developed of the open problems discussed in this review. Similarly to cyanobacteria and Prochlorococcus, analysis of E. Coli genomes in the wild finds even many interesting signatures of the interplay of the underlying evolutionary forces with the surrounding habitat. These studies leave us with the impression that simply gathering data will not answer the question about the structure of diversity and the relevance of different forces. Only analysis methods driven by a theoretical understanding of the evolutionary processes can help us make sense of the vast datasets and understand the structure of microbial communities. In addition to a lack of understanding of the relevant organizational scales, we know little about the relevant time scales. Is the diversity we observe stable or inherently transient? Is change driven by properties of the dynamical system, or are systems adiabatically coupled to changing environments?
Conclusions
Our understanding of short term evolution in controlled or stereotypic environments has improved dramatically over the past decades. At the same time, quantitative high-throughput methods to survey fitness landscapes and eco-evolutionary dynamics of populations expose the complexity of biology and highlight the short-comings of the theoretical models of evolution.
Detailed studies of evolution in microbial populations [59, 22, 29] are first steps towards a more comprehensive understanding of rapid adaptive evolution and we have obtained partial answers to questions like (i) what are the relevant parameters, (ii) how gradual is evolution, (iii) and in what sense and to what degree can evolution be reproducible or predictable [144, 145, 146]. Whether these insights extrapolate to other systems and to different temporal or spatial scale is unclear and doubtful.
In addition to evolutionary dynamics, we have made substantial progress in understanding how proteins or molecular circuits evolve to acquire new functions and what are the constraints on diversification. Deep mutational scanning experiments [93] allow high-throughput characterization of protein function landscapes, directed evolution experiments have shown how proteins can acquire new functions, and sequencing of immune receptor repertoires has shown how the vertebrate immune systems prepares for future challenges and optimizes its response against recurrent challenges. Beyond individual proteins, however, predicting or even characterizing the perturbations remains challenging beyond the crudest of perturbations (e.g. transposon sequencing knock-out libraries [147]).
Genetic diversity is easy to quantify these days by high throughput sequencing. But interpreting this diversity is difficult since (i) it remains difficult to associate genetic diversity with function and phenotype, (ii) most data are static, and (iii) limited to a minority of the interacting entities.
Recent metagenomic studies quantifying diversity, composition, and dynamics of microbial ecosystems are just scratching the surface and we have little understanding of the rules governing such communities. We tried to give examples and show how diversity is observed on many scales and also evolution acts across scales, from the molecular, through the genomic and organismal to the ecological. Despite a lot of experimental data and different theoretical approaches that lead to fascinating observations we still lack a unified framework for understanding diversity. Clearly, as evidenced by microbial communities, the events on one scale influence the observed diversity at another scale. Do we need to develop a detailed understanding on all scales to describe a given phenomenon or to can we understand one scale without considering the others? Is there a well defined separation of scales when describing diversity, is everything deeply interconnected or is there are cascade of scales where one scales feeds into the next?
In summary, we have developed a reasonable understanding of dynamics on short time scales in systems where the “objective” of the evolving population is clear and static, e.g. the global influenza virus population. But our ability to generalize and extrapolate to longer time scales, more complex environments or ecosystems is limited to absent.
Acknowledgement
We are grateful to Benjamin Good and Thierry Mora for critical reading of the manuscript and providing valuable feedback.
References
- [1] N. R. Garud, B. H. Good, O. Hallatschek and K. S. Pollard, Evolutionary dynamics of bacteria in the gut microbiome within and across hosts, bioRxiv , p. 210955 (October 2017).
- [2] M. L. Bendall, S. L. Stevens, L.-K. Chan, S. Malfatti, P. Schwientek, J. Tremblay, W. Schackwitz, J. Martin, A. Pati, B. Bushnell, J. Froula, D. Kang, S. G. Tringe, S. Bertilsson, M. A. Moran, A. Shade, R. J. Newton, K. D. McMahon and R. R. Malmstrom, Genome-wide selective sweeps and gene-specific sweeps in natural bacterial populations, The ISME Journal 10, 1589 (July 2016).
- [3] S. Zhao, T. D. Lieberman, M. Poyet, M. Groussin, S. M. Gibbons, R. J. Xavier and E. J. Alm, Adaptive evolution within the gut microbiome of individual people, bioRxiv , p. 208009 (October 2017).
- [4] D. S. Falconer, Introduction to Quantitative Genetics (Textbook Publishers, 2003), Google-Books-ID: R052PwAACAAJ.
- [5] J. Kingman, On the genealogy of large populations, Journal of Applied Probability 19A, 27 (1982).
- [6] M. Kimura, Stochastic processes and distribution of gene frequencies under natural selection, Cold Spring Harb Symp Quant Biol 20, 33 (1955).
- [7] J. H. Gillespie, Genetic Drift in an Infinite Population: The Pseudohitchhiking Model, Genetics 155, 909 (June 2000).
- [8] R. R. Hudson, Gene genealogies and the coalescent process., Oxford Surveys in Evolutionary Biology 7, 1 (1990).
- [9] S. M. Krone and C. Neuhauser, Ancestral processes with selection, Theoretical population biology 51, 210 (1997).
- [10] Y. Iwasa, Free fitness that always increases in evolution, Journal of Theoretical Biology 135, 265 (December 1988).
- [11] J. Berg, S. Willmann and M. Lässig, Adaptive evolution of transcription factor binding sites, BMC Evolutionary Biology 4, p. 42 (October 2004).
- [12] G. Sella and A. E. Hirsh, The application of statistical physics to evolutionary biology, Proceedings of the National Academy of Sciences of the United States of America 102, 9541 (July 2005).
- [13] R. B. Corbett-Detig, D. L. Hartl and T. B. Sackton, Natural selection constrains neutral diversity across a wide range of species, PLoS Biology 13, p. e1002112 (2015).
- [14] H. Li and R. Durbin, Inference of human population history from individual whole-genome sequences, Nature 475, 493 (2011).
- [15] S. Schiffels and R. Durbin, Inferring human population size and separation history from multiple genome sequences, Nature genetics 46, 919 (2014).
- [16] D. B. Weissman and O. Hallatschek, Minimal-assumption inference from population-genomic data, Elife 6 (2017).
- [17] R. N. Gutenkunst, R. D. Hernandez, S. H. Williamson and C. D. Bustamante, Inferring the joint demographic history of multiple populations from multidimensional snp frequency data, PLoS genetics 5, p. e1000695 (2009).
- [18] A. O. Bergland, E. L. Behrman, K. R. O’Brien, P. S. Schmidt and D. A. Petrov, Genomic evidence of rapid and stable adaptive oscillations over seasonal time scales in drosophila, PLoS Genetics 10, p. e1004775 (2014).
- [19] G. Sella, D. A. Petrov, M. Przeworski and P. Andolfatto, Pervasive natural selection in the drosophila genome?, PLoS genetics 5, p. e1000495 (2009).
- [20] J. E. Barrick, D. S. Yu, S. H. Yoon, H. Jeong, T. K. Oh, D. Schneider, R. E. Lenski and J. F. Kim, Genome evolution and adaptation in a long-term experiment with Escherichia coli, Nature 461, 1243 (October 2009).
- [21] S. F. Levy, J. R. Blundell, S. Venkataram, D. A. Petrov, D. S. Fisher and G. Sherlock, Quantitative evolutionary dynamics using high-resolution lineage tracking, Nature 519, p. 181 (March 2015).
- [22] F. Zanini, J. Brodin, L. Thebo, C. Lanz, G. Bratt, J. Albert and R. A. Neher, Population genomics of intrapatient HIV-1 evolution, eLife Sciences 4, p. e11282 (January 2016).
- [23] WHO | Global Influenza Surveillance and Response System (GISRS).
- [24] V. N. Petrova and C. A. Russell, The evolution of seasonal influenza viruses, Nature Reviews Microbiology advance online publication (October 2017).
- [25] V. V. Ganusov, N. Goonetilleke, M. K. P. Liu, G. Ferrari, G. M. Shaw, A. J. McMichael, P. Borrow, B. T. Korber and A. S. Perelson, Fitness Costs and Diversity of the Cytotoxic T Lymphocyte (CTL) Response Determine the Rate of CTL Escape during Acute and Chronic Phases of HIV Infection, Journal of Virology 85, 10518 (October 2011).
- [26] D. N. Levy, G. M. Aldrovandi, O. Kutsch and G. M. Shaw, Dynamics of hiv-1 recombination in its natural target cells, Proceedings of the National Academy of Sciences 101, 4204 (2004).
- [27] R. A. Neher and T. Leitner, Recombination rate and selection strength in HIV intra-patient evolution., PLoS computational biology 6, p. e1000660 (January 2010).
- [28] R. Shankarappa, J. B. Margolick, S. J. Gange, A. G. Rodrigo, D. Upchurch, H. Farzadegan, P. Gupta, C. R. Rinaldo, G. H. Learn, X. He, X.-L. Huang and J. I. Mullins, Consistent Viral Evolutionary Changes Associated with the Progression of Human Immunodeficiency Virus Type 1 Infection, Journal of Virology 73, 10489 (December 1999).
- [29] B. H. Good, M. J. McDonald, J. E. Barrick, R. E. Lenski and M. M. Desai, The dynamics of molecular evolution over 60,000 generations, Nature 551, 45 (November 2017).
- [30] L. Tsimring, H. Levine and D. Kessler, RNA virus evolution via a fitness-space model, Phys Rev Lett 76, 4440 (Jun 1996).
- [31] R. A. Neher, Genetic Draft, Selective Interference, and Population Genetics of Rapid Adaptation, Annual Review of Ecology, Evolution, and Systematics 44, 195 (2013).
- [32] I. M. Rouzine, J. Wakeley and J. M. Coffin, The solitary wave of asexual evolution, Proceedings of the National Academy of Sciences 100, 587 (January 2003).
- [33] M. M. Desai and D. S. Fisher, Beneficial mutation selection balance and the effect of linkage on positive selection, Genetics 176, 1759 (Jul 2007).
- [34] B. H. Good, I. M. Rouzine, D. J. Balick, O. Hallatschek and M. M. Desai, Distribution of fixed beneficial mutations and the rate of adaptation in asexual populations, Proceedings of the National Academy of Sciences 109, 4950 (March 2012).
- [35] C. M. Thomas and K. M. Nielsen, Mechanisms of, and Barriers to, Horizontal Gene Transfer between Bacteria, Nature Reviews Microbiology 3, 711 (September 2005).
- [36] R. A. Neher and B. I. Shraiman, Competition between recombination and epistasis can cause a transition from allele to genotype selection., Proceedings of the National Academy of Sciences of the United States of America 106, 6866 (April 2009).
- [37] I. M. Rouzine and J. M. Coffin, Evolution of Human Immunodeficiency Virus Under Selection and Weak Recombination, Genetics 170, 7 (May 2005).
- [38] R. A. Neher, B. I. Shraiman and D. S. Fisher, Rate of adaptation in large sexual populations., Genetics 184, 467 (feb 2010).
- [39] D. B. Weissman and N. H. Barton, Limits to the Rate of Adaptive Substitution in Sexual Populations, PLOS Genetics 8, p. e1002740 (June 2012).
- [40] R. A. Neher, T. A. Kessinger and B. I. Shraiman, Coalescence and genetic diversity in sexual populations under selection., Proceedings of the National Academy of Sciences of the United States of America 110, 15836 (September 2013).
- [41] E. Cohen, D. A. Kessler and H. Levine, Recombination Dramatically Speeds Up Evolution of Finite Populations, Physical Review Letters 94, p. 098102 (March 2005).
- [42] E. Brunet, B. Derrida, A. H. Mueller and S. Munier, Phenomenological theory giving the full statistics of the position of fluctuating pulled fronts, Physical review E, Statistical, nonlinear, and soft matter physics 73, p. 056126 (May 2006).
- [43] N. Berestycki, Recent progress in coalescent theory, Ensaios Matematicos 16, 1 (2009).
- [44] J. Schweinsberg, Coalescent processes obtained from supercritical Galton–Watson processes, Stochastic Processes and their Applications 106, 107 (July 2003).
- [45] M. M. Desai, A. M. Walczak and D. S. Fisher, Genetic Diversity and the Structure of Genealogies in Rapidly Adapting Populations, Genetics 193, 565 (February 2013).
- [46] R. A. Neher and O. Hallatschek, Genealogies of rapidly adapting populations, Proceedings of the National Academy of Sciences 110, 437 (January 2013).
- [47] R. A. Neher, C. A. Russell and B. I. Shraiman, Predicting evolution from the shape of genealogical trees., eLife 3 (November 2014).
- [48] K. Kosheleva and M. M. Desai, The dynamics of genetic draft in rapidly adapting populations, Genetics 195, 1007 (November 2013).
- [49] O. Hallatschek, Selection-like biases emerge in population models with recurrent jackpot events, bioRxiv , p. 182519 (August 2017).
- [50] O. Sargsyan and J. Wakeley, A coalescent process with simultaneous multiple mergers for approximating the gene genealogies of many marine organisms, Theoretical Population Biology 74, 104 (August 2008).
- [51] F. Horns, C. Vollmers, C. L. Dekker and S. R. Quake, Signatures of selection in the human antibody repertoire: Selective sweeps, competing subclones, and neutral drift, bioRxiv , p. 145052 (2017).
- [52] A. Nourmohammad, J. Otwinowski, M. Luksza, T. Mora and A. M. Walczak, Clonal competition in B-cell repertoires during chronic HIV-1 infection, bioarxiv (2018).
- [53] M. D. Rasmussen, M. J. Hubisz, I. Gronau and A. Siepel, Genome-Wide Inference of Ancestral Recombination Graphs, PLOS Genetics 10, p. e1004342 (May 2014).
- [54] R. Neher and B. Shraiman, Statistical genetics and evolution of quantitative traits, Rev. Mod. Phys. 83, 1283 (Nov 2011).
- [55] B. H. Good, A. M. Walczak, R. A. Neher and M. M. Desai, Genetic Diversity in the Interference Selection Limit, PLoS Genet 10, p. e1004222 (March 2014).
- [56] R. A. Neher and B. I. Shraiman, Genetic draft and quasi-neutrality in large facultatively sexual populations., Genetics 188, 975 (August 2011).
- [57] M. Villa and M. Lässig, Fitness cost of reassortment in human influenza, PLOS Pathogens 13, p. e1006685 (November 2017).
- [58] E. Toprak, A. Veres, J.-B. Michel, R. Chait, D. L. Hartl and R. Kishony, Evolutionary paths to antibiotic resistance under dynamically sustained drug selection, Nat Genet 44, 101 (January 2012).
- [59] O. Tenaillon, A. Rodríguez-Verdugo, R. L. Gaut, P. McDonald, A. F. Bennett, A. D. Long and B. S. Gaut, The molecular diversity of adaptive convergence, Science 335, 457 (Jan 2012).
- [60] D. H. Morris, K. M. Gostic, S. Pompei, T. Bedford, M. Łuksza, R. A. Neher, B. T. Grenfell, M. Lässig and J. W. McCauley, Predictive Modeling of Influenza Shows the Promise of Applied Evolutionary Biology, Trends in Microbiology 26, 102 (February 2018).
- [61] M. Łuksza and M. Lässig, A predictive fitness model for influenza, Nature 507, p. 57 (March 2014).
- [62] M. Lescat, A. Launay, M. Ghalayini, M. Magnan, J. Glodt, C. Pintard, S. Dion, E. Denamur and O. Tenaillon, Using long-term experimental evolution to uncover the patterns and determinants of molecular evolution of an Escherichia coli natural isolate in the streptomycin-treated mouse gut, Molecular Ecology 26, 1802 (2017).
- [63] J. Barroso-Batista, A. Sousa, M. Lourenço, M. L. Bergman, D. Sobral, J. Demengeot, K. B. Xavier and I. Gordo, The First Steps of Adaptation of Escherichia coli to the Gut Are Dominated by Soft Sweeps, PLoS Genetics 10 (2014).
- [64] J. Barroso-Batista, J. Demengeot and I. Gordo, Adaptive immunity increases the pace and predictability of evolutionary change in commensal gut bacteria, Nature Communications 6, p. 8945 (2015).
- [65] A. Giraud, Costs and Benefits of High Mutation Rates: Adaptive Evolution of Bacteria in the Mouse Gut, Science 291, 2606 (2001).
- [66] M. M. Desai and D. S. Fisher, The balance between mutators and nonmutators in asexual populations, Genetics 188, 997 (2011).
- [67] B. Dößelmann, M. Willmann, M. Steglich, B. Bunk, U. Nübel, S. Peter and R. A. Neher, Rapid and Consistent Evolution of Colistin Resistance in Extensively Drug-Resistant Pseudomonas aeruginosa during Morbidostat Culture, Antimicrobial Agents and Chemotherapy 61, e00043 (September 2017).
- [68] V. Mustonen and M. Lässig, From fitness landscapes to seascapes: non-equilibrium dynamics of selection and adaptation, Trends in Genetics 25, 111 (2009).
- [69] I. Cvijović, B. H. Good, E. R. Jerison and M. M. Desai, Fate of a mutation in a fluctuating environment, Proceedings of the National Academy of Sciences 112, E5021 (2015).
- [70] A. Melbinger and M. Vergassola, The Impact of Environmental Fluctuations on Evolutionary Fitness Functions, Scientific Reports 5, p. 15211 (2015).
- [71] T. Mora and A. Walczak, Quantifying lymphocyte receptor diversity, ArXiv , p. 1604.00487 (2016).
- [72] T. Mora, A. M. Walczak, W. Bialek and C. G. Callan, Maximum entropy models for antibody diversity., Proc. Natl. Acad. Sci. 107, 5405 (mar 2010).
- [73] J. Desponds, T. Mora and A. M. Walczak, Fluctuating fitness shapes the clone-size distribution of immune repertoires., Proc. Natl. Acad. Sci. 113, 274 (2016).
- [74] E. Kussell and S. Leibler, Phenotypic diversity, population growth, and information in fluctuating environments., Science (New York, N.Y.) 309, 2075 (sep 2005).
- [75] O. Rivoire, Informations in Models of Evolutionary Dynamics, Journal of Statistical Physics 162, 1324 (2016).
- [76] A. Skanata and E. Kussell, Evolutionary Phase Transitions in Random Environments, Physical Review Letters 117, 1 (2016).
- [77] O. Rivoire and S. Leibler, The Value of Information for Populations in Varying Environments, Journal of Statistical Physics 142, 1124 (mar 2011).
- [78] A. Mayer, V. Balasubramanian, T. Mora and A. M. Walczak, How a well-adapted immune system is organized., Proc. Natl. Acad. Sci. 112, 5950 (jul 2015).
- [79] V. Mustonen and M. Lässig, Fitness flux and ubiquity of adaptive evolution, Proceedings of the National Academy of Sciences of the United States of America 107, 4248 (2010).
- [80] T. J. Kobayashi and Y. Sughiyama, Steady state thermodynamics in population dynamics, Physical Review Letters 115, p. 238102 (2015).
- [81] Y. Sughiyama, T. J. Kobayashi, K. Tsumura and K. Aihara, Pathwise thermodynamic structure in population dynamics, Physical Review E - Statistical, Nonlinear, and Soft Matter Physics 91, 3 (2015).
- [82] T. J. Kobayashi and Y. Sughiyama, Fluctuation Relations of Fitness and Information in Population Dynamics, Physical Review Letters 115, 4 (2015).
- [83] C. Jarzynski, A nonequilibrium equality for free energy differences, Physical Review Letters 78, 0 (1996).
- [84] G. E. Crooks, Nonequilibrium Measurements of Free Energy Differences for Microscopically Reversible Markovian Systems, Journal of Statistical Physics 90, 1481 (March 1998).
- [85] G. E. Crooks, The Entropy Production Fluctuation Theorem and the Nonequilibrium Work Relation for Free Energy Differences, Physical Review E - Statistical, Nonlinear, and Soft Matter Physics 60, 2721 (1999).
- [86] G. Lambert and E. Kussell, Quantifying selective pressures driving bacterial evolution using lineage analysis, Physical Review X 5, 1 (2015).
- [87] V. Mustonen and M. Lässig, Adaptations to fluctuating selection in Drosophila, Proceedings of the National Academy of Sciences 104, 2277 (2007).
- [88] J. Franke, A. Klözer, J. A. G. M. d. Visser and J. Krug, Evolutionary Accessibility of Mutational Pathways, PLOS Computational Biology 7, p. e1002134 (August 2011).
- [89] B. Thyagarajan and J. D. Bloom, The inherent mutational tolerance and antigenic evolvability of influenza hemagglutinin, eLife 3 (July 2014).
- [90] J. A. G. M. d. Visser, R. F. Hoekstra and H. van den Ende, Test of Interaction Between Genetic Markers That Affect Fitness in Aspergillus niger, Evolution 51, 1499 (1997).
- [91] D. M. Weinreich, N. F. Delaney, M. A. Depristo and D. L. Hartl, Darwinian evolution can follow only very few mutational paths to fitter proteins, Science (New York, N.Y.) 312, 111 (2006).
- [92] I. G. Szendro, M. F. Schenk, J. Franke, J. Krug and J. A. G. M. d. Visser, Quantitative analyses of empirical fitness landscapes, Journal of Statistical Mechanics: Theory and Experiment 2013, p. P01005 (2013).
- [93] D. M. Fowler, C. L. Araya, S. J. Fleishman, E. H. Kellogg, J. J. Stephany, D. Baker and S. Fields, High-resolution mapping of protein sequence-function relationships., Nature methods 7, 741 (sep 2010).
- [94] E. Neher, How frequent are correlated changes in families of protein sequences?, Proceedings of the National Academy of Sciences 91, 98 (January 1994).
- [95] M. Socolich, S. W. Lockless, W. P. Russ, H. Lee, K. H. Gardner and R. Ranganathan, Evolutionary information for specifying a protein fold., Nature 437, 512 (sep 2005).
- [96] W. P. Russ, D. M. Lowery, P. Mishra, M. B. Yaffe and R. Ranganathan, Natural-like function in artificial WW domains., Nature 437, 579 (sep 2005).
- [97] W. Bialek and R. Ranganathan, Rediscovering the power of pairwise interactions, arXiv preprint arXiv:0712.4397 (2007).
- [98] M. Weigt, R. a. White, H. Szurmant, J. a. Hoch and T. Hwa, Identification of direct residue contacts in protein-protein interaction by message passing., Proceedings of the National Academy of Sciences of the United States of America 106, 67 (jan 2009).
- [99] M. Figliuzzi, H. Jacquier, A. Schug, O. Tenaillon and M. Weigt, Coevolutionary landscape inference and the context-dependence of mutations in beta-lactamase tem-1, Molecular Biology and Evolution 33, 268 (2016).
- [100] J. D. Bloom, J. J. Silberg, C. O. Wilke, D. A. Drummond, C. Adami and F. H. Arnold, Thermodynamic prediction of protein neutrality, Proceedings of the National Academy of Sciences 102, 606 (2005).
- [101] M. A. DePristo, D. M. Weinreich and D. L. Hartl, Missense meanderings in sequence space: a biophysical view of protein evolution, Nature Reviews Genetics 6, 678 (2005).
- [102] C. S. Wylie and E. I. Shakhnovich, A biophysical protein folding model accounts for most mutational fitness effects in viruses, Proceedings of the National Academy of Sciences 108, 9916 (2011).
- [103] H. Jacquier, a. Birgy, H. Le Nagard, Y. Mechulam, E. Schmitt, J. Glodt, B. Bercot, E. Petit, J. Poulain, G. Barnaud, P.-a. Gros and O. Tenaillon, Capturing the mutational landscape of the beta-lactamase TEM-1, Proceedings of the National Academy of Sciences 110, 13067 (jul 2013).
- [104] F. Morcos, A. Pagnani, B. Lunt, A. Bertolino, D. S. Marks, C. Sander, R. Zecchina, J. N. Onuchic, T. Hwa and M. Weigt, Direct-coupling analysis of residue coevolution captures native contacts across many protein families, Proceedings of the National Academy of Sciences 108, E1293 (December 2011).
- [105] D. S. Marks, L. J. Colwell, R. Sheridan, T. A. Hopf, A. Pagnani, R. Zecchina and C. Sander, Protein 3d Structure Computed from Evolutionary Sequence Variation, PLOS ONE 6, p. e28766 (December 2011).
- [106] N. Halabi, O. Rivoire, S. Leibler and R. Ranganathan, Protein sectors: evolutionary units of three-dimensional structure., Cell 138, 774 (aug 2009).
- [107] O. Rivoire, Elements of coevolution in biological sequences, Physical Review Letters 110, 1 (2013).
- [108] S. Cocco, R. Monasson and M. Weigt, From Principal Component to Direct Coupling Analysis of Coevolution in Proteins: Low-Eigenvalue Modes are Needed for Structure Prediction, PLoS Computational Biology 9 (2013).
- [109] R. M. Adams, J. B. Kinney, T. Mora and A. M. Walczak, Measuring the sequence-affinity landscape of antibodies with massively parallel titration curves, Elife , p. 1601.02160 (2016).
- [110] R. M. Adams, J. B. Kinney, A. M. Walczak and T. Mora, Physical epistatic landscape of antibody binding affinity, arXiv , 1 (2017).
- [111] J. D. Bloom, P. A. Romero, Z. Lu and F. H. Arnold, Neutral genetic drift can alter promiscuous protein functions, potentially aiding functional evolution, Biology Direct 2, p. 17 (2007).
- [112] S. D. Copley, Shining a light on enzyme promiscuity, Current Opinion in Structural Biology 47, 167 (December 2017).
- [113] K. Murphy, P. Travers and M. Walport, Janeway’s Immunology, 7 edition edn. (Garland Science, 2007).
- [114] M. Kuraoka, A. G. Schmidt, T. Nojima, F. Feng, A. Watanabe, D. Kitamura, S. C. Harrison, T. B. Kepler and G. Kelsoe, Complex Antigens Drive Permissive Clonal Selection in Germinal Centers, Immunity 44, 542 (2016).
- [115] H.-X. Liao, R. Lynch, T. Zhou, F. Gao, S. M. Alam, S. D. Boyd, A. Z. Fire, K. M. Roskin, C. A. Schramm, Z. Zhang, J. Zhu, L. Shapiro, N. C. S. Program, J. Becker, B. Benjamin, R. Blakesley, G. Bouffard, S. Brooks, H. Coleman, M. Dekhtyar, M. Gregory, X. Guan, J. Gupta, J. Han, A. Hargrove, S.-l. Ho, T. Johnson, R. Legaspi, S. Lovett, Q. Maduro, C. Masiello, B. Maskeri, J. McDowell, C. Montemayor, J. Mullikin, M. Park, N. Riebow, K. Schandler, B. Schmidt, C. Sison, M. Stantripop, J. Thomas, P. Thomas, M. Vemulapalli, A. Young, J. C. Mullikin, S. Gnanakaran, P. Hraber, K. Wiehe, G. Kelsoe, G. Yang, S.-M. Xia, D. C. Montefiori, R. Parks, K. E. Lloyd, R. M. Scearce, K. A. Soderberg, M. Cohen, G. Kamanga, M. K. Louder, L. M. Tran, Y. Chen, F. Cai, S. Chen, S. Moquin, X. Du, M. G. Joyce, S. Srivatsan, B. Zhang, A. Zheng, G. M. Shaw, B. H. Hahn, T. B. Kepler, B. T. M. Korber, P. D. Kwong, J. R. Mascola and B. F. Haynes, Co-evolution of a broadly neutralizing HIV-1 antibody and founder virus, Nature 496, p. 469 (April 2013).
- [116] D. D. Richman, T. Wrin, S. J. Little and C. J. Petropoulos, Rapid evolution of the neutralizing antibody response to HIV type 1 infection, Proceedings of the National Academy of Sciences 100, 4144 (April 2003).
- [117] J. A. Weinstein, N. Jiang, R. A. White, D. S. Fisher and S. R. Quake, High-throughput sequencing of the zebrafish antibody repertoire., Science (80-. ). 324, 807 (may 2009).
- [118] G. Georgiou, G. C. Ippolito, J. Beausang, C. E. Busse, H. Wardemann and S. R. Quake, The promise and challenge of high-throughput sequencing of the antibody repertoire., Nat. Biotechnol. 32, 158 (2014).
- [119] H. S. Robins, P. V. Campregher, S. K. Srivastava, A. Wacher, C. J. Turtle, O. Kahsai, S. R. Riddell, E. H. Warren and C. S. Carlson, Comprehensive assessment of T-cell receptor beta-chain diversity in alphabeta T cells., Blood 114, 4099 (nov 2009).
- [120] E. H. Warren, F. a. Matsen and J. Chou, High-throughput sequencing of B- and T-lymphocyte antigen receptors in hematology., Blood 122, 19 (2013).
- [121] A. Six, M. E. Mariotti-Ferrandiz, W. Chaara, S. Magadan, H.-P. P. Pham, M.-P. P. Lefranc, T. Mora, V. Thomas-Vaslin, A. M. Walczak, P. Boudinot, E. Mariotti-Ferrandiz, W. Chaara, S. Magadan, H.-P. P. Pham, M.-P. P. Lefranc, T. Mora, V. Thomas-Vaslin, A. M. Walczak and P. Boudinot, The past, present and future of immune repertoire biology - the rise of next-generation repertoire analysis, Front. Immunol. 4, p. 413 (jan 2013).
- [122] M. Shugay, O. V. Britanova, E. M. Merzlyak, M. a. Turchaninova, I. Z. Mamedov, T. R. Tuganbaev, D. a. Bolotin, D. B. Staroverov, E. V. Putintseva, K. Plevova, C. Linnemann, D. Shagin, S. Pospisilova, S. Lukyanov, T. N. Schumacher and D. M. Chudakov, Towards error-free profiling of immune repertoires., Nat. Methods 11, 653 (2014).
- [123] E. S. Egorov, E. M. Merzlyak, A. A. Shelenkov, O. V. Britanova, G. V. Sharonov, D. B. Staroverov, D. A. Bolotin, A. N. Davydov, E. Barsova, Y. B. Lebedev, M. Shugay and D. M. Chudakov, Quantitative Profiling of Immune Repertoires for Minor Lymphocyte Counts Using Unique Molecular Identifiers., J. Immunol. 194, 6155 (2015).
- [124] Y. Elhanati, A. Murugan, C. G. Callan, T. Mora and A. M. Walczak, Quantifying selection in immune receptor repertoires, Proc. Natl. Acad. Sci. 111, 9875 (jul 2014).
- [125] M. V. Pogorelyy, Y. Elhanati, Q. Marcou, A. L. Sycheva, E. A. Komech, V. I. Nazarov, O. V. Britanova, D. M. Chudakov, I. Z. Mamedov, Y. B. Lebedev, T. Mora and A. M. Walczak, Persisting fetal clonotypes influence the structure and overlap of adult human T cell receptor repertoires, arXiv , p. 1602.03063 (2016).
- [126] M. V. Pogorelyy, A. A. Minervina, D. M. Chudakov, I. Z. Mamedov, Y. B. Lebedev, T. Mora and A. M. Walczak, Method for identification of condition-associated public antigen receptor sequences, bioarxiv , 1 (2017).
- [127] J. M. Fonville, S. H. Wilks, S. L. James, a. Fox, M. Ventresca, M. Aban, L. Xue, T. C. Jones, N. M. H. Le, Q. T. Pham, N. D. Tran, Y. Wong, a. Mosterin, L. C. Katzelnick, D. Labonte, T. T. Le, G. van der Net, E. Skepner, C. a. Russell, T. D. Kaplan, G. F. Rimmelzwaan, N. Masurel, J. C. de Jong, a. Palache, W. E. P. Beyer, Q. M. Le, T. H. Nguyen, H. F. L. Wertheim, a. C. Hurt, a. D. M. E. Osterhaus, I. G. Barr, R. a. M. Fouchier, P. W. Horby and D. J. Smith, Antibody landscapes after influenza virus infection or vaccination., Science (New York, N.Y.) 346, 996 (nov 2014).
- [128] F. J. Poelwijk, D. J. Kiviet, D. M. Weinreich and S. J. Tans, Empirical fitness landscapes reveal accessible evolutionary paths., Nature 445, 383 (jan 2007).
- [129] A. N. McKeown, J. T. Bridgham, D. W. Anderson, M. N. Murphy, E. A. Ortlund and J. W. Thornton, Evolution of DNA Specificity in a Transcription Factor Family Produced a New Gene Regulatory Module, Cell 159, 58 (2014).
- [130] D. W. Anderson, A. N. McKeown and J. W. Thornton, Intermolecular epistasis shaped the function and evolution of an ancient transcription factor and its DNA binding sites, eLife 4, 1 (2015).
- [131] J. Jovel, J. Patterson, W. Wang, N. Hotte, S. O’Keefe, T. Mitchel, T. Perry, D. Kao, A. L. Mason, K. L. Madsen and G. K. Wong, Characterization of the gut microbiome using 16S or shotgun metagenomics, Frontiers in Microbiology 7, 1 (2016).
- [132] B. E. Wolfe, J. E. Button, M. Santarelli and R. J. Dutton, Cheese rind communities provide tractable systems for in situ and in vitro studies of microbial diversity, Cell 158, 422 (2014).
- [133] R. Mac Arthur, Species packing, and what competition minimizes, Proceedings of the National Academy of Sciences 64, 1369 (1969).
- [134] S. Azaele, S. Suweis, J. Grilli, I. Volkov, J. R. Banavar and A. Maritan, Statistical mechanics of ecological systems: Neutral theory and beyond, Reviews of Modern Physics 88, p. 035003 (July 2016).
- [135] A. Posfai, T. Taillefumier and N. S. Wingreen, Metabolic trade-offs promote diversity in a model ecosystem., Phys Rev Lett 118, p. 028103 (2017 Jan 13 2017).
- [136] J. O. Haerter, N. Mitarai and K. Sneppen, Theory of invasion extinction dynamics in minimal food webs, Phys. Rev. E 97, p. 022404 (Feb 2018).
- [137] M. Tikhonov, R. W. Leach and N. S. Wingreen, Interpreting 16s metagenomic data without clustering to achieve sub-otu resolution, The ISME journal 9, 68 (2015).
- [138] C. K. Fisher, T. Mora and A. M. Walczak, Variable habitat conditions drive species covariation in the human microbiota, PLoS Computational Biology 13, 1 (2017).
- [139] S. J. Biller, P. M. Berube, D. Lindell and S. W. Chisholm, Prochlorococcus: the structure and function of collective diversity, Nature Reviews Microbiology 13, 13 (2014).
- [140] R. Braakman, M. J. Follows and S. W. Chisholm, Metabolic evolution and the self-organization of ecosystems, Proceedings of the National Academy of Sciences 114, E3091 (2017).
- [141] G. Biroli, G. Bunin and C. Cammarota, Marginally Stable Equilibria in Critical Ecosystems, arxiv (2017).
- [142] D. A. Kessler and N. M. Shnerb, Generalized model of island biodiversity, Physical Review E 91, p. 042705 (2015).
- [143] M. J. Rosen, M. Davison, D. Bhaya and D. S. Fisher, Fine-scale diversity and extensive recombination in a quasisexual bacterial population occupying a broad niche, Science 348, 1019 (2015).
- [144] S. Gould, Wonderful life—the Burgess shale and the nature of history., 1989).
- [145] V. Orgogozo, Replaying the tape of life in the twenty-first century, Interface Focus 5, p. 20150057 (2015).
- [146] M. Lässig, V. Mustonen and A. M. Walczak, Predicting evolution, Nature Ecology & Evolution 1, p. 0077 (2017).
- [147] T. van Opijnen and A. Camilli, Transposon insertion sequencing: a new tool for systems-level analysis of microorganisms, Nature Reviews Microbiology 11, 435 (July 2013).