Asymmetry of line profiles of stellar oscillations measured by Kepler for ensembles of solar-like oscillators: impact on mode frequencies and dependence on effective temperature
Abstract
Oscillation properties are usually measured by fitting symmetric Lorentzian profiles to the power spectra of Sun-like stars. However the line profiles of solar oscillations have been observed to be asymmetrical for the Sun. The physical origin of this line asymmetry is not fully understood, although it should depend on the depth dependence of the source of wave excitation (convective turbulence) and details of the observable (velocity or intensity). For oscillations of the Sun, it has been shown that neglecting the asymmetry leads to systematic errors in the frequency determination. This could subsequently affects the results of seismic inferences of the solar internal structure. Using light curves from the Kepler spacecraft we have measured mode asymmetries in 43 stars. We confirm that neglecting the asymmetry leads to systematic errors that can exceed the confidence intervals for seismic observations longer than one year. Therefore, the application of an asymmetric Lorentzian profile is to be favoured to improve the accuracy of the internal stellar structure and stellar fundamental parameters. We also show that the asymmetry changes sign between cool Sun-like stars and hotter stars. This provides the best constraints to date on the location of the excitation sources across the Hertzsprung-Russel diagram.
Subject headings:
stars: oscillations, stars: interiors, methods: data analysis1. Introduction
Spaceborne instruments such as MOST (Walker et al., 2003), CoRoT (Baglin et al., 2006) and Kepler (Borucki et al., 2010) initiated an era of high-precision asteroseismic measurements. In particular with Kepler, the level of resolution achieved for stellar pulsation frequencies is remarkable (few tens of nano-Hertz) and has lead to a measurement precision equivalent to helioseismic measurements from a decade ago, despite the distances to these stars compared to the Sun. This has enabled us to reach unprecedented precision in the determination of both the fundamental parameters of stars (such as their mass, radius, and age) as well as their internal structure. However, many sources of systematic error remain that need to be assessed and mitigated.
Seismic inferences of stellar interiors and fundamental parameters of low-mass stars rely on pulsations frequencies measured from the power spectra of its light curve (e.g. Davies et al., 2015; Benomar et al., 2009b; Appourchaux et al., 2008, 1998; Chaplin et al., 2001). This requires fitting a model to the power spectrum, which in turn is based on a set of approximations. These approximations could be a source of systematic error on pulsation frequencies, which will impact the fundamental parameters of stars derived from stellar evolution and pulsation codes (e.g. Paxton et al., 2013; Christensen-Dalsgaard, 2008b; Morel & Lebreton, 2008; Christensen-Dalsgaard, 2008a; Scuflaire et al., 2008).
Solar-like oscillations are excited by the turbulent convection in the outermost layers of convective envelopes of low-mass stars. As a first approximation such modes can be described by stochastically damped oscillators, whose solution in the power spectrum are Lorentzian profiles (Duvall et al., 1988; Libbrecht, 1988; Kumar et al., 1988). Current pulsation analysis methods commonly assume that this approximation is accurate.
However, helioseismic observations by Duvall et al. (1993) showed that the line profiles of solar oscillations are asymmetrical. Mode line profiles observed in velocity have more power on the low-frequency side of the power maximum, while line profiles observed in intensity have more power on the high-frequency side of the power maximum.
In this framework, many studies attempted to interpret the solar mode asymmetry. It was recognised immediately that a source of wave excitation that is localised below the surface would lead to a line profile asymmetry (Duvall et al., 1993; Gabriel, 1993). A line asymmetry will result from the interference between waves coming directly from the source to the observer and waves experiencing multiple reflections inside the stellar oscillation cavity before reaching the observer. However, this theory has little predictive power as the source of wave excitation is not known in detail, and there is no universal explanation for the reversal of asymmetry between the intensity and velocity observations. The reversal of asymmetry has been attributed either to the presence of noise of convective origin that is correlated with the waves (Roxburgh & Vorontsov, 1997; Nigam et al., 1998) or to radiative transfer effects (Georgobiani et al., 2003).
It was found by Duvall et al. (1993) and Toutain et al. (1998, TT98 hereafter), that neglecting mode asymmetry leads to systematic errors in the determination of solar mode frequencies, which may subsequently leads to imperfect modeling of the Sun. This motivated several works that attempted to properly account for mode asymmetry when fitting oscillation modes in the power spectrum of the Sun (e.g. Chaplin & Appourchaux, 1999; Korzennik, 2005; Vorontsov & Jefferies, 2013).
However, while mode asymmetry is now considered as an essential ingredient to obtain an accurate measurement of mode frequencies and then an accurate modelling of the Sun, it has been neglected so far for Sun-like stars. Our objective is thus to provide the first measurements of mode asymmetry in Sun-like stars and investigate its evolution across the HR diagram. This is made possible by using the Kepler spacecraft photometric measurements (i.e. in intensity).
2. Analysis of the power spectrum with mode asymmetry
The analysis of the pulsation modes of Sun-like stars is performed in the power spectrum and uses the Bayesian statistical algorithm of Benomar et al. (2009a) with improvements and priors as defined in White et al. (2017). We recall here the main properties of the analysis and develop in more details the specifics of the mode asymmetry measurements.
2.1. Modeling of the mode asymmetry
Several parametric expressions for asymmetrical line profiles have been proposed, see e.g. Appendix A in Vorontsov & Jefferies (2013). The most commonly used asymmetrical line profile is the asymmetrical Lorentzian profile proposed by Nigam & Kosovichev (1998),
| (1) |
with . Here, the variables , and are the mode frequency, height and the full width at half maximum (simply referred to as the mode width), respectively. is the asymmetry coefficient. Note that this parametrization is only meaningful close to the resonance frequency of the modes, while our procedure involves a global fit of the power spectrum. Because of this, systematic errors may occur on the measured asymmetry parameter. To minimize these potential systematics, the Lorentzians are only calculated for, . Here, is the truncation parameter and is the rotational splitting. For a Sun-like star, this implies that the Lorentzian is only calculated on a window of width Hz, centered on the central mode frequency. This may be comparable to performing a local fit of the mode, but allows us to still account for the common information among the modes (noise background, splitting , stellar inclination, etc.). The accuracy of this approach is further discussed in section 2.2.
This asymmetry coefficient depends on the mode width, so that Gizon (2006) suggested using the dimensionless asymmetry coefficient ,
| (2) |
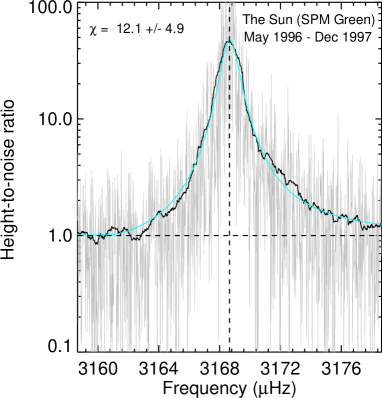
The mode asymmetry increases the power on one side of a mode, by elevating the tail of the Lorentzian. When the asymmetry is positive, the tail is raised at high frequencies and conversely for negative asymmetries. This displaces the barycentre of the mode, such that neglecting the asymmetry by fitting with a symmetric profile, introduces a bias in the determination of the central frequency of the modes. Figure 1 shows that this effect, though small, is visible in the power spectrum of the Sun. To better visualise the asymmetry in the figure, the properties of the modes are isolated by dividing out the nearby mode and the noise background. Note that current studies of mode pulsations in Sun-like stars (e.g. Appourchaux et al., 2008; Benomar et al., 2012; Davies et al., 2015; Campante et al., 2016) considered that the asymmetry is negligible, which is equivalent to fixing .
2.2. Assumption on the mode asymmetry
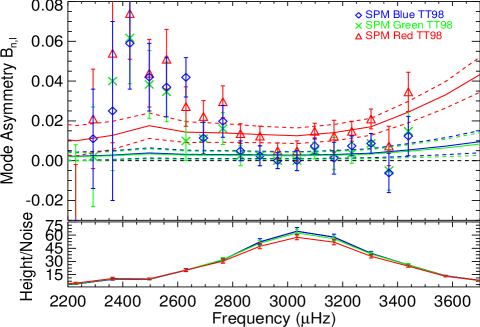
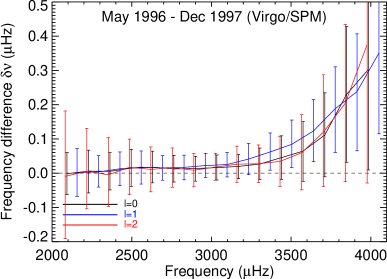
This study focuses on determining the sign and the overall significance of the mode asymmetry for an ensemble of stars, which have signal-to-noise ratio three to 20 times lower to the Sun. Therefore, in order to improve the robustness of the measurement, we need to simplify the description of the mode asymmetry. We opted for the simplest description which assumes that is constant over the range of observed modes. Figure 2 compares the results from TT98 with those from our analysis with a constant . TT98 measured the mode asymmetry and using the SPM observations of May 1996, until December 1997 for the three channels (Red, Green, Blue) of the SPM/VIRGO instrument aboard the SoHo spacecraft. Similarly to Kepler, this instrument measures oscillations in intensity. The comparison is made possible by using equation 2 to express our results in terms of . We found , and . The constant dimensionless asymmetry gives consistent asymmetry for modes with the largest height-to-noise ratio (HNR) and at high frequencies, for all the channels. However, the asymmetry for modes with frequencies between Hz and Hz (ie, two or three radial orders out of eleven, depending on the channel) is apparently underestimated. Below Hz, the large measurement errors given by TT98 prevent us from evaluating the relevance of the constant- approximation. We conclude that the measurement of the asymmetry is not accurate for low-frequency modes when assuming a constant coefficient , but this remains sufficient to evaluate the importance of the mode asymmetry across the HR diagram.
Kepler has a band pass that encompasses the three channels of the SPM instrument. Therefore to compare the solar asymmetry with Kepler measurements, we use the average asymmetry of the three SPM channels ().
In velocity measurement, such as with the GOLF instrument aboard SoHo, the mode asymmetry is negative. Although there is no clear consensus on the origin of the sign reversal between photometry and velocity (e.g. Georgobiani et al., 2003; Nigam et al., 1998), it gives the opportunity to evaluate the capacity of our pulsation modeling to measure negative asymmetry coefficients. We therefore fitted the GOLF data (PM 1) over the same period as TT98 and found . This corresponds to Hz, which is comparable to what is found in the literature (e.g. Basu & Antia, 2000).
2.3. Prior on the mode asymmetry for the MCMC analysis
It is quite a difficult task to predict the sign and the value of the asymmetry because it requires a proper modeling of the properties of the excitation mechanisms. Therefore a non-informative prior on the absolute value of should be preferred. This is justified by the necessity to provide an unbiased measure of the parameters that could be correlated with the asymmetry. For example, it is established that neglecting the asymmetry of low-degree modes introduces a systematic error in the solar mode frequencies that could be greater than the frequency precision. The induced systematic error on the inverted sound profile of the Sun’s deep layers is likely negligible (Basu & Antia, 2000). For the Sun, this justifies the use of frequencies determined by neglecting the mode asymmetry. However, the internal structure and the fundamental parameters (mass, radius, age, etc.) of other stars is not determined by inversion, but rather by a forward modeling. This is because only low degree modes are available to us. Due to the lack of measurements of the asymmetry on other stars than the Sun, the influence of such systematic errors on stellar models is so far not known.
Since the mode asymmetry is a scale parameter, the most appropriate choice of prior is the (truncated) Jeffrey’s non-informative prior (Jeffreys, 1961),
Here, is a normalisation constant. This prior is concentrated near zero so that in the absence of information about mode asymmetry in the data, the posterior distribution will be centered on zero and clearly depart from a Gaussian distribution. However, one needs to fix a value for which controls the degree of concentration near of the function, and which is required to ensure the integrability of the prior. Here we use and . Fits for variable asymmetries for different modes () in the Sun do not exceed (Toutain et al., 1998; García et al., 2011), so this choice of is conservative.
3. Data selection and preparation
In this work, the considered ensemble of stars is a subset of the Kepler LEGACY sample (Lund et al., 2017). The LEGACY sample is made of stars that have been continuously observed for more than one year and with the highest signal-to-noise ratio. To measure the mode asymmetry reliably, it is preferable to focus on stars with unambiguous mode identification. This is possible when modes of degree and modes are well separated so that there is a limited crosstalk between the modes. A significant superposition of these modes, as seen predominantly in F stars (e.g. Appourchaux et al., 2008) reduces the precision on the mode properties. Due to this limit we selected 43 stars for analysis out of 66 of the LEGACY sample. The current analysis uses the un-weighted power spectra provided by the KASOC pipeline111kasoc.phys.au.dk (Handberg & Lund, 2014).
4. Results
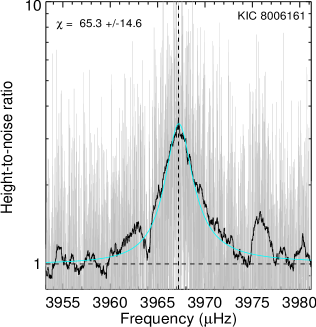
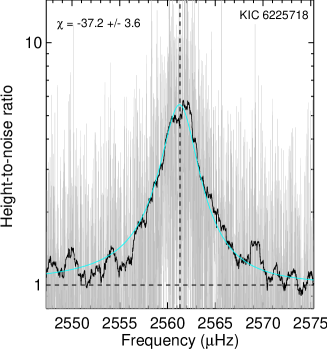
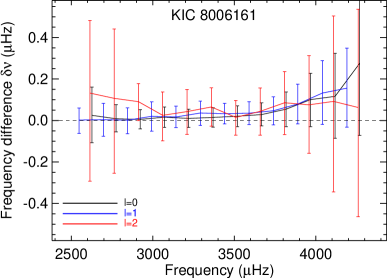
The main parameters from the fits of the 43 stars of our analysis are given in Table 1. This section discusses the main results of the analysis. Similar to the Sun, stars with the highest data quality (in terms of observation duration and signal-to-noise) have modes with clear asymmetry in the power spectrum. However, as illustrated in Figure 3 for KIC 8006161 and KIC 6225718, some stars have a positive asymmetry (elevated power in the Lorentzian tail toward high frequencies) in the power spectrum. Others show a negative asymmetry (elevated power in the tail toward lower frequency).
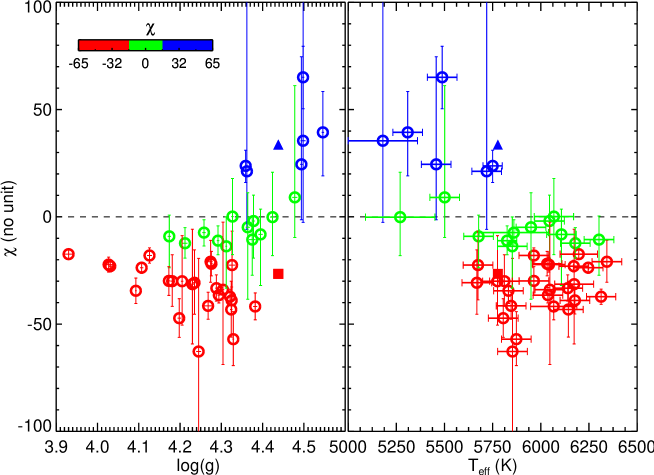
4.1. Surface gravity and temperature dependence of the asymmetry
Figure 4 shows that the mode asymmetry depends on the surface gravity and on the effective temperature . In the figure, the values are determined by stellar modeling using AMP222Asteroseismic Modeling Portal, https://amp.phys.au.dk/ (Metcalfe et al., 2009). These are listed in Creevey et al. (2017) along with spectroscopic temperature measurements compiled for multiple studies. Stars cooler than and with greater than predominantly show positive asymmetry in the Kepler photometric data. Hotter and lower gravity stars show exclusively negative asymmetry. The fact that the mode asymmetry depends on atmospheric properties of stars suggest that the mode asymmetry may change while the stars evolve.
4.2. Evolution of the asymmetry across the HR diagram
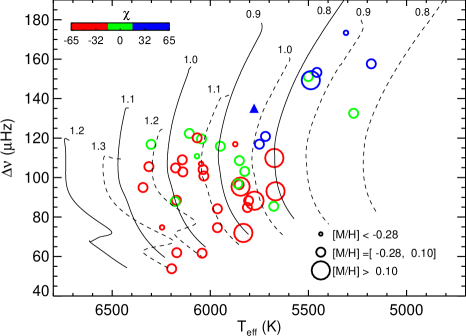
Figure 5 shows the measured asymmetry coefficient, in the plane, where is the large separation and the effective temperature. As in White et al. (2011), the figure is a modified HR-diagram where is used instead of the luminosity. The stellar metallicity is also represented. Here, we use the spectroscopic temperature and metallicity of the LEGACY stars that have been compiled from various sources by Creevey et al. (2017).The large separation is determined by a linear fit of the measured radial mode () frequencies, listed in Table 1. For example in this diagram, KIC 8006161 has an effective temperature K and Hz. Similarly, KIC 6225718 has and Hz. The figure also shows evolution tracks from the ZAMS to the TAMS for stars with masses in the range and for two metallicities and . These are representative of the observed surface metallicity of the sample, which has a non-Gaussian distribution, skewed toward low metallicity. This distribution is characterized by a median value , with most stars having metallicities333This range is computed using the confidence interval at centered on the median. between and .
Here, the dispersion in [M/H] corresponds to the range . The initial helium content is set to . Adopting another value of the initial helium content would only shifts the sequences horizontally (given the metallicity), reflecting the known mass-helium degeneracy (see for instance Lebreton & Goupil, 2014).
Evolutionary sequences of stellar models were computed with the code CESTAM (Marques et al., 2013) adapted from the original version CESAM2K (Morel, 1997; Morel & Lebreton, 2008). The input physics includes convection based on the Canuto et al. (1996) formalism (CGM) with a CGM mixing length parameter from a solar calibration; the NACRE nuclear reaction rates with the updated reaction from Imbriani et al. (2005). No convective core overshoot is added nor angular momentum transport. We adopted the AGSS09 solar mixture (Asplund et al., 2009) with the relative mass fraction metal-to-hydrogen abundance ratio and OPAL opacities (Iglesias & Rogers, 1996) completed with Alexander & Ferguson (1994) opacities as well as OPAL equation of state. Atomic diffusion is included following the formalism from Michaud & Proffitt (1993). Figure 5 shows that low temperature stars have predominantly positive asymmetry, like the Sun. However, hotter stars have negative asymmetry. Observations of stars with Hz and with K would be important to confirm this trend. Interestingly, stars with the smallest asymmetries occupy mostly a limited region that forms a band in the HR-diagram.
4.3. Systematics on pulsation frequency
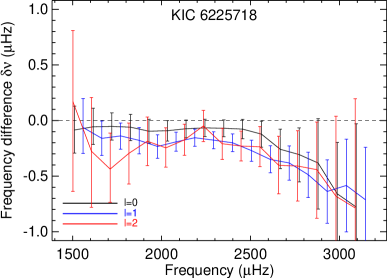
Neglecting the mode asymmetry when fitting high quality-data such as those obtained by Kepler can have a significant impact on the measured central mode frequency. Figure 6 illustrates this by showing the frequency difference, , induced by neglecting the mode asymmetry, for the Sun (3 years of observations), KIC 8006161 and KIC 6225718. Here and are the measured frequencies when neglecting and including the mode asymmetry respectively. When the asymmetry coefficient is positive (), the central frequency of the mode is often overestimated by for the best observations (see e.g. the near the frequency at maximum amplitude of KIC 8006161). Conversely, the frequency is underestimated for negative asymmetry coefficients. As shown by Eq. 2, the effective asymmetry is proportional to the mode width, so that the broader the mode, the greater the asymmetry. This translates into larger systematic errors at high frequencies, because the mode width increases approximately monotonically with frequency (e.g. Appourchaux et al., 2014). This dependence is also directly observed in the power spectrum: modes with the most obvious asymmetry are the broadest.
The effect is less pronounced on cool stars because they tend to have narrower modes. Interestingly, the mode width of Sun-like stars has a plateau around the frequency at maximum amplitude , so that the shift remains constant for modes with the highest signal-to-noise. Thus, it is evident that frequency differences such as the small separations (e.g. Roxburgh & Vorontsov, 2003) are less affected by the mode asymmetry than the frequencies themselves. An important implication is that stellar modeling relying on frequency differences might be less biased than methods using absolute frequencies, when frequencies are measured assuming a symmetric Lorentzian. One can argue that the biases introduced by neglecting the mode asymmetries are included in the ad-hoc corrections of surface effects. However, it leads to mix of the observational biases (due to the symmetric Lorentzian profile) together with theoretical uncertainties related to the poor description of the upper-most layers of stars. This is something to avoid because surface effects should be used as a seismic constraint to improve the physical description of the upper layers of stars (i.e. with a complete description of 3D convection processes near the surface). Consequently, it is fundamental to infer not only precise but also accurate observed frequencies.
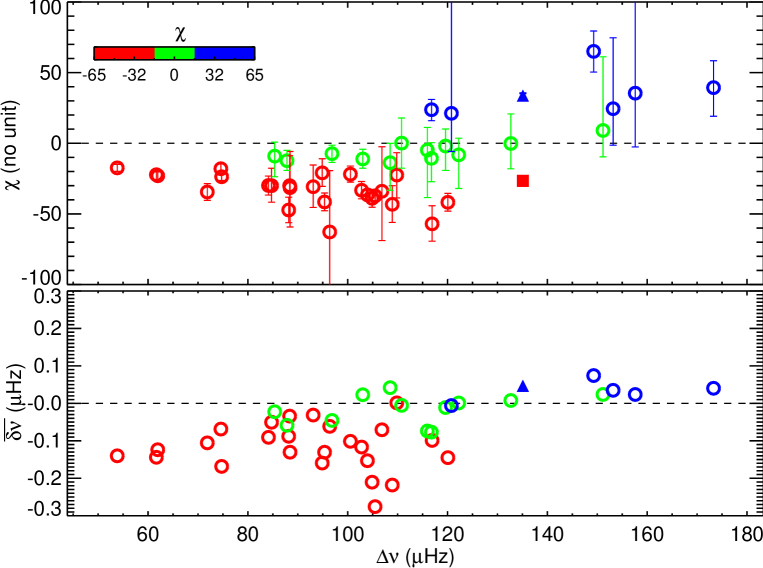
Figure 7 shows the asymmetry coefficient and the average frequency shift as a function of the large separation . The asymmetry slowly changes sign at Hz. Below this value, , while for higher . As suggested by Figure 6, neglecting the asymmetry leads to an overall frequency shift twice as large as for stars with negative asymmetry compared to those with positive asymmetry. This is due to the fact that the population with negative asymmetry is dominated by hotter stars, which tend to have larger mode widths.
| KIC | ||||||||||||||||
|---|---|---|---|---|---|---|---|---|---|---|---|---|---|---|---|---|
| 003427720 | 0 | 1969.7828 | 0.1858 | 0.1858 | 0.83 | 0.28 | 0.49 | 0.64 | 0.17 | 0.20 | -2.0 | 17.3 | 12.1 | 0.0056 | 0.1793 | 0.1742 |
| 003427720 | 0 | 2088.7509 | 0.3783 | 0.2904 | 1.32 | 0.35 | 0.36 | 0.52 | 0.11 | 0.16 | -2.0 | 17.3 | 12.1 | 0.0691 | 0.2935 | 0.2537 |
| … | … | … | … | … | .. | … | … | … | … | … | … | … | … | … | … | … |
| 008006161 | 1 | 3739.7472 | 0.0692 | 0.0674 | 1.64 | 0.06 | 0.06 | 1.70 | 0.10 | 0.11 | 65.3 | 14.7 | 14.4 | 0.0470 | 0.0684 | 0.0672 |
| 008006161 | 1 | 3889.3512 | 0.0984 | 0.0984 | 2.31 | 0.10 | 0.10 | 0.99 | 0.06 | 0.06 | 65.3 | 14.7 | 14.4 | 0.0794 | 0.0962 | 0.0956 |
| … | … | … | … | … | .. | … | … | … | … | … | … | … | … | … | … | … |
| 012258514 | 2 | 1998.6247 | 2.9698 | 2.4190 | 5.53 | 0.71 | 0.75 | 0.02 | 0.00 | 0.00 | -18.0 | 3.6 | 3.5 | -0.0446 | 2.7716 | 2.3108 |
5. Conclusion and discussion
Sun-like stars have stochastically excited modes whose properties (central frequency, width, amplitude) are usually measured by fitting symmetric Lorentzian profiles to the power spectrum. However, solar observations by Duvall et al. (1993) showed that mode profiles are better represented by an asymmetric Lorentzian. The origin of the asymmetry is commonly interpreted as mainly being due to the interference of waves produced at the source of the excitation with reflected waves arriving at the source once again (Abrams & Kumar, 1996).
We measured the mode asymmetry for 43 stars observed by Kepler and showed that it is not negligible in most of them. The mode asymmetry is found to gradually change sign as a function of the large separation. Actually, stars with similar effective temperature and mass as the Sun show predominantly a positive asymmetry, indicating that the modes have an excess of energy at high frequency. However, hotter and more massive stars have negative asymmetry (excess of power at low frequency).
The mode asymmetry significantly affects measurements of the central mode frequencies. The effect is small but exceeds uncertainties for the best observations. Particular care must therefore be taken when determining fundamental stellar parameters (mass, metallicity, etc.) when pulsation frequencies are measured assuming symmetric Lorentzian profiles. The parameter space is larger when considering the mode asymmetry, which may decrease the robustness of the fit. Neglecting the mode asymmetry could therefore be justified for short, low-quality observation, but not for long-term observations. Indeed, frequency shifts due to the mode asymmetry is measured even for one year Kepler time series. In long-term observations such as those provided by Kepler, the precision on frequencies derived with or without accounting for the constant mode asymmetry are the same. However, including the asymmetry improves the accuracy on the frequencies, so that it might be better to always account for it.
The reversal of line profile asymmetry that we have measured is a potentially important diagnostic for the study of the driving mechanism of solar-like oscillations and thus for the study of convection in Sun-like stars. Improvements in models of p-mode line profiles will be required to fully understand the solar observations, and to extend the range of validity of the theory to stars with different effective temperatures and surface gravities.
References
- Abrams & Kumar (1996) Abrams, D., & Kumar, P. 1996, ApJ, 472, 882
- Alexander & Ferguson (1994) Alexander, D. R., & Ferguson, J. W. 1994, ApJ, 437, 879
- Appourchaux et al. (1998) Appourchaux, T., Gizon, L., & Rabello-Soares, M.-C. 1998, A&AS, 132, 107
- Appourchaux et al. (2008) Appourchaux, T., et al. 2008, A&A, 488, 705
- Appourchaux et al. (2014) —. 2014, A&A, 566, A20
- Asplund et al. (2009) Asplund, M., Grevesse, N., Sauval, A. J., & Scott, P. 2009, ARA&A, 47, 481
- Baglin et al. (2006) Baglin, A., Auvergne, M., Barge, P., Deleuil, M., Catala, C., Michel, E., Weiss, W., & COROT Team. 2006, in ESA Special Publication, Vol. 1306, ESA Special Publication, ed. M. Fridlund, A. Baglin, J. Lochard, & L. Conroy, 33
- Basu & Antia (2000) Basu, S., & Antia, H. M. 2000, ApJ, 531, 1088
- Benomar et al. (2009a) Benomar, O., Appourchaux, T., & Baudin, F. 2009a, A&A, 506, 15
- Benomar et al. (2012) Benomar, O., Baudin, F., Chaplin, W. J., Elsworth, Y., & Appourchaux, T. 2012, MNRAS, 420, 2178
- Benomar et al. (2009b) Benomar, O., et al. 2009b, A&A, 507, L13
- Borucki et al. (2010) Borucki, W. J., et al. 2010, Science, 327, 977
- Campante et al. (2016) Campante, T. L., et al. 2016, ApJ, 819, 85
- Canuto et al. (1996) Canuto, V. M., Goldman, I., & Mazzitelli, I. 1996, ApJ, 473, 550
- Chaplin & Appourchaux (1999) Chaplin, W. J., & Appourchaux, T. 1999, MNRAS, 309, 761
- Chaplin et al. (2001) Chaplin, W. J., Elsworth, Y., Isaak, G. R., Marchenkov, K. I., Miller, B. A., & New, R. 2001, MNRAS, 327, 1127
- Christensen-Dalsgaard (2008a) Christensen-Dalsgaard, J. 2008a, Ap&SS, 316, 113
- Christensen-Dalsgaard (2008b) —. 2008b, Ap&SS, 316, 13
- Creevey et al. (2017) Creevey, O. L., et al. 2017, A&A, 601, A67
- Davies et al. (2015) Davies, G. R., et al. 2015, MNRAS, 446, 2959
- Duvall et al. (1988) Duvall, Jr., T. L., Harvey, J. W., & Pomerantz, M. A. 1988, in IAU Symposium, Vol. 123, Advances in Helio- and Asteroseismology, ed. J. Christensen-Dalsgaard & S. Frandsen, 37
- Duvall et al. (1993) Duvall, Jr., T. L., Jefferies, S. M., Harvey, J. W., Osaki, Y., & Pomerantz, M. A. 1993, ApJ, 410, 829
- Gabriel (1993) Gabriel, M. 1993, A&A, 274, 935
- García et al. (2011) García, R. A., Salabert, D., Ballot, J., Sato, K., Mathur, S., & Jiménez, A. 2011, Journal of Physics Conference Series, 271, 012049
- Georgobiani et al. (2003) Georgobiani, D., Stein, R. F., & Nordlund, Å. 2003, ApJ, 596, 698
- Gizon (2006) Gizon, L. 2006, Central European Astrophysical Bulletin, 30, 1
- Handberg & Lund (2014) Handberg, R., & Lund, M. N. 2014, MNRAS, 445, 2698
- Iglesias & Rogers (1996) Iglesias, C. A., & Rogers, F. J. 1996, ApJ, 464, 943
- Imbriani et al. (2005) Imbriani, G., et al. 2005, European Physical Journal A, 25, 455
- Jeffreys (1961) Jeffreys, H. 1961, Theory of Probability, 3rd edn. (Oxford, England: Oxford)
- Korzennik (2005) Korzennik, S. G. 2005, ApJ, 626, 585
- Kumar et al. (1988) Kumar, P., Franklin, J., & Goldreich, P. 1988, ApJ, 328, 879
- Lebreton & Goupil (2014) Lebreton, Y., & Goupil, M. J. 2014, A&A, 569, A21
- Libbrecht (1988) Libbrecht, K. G. 1988, ApJ, 334, 510
- Lund et al. (2017) Lund, M. N., et al. 2017, ApJ, 835, 172
- Marques et al. (2013) Marques, J. P., et al. 2013, A&A, 549, A74
- Metcalfe et al. (2009) Metcalfe, T. S., Creevey, O. L., & Christensen-Dalsgaard, J. 2009, ApJ, 699, 373
- Michaud & Proffitt (1993) Michaud, G., & Proffitt, C. R. 1993, in Astronomical Society of the Pacific Conference Series, Vol. 40, IAU Colloq. 137: Inside the Stars, ed. W. W. Weiss & A. Baglin, 246–259
- Morel (1997) Morel, P. 1997, A&AS, 124, 597
- Morel & Lebreton (2008) Morel, P., & Lebreton, Y. 2008, Ap&SS, 316, 61
- Nigam & Kosovichev (1998) Nigam, R., & Kosovichev, A. G. 1998, ApJ, 505, L51
- Nigam et al. (1998) Nigam, R., Kosovichev, A. G., Scherrer, P. H., & Schou, J. 1998, ApJ, 495, L115
- Paxton et al. (2013) Paxton, B., et al. 2013, ApJS, 208, 4
- Roxburgh & Vorontsov (1997) Roxburgh, I. W., & Vorontsov, S. V. 1997, MNRAS, 292, L33
- Roxburgh & Vorontsov (2003) —. 2003, A&A, 411, 215
- Scuflaire et al. (2008) Scuflaire, R., Montalbán, J., Théado, S., Bourge, P.-O., Miglio, A., Godart, M., Thoul, A., & Noels, A. 2008, Ap&SS, 316, 149
- Toutain et al. (1998) Toutain, T., Appourchaux, T., Frohlich, C., Kosovichev, A., Rakesh, N., & Scherrer, P. 1998, in ESA Special Publication, Vol. 418, Structure and Dynamics of the Interior of the Sun and Sun-like Stars, ed. S. Korzennik, 973
- Vorontsov & Jefferies (2013) Vorontsov, S. V., & Jefferies, S. M. 2013, ApJ, 778, 75
- Walker et al. (2003) Walker, G., et al. 2003, PASP, 115, 1023
- White et al. (2011) White, T. R., et al. 2011, ApJ, 742, L3
- White et al. (2017) —. 2017, A&A, 601, A82