Gravitational wave sources from inspiralling globular clusters in the Galactic Centre and similar environments
Abstract
We model the inspiral of globular clusters (GCs) towards a galactic nucleus harboring a supermassive black hole (SMBH), a leading scenario for the formation of nuclear star clusters. We consider the case of GCs containing either an intermediate-mass black hole (IMBH) or a population of stellar mass black holes (BHs), and study the formation of gravitational wave (GW) sources. We perform direct summation -body simulations of the infall of GCs with different orbital eccentricities in the live background of a galaxy with either a shallow or steep density profile. We find that the GC acts as an efficient carrier for the IMBH, facilitating the formation of a bound pair. The hardening and evolution of the binary depends sensitively on the galaxy’s density profile. If the host galaxy has a shallow profile the hardening is too slow to allow for coalescence within a Hubble time, unless the initial cluster orbit is highly eccentric. If the galaxy hosts a nuclear star cluster, the hardening leads to coalescence by emission of GWs within Gyr. In this case, we find a IMBH-SMBH merger rate of yr. If the GC hosts a population of stellar BHs, these are deposited close enough to the SMBH to form extreme-mass-ratio-inspirals with a merger rate of yr. Finally, the SMBH tidal field can boost the coalescence of stellar black hole binaries delivered from the infalling GCs. The merger rate for this merging channel is yr.
keywords:
black hole physics. galaxies: nuclei. galaxies: star clusters: general. Galaxy: centre.1 Introduction
It is now well established that the majority of galaxies - possibly with the exception of very low mass galaxies and dwarf irregulars - harbour supermassive black holes (SMBHs) at their centres, and their presence is expected to be ubiquitous in massive galaxies (e.g. Ferrarese & Ford, 2005). Similarly, there is strong evidence for the existence of dense stellar nuclei, usually referred to as nuclear star clusters (NSCs) (Côté et al., 2006; Neumayer, 2012; Turner et al., 2012; Georgiev & Böker, 2014). With effective radii of a few parsecs they are similar in size to galactic globular clusters (GCs) but significantly more massive . They are among the densest known stellar systems in the Universe, which makes them ideal locations for stellar dynamical encounters and nurseries of gravitational waves (GWs) sources. Like SMBHs, NSCs obey scaling relations with the properties of their hosts, including galaxy mass and stellar velocity dispersion (e.g. Graham, 2007).
While SMBHs and NSCs are found in galaxies of different type, there is evidence for SMBHs to be found predominantly above a threshold stellar mass of about , with NSCs found preferentially below such limit (Scott & Graham, 2013). However, the two are not mutually exclusive and have been observed to coexist in at least a dozen galaxies with stellar masses ranging from to (Graham & Spitler, 2009; Georgiev et al., 2016; Capuzzo-Dolcetta & Tosta e Melo, 2017). The Milky Way is one such case: it hosts a central SMBH with mass (Schödel et al., 2007; Ghez et al., 2008; Gillessen et al., 2009) and a massive NSC, with a mass (Schödel et al., 2014; Gallego-Cano et al., 2017; Schödel et al., 2017). SMBHs and NSCs are often referred to as compact massive objects (CMOs).
The transition from NSC to SMBH dominated galaxies is likely a consequence of their formation histories. Evidence for different formation histories is provided by the shallower slope observed in the relation between CMO mass and stellar velocity dispersion of NSCs with respect to SMBHs (Leigh et al., 2012; Scott & Graham, 2013; Arca-Sedda & Capuzzo-Dolcetta, 2014b).
A leading scenario for the formation of NSCs is the dry-merger scenario, according to which NSCs form by migration and merger of a population of GCs that inspiral from large galactocentric distances due to dynamical friction (Tremaine et al., 1975; Capuzzo-Dolcetta, 1993). Theoretical arguments and numerical simulations show that the scenario well reproduces the observed scaling relations of NSCs (Antonini, 2013; Gnedin et al., 2014; Arca-Sedda & Capuzzo-Dolcetta, 2014b).
The main observational properties of the Milky Way NSC can be successfully reproduced through this formation mechanism, as widely shown by numerical simulations (Antonini et al., 2012; Tsatsi et al., 2017), although a contribution from in-situ star formation cannot be completely ruled out (Baumgardt et al., 2018). Moreover, the dry-merger scenario provides a suitable explanation for the intense flux of rays coming from the Galactic Centre, which would be due to millisecond pulsars delivered by the infalling clusters (Brandt & Kocsis, 2015; Abbate et al., 2018; Fragione et al., 2018; Arca-Sedda et al., 2017), and the Galactic central X-ray excess, which would be due to cataclysmic variables (Arca-Sedda et al., 2017).
The dry-merger scenario has interesting consequences for the evolution of dwarf galaxies, possibly connecting with the evolution of their dark matter content and the missing formation of SMBHs in these low-mass systems (Arca-Sedda & Capuzzo-Dolcetta, 2016, 2017b).
The buildup of a NSC is possible even in nuclei with a pre-existing SMBH (Antonini et al., 2012; Arca-Sedda et al., 2015), though in this case tidal disruption of the clusters leads to lower density NSCs and possibly explains the lack of NSCs in galaxies with SMBHs more massive than (Antonini, 2013; Arca-Sedda et al., 2016). In addition, in giant elliptical galaxies the inspiral time-scale for the clusters may be too long to allow for the formation of a NSC (Antonini, 2013; Arca-Sedda et al., 2016; Arca-Sedda & Capuzzo-Dolcetta, 2017a).
Internal evolution of the GC, driven by the interplay of dynamics and stellar evolution, may lead to mass segregation as the GC migrates towards the galactic centre. As a result, the most massive stars segregate to the centre and form a dense massive stellar system (MSS), likely dominated by the presence of stellar mass black holes (BHs) and other heavy remnants (Freitag et al., 2006; Arca-Sedda, 2016). As recently discussed by Arca Sedda et al. (2018), MSSs can survive up to 12 Gyr, leaving an observable fingerprint on their parent cluster. Using the correlations connecting the MSS and the corresponding GC properties, Askar et al. (2018) have shown that at least 29 Galactic GCs can contain at their centre a noticeable MSS, comprised of 10-200 BHs with average masses of .
In dense and compact clusters mass segregation may initiate a phase of runaway collisions among stars and binaries that eventually lead to the formation of an intermediate-mass black hole (IMBH) (Portegies Zwart & McMillan, 2002; Freitag et al., 2006; Gaburov et al., 2008; Giersz et al., 2015) or a very massive star (VMS) (Freitag et al., 2006; Mapelli, 2016).
As suggested by Giersz et al. (2015), the IMBH assembly can occur through either a fast or slow process. According to the “FAST” scenario, the BH population forms a very dense subsystem in which collisions between single and binary BHs are greatly enhanced, leading rapidly to the formation of an IMBH seed. Anisotropic GW emission can result in significant recoil velocities for the IMBH which may be ejected from the cluster as a result, at least for IMBH masses (Holley-Bockelmann et al., 2008; Fragione et al., 2017).
In the “SLOW” formation process, the cluster density is much lower () and BHs are mostly ejected in binary-binary and binary-single interactions, while BH-BH mergers are strongly suppressed. In this case, the few-body interactions result in the ejection of all BHs but one, which starts growing slowly through repeated mergers with surrounding stars. In this case, the IMBH that forms is likely to be retained in the cluster. The SLOW process seems to have a higher probability than the FAST process (Giersz et al., 2015), however we caution that the formation channel strongly depends on the initial cluster properties.
However, Petts & Gualandris (2017) show that the collapse of a VMS into an IMBH can be prevented by strong stellar winds. If the time-scale for the formation of an IMBH or VMS is shorter than the inspiral time-scale of the cluster, the massive object will be deposited close to the SMBH.
Such interactions are particularly interesting in the context of GWs emission (e.g. Baumgardt et al., 2006; Mapelli et al., 2012), especially in light of the recent detections of black hole (Abbott et al., 2016, 2016a, 2016b; Abbott et al., 2017a, b) and neutron star (Abbott et al., 2017c, d, e) mergers by the LIGO experiment, and the recent success of the LISA Pathfinder testing mission whose results have validated beyond expectations the feasibility of LISA’s detection principle (Amaro-Seoane et al., 2013).
In this study, we model the orbital evolution of a GC inspiralling towards the centre of a host galaxy with a central SMBH. Earlier studies suggest that if all the GCs that contributed to the formation of the Milky Way nuclear cluster delivered an IMBH to the Galactic Centre, they should have given rise to well detectable kinematical signatures (Mastrobuono-Battisti et al., 2014). On the another hand, the dynamical formation of IMBHs in GCs seems to have low efficiency, with a “success” probability of (Giersz et al., 2015).
In our Milky Way, NSC formation likely resulted from the rapid merger of a few massive clusters, either formed in the inner galactic bulge () or segregated from larger distances due to dynamical friction. As shown by Arca-Sedda et al. (2015), star clusters with masses below are strongly affected by the tidal forces of a SMBH with mass even though they formed in the galactic nucleus, and contribute little to the NSC formation. As a consequence, the typical number of clusters expected to contribute to the NSC formation in a Milky Way type galaxy is (Antonini et al., 2012; Arca-Sedda & Capuzzo-Dolcetta, 2014b; Gnedin et al., 2014).
Given the IMBH formation probability, we expect that during the assembly of the NSC IMBHs were dragged to the centre in the dry merger scenario.
On the hand, as discussed above, the NSC could have formed through in-situ star formation (King, 2003, 2005; Milosavljević, 2004; Nayakshin et al., 2009). In this case, it is still possible for a GC to deliver its IMBH close to the SMBH, either during the NSC assembly or much later, depending on the GC birth location.
We consider GCs harboring either an IMBH or a BHs sub-system in the centre, and investigate the formation of GW sources, either a SMBH-IMBH binary or an extreme mass ratio inspiral (EMRI) resulting from the interaction between the SMBH and stellar BHs. We employ high-accuracy -body simulations of the GC inspiral in a live galaxy background, varying the CMO mass, GC orbit and galaxy properties. We find that the late evolution of the IMBH-SMBH binary depends strongly on the environment in which it lives. Indeed, the interaction with galactic stars and the GC stellar debris can drive the binary towards coalescence on time-scales of Gyr. The IMBH-SMBH shrinkage is maximized for GCs moving on highly eccentric orbits and galactic nuclei with a high central density. On the another hand, in the case in which the GC delivers stellar BHs to the galactic centre (both single and in binaries), we find a non-negligible merger rate in terms of EMRIs () and black hole binaries (BHBs) () coalescence.
The paper is organized as follows: in Sect. 2 we discuss the adopted models for the GC and the galaxy as well as the numerical methods; in Sect. 3 we introduce our results, discussing the impact of a GC CMO on the overall evolution of the GC and the galactic nucleus; Sect. 4 is devoted to discuss the subsequent evolution of the binary system composed by the IMBH and the SMBH, and the evolution of a population of stellar BHs around the SMBH. Finally, in Sect. 5 we present our conclusions.
2 Method
In order to study the possible formation of GW sources during the inspiral of a GC towards the centre of its host galaxy, we perform high-accuracy direct summation -body simulations of the orbital evolution of a GC by means of HiGPUs, a highly parallel direct -body integrator implementing a 4-th order Hermite scheme with block time-steps running on Graphic Processing Units (Capuzzo-Dolcetta et al., 2013).
We consider three main sets of simulations, distinguished by the presence of either an IMBH or a population of stellar mass BHs in the infalling GC, and by the slope of the density profile of the host galaxy.
The different models reflect the fact that the time-scale of NSC formation in the dry-merger scenario is not well constrained. Indeed, the infalling GCs can either: i) form far from the galactic nucleus and slowly inspiral toward the centre, or ii) form already within the galactic nucleus and segregate rapidly. None of the above possibilities is at odds with our current knowledge of nuclear cluster formation and evolution. In fact, the MW NSC contains a large fraction of old, metal poor stars typical of the Galactic GCs. While this suggests a direct connection between infalling GCs and NSCs, it does not constrain the time of NSC formation in the lifetime of the host galaxy.
Recent observations of star-burst galaxies support the possibility that massive star clusters form within the inner of a galactic nucleus (Nguyen et al., 2014). Since the assembly of an NSC can occur within Myr of the GCs formation, i.e. while the star clusters are still dynamically evolving (Arca-Sedda et al., 2015), it is possible that the population of stellar mass BHs in the clusters is still largely unaffected by dynamics while the NSC is being built. The time-scale over which stellar BHs form and segregate to the cluster centre is dictated by the stellar evolution and dynamical friction time-scales. A star with an initial mass of evolves into a BH in Myr, and segregates toward the cluster centre on a dynamical friction time-scale (Arca-Sedda, 2016; Antonini & Rasio, 2016). This is Myr for a GC having a population of stellar BHs distributed around the cluster core (Arca-Sedda & Capuzzo-Dolcetta, 2017b). Therefore, most of the BHs will be inside their parent clusters during NSC formation, unless natal kicks are large enough to expel them at birth. The resulting NSC will be characterised by a significant population of BHs. In this case, NSC formation occurs on a time-scale much shorter than the time needed for IMBH formation (Giersz et al., 2015). This, in turn, implies that an IMBH can be brought to the galactic centre only if it is transported from a GC initially orbiting outside the galactic nucleus, characterised by a longer dynamical friction time.
On the other hand, if the clusters form outside the galactic nucleus, their orbital decay will be much slower. Thus, the time for NSC build up can become sufficiently long for an IMBH to form and bind to the SMBH while the NSC is still growing, and for the stellar BHs population to have been significantly reduced by internal dynamics.
Our models capture both the possibility that an NSC forms rapidly, and subsequently an infalling GC drags its IMBH to the centre, and that the NSC forms slowly, after an inspiral sufficiently slow to allow for IMBH formation in the cluster core. The main properties of the models are given in the first four columns of Table 1.
. Name Galaxy profile () () (pc) (pc) S shallow 1 0 29832 33 6 0.24 50 M steep 1 0 22262 45 6 0.24 50 B shallow 0 114 98713 10 6 0.24 50
We model both the globular cluster and the background galaxy as an -body system with direct summation of all gravitational forces. This approach is extremely demanding from a computational point of view and, despite the high degree of parallelism allowed by the code, we are limited to a total particle number .
Following previous numerical studies (Arca-Sedda et al., 2015, 2016), we distribute particles between the galaxy and the GC, so that , where represents the number of particles in the galaxy and represents the total number of particles in the GC. In general, for the galaxy we have , with the number of stars and the number of SMBHs. For the GC we have , where is the number of stars, is the number of IMBHs and is the number of stellar mass BHs. The particle numbers adopted in the simulations are given in Table 1 and Table 2, 3. With a stellar mass resolution of , these direct summation simulations can be considered state-of-the-art. In addition, the simultaneous interaction of heavy objects (IMBH, stellar BHs) with GC stars, galactic particles and the central SMBH makes these simulations extremely time-consuming. The runs have been performed over a time span of about 2 years, taking advantage of ASTROC9, a high-performance workstation hosting 1 RADEON HD7990 and 2 RADEON HD7970 GPUs, ASTROC15, which hosts 4 RADEON HD7970 GPUs, and ASTROC16b, hosting 4 NVIDIA GTX Titan X GPUs. Morever, the few-body models described in Section 3.2 have been carried out on the Milky Way cluster, hosted at the Heidelberg University in the framework of the SFB881 collaborative research project111http://sfb881.zah.uni-heidelberg.de/.
2.1 The galaxy model
As discussed above, the NSC formation process is quite rapid, lasting Gyr. Over this time interval, GCs segregate and accumulate into the growing nucleus, giving rise to two extreme possibilities: i) the i-th GC, containing an IMBH, reaches the galactic centre when the NSC main body is still not assembled; or ii) the GC forms farther away and arrives at late times, merging with an already fully grown NSC.
In order to capture these extremes, we provide two different galaxy models, namely model S and B, in which the galaxy is characterised by a shallow density profile and the NSC is not yet formed, and model M, in which the galaxy hosts a central NSC characterised by a fully relaxed cusp. For the sake of clarity, letter B denotes those models in which the GC hosts an MSS, while letters S and M label the cases in which an IMBH is taken into account.
The simulations with a shallow galaxy profile (S and B) assume a Dehnen mass density law (Dehnen, 1993) truncated via a hyperbolic cosine:
| (1) |
Here, represents the total galaxy mass, the model’s scale length and the inner density slope of the profile. In both models S and B, we set , and . However, while in model S we assume a truncation radius of , in model B we choose a smaller value of in order to correctly reproduce the stellar BH population against other GC stars. We verified that this choice is appropriate and does not impact the GC overall orbital evolution. A shallow density profile well describes massive elliptical galaxies (e.g. Côté et al., 2006).
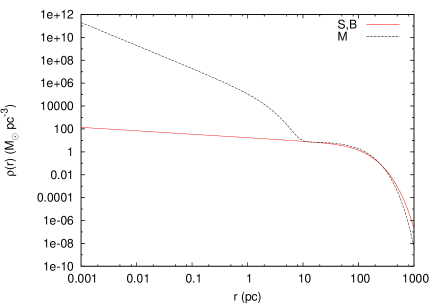
Model M, on the other hand, adopts a steeper galaxy density profile, typical for example of the Milky Way (MW) nucleus. We assume a two-components model for the MW comprised of: (i) a nuclear star cluster (NSC), extending out to about from the centre and with a density profile steeply rising towards the SMBH, and (ii) a nuclear bulge (NB), extending out to about . For the nuclear bulge, we consider a Plummer model with total mass (Valenti et al., 2016), a scale radius and a cut-off radius , thus producing a circular velocity profile in agreement with that provided by Portail et al. (2015, see their Fig.9). For the NSC we choose instead a Dehnen profile with (Schödel et al., 2014). The mass of the central SMBH is set to . This choice is consistent with both the mass of the MW central SMBH and the typical MBH expected in a galaxy of , according to observational scaling laws (Scott & Graham, 2013).
The formation of a steep cusp around the SMBH, with slope , is expected as a result of two-body relaxation, as predicted by Bahcall & Wolf (1976) (see Merritt (2013) and Alexander (2017) for a review). However, observations of the Galactic Centre fail to reveal such a cusp in the older population of observable giants (Buchholz et al., 2009; Do et al., 2009). Recent observations of the Galactic NSC show that the population of old bright giants is characterised by a distribution with slope (Gallego-Cano et al., 2017), thus shallower than the Bahcall-Wolf solution, and the population of old main sequence stars has an even shallower distribution (Schödel et al., 2017). However, the presence of compact remnants can lead to an increase in the density slope, bringing it to (Baumgardt et al., 2018). These recent studies seem to suggest that some mechanisms are at work in the Galactic Centre preventing, or delaying, the formation of a Bahcall-Wolf cusp. In these regards, our galaxy models represent two extreme cases: an almost flat distribution (models S) and a steeply cuspy distribution (models M).
The density profiles of the galaxy models are shown in Fig. 1, while the parameters of the galaxy models are given in Table 2 and Table 3.
| Name | ||||||
|---|---|---|---|---|---|---|
| () | (pc) | (pc) | () | |||
| S | ||||||
| B |
| Component | |||||
|---|---|---|---|---|---|
| () | (pc) | (pc) | () | ||
| NB | 50 | 1026313 | 45 | ||
| NSC | 4 | 50 | 45 |
-
•
In Column 5 we provide the total number of particles used to model both the NB and the NSC. Since we sampled these two components using their collective distribution function, we cannot distinguish between NB and NSC stars.
In order to generate a self-consistent model, we calculated numerically the distribution function associated with the global density profile given by the sum of the NB and NSC profiles. We then randomly sampled particles from the distribution function to produce initial conditions. This ensures that the system is stable over a time-scale comparable to its own relaxation time.
The gravitational interactions among the stars in the galaxy are smoothed via a softening length , whereas we assumed for SMBH-IMBH and SMBH-GC stars interactions, and for IMBH-GC stars interactions.
We selected three possible orbits for the GC: circular (), eccentric (), and radial (), assuming for the eccentricity the usual relation , where is the pericentre and the apocentre. All the orbits have initial apocentre .
Similarly to the case of model S, we append the letter “a” to simulations with , the letter “b” to simulations with and the letter “c” for simulations with .
2.2 The globular cluster model
We adopt a King model (King, 1966) for all simulated GCs, with central dimensionless potential , core radius and total mass . The choice of a relatively large mass is due to the fact that only massive clusters can reach the galaxy centre without being disrupted by the tidal forces exerted by the SMBH and the galactic background (see for instance Arca-Sedda et al. (2015)).
The choice of ensures that the GC King tidal radius equals the actual tidal radius, determined by the gravitational field of the SMBH and the galaxy, at the GC pericentre in eccentric models (“b models”). We decided to use only one GC model in different configurations, in order to focus on the role of the GC infall on the IMBH-SMBH binary formation. A larger core radius would imply that the GC model over-fills its Roche lobe at pericentre. This could potentially boost the GC dissolution leading to an earlier deposition of the IMBH. We note that this can have an impact on the time-scale of the IMBH-SMBH binary formation only in the “a models”, since in all the other cases the pairing occurs after the first pericentre passage. In the case of an immediate disruption of the GC, the the dynamical friction time-scale would increase by a factor (Arca-Sedda & Capuzzo-Dolcetta, 2014a). A smaller core, on the other hand, would imply an underfilling model, leading to a later tidal disruption of the GC. This would slightly reduce the IMBH-SMBH “pairing time”, while could potentially enhance the mass ejected in the eccentric orbits (Arca-Sedda et al., 2016).
It is worthy nothing the complexity of the system studied, which depends on the GC internal properties (mass, potential well, core radius), the GC orbital parameters (apocentre, eccentricity), the IMBH mass or the properties of the stellar BHs population, and the galaxy structural properties (SMBH mass, density slope, total mass and effective radius). Such a large parameter space is beyond current state-of-the-art computational capabilities, and we have therefore decided to restrict our analysis to a single GC model, leaving further exploration of the parameters to future works.
The main parameters of the GC models in the three sets of simulations are listed in Table 1.
We investigated the orbital evolution of this GC model in the live potential of the host galaxy assuming either a steep (model M) or a shallow density profile (models S and B). The GC hosts either an IMBH or a cluster of stellar mass BHs in the centre. The number of BHs in model B is chosen following Arca-Sedda (2016). Mass segregation drives the formation of a massive stellar system (MSS) composed of white dwarfs, neutron stars and black holes. The number of these objects depends on the GC mass, size and metallicity. For a relatively old, metal poor () GC characterised by a Kroupa mass function, Arca-Sedda (2016) find that the MSS mass is linked to the total GC mass through the relation
| (2) |
For , this implies , of which is due to the stellar mass BHs, . Assuming a mean mass for the BHs , we obtain . In the following, we make the simplifying assumption that all BHs are retained in the cluster and no ejections occur due to natal kicks. While this is not fully realistic, it is qualitatively supported by several recent studies (Morscher et al., 2015; Peuten et al., 2016; Weatherford et al., 2017; Arca Sedda et al., 2018).
| Name | ||
|---|---|---|
| S1a | 0.0 | |
| S1b | 0.7 | |
| S1c | 1.0 | |
| S2a | 0.0 | |
| S2b | 0.7 | |
| S2c | 1.0 |
We repeat simulation S with an IMBH mass of either (S1) or (S2). In all cases, the GC starts out at an apocentre distance of from the SMBH but we consider three values of the initial eccentricity, as illustrated in Table 4.
The choice of a BH mass of , larger than typical values found in earlier studies (see for instance Antonini, 2014), stems from the following assumptions: i) the GC has low metallicity, and ii) the maximum initial stellar mass is . Upon these choices and according to a standard Kroupa (2001) mass function, the average mass of stars that can turn into BHs, i.e. having , is , depending on the maximum stellar mass allowed. The corresponding BH mass is then , depending on the stellar evolution recipes adopted (Hurley et al., 2000; Spera et al., 2015). Our assumption for the BH population mass therefore complements earlier studies and offers a new perspective on the evolution of massive stellar BHs, also in light of the recent discovery of GWs by massive BHBs.
3 Results
We followed the evolution of all GC models in the live background of their host galaxy for a time which is at least 2.5 times longer than the time over which the GC disruption occurred. As we will discuss in detail in the next section, for circular orbits this time-scale can be very long, Myr, thus requiring huge computational resources. For eccentric and radial orbits the disruption times are much shorter, and we followed these models for 5-10 times the GC disruption time-scale.
The GCs inspiral towards the galaxy centre due to dynamical friction exerted by the background stars and deposit stars and BHs around the SMBH, leading to the formation of potential GW sources detectable by ground based interferometers such as Advanced LIGO (Abbott et al., 2016). Models containing an IMBH lead to the formation of a bound SMBH-IMBH pair, which then hardens due to encounters with stars. Such systems are potential sources of low frequency GWs detectable by upcoming space based missions such as LISA (Amaro-Seoane et al., 2007; Barausse et al., 2015) or the Chinese experiment TianQin (Luo et al., 2016).
3.1 Simulations of GCs with a central IMBH
We first consider simulations of GCs hosting a central IMBH in a shallow (model S) and steep (model M) galaxy model.
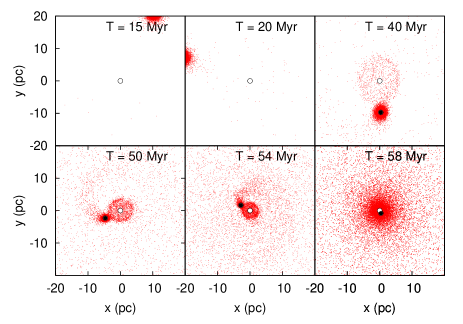
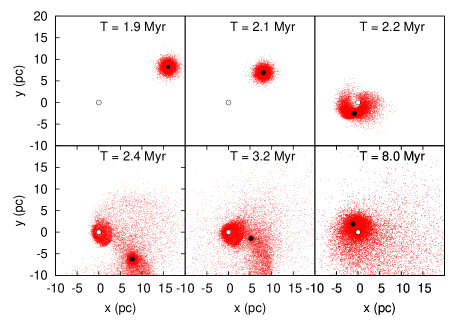
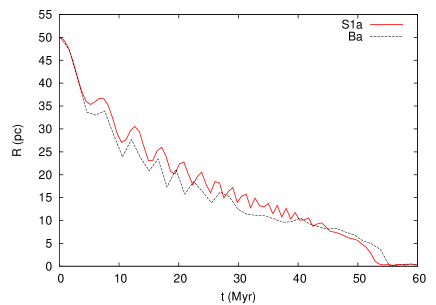
Figure 2 shows snapshots from simulations S1a and S1b, which differ only for the initial eccentricity of the orbit. We see that the evolution consists of three distinct phases. At early times, the GC inspirals towards the galaxy centre due to dynamical friction from the background stars. When the cluster starts losing stars from the Lagrangian point L1, an inner structure forms around the SMBH made of deposited GC stars. Tidal torques become efficient and lead to the formation of tidal tails and streams from the GC. Eventually, the GC can be considered disrupted and stars have been deposited around the SMBH. At the same time, stars are lost from the system through the Lagrangian point L2. The same qualitative behaviour is seen in models S1b and S1c, however the inspiral is much faster in the case of the eccentric orbit, as expected. From the snapshots, the time of GC disruption is about 50 Myr in model S1a and about 3 Myr in model S1b.
As the cluster inspirals, it loses mass due to tidal stripping. This can be seen in Fig. 3, where we show the GC mass enclosed within the cluster’s tidal radius as a function of galactocentric distance during the inspiral.
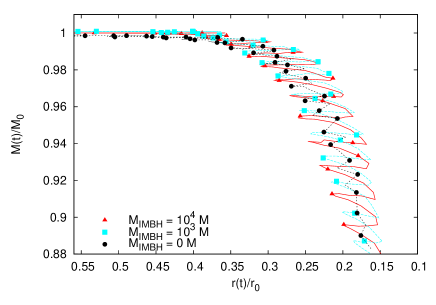
We compare simulations S1a, S2a and an additional simulation performed with no IMBH but with the same configuration. We find that the mass loss experienced by the cluster is modest and completely unaffected by the presence of an IMBH, regardless of its mass (for the mass values considered here). This is due to the fact that at early times the orbital decay is due to dynamical friction acting on the cluster as a whole, and the presence of a central IMBH does not affect this phase. As we will show, it is only after the GC is disrupted that the presence and mass of an IMBH affects the evolution of the cluster remnant.
The mass deposited by the cluster around the SMBH in the centre can be quite significant, and is well visible in the density profile of the system. Fig. 4 shows the radial density profile for model S1a at the start of the simulations and at a late time, comparing the mass density of the GC and galaxy.
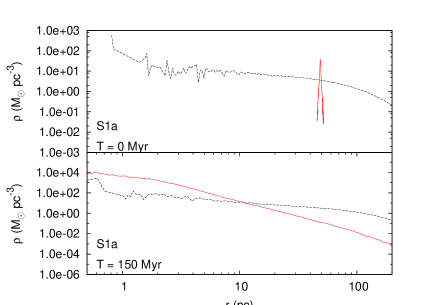
We find that the GC deposits stars along the inspiral and dominates the total mass density in the inner few parsecs at late times.
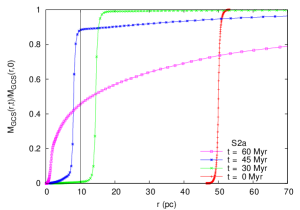
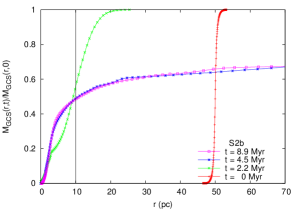
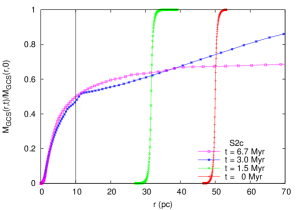
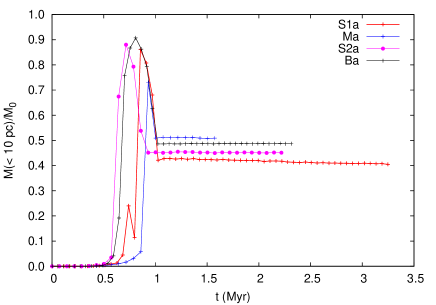
The radial mass distribution of stars in the GC is shown in Fig. 5 and 6 for models S1 and S2, where each panel refers to a different orbital eccentricity. As time progresses and the GC inspirals, more and more mass is deposited around the SMBH, but mass is also lost from the system. At late times, the mass deposited in the central of the galaxy is about of the initial GC mass, with little or no dependence on the mass of the IMBH. The initial orbital eccentricity of the cluster has some effect, with the circular orbits resulting in slightly lower () fractions of deposited mass at late times in the inspiral.
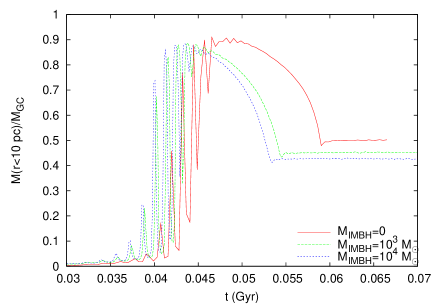
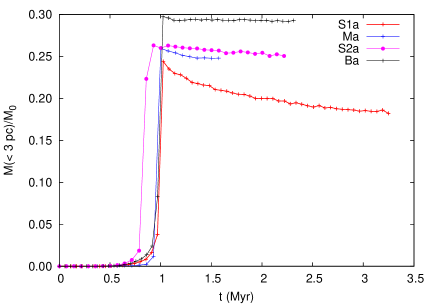
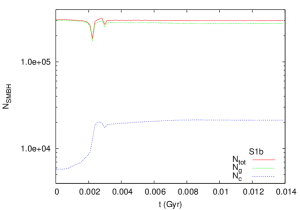
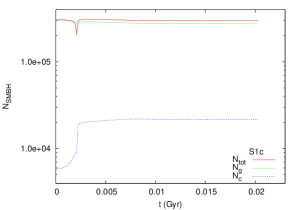
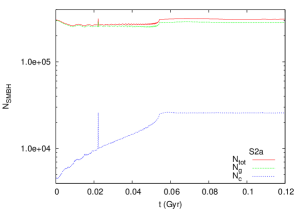
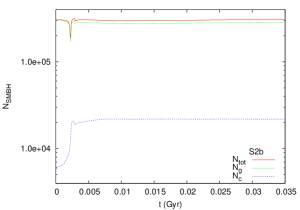
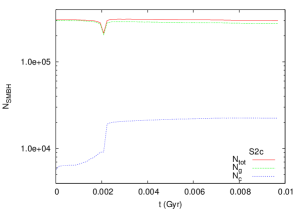
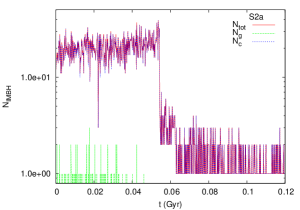
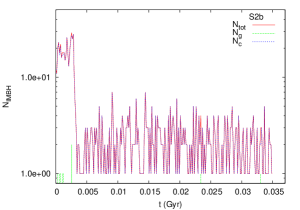
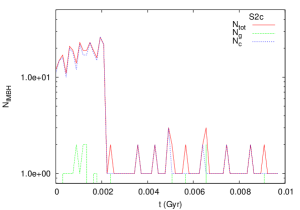
Similarly, fig. 7 shows the mass in GC stars within of the SMBH as a function of time during the inspiral for the simulations with an initial circular orbit. Initially, the enclosed mass oscillates significantly due to the motion of the GC and reaches a peak value as high as of the total GC mass. It then decreases steadily as the cluster settles in the centre, reaching values of about after Myr. This is due to the fact that, while the cluster inspirals and deposits stars around the SMBH through the Lagrangian point L1, stars are lost through the Lagrangian point L2, due to the effects of tidal forces and the presence of an IMBH (see also Fig. 2). At later times, slingshot encounters with stars become important. These are strong encounters with low angular momentum stars that typically result in the ejection of the stars to large distances, while the binary shrinks its separation. The mass in stars that can be ejected with slingshot encounters is of the order of the total mass of the binary, and is therefore higher in the case of the most massive IMBH. This likely explains the observed small dependence of the final deposited mass on IMBH mass.
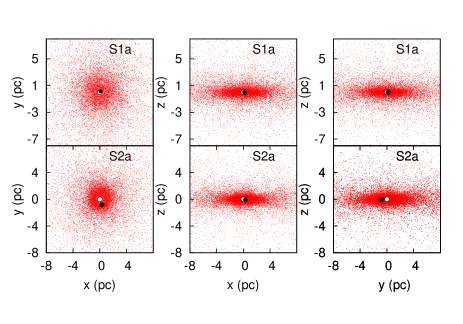
Figure 8 shows snapshots of the GC in models S1a and S2a (in all three orbital projections) at the late time of Myr. The models differ only for the mass of the IMBH. Both models appear flattened in the direction perpendicular to the orbital plane as a result of the inspiral, with a similar scale height. Model S2 appears more centrally concentrated, likely a consequence of the slingshot ejections phase. Since the amount of ejected mass is proportional to (and of the order of) the total binary black hole mass, we expect a larger mass scouring in the case of the most massive IMBH.
Mass deficits due to slingshot ejections from a SMBH-IMBH binary might have interesting implications in the context of the formation and evolution of a galactic nucleus. For instance, it has been suggested that the SMBH residing in the centre of the Milky Way is the primary component of a massive black hole binary (Hansen & Milosavljević, 2003; Merritt et al., 2009; Gualandris & Merritt, 2009). Constraints due to theoretical (Gualandris & Merritt, 2009; Gualandris et al., 2010) as well as observational arguments (Reid & Brunthaler, 2004) exclude the presence of an IMBH more massive than unless the binary separation is very small (). Model S1 suggests that the formation of a SMBH-IMBH binary following the inspiral of a GC has an efficient, disruptive action on the surrounding environment due to slingshot ejections, limiting the mass that a growing nucleus could achieve in this scenario of NSC formation. On the other hand, if we assume that NSCs originate primarily in this way, our results imply that the SMBH at the centre of the MW can’t have a companion more massive than with a small separation, unless the IMBH binds to the SMBH the NSC formation.
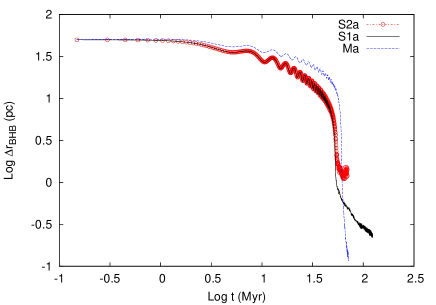
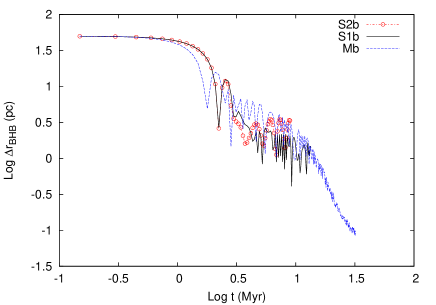
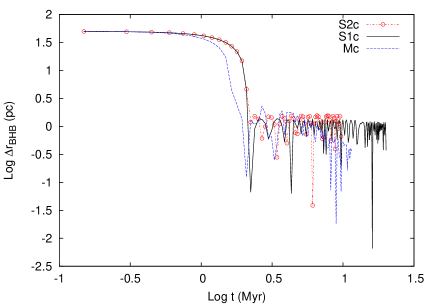
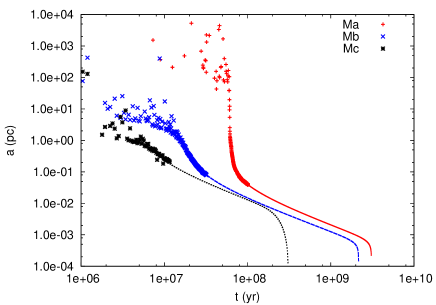
After the cluster is disrupted, dynamical friction becomes ineffective and further orbital decay of the SMBH-IMBH pair is due mainly to encounters with stars. The time of GC disruption can be seen in Fig. 9, which shows the distance between the SMBH and the IMBH as a function of time for all simulations with an IMBH. For the circular orbit simulations, the time of transition is about 50 Myr, and this markedly decreases to about 2-3 Myr for the eccentric and radial orbits, in accordance with our early estimates based on a visual inspection of the snapshots (Fig. 2).
The figure also shows the effect of the adopted galaxy model. Simulations M represent a galaxy with a steeper density profile and with a nuclear star cluster, similar to the case of the Milky Way. The early orbital decay is similar in all models. This is due to the fact that the galaxy profile in the outer region () is quite similar in both cases (see Fig. 1). The main differences arise in the innermost , where the NSC dominates the mass distribution in the M models. In the case of a circular orbit, the GC orbital decay is less efficient in the M model than in the S model. This may appear counter-intuitive, but is due to the fact that the GC and the NSC form a sort of binary system and start orbiting the common centre of mass. This effect is less pronounced in the case of the eccentric and radial orbits, due to the much faster inspiral.
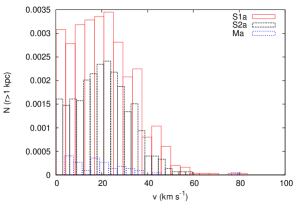
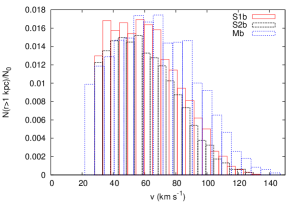
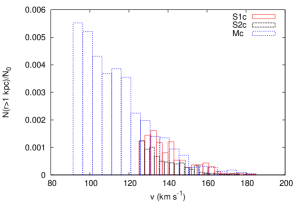
The inspiral of a GC also results in the ejection of high velocity cluster stars. This is due to a three-body interaction involving the GC, the SMBH and a star, as described in Arca-Sedda et al. (2016) and tested in Capuzzo-Dolcetta & Fragione (2015) by means of scattering experiments (but see also Fragione et al. (2017)). For SMBHs more massive than , this mechanism represents an efficient source of high velocity stars. Following Arca-Sedda et al. (2016), we computed the number of stars ejected to a distance of at least by the end of the simulation, a distance much larger than the scale length of our simulated nuclei. The velocity distribution of the GC escapers is shown in Fig. 10. We find a dependence of ejection velocity on the initial orbital eccentricity of the cluster, with more escapers produced in the eccentric models than in the circular ones. On the other hand, the radial case produces very few escapers, likely due to the very short inspiralling time. The ejection velocities do not depend on the mass of the IMBH present in the GC, as the ejection mechanism involves an interaction between a star, the SMBH and the whole GC. The number of escapers, however, is higher in the case of the most massive IMBH. After an interaction with the SMBH, a star can either be ejected promptly, be captured by the SMBH in a bound orbit or simply remain bound to the GC. In the latter case, the star can undergo further interactions with the SMBH and be ejected at a later time. A larger fraction of ejected stars is expected the more concentrated the cluster is. In our simulations, this corresponds to the cases with the most massive IMBH.
The presence of an NSC already surrounding the SMBH (M models) seems to cause a smaller number of escapers with a lower minimum velocity compared to other models. Model Mc, differently from the “a” and “b” cases, is characterised by a larger fraction of ejected stars, having velocities significantly lower than S1 and S2 escapers.
A potential additional source of escaping stars is represented by encounters with the IMBH-SMBH binary. Escapers produced by slingshot ejection can be identified based on their later ejection time.
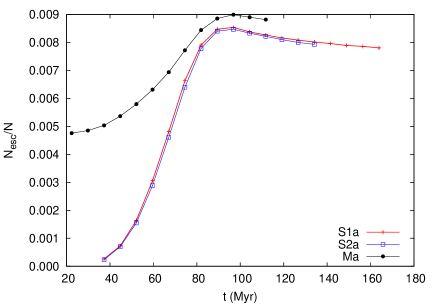
Figure 11 shows the fraction of escapers, i.e. the number of stars with a positive total energy reaching distances above 1 kpc, normalized to the total number of stars in models S1a, S2a and Ma. There is no significant difference between model S1a and S2a, suggesting that escapers are mostly produced in the 3-body interaction discussed above. The larger fraction of ejected stars in model M reflects the higher density that characterises the inner region of the galaxy in this case. As shown in Fig. 11, the combined GC+SMBH interactions lead to star ejections with velocities in the range , depending on the IMBH mass and the galaxy environment.
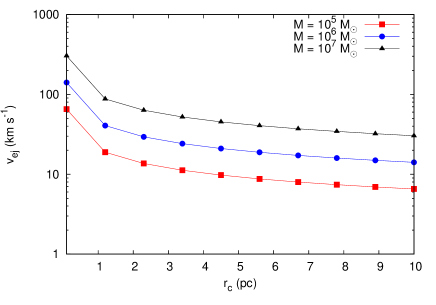
The leading scenario for the production of hypervelocity stars is the tidal breakup of stellar binaries by a SMBH, as first suggested by Hills (1988). In this scenario, a tight binary undergoes a close flyby with an SMBH, with one component of the binary being captured and the other ejected at a velocity (Hills, 1988; Bromley et al., 2006)
| (3) |
being the mass of the captured component and the mass of the ejected star. In order to be disrupted, the binary must have a pericentre smaller than the SMBH tidal radius .
A similar process can be thought to occur when infalling GCs impact on a SMBH. In this case, the binary mass can be replaced with the GC mass and the binary semi-major axis with the GC core . When the GC passes at the pericentre, it fills its Roche robe, satisfying the condition for a star to be ejected.
Figure 12 shows the ejection velocity for stars at different cluster core radii and for different GC masses, , assuming that the escaping star is orbiting at at the time of ejection. We note here that this requirement implies the maximum ejection velocity, as suggested by Arca-Sedda et al. (2016). For a SMBH and a GC core radius , the expected ejection velocity is , quite similar to the values observed in our models.
3.2 Simulations of GCs with a cluster of stellar mass black holes
We now consider the simulations in which the GC harbours a cluster of stellar mass black holes instead of an IMBH at its centre. For models B, we assume BH masses in the range distributed within the GC according to the overall density profile. Therefore, our BH population is not initially mass-segregated. Similarly to models S and M, we consider three initial orbital eccentricities for the GC, labelled with the letter “a” (circular), the letter “b” (eccentric) and the letter “c” (radial).
The inspiral of the GC in simulations with a cluster of BHs is similar to the case of a central IMBH, as illustrated in Figure 13.
However, a larger amount of mass is deposited around the SMBH in the B models (see Figure 14). This is due to the mass scouring of the SMBH-IMBH binary and subsequent ejection of stars, a feature that is absent in the B models.
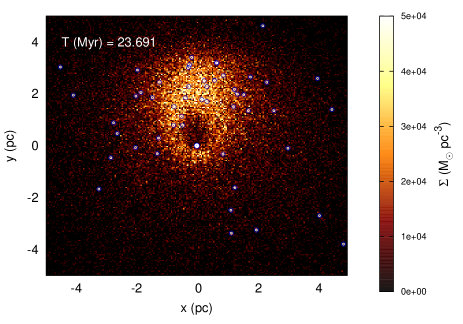
Figure 15 shows a surface density map of the GC in model Bb after a few pericentre passages, with the larger dot marking the SMBH and the smaller dots representing the stellar mass BHs. The GC debris distributes in a disc configuration that undergoes precession around the SMBH. Stars moving in the disc have orbits characterised by a pericentre and apocentre . Nearly of the stellar BHs move within the disc.
If the GC hosts a population of stellar BH binaries, these will distribute around the SMBH and possibly undergo the Lidov-Kozai mechanism, which can boost their coalescence depending on their orbital parameters (Antonini & Perets, 2012; Hoang et al., 2017).
In order to determine the probability for a stellar BHB to merge once it is left orbiting around the SMBH, we performed simulations with the ARGdf code (Arca-Sedda & Capuzzo-Dolcetta, 2017b), an updated version of the ARCHAIN code developed by Mikkola & Merritt (2008). These are “few-body” codes, suited to model the evolution of a few particles undergoing strong stellar encounters and, possibly, collision and GW emission. Our updated version allows including the effects of the galaxy gravitational field and to model in a semi-analytic way dynamical friction, a crucial feature to model the evolution of massive satellites moving in a galactic environment. These codes employ algorithmic regularization (Mikkola & Tanikawa, 1999) to allow for a high accuracy integration of the motion of particles undergoing strong interactions.
We considered stellar BHBs with initial semi-major axis in equally spaced logarithmic bins between and AU and eccentricity drawn from a thermal distribution (Jeans, 1919). The masses of the two binary components are randomly selected in the range . The initial distance of the BHB centre of mass from the SMBH is drawn randomly in the range [1-4] pc, while the eccentricity of the BHB orbit with respect to the SMBH is set equal to the GC orbital eccentricity in the case of model Bb. Finally, we varied the inclination of the BHB centre of mass with respect to the BHB-to-SMBH direction. Note that values correspond to retrograde orbits, while values correspond to prograde orbits. We performed 1000 simulations of this type with the ARGdf code, with a simulation time of 2.5 Myr, corresponding to orbits around the SMBH.

We note that none of our initial configurations has a GW time-scale smaller than yr (see Figure 16), as calculated through equation (Peters, 1964)
| (4) |
where is the binary semi-major axis, its orbital eccentricity, while and are the BHB total mass and mass ratio, respectively.
We found a probability for the stellar BHB to merge promptly, on time-scales shorter than the simulated Myr.
As shown recently in Belczynski et al. (2017), the average fraction of GCs that are expected to contribute to the NSC assembly is , provided that the total GCs initial mass is times the host galaxy mass and the average initial GC mass is (Harris et al., 2014; Webb & Leigh, 2015).
Simple stellar population models predict that the BH population represents a fraction of of the initial GC mass. Assuming a binary fraction among the BHs and a sub-fraction of binaries surviving long enough to be deposited in the proximity of the SMBH, the number of BHBs expected to orbit the SMBH in a galaxy with mass , similar to our model, is
| (5) |
If we assume that only of the initial BH population will still be in the GC during the NSC formation, i.e. , we obtain merging BHBs per galactic nucleus on a total time-scale set by the GC dynamical friction time.
For GCs contributing to the NSC formation, i.e. with apocentre smaller than , the typical dynamical friction time is Gyr (Arca-Sedda et al., 2015).
In order to calculate the rate at which BHB mergers are mediated by GC-SMBH interactions we must estimate the number density of galaxies similar to the MW. The Illustris222http://www.illustris-project.org/ cosmological simulation represents one of the most reliable model of structure formation to date, allowing to properly model the galaxy distribution at low redshift. Using the Illustris public data release (Nelson et al., 2015), we calculated the number density of galaxies with stellar masses in the range , to which the MW belongs, finding Mpc-3.
We assume that all the galaxies in this mass range host a central SMBH, and that all of them witnessed at least one GC-SMBH interaction in the past. Note that this does not require necessarily the presence of an NSC in the galaxy centre, as tidal forces can prevent its formation under certain conditions (Antonini, 2013; Arca-Sedda & Capuzzo-Dolcetta, 2014b, 2017a).
Hence, a rough estimate of the BHB merger rate for this channel can be obtained as
| (6) |
where is the BHB merger probability, is the number of decaying GCs, is the number density of galaxies in the local universe and is the dynamical friction time-scale.
GCs lose most of their BHBs on a Gyr time-scale. However, as we have shown above, by this time GCs born closer to the galactic centre will have already orbitally segregated, thus producing a larger parameter. In the most optimistic case in which of the whole BH population is in a binary and is brought to the GC before ejection, .
Substituting Eq. 5 into Eq. 7 and considering both an optimistic scenario for which and a pessimistic one for which , we find a merger rate
| (7) |
Similar estimates have been recently provided for globular clusters ( yr, Rodriguez et al. (2015, 2016); Askar et al. (2017)), young massive clusters ( yr, Banerjee (2017, 2018); Mapelli (2016)), nuclear clusters ( yr, Antonini & Rasio (2016); Hoang et al. (2017) and around SMBH in massive ellipticals ( yr, Arca-Sedda & Capuzzo-Dolcetta (2017b)).
All these different channels show that BHBs delivery by infalling GCs can have a significant role in the production of GWs detectable by the LIGO/VIRGO experiments.
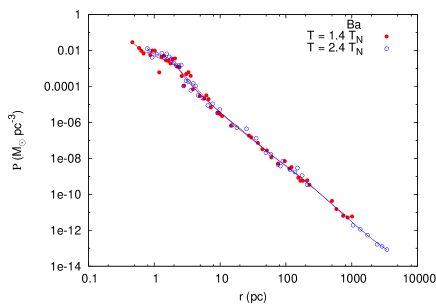
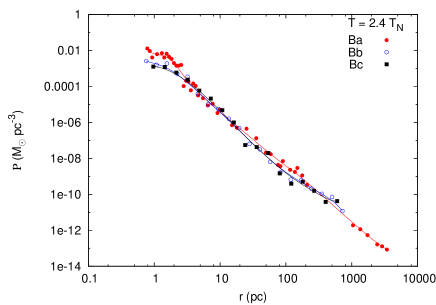
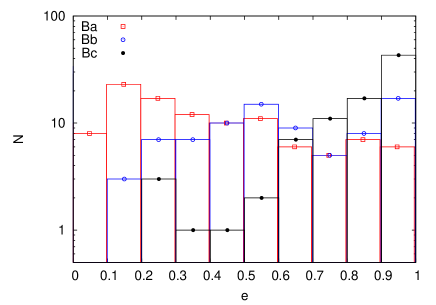
After cluster inspiral the BH population distributes around the SMBH following a density profile that scales approximately as , independently of the GC orbit, as shown in Figure 17. The distribution weakly varies after the GC disruption. In model Ba the BHs density profile is characterised by a small core, extending out to , with an scaling on larger scales. In models Bb and Bc, instead, the central density is lower and flattens beyond . However, we caution that this feature may be a result of the low number of objects in the innermost regions.
During the evolution, BHs can either be captured and become bound to the SMBH or become unbound. Figure 18 shows the number of BHs bound and unbound to the SMBH as a function of time in models with different initial orbital eccentricity. Unbound BHs are selected as those BHs that are unbound to the SMBH and have reached a distance of . We find that during the early, dynamical friction dominated, phase of the inspiral, the number of bound BHs increases rapidly in all models, though this effect is more visible in model Ba which is characterised by a longer inspiral time. There is then a short but efficient phase of further capture of BHs by the SMBH, which terminates roughly at the time of cluster disruption. By this time, the fraction of bound BHs is quite high, going from about for the radial and eccentric case to about for the circular case. After cluster disruption, the number of bound BHs remains unchanged. It is at or after this time, however, that some BHs acquire sufficient velocities to become unbound and escape.


Ejected BHs can reach distances of or more in Myr, depending on the model, though this is rare and limited to a small number of objects. Potentially more interesting is the minimum distance from the SMBH attained by the BHs over the inspiral. This ranges from about for model Ba to about for model Bc. We will discuss the possibility of capture by the SMBH in the next section.
Our results are in good agreement with Antonini (2014), who model the evolution of stellar BHs delivered by infalling star clusters around an SMBH. Despite a similar numerical setup, there are important differences in the two sets of simulations. The galaxy models used by Antonini (2014) are much steeper and concentrated than our B models, which are aimed to represent the MW centre before the formation of the NSC. While Antonini (2014) consider only GCs moving on circular orbits with small initial radius (), we set a larger initial apocentre () and allow for three different values of the GC’s orbital eccentricity (). The number of BHs in the clusters is also smaller in our case. While is not trivial to predict the effect of such different initial conditions, we expect that allowing for non-circular orbits can lead to the ejection of some BHs by the slingshot mechanism (Arca-Sedda et al., 2016; Capuzzo-Dolcetta & Fragione, 2015), thus reducing the number of BHs that bind to the SMBH and leading to an expansion of the the BHs half-mass radius. The fact that our GCs move on a wider orbit and contain an initially unsegregated population of BHs can increase the effect of mass loss and, consequently, increase the possibility that some BHs are tidally lost along the inspiral.
4 Gravitational wave sources
We now investigate the formation of potential GW sources in the simulations of GC inspiral with either an IMBH or a cluster of stellar mass BHs.
4.1 Simulations of GCs with a central IMBH
If the cluster contains an IMBH in the centre, the evolution of the SMBH-IMBH system can be divided in three main phases. The first phase is driven by dynamical friction exerted on the GC by the galactic background, and is largely insensitive to the IMBH mass. Dynamical friction becomes less and less efficient as the cluster is distorted by tidal effects and nominally ends when the GC can be considered disrupted. The second phase is characterised by dynamical friction acting on the IMBH itself, and is therefore sensitive to the IMBH mass. At the same time, close encounters with background stars start contributing to the orbital decay of the SMBH-IMBH system, leading to the formation of a binary. If the flux of interacting stars is sufficient to harden the binary to the separation where emission of GWs becomes dominant, a third phase ensues driven by GW losses in which the binary quickly shrinks and circularises until the black holes coalesce.
However, internal GC dynamics plays a crucial role in determining whether an IMBH can survive tidal forces and reach the inner galactic nucleus. IMBH formation is a largely debated process, which is thought to occur mainly through two channels: FAST and SLOW (Giersz et al., 2015).
The FAST scenario occurs in extremely dense GCs, having initial central densities of order . In these extreme environments, BHs segregate rapidly to the core, where they form a compact subsystem. The large densities favour frequent single-binary and binary-binary BH interactions, driving the formation and growth of an IMBH seed with mass . During these events, the IMBH seed undergoes multiple mergers with stellar mass BHs, possibly experiencing strong natal kicks due to anisotropic GWs emission. The recoil velocity is a function of the BH-to-IMBH mass ratio through the parameter (Schnittman & Buonanno, 2007). For typical parameters, . The recoil velocity peaks in correspondence of , with values of , thus sufficiently large to eject the IMBH seed from ordinary GCs. We note, however, that the extreme densities required for the FAST channel correspond to escape velocities larger than and that implies a mass ratio , a condition that is only satisfied at early times, when all the most massive BHs are still in the cluster core. The FAST scenario is likely more relevant for NSCs than GCs, given their larger central densities.
In the SLOW scenario IMBH formation can occur in sparser environments with central densities if dynamical interactions and supernovae explosions are sufficiently efficient to eject all stellar BHs but one. In this case, the surviving BH undergoes a slow growth process, lasting Gyr, reaching a mass of up to . Dynamical interactions are sufficiently energetic to eject the BHs, but generally do not lead to BH-BH mergers inside the cluster, thus avoiding merger recoils. IMBHs forming through the SLOW channel appear later in the GC lifetime, generally after the post-core collapse phase. As suggested by Giersz et al. (2015), this scenario is more probable for IMBH formation in GCs due to the lower central densities that it requires.
Our models assume either that the cluster reaches the galactic centre before the NSC is fully assembled, i.e. on time-scales Gyr, or after the NSC formation, Gyr. Hence, our S models can, in principle, represent clusters where the IMBHs form through the FAST channel, and were deposited into the galactic centre promptly after their formation, while the M models better represent the SLOW scenario, with the IMBH forming at a later stage and the parent cluster reaching the Galactic Centre on time-scales longer than 1 Gyr.
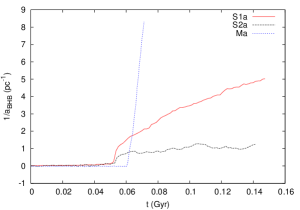
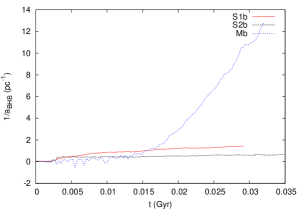
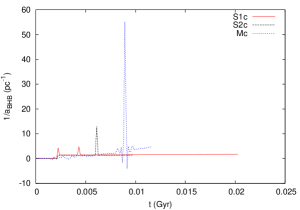
The inverse semi-major axis of the SMBH-IMBH binary (hereafter BHB) is shown in Fig. 19 for all models hosting an IMBH. The time of GC disruption at about 50 Myr (circular orbits) and about 3 Myr (radial and eccentric orbits) is clearly visible in all models, and separates the first phase of binary evolution driven by dynamical friction on the cluster from the second phase, driven by friction on the IMBH and close encounters with intersecting stars. This second phase is efficient and leads to a fast decay of the binary separation, especially for the circular models for which this phase lasts the longest.
The orbital decay, as well as the hardening rate of the BHB, defined as the derivative of the inverse semi-major axis, clearly depend on the slope of the background galaxy density profile, the initial cluster orbit and the IMBH mass. For clusters orbiting in a galaxy with a shallow profile, the decay slows down significantly in the third phase or even stalls, while it continues with high efficiency until the simulations are terminated for the models orbiting in a steeper density background. Eccentric cluster orbits result in a much faster inspiral and therefore in a less efficient decay and binary hardening, with hardly any hardening in the case of radial orbits. The dependence on IMBH mass is clearly visible in the case of circular and eccentric orbits, with larger IMBHs resulting in more efficient hardening.
The evolution of the BHB semi-major axis leads naturally to the definition of two time-scales: a “disruption time”, , which marks the moment at which the GC is disrupted, and a “stalling time”, , at which the inspiral of the BHB stalls. These time-scales are given in Table 5 for all models, and compared with the disruption time determined from the mass bound to the IMBH.
. Model (Myr) (Myr) (Myr) (pc) S1a S2a Ma S1b S2b Mb S1c S2c Mc
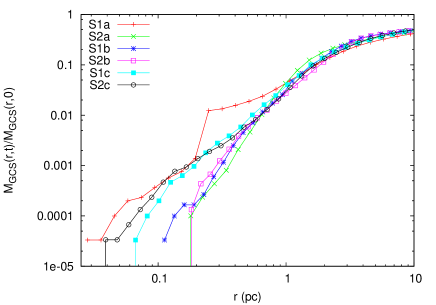
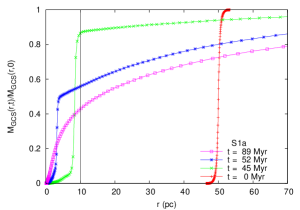
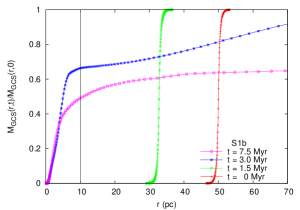
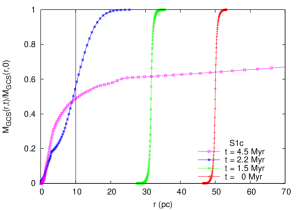
The GC disruption time can be used to investigate how deeply the GC relic penetrates within the galactic nucleus. Figure 20 shows the radial cumulative mass distribution of the GC after , in units of the initial GC mass. The mass distribution is quite similar in the case of eccentric and radial orbits, showing no significant dependence on IMBH mass. On the other hand, the distributions for circular orbits are remarkably different, with stars reaching distances of or less in model S1, while reaching at most in model S2. This is due to the dependence of the number of stars bound to the IMBH on the mass of the IMBH itself. At time we find stars bound to the IMBH in model S1a, but only in model S2a. Scaling these results to a realistic GC model, this would imply stars at distances . For our adopted galaxy mass model, the deposited stars would represent a dominant component driving the BHB evolution at these distances.
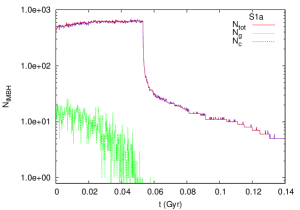
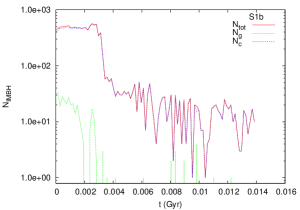
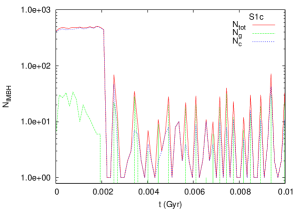
Figure 21 shows the number of stars bound to the SMBH as a function of time.
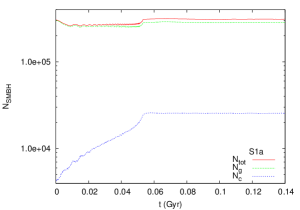
We find that, for circular orbits, the number of stars bound to the SMBH oscillates during the phase of cluster infall and then increases after the GC dissolution due to the contribution from GC stars. In the cases of eccentric and radial orbits we observe a similar behaviour, with the total number of bound stars reflecting the contribution from cluster stars after disruption but with a dip at the time of disruption. This is likely due to the interaction between the infalling cluster and the galactic nucleus when the GC reaches a distance where the enclosed galactic mass becomes comparable to its own mass. The acceleration imparted by the cluster results in stars becoming, if only temporarily, unbound to the SMBH in the Keplerian 2-body sense. This effect is present in all simulations, but is more significant in the case of eccentric and radial orbits. A similar effect can operate during the early evolution of dark matter dominated galaxies and can have interesting consequences on the core/cusp problem and the formation of SMBHs (Sánchez-Salcedo et al., 2006; Goerdt et al., 2010; Arca-Sedda & Capuzzo-Dolcetta, 2017a).
Figure 22 shows instead the number of stars bound to the IMBH in all models.
We find a few hundred stars bound to the IMBH in model S1 during the inspiral and a few tens in model S2, regardless of orbital eccentricity. The vast majority of these stars originate from the GC. After GC dissolution, the number of bound stars rapidly decreases to a few tens (model S1) or zero (model S2), making the IMBH a freely floating object, whose orbit is affected only by gravitational encounters with stars. A similar behaviour in the number of stars bound to the SMBH and the IMBH is found in models M.
The time at which the number of stars bound to the IMBH drops, which we name , represents another way to estimate the disruption time-scale cited above, . Indeed, we expect that these two time-scale should be quite similar since they are strictly connected with the GC tidal disruption. It is worth noting that after the GC disruption, more than GC stars are bound to the SMBH, regardless of the GC initial orbit and the IMBH mass. On the other hand, at most a few galactic stars are bound to the IMBH at any time.
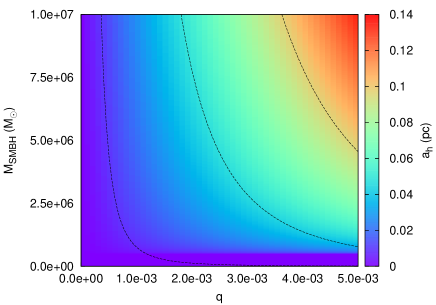
The orbital evolution shown in Fig. 19 indicates a slowing down or even stalling of the inspiral in some of the models. A binary is defined as “hard” when it reaches a separation at which its binding energy per unit mass becomes comparable to , where is the stellar velocity dispersion. The corresponding separation, called the “hard-binary separation”, is given by (Merritt, 2006)
| (8) |
In an isothermal model, this is equivalent to
| (9) |
where is the mass ratio and is the SMBH influence radius, i.e. the radius containing twice the SMBH mass
| (10) |
For our density profile (Dehnen, 1993) takes the simple form
| (11) |
with
| (12) |
We obtain for our models, which gives for models S1 and for models S2. Computing directly from the simulations snapshots gives, at late times, for model S1a and for model S2a, in good agreement with the analytical estimate. The dependence of the hard-binary separation on the SMBH and IMBH masses is illustrated in Fig. 23.
The hard-binary separation represents a sort of “stalling radius” for BHBs evolving in spherical galaxies (Merritt, 2006) since the initial population of stars on low-angular orbits able to interact with the binary has been ejected in reaching , and further orbital decay is due only to collisional repopulation of the binary’s losscone.
In the M models, the BHB hardens much more efficiently and rapidly, and no stalling is apparent in models Ma and Mb by the end of the simulations. This is due to the steeper inner density profile in these models. The stalling radius as evaluated directly from the simulation is for model Ma, a few times smaller than the S1a model.
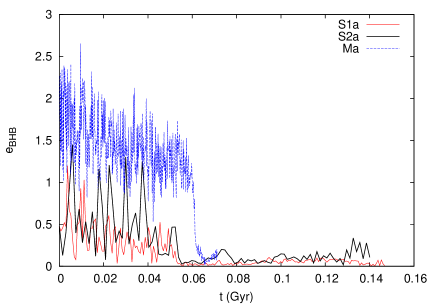
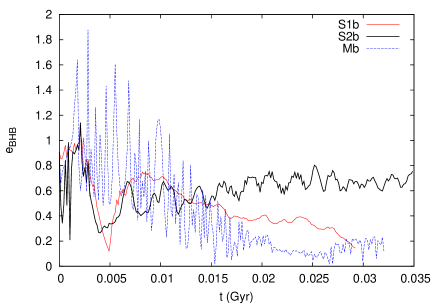
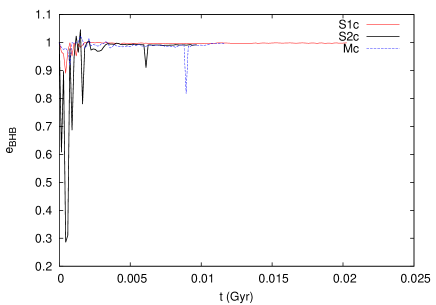
The evolution of the BHB eccentricity, , is shown in fig. 24 for all models. The effect of the initial GC orbit is clearly evident. When the GC moves on an initially circular orbit, the binary’s eccentricity evolves rapidly towards circularisation as the system hardens through encounters. In the case of eccentric orbits, the binary tends to circularise but is then subject to perturbations that lead to a further growth in eccentricity. Finally, for GCs moving on radial orbits the BHB retains a very large eccentricity in all cases.
Due to the high computational demands of the simulations presented here we are not able to follow the evolution of the binary in the live galaxy background up to 10 Gyr. We therefore estimate the merger time-scale of the binaries by numerical integration of the equations governing the evolution of the semi-major axis and eccentricity, under the assumption that this is due to both stellar encounters and, at later times, emission of gravitational waves, i.e.
| (13) |
similarly to (Gualandris & Merritt, 2012). Here the first term represents the evolution due to interactions with stars and the second term that due to emission of GWs.
We compute the hardening rate of the binary
| (14) |
by fitting over small time intervals with straight lines. The time evolution of is shown in fig. 25.
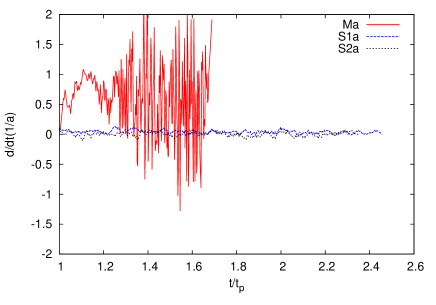
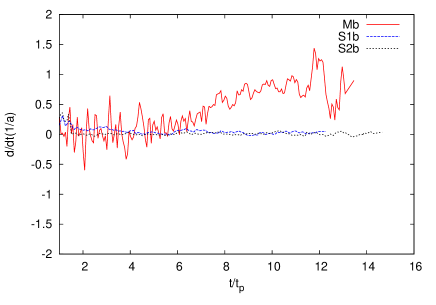
The hardening rate is roughly constant in time for models S1 and S2, albeit rather small. On the other hand, it is much larger for models Ma and Mb, though more noisy, due to the cuspier inner profile of the galaxy model.
Assuming that the BHB continues to harden at a constant hardening rate, the term related to stellar interactions can be written as (Gualandris & Merritt, 2012)
| (15) |
while the GW term can be obtained solving a system of two coupled differential equations (Peters, 1964)
| (16) | |||||
| (17) |
with
| (18) | |||||
| (19) | |||||
| (20) |
The resulting evolution for the BHB semi-major axis is shown in fig. 26 for the M models, compared with the -body data.
The merger time, i.e. the time from the beginning of GC inspiral to binary coalescence, is given in table 6 for all models containing an IMBH.
| MODEL | (Gyr) |
|---|---|
| S1a | |
| S1b | |
| S1c | |
| S2a | |
| S2b | |
| S2c | |
| Ma | |
| Mb | |
| Mc |
If the galaxy has a shallow density profile, merger times are much longer than a Hubble time, unless the cluster is initially on a highly eccentric orbit. On the other hand, the presence of a central over-density due to a NSC facilitates the hardening of the SMBH-IMBH pair, leading the black holes to coalescence in a few billion years from cluster disruption.
Our results can be used to infer the rate at which IMBH-SMBH coalescence occurs in galaxies at low redshift. In the context of the dry-merger scenario, the number of GCs expected to segregate in a Milky Way type like galaxy is (Antonini et al., 2012; Arca-Sedda et al., 2015; Tsatsi et al., 2017). Due to the low IMBH formation probability, we assume that only one of the clusters brought an IMBH to the galactic centre, . In the assumption that the galaxy already hosts a NSC, we found a probability to have an IMBH-SMBH merger, thus implying at least one event per nucleated galaxy. The fraction of galaxies containing a NSC is , as suggested by many observations (Côté et al., 2006; Turner et al., 2012, e.g.), although this represents only an upper limit. As discussed above, the number density of galaxies with stellar mass M⊙ at redshift 0 is Mpc-3, while the time-scale of these events can be obtained by table 6, Gyr. Hence, the rate of IMBH-SMBH mergers is given approximately by:
| (21) |
This relatively low number of events is due to the low efficiency of IMBH formation, which is expected to be as low as (Giersz et al., 2015), and to the small number of GCs that are expected to contribute to the NSC formation in Milky Way type galaxies.
4.2 Simulations of GCs with a central BH subsystem
If instead the cluster contains stellar mass black holes in the centre, BHs may be deposited close to the central SMBH as the cluster inspirals.
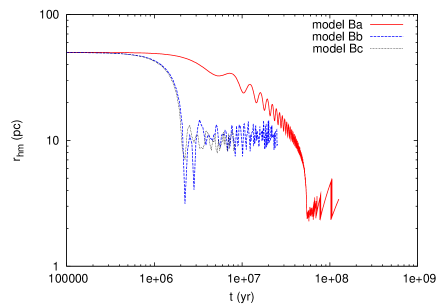
The half-mass radius of the BHs as a function of time is shown in fig. 27 for all B models. BHs are deposited closer to the SMBH in the case of a circular orbit.
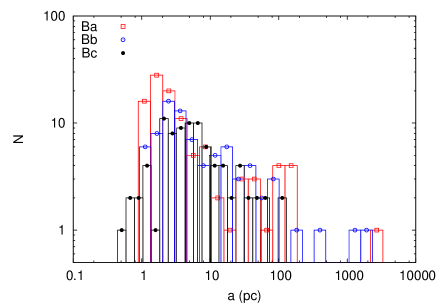
The semi-major axis and eccentricity distribution for all SMBH-BH bound pairs in the B models are shown in fig. 28. Semi-major axes tend to be large, with a distribution that peaks at for the circular orbit and around for the eccentric and radial orbits. The eccentricity distribution, instead, partly reflects the GC initial eccentricity: in model Ba the distribution is almost flat, with a small peak at ; in model Bb the distribution increases for values and flattens beyond ; finally in model Bc the distribution is an increasing function of .
We computed the time-scale to reach coalescence due to emission of gravitational waves for all SMBH-BH binaries, according to Eq. 4. In our sample, only one binary in model Bb has Gyr.
We can estimate the probability to observe a stellar BH - SMBH coalescence in a Hubble time through a simple relation:
| (22) |
being the fraction of BHs with sufficiently small and the fraction of GC with eccentricity in the range , compatible with our Bb model. Assuming a thermal distribution for the GC eccentricities, (Jeans, 1919), we find . This implies of observing a coalescence between a stellar BH brought by an infalling cluster and an SMBH in the galactic nucleus.
Following Amaro-Seoane et al. (2007), we define a critical value for the semi-major axis below which this occurs
| (23) |
being and the relaxation time (Spitzer, 1958; Spitzer & Hart, 1971)
| (24) |
In our model, and at from the SMBH, the typical NSC length scale. Assuming and M⊙ , typical of a Kroupa IMF (Kroupa, 2001), we find Gyr. For a BH, this implies , a value comparable to the minimum value found in our B models. Therefore, investigating a wider range of GC initial conditions may allow to further investigate the possible formation of EMRIs through this channel, which seems to be promising in galactic nuclei hosting heavier SMBHs, (Arca-Sedda & Capuzzo-Dolcetta, 2017c).
It must be noted that as long as the BH moves at distances from the galactic centre, it will still subject to dynamical friction, which can cause a further decrease of the BH semi-major axis over a time-scale (Arca-Sedda & Capuzzo-Dolcetta, 2014a). This implies that our estimates above can slightly increase after . On the other hand, Eq. 4.2 shows that scales with mass as . For a population of lighter BHs with , typical of higher metallicities environments, the corresponding semi-major axis would decrease by , , thus reducing the probability of EMRIs formation by infalling GCs. Further investigations of this channel would require more realistic simulations, in which the full stellar mass spectrum is covered for both the infalling GC and the Galactic nucleus.
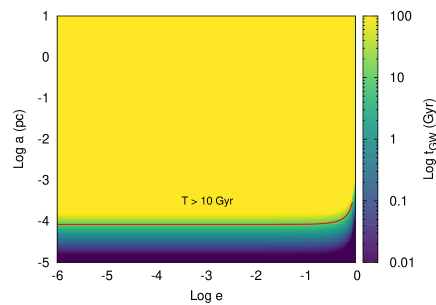
According to Eq. 4, a stellar BH falling toward a SMBH would emit a burst of GW within a Hubble time only for orbital eccentricities and semi-major axis , as shown in Fig. 29.
We estimate the number of BHs that can be captured as extreme mass-ratio inspirals (EMRIs) and merge within a Hubble time as
| (25) |
where the first term represents the probability for EMRIs coalescence as found in our models, the second term is the number of BHs per typical GC, and the third term is the number of GCs that reach the galactic centre. This takes place on a relaxation time, which at the edge of the SMBH influence radius can be calculated as Gyr (O’Leary & Loeb, 2012).
As discussed above, the number density for galaxies with masses around in the local Universe is Mpc-3, thus implying an EMRIs rate from this channel:
| (26) |
a value comparable to the EMRIs rate predicted for strongly segregated BH populations around SMBHs similar to the Milky Way’s SMBH (Amaro-Seoane & Preto, 2011). Indeed, infalling GCs contribute to the enrichment of compact stellar remnants in the galactic centre, acting on the GC dynamical friction time-scale, which is much shorter than for stellar BHs.
5 Conclusions
Inspiralling globular clusters represent a leading scenario for the formation of nuclear star clusters. Here, we model the formation and evolution of gravitational wave sources during the inspiral of a cluster containing either an intermediate mass black hole or a cluster of stellar mass black holes. The cluster infall is followed by means of 12 state-of-the-art direct summation -body simulations, in which the background galaxy is also integrated on a star-by-star basis. The initial conditions are chosen to model different cluster orbits and both a shallow and steep galaxy density profile. Our main results can be summarized as follows:
-
•
In clusters hosting an IMBH, a IMBH-SMBH bound system forms after the GC is disrupted depositing stars in the galactic nucleus. The evolution and hardening of the binary depends sensitively on the slope of the galaxy density profile. In shallow galaxy models, hardening proceeds slowly and eventually stalls at separations too large for emission of GWs to become dominant. Merger time-scales are longer than a Hubble time, unless the GC is on a highly eccentric orbit. In such cases, the black holes are expected to merge within Gyr. In steep galaxy models, hardening proceeds quickly and leads the black holes to coalesce within Gyr, depending on the GC’s initial orbit.
-
•
The rate of formation of IMBH-SMBH binaries in nucleated galaxies is yr.
-
•
In clusters hosting a population of stellar mass black holes, BHs are transported to the galaxy centre, where a fraction bind to the SMBH and form EMRIs. The merger rate for these systems is estimated as yr.
-
•
Stellar black holes also bind in binaries, about of which coalesce within Myr due to the tidal field from the SMBH. The corresponding merger rate for this channel is yr, depending on the number of BHBs deposited by the infalling GC.
Acknowledgements
MAS acknowledges the University of Rome Sapienza, which funded part of this research through the grant 52/2015, in the framework of the “MEGaN project: modelling the evolution of galactic nuclei”. MAS also acknowledges the Sonderforschungsbereich SFB 881 “The Milky Way System” (subproject Z2) of the German Research Foundation (DFG) for the financial support provided. Part of the numerical simulations presented here were performed on the Milky Way supercomputer, which is funded by the Deutsche Forschungsgemeinschaft (DFG) through the Collaborative Research Center (SFB 881) ”The Milky Way System” (subproject Z2) and hosted and co-funded by the Jülich Supercomputing Center (JSC). We thank James Petts, Fabio Antonini and Monica Colpi for interesting discussions. We thank Martina Donnari for having assisted us in obtaining the galaxy stellar mass function from the Illustris data release. We thank Roberto Capuzzo-Dolcetta for giving us access to the high-performance computing workstations ASTROC9, ASTROC15 and ASTROC16b, hosted in the Physics Department of the University of Rome ”Sapienza”.
References
- Abbate et al. (2018) Abbate F., Mastrobuono-Battisti A., Colpi M., Possenti A., Sippel A. C., Dotti M., 2018, MNRAS, 473, 927
- Abbott et al. (2016) Abbott B. P., Abbott R., Abbott T. D., Abernathy M. R., Acernese F., Ackley K., Adams C., Adams T., Addesso P., Adhikari R. X., et al. 2016, Phys. Rev. Let., 93, 122003
- Abbott et al. (2016b) Abbott B. P., Abbott R., Abbott T. D., Abernathy M. R., Acernese F., Ackley K., Adams C., Adams T., Addesso P., Adhikari R. X., et al. 2016b, Physical Review Letters, 116, 241103
- Abbott et al. (2016a) Abbott B. P., Abbott R., Abbott T. D., Abernathy M. R., Acernese F., Ackley K., Adams C., Adams T., Addesso P., Adhikari R. X., et al. 2016a, Physical Review Letters, 116, 061102
- Abbott et al. (2017d) Abbott B. P., Abbott R., Abbott T. D., Acernese F., Ackley K., Adams C., Adams T., Addesso P., Adhikari R. X., Adya V. B., et al. 2017d, ApJL, 848, L13
- Abbott et al. (2017a) Abbott B. P., Abbott R., Abbott T. D., Acernese F., Ackley K., Adams C., Adams T., Addesso P., Adhikari R. X., Adya V. B., et al. 2017a, Physical Review Letters, 118, 221101
- Abbott et al. (2017b) Abbott B. P., Abbott R., Abbott T. D., Acernese F., Ackley K., Adams C., Adams T., Addesso P., Adhikari R. X., Adya V. B., et al. 2017b, Physical Review Letters, 119, 141101
- Abbott et al. (2017c) Abbott B. P., Abbott R., Abbott T. D., Acernese F., Ackley K., Adams C., Adams T., Addesso P., Adhikari R. X., Adya V. B., et al. 2017c, Physical Review Letters, 119, 161101
- Abbott et al. (2017e) Abbott B. P., Abbott R., Abbott T. D., Acernese F., Ackley K., Adams C., Adams T., Addesso P., Adhikari R. X., Adya V. B., et al. 2017e, ApJL, 848, L12
- Alexander (2017) Alexander T., 2017, ARA& A, 55, 17
- Amaro-Seoane et al. (2013) Amaro-Seoane P., Aoudia S., Babak S., et al. 2013, GW Notes, Vol. 6, p. 4-110, 6, 4
- Amaro-Seoane et al. (2007) Amaro-Seoane P., Gair J. R., Freitag M., Miller M. C., Mandel I., Cutler C. J., Babak S., 2007, Classical and Quantum Gravity, 24, R113
- Amaro-Seoane & Preto (2011) Amaro-Seoane P., Preto M., 2011, Classical and Quantum Gravity, 28, 094017
- Antonini (2013) Antonini F., 2013, ApJ, 763, 62
- Antonini (2014) Antonini F., 2014, ApJ, 794, 106
- Antonini et al. (2012) Antonini F., Capuzzo-Dolcetta R., Mastrobuono-Battisti A., Merritt D., 2012, ApJ, 750, 111
- Antonini & Perets (2012) Antonini F., Perets H. B., 2012, ApJ, 757, 27
- Antonini & Rasio (2016) Antonini F., Rasio F. A., 2016, ApJ, 831, 187
- Arca-Sedda (2016) Arca-Sedda M., 2016, MNRAS, 455, 35
- Arca Sedda et al. (2018) Arca Sedda M., Askar A., Giersz M., 2018, ArXiv e-prints
- Arca-Sedda & Capuzzo-Dolcetta (2014a) Arca-Sedda M., Capuzzo-Dolcetta R., 2014a, ApJ, 785, 51
- Arca-Sedda & Capuzzo-Dolcetta (2014b) Arca-Sedda M., Capuzzo-Dolcetta R., 2014b, MNRAS, 444, 3738
- Arca-Sedda & Capuzzo-Dolcetta (2016) Arca-Sedda M., Capuzzo-Dolcetta R., 2016, MNRAS, 461, 4335
- Arca-Sedda & Capuzzo-Dolcetta (2017a) Arca-Sedda M., Capuzzo-Dolcetta R., 2017a, MNRAS, 464, 3060
- Arca-Sedda & Capuzzo-Dolcetta (2017b) Arca-Sedda M., Capuzzo-Dolcetta R., 2017b, ArXiv e-prints
- Arca-Sedda & Capuzzo-Dolcetta (2017c) Arca-Sedda M., Capuzzo-Dolcetta R., 2017c, ArXiv e-prints
- Arca-Sedda et al. (2015) Arca-Sedda M., Capuzzo-Dolcetta R., Antonini F., Seth A., 2015, ApJ, 806, 220
- Arca-Sedda et al. (2016) Arca-Sedda M., Capuzzo-Dolcetta R., Spera M., 2016, MNRAS, 456, 2457
- Arca-Sedda et al. (2017) Arca-Sedda M., Kocsis B., Brandt T., 2017, ArXiv e-prints
- Askar et al. (2018) Askar A., Arca Sedda M., Giersz M., 2018, ArXiv e-prints
- Askar et al. (2017) Askar A., Szkudlarek M., Gondek-Rosińska D., Giersz M., Bulik T., 2017, MNRAS, 464, L36
- Bahcall & Wolf (1976) Bahcall J. N., Wolf R. A., 1976, ApJ, 209, 214
- Banerjee (2017) Banerjee S., 2017, MNRAS, 467, 524
- Banerjee (2018) Banerjee S., 2018, MNRAS, 473, 909
- Barausse et al. (2015) Barausse E., Bellovary J., Berti E., Holley-Bo ckelmann K., Farris B., Sathyaprakash B., Sesana A., 2015, in Journal of Physics Conference Series Vol. 610 of Journal of Physics Conference Series, Massive Black Hole Science with eLISA. p. 012001
- Baumgardt et al. (2018) Baumgardt H., Amaro-Seoane P., Schödel R., 2018, A & A, 609, A28
- Baumgardt et al. (2006) Baumgardt H., Gualandris A., Portegies Zwart S., 2006, MNRAS, 372, 174
- Belczynski et al. (2017) Belczynski K., Askar A., Arca-Sedda M., Chruslinska M., Donnari M., Giersz M., Benacquista M., Spurzem R., Jin D., Wiktorowicz G., Belloni D., 2017, ArXiv e-prints
- Brandt & Kocsis (2015) Brandt T. D., Kocsis B., 2015, ApJ, 812, 15
- Bromley et al. (2006) Bromley B. C., Kenyon S. J., Geller M. J., Barcikowski E., Brown W. R., Kurtz M. J., 2006, ApJ, 653, 1194
- Buchholz et al. (2009) Buchholz R. M., Schödel R., Eckart A., 2009, A & A, 499, 483
- Capuzzo-Dolcetta (1993) Capuzzo-Dolcetta R., 1993, ApJ, 415, 616
- Capuzzo-Dolcetta & Fragione (2015) Capuzzo-Dolcetta R., Fragione G., 2015, MNRAS, 454, 2677
- Capuzzo-Dolcetta et al. (2013) Capuzzo-Dolcetta R., Spera M., Punzo D., 2013, Journal of Computational Physics, 236, 580
- Capuzzo-Dolcetta & Tosta e Melo (2017) Capuzzo-Dolcetta R., Tosta e Melo I., 2017, MNRAS, 472, 4013
- Côté et al. (2006) Côté P., Piatek S., Ferrarese L., Jordán A., Merritt D., Peng E. W., Haşegan M., Blakeslee J. P., Mei S., West M. J., Milosavljević M., Tonry J. L., 2006, ApJS, 165, 57
- Dehnen (1993) Dehnen W., 1993, MNRAS, 265, 250
- Do et al. (2009) Do T., Ghez A. M., Morris M. R., Lu J. R., Matthews K., Yelda S., Larkin J., 2009, ApJ, 703, 1323
- Ferrarese & Ford (2005) Ferrarese L., Ford H., 2005, Space Sci. Rev. , 116, 523
- Fragione et al. (2018) Fragione G., Antonini F., Gnedin O. Y., 2018, MNRAS
- Fragione et al. (2017) Fragione G., Capuzzo-Dolcetta R., Kroupa P., 2017, MNRAS, 467, 451
- Fragione et al. (2017) Fragione G., Ginsburg I., Kocsis B., 2017, ArXiv e-prints
- Freitag et al. (2006) Freitag M., Amaro-Seoane P., Kalogera V., 2006, Journal of Physics Conference Series, 54, 252
- Freitag et al. (2006) Freitag M., Gürkan M. A., Rasio F. A., 2006, MNRAS, 368, 141
- Gaburov et al. (2008) Gaburov E., Gualandris A., Portegies Zwart S., 2008, MNRAS, 384, 376
- Gallego-Cano et al. (2017) Gallego-Cano E., Schödel R., Dong H., Nogueras-Lara F., Gallego-Calvente A. T., Amaro-Seoane P., Baumgardt H., 2017, ArXiv e-prints
- Georgiev & Böker (2014) Georgiev I. Y., Böker T., 2014, MNRAS, 441, 3570
- Georgiev et al. (2016) Georgiev I. Y., Böker T., Leigh N., Lützgendorf N., Neumayer N., 2016, MNRAS, 457, 2122
- Ghez et al. (2008) Ghez A. M., Salim S., Weinberg N. N., Lu J. R., Do T., Dunn J. K., Matthews K., Morris M. R., Yelda S., Becklin E. E., Kremenek T., Milosavljevic M., Naiman J., 2008, ApJ, 689, 1044
- Giersz et al. (2015) Giersz M., Leigh N., Hypki A., Lützgendorf N., Askar A., 2015, MNRAS, 454, 3150
- Gillessen et al. (2009) Gillessen S., Eisenhauer F., Trippe S., Alexander T., Genzel R., Martins F., Ott T., 2009, ApJ, 692, 1075
- Gnedin et al. (2014) Gnedin O. Y., Ostriker J. P., Tremaine S., 2014, ApJ, 785, 71
- Goerdt et al. (2010) Goerdt T., Moore B., Read J. I., Stadel J., 2010, ApJ, 725, 1707
- Graham (2007) Graham A. W., 2007, MNRAS, 379, 711
- Graham & Spitler (2009) Graham A. W., Spitler L. R., 2009, MNRAS, 397, 2148
- Gualandris et al. (2010) Gualandris A., Gillessen S., Merritt D., 2010, MNRAS, 409, 1146
- Gualandris & Merritt (2009) Gualandris A., Merritt D., 2009, ApJ, 705, 361
- Gualandris & Merritt (2012) Gualandris A., Merritt D., 2012, ApJ, 744, 74
- Hansen & Milosavljević (2003) Hansen B. M. S., Milosavljević M., 2003, ApJL, 593, L77
- Harris et al. (2014) Harris W. E., Morningstar W., Gnedin O. Y., O’Halloran H., Blakeslee J. P., Whitmore B. C., Côté P., Geisler D., Peng E. W., Bailin J., Rothberg B., Cockcroft R., Barber DeGraaff R., 2014, ApJ, 797, 128
- Hills (1988) Hills J. G., 1988, Nature, 331, 687
- Hoang et al. (2017) Hoang B.-M., Naoz S., Kocsis B., Rasio F. A., Dosopoulou F., 2017, ArXiv e-prints
- Holley-Bockelmann et al. (2008) Holley-Bockelmann K., Gültekin K., Shoemaker D., Yunes N., 2008, ApJ, 686, 829
- Hurley et al. (2000) Hurley J. R., Pols O. R., Tout C. A., 2000, MNRAS, 315, 543
- Jeans (1919) Jeans J. H., 1919, MNRAS, 79, 408
- King (2003) King A., 2003, ApJL, 596, L27
- King (2005) King A., 2005, ApJL, 635, L121
- King (1966) King I. R., 1966, AJ, 71, 64
- Kroupa (2001) Kroupa P., 2001, MNRAS, 322, 231
- Leigh et al. (2012) Leigh N., Böker T., Knigge C., 2012, MNRAS, 424, 2130
- Luo et al. (2016) Luo J., Chen L.-S., Duan H.-Z., Gong Y.-G., Hu S., Ji J., Liu Q., Mei J., Milyukov V., Sazhin M., Shao C.-G., Toth V. T., Tu H.-B., Wang Y., Wang Y., Yeh H.-C., Zhan M.-S., Zhang Y., Zharov V., Zhou Z.-B., 2016, Classical and Quantum Gravity, 33, 035010
- Mapelli (2016) Mapelli M., 2016, MNRAS, 459, 3432
- Mapelli et al. (2012) Mapelli M., Ripamonti E., Vecchio A., Graham A. W., Gualandris A., 2012, A & A, 542, A102
- Mastrobuono-Battisti et al. (2014) Mastrobuono-Battisti A., Perets H. B., Loeb A., 2014, ApJ, 796, 40
- Merritt (2006) Merritt D., 2006, ApJ, 648, 976
- Merritt (2013) Merritt D., 2013, Dynamics and Evolution of Galactic Nuclei
- Merritt et al. (2009) Merritt D., Gualandris A., Mikkola S., 2009, ApJL, 693, L35
- Mikkola & Merritt (2008) Mikkola S., Merritt D., 2008, AJ, 135, 2398
- Mikkola & Tanikawa (1999) Mikkola S., Tanikawa K., 1999, MNRAS, 310, 745
- Milosavljević (2004) Milosavljević M., 2004, ApJL, 605, L13
- Morscher et al. (2015) Morscher M., Pattabiraman B., Rodriguez C., Rasio F. A., Umbreit S., 2015, ApJ, 800, 9
- Nayakshin et al. (2009) Nayakshin S., Wilkinson M. I., King A., 2009, MNRAS, 398, L54
- Nelson et al. (2015) Nelson D., Pillepich A., Genel S., Vogelsberger M., Springel V., Torrey P., Rodriguez-Gomez V., Sijacki D., Snyder G. F., Griffen B., Marinacci F., Blecha L., Sales L., Xu D., Hernquist L., 2015, Astronomy and Computing, 13, 12
- Neumayer (2012) Neumayer N., 2012, ArXiv e-prints
- Nguyen et al. (2014) Nguyen D. D., Seth A. C., Reines A. E., den Brok M., Sand D., McLeod B., 2014, ApJ, 794, 34
- O’Leary & Loeb (2012) O’Leary R. M., Loeb A., 2012, MNRAS, 421, 2737
- Peters (1964) Peters P. C., 1964, Physical Review, 136, 1224
- Petts & Gualandris (2017) Petts J. A., Gualandris A., 2017, MNRAS, 467, 3775
- Peuten et al. (2016) Peuten M., Zocchi A., Gieles M., Gualandris A., Henault-Brunet V., 2016, ArXiv e-prints
- Portail et al. (2015) Portail M., Wegg C., Gerhard O., Martinez-Valpuesta I., 2015, MNRAS, 448, 713
- Portegies Zwart & McMillan (2002) Portegies Zwart S. F., McMillan S. L. W., 2002, ApJ, 576, 899
- Reid & Brunthaler (2004) Reid M. J., Brunthaler A., 2004, ApJ, 616, 872
- Rodriguez et al. (2016) Rodriguez C. L., Chatterjee S., Rasio F. A., 2016, Phys. Rev. Let., 93, 084029
- Rodriguez et al. (2015) Rodriguez C. L., Morscher M., Pattabiraman B., Chatterjee S., Haster C.-J., Rasio F. A., 2015, Physical Review Letters, 115, 051101
- Sánchez-Salcedo et al. (2006) Sánchez-Salcedo F. J., Reyes-Iturbide J., Hernandez X., 2006, MNRAS, 370, 1829
- Schnittman & Buonanno (2007) Schnittman J. D., Buonanno A., 2007, ApJL, 662, L63
- Schödel et al. (2007) Schödel R., Eckart A., Alexander T., Merritt D., Genzel R., Sternberg A., Meyer L., Kul F., Moultaka J., Ott T., Straubmeier C., 2007, A & A, 469, 125
- Schödel et al. (2014) Schödel R., Feldmeier A., Neumayer N., Meyer L., Yelda S., 2014, Classical and Quantum Gravity, 31, 244007
- Schödel et al. (2017) Schödel R., Gallego-Cano E., Dong H., Nogueras-Lara F., Gallego-Calvente A. T., Amaro-Seoane P., Baumgardt H., 2017, ArXiv e-prints
- Scott & Graham (2013) Scott N., Graham A. W., 2013, ApJ, 763, 76
- Spera et al. (2015) Spera M., Mapelli M., Bressan A., 2015, MNRAS, 451, 4086
- Spitzer (1958) Spitzer Jr. L., 1958, ApJ, 127, 17
- Spitzer & Hart (1971) Spitzer Jr. L., Hart M. H., 1971, ApJ, 164, 399
- Tremaine et al. (1975) Tremaine S. D., Ostriker J. P., Spitzer Jr. L., 1975, ApJ, 196, 407
- Tsatsi et al. (2017) Tsatsi A., Mastrobuono-Battisti A., van de Ven G., Perets H. B., Bianchini P., Neumayer N., 2017, MNRAS, 464, 3720
- Turner et al. (2012) Turner M. L., Côté P., Ferrarese L., Jordán A., Blakeslee J. P., Mei S., Peng E. W., West M. J., 2012, ApJS, 203, 5
- Valenti et al. (2016) Valenti E., Zoccali M., Gonzalez O. A., Minniti D., Alonso-García J., Marchetti E., Hempel M., Renzini A., Rejkuba M., 2016, A & A, 587, L6
- Weatherford et al. (2017) Weatherford N. C., Chatterjee S., Rodriguez C. L., Rasio F. A., 2017, ArXiv e-prints
- Webb & Leigh (2015) Webb J. J., Leigh N. W. C., 2015, MNRAS, 453, 3278