The Effect of Pets on Happiness: A Large-scale Multi-Factor Analysis using Social Multimedia
Abstract.
From reducing stress and loneliness, to boosting productivity and overall well-being, pets are believed to play a significant role in people’s daily lives. Many traditional studies have identified that frequent interactions with pets could make individuals become healthier and more optimistic, and ultimately enjoy a happier life. However, most of those studies are not only restricted in scale, but also may carry biases by using subjective self-reports, interviews, and questionnaires as the major approaches. In this paper, we leverage large-scale data collected from social media and the state-of-the-art deep learning technologies to study this phenomenon in depth and breadth. Our study includes four major steps: 1) collecting timeline posts from around 20,000 Instagram users; 2) using face detection and recognition on 2-million photos to infer users’ demographics, relationship status, and whether having children, 3) analyzing a user’s degree of happiness based on images and captions via smiling classification and textual sentiment analysis; 3) applying transfer learning techniques to retrain the final layer of the Inception v3 model for pet classification; and 4) analyzing the effects of pets on happiness in terms of multiple factors of user demographics. Our main results have demonstrated the efficacy of our proposed method with many new insights. We believe this method is also applicable to other domains as a scalable, efficient, and effective methodology for modeling and analyzing social behaviors and psychological well-being. In addition, to facilitate the research involving human faces, we also release our dataset of 700K analyzed faces.
1. Introduction
Happiness has always been a subjective and multidimensional matter; its definition varies individually, and the factors impacting our feeling of happiness are diverse. A study in (Ura, 2016) has constructed a mechanism for indexing people’s happiness through considering nine domains, namely psychological wellbeing, time use, community vitality, cultural diversity, ecological resilience, living standard, health, education, and good governance. Our study focuses on analyzing happiness from the perspectives of psychological wellbeing. It has shown by (Glenn and Weaver, 1988) and (Budge et al., 1998), satisfactory companion relationship is a crucial factor towards our wellbeing; the companionship could be between human and human as well as human and animal; and those relationships often interweave with each other. In this paper, we are particularly interested in analyzing how pet companionship, relationship status (i.e. having partner or not), and having children affect happiness though a data-driven approach.
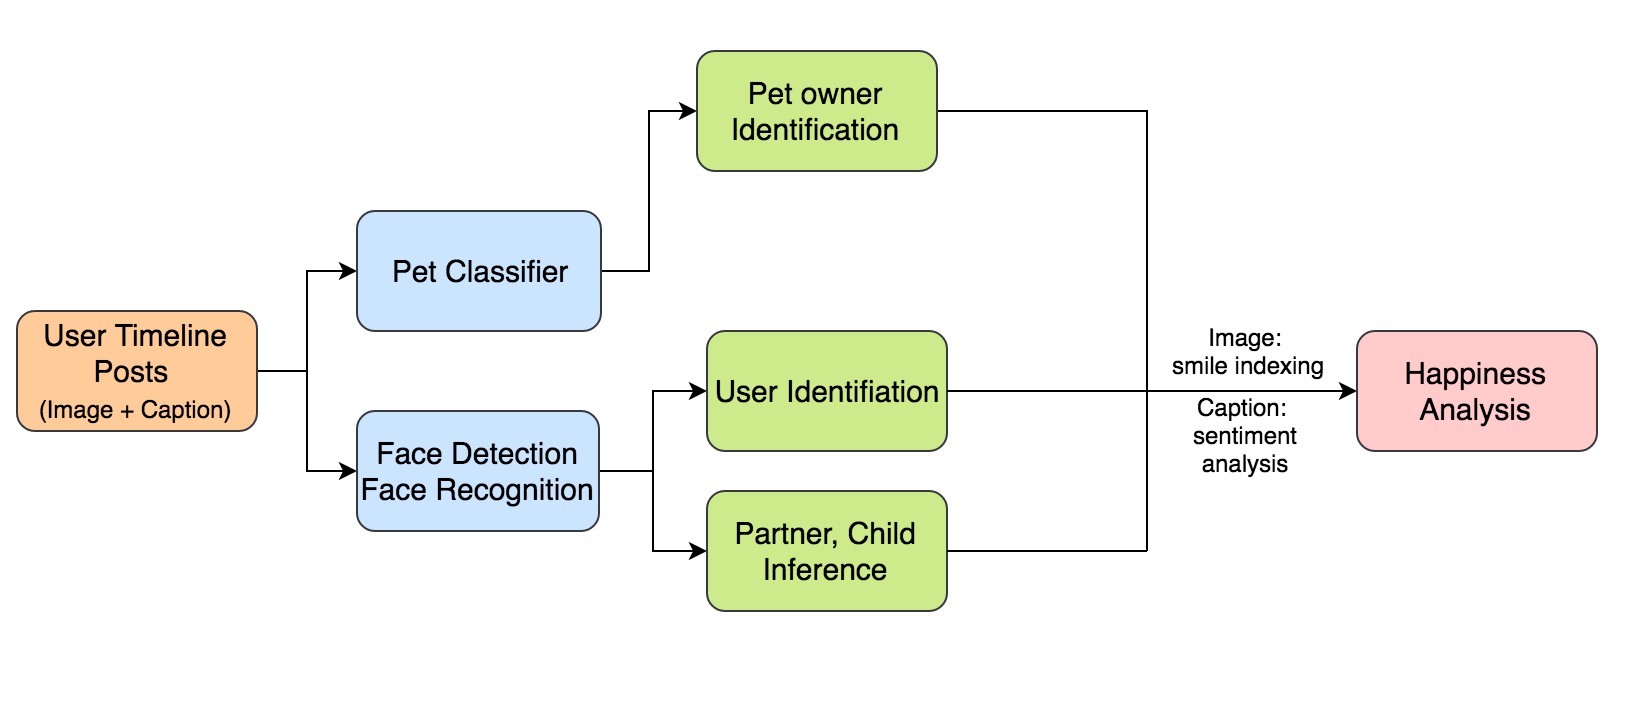
Our study proposes a novel, efficient, and scalable computational framework, shown in Figure 1, to assess the effects of pets, relationship status, and having children on individual happiness. More specifically, for each user obtained from Instagram, we first apply our pet classifier to identify if he/she is a pet owner; then we use the state-of-the-art facial detection and recognition technologies provided by Face++ on all the posts with faces for 1) inferring user demographics; 2) inferring user relationship status, and if the user has children; and 3) analyzing user happiness.
Our contributions can be summarized in fourfold as follows:
-
•
We apply the cutting-edge transfer learning to construct an extremely high-performance pet classifier retrained specifically on social media posts.
-
•
We propose an efficient way to infer user’s relationship status, and if having children.
-
•
We analyze the effects of pets on happiness, and further analyze the relationship status, and having children on happiness in pet and none-pet owner groups, respectively.
-
•
We further show the effectiveness and efficiencies of combining social media resources and computational methods on large-scale screening and analysis of user-level behaviors, and psychological well-being.
-
•
To help other research involving human faces, we share our dataset111https://github.com/xuefeng7/FACE-LIBRARY including nearly 700K processed human faces from social media posts.
2. RELATED WORK
Several previous studies have demonstrated the positive impacts possessing pets for elderly (Garrity et al., 1989; Ory and Goldberg, 1983), while our study focuses on further confirming this effect using a large number of samples from social media regardless of age, gender, and ethnicity.
Our study is inspired by the preliminary research in (Wu et al., 2016) but we extend the analyses in four distinguishable ways: 1) using nearly ten-times more data, 2) retraining the final layer of the Inception model v3 as our pet classifier, which achieves a superior accuracy, 3) improving the method of identifying user faces in user timeline posts, and most importantly, 4) considering multiple factors including user’s relationship status and if having children. In contrast, the work in (Wu et al., 2016) analyzed 300,000 posts from around 2900 users, while our study analyzes around 2-million posts from roughly 20,000 Instagram users. (Wu et al., 2016) has constructed a reasonable convolutional neural network (CNN) as its pet classifier while we build a high-performance classifier by retraining the final layer of the Inception v3 model using remarkably fewer training samples. In addition, (Wu et al., 2016) assumed that the largest face in a selfie post is the face of the user, and analyzed the average happiness of this user according to all of those ”largest” faces throughout this user’s timeline posts. While this is usually valid as most likely the user would be the one who is holding the camera when taking selfies, it is still possible that the largest face is not from the user. We reduce such inaccuracy by employing face recognition to identify user faces. Lastly but most importantly, our work extensively analyzes the multi-factor effects of relationship status, and if having children on happiness among pet and none-pet owners.
3. DATA ACQUISITION
With billions of users, Instagram is a rich source of high quality, and keyword tagged images. In our study, timeline posts from both potential pet and none-pet owners are needed. For potential pet owners, considering that dogs and cats are the two most common pets all over the world, we collected users who have posted either dog or cat images by retrieving posts tagged with dog or cat related keywords. To reduce sample biases, multiple hashtags were considered, they are #mydog, #mypuppy, #mydoggie, and #mycat, #mykitten, #mykitty for cats and dogs, respectively. After obtaining the usernames, we backtracked up to 100 timeline posts from each user for later analysis. None-pet owners were obtained in a similar fashion, except the hashtags included are #selfies, #me, and #life. Eventually, we collected nearly 20,000 users and 2-million posts from their timelines.
Human face analysis is becoming increasingly popular in the fields of computer vision and artificial intelligence. In order to facilitate related research, we have decided to publish our dataset whose web link can be found in Footnote 1 . The dataset contains 700K processed faces that originated from social media posts. Facial attributes such as age, gender, race, as well as facial landmarks for each face, are provided.
4. PET OWNER IDENTIFICATION
Two steps are taken to identify if an Instagram user is a pet owner or not. First, we classify each image in a user’s timeline into three classes, namely dog, cat, and others. Next, since a none-pet owner might post pet images while visiting a friend who is a pet owner, we identify a pet owner by looking at the frequency of posting pet image throughout the timeline. We describe the details in the following subsections.
4.1. Classification
4.1.1. Inception v3 Model
Building a robust deep learning model for object recognition can cost enormous amount of computing power and time; therefore, we chose to develop our pet classification model using the state-of-the-art transfer learning (Weiss et al., 2016). This technique allows us to take advantage of a fully-trained model, and retrain its final layer for new categories with far less training samples. The fully-trained model we adopt is the Inception v3 model built by Google. The detailed structure of the model can be found in (Szegedy et al., 2016), and according to (Szegedy et al., 2016), Inception v3 outperforms many other state-of-the-art deep convolutional networks such as VGGNet, GoogleNet, BN-Inception, and so on, on the ILSVR2014 classification challenge validation set (Russakovsky et al., 2015).
4.1.2. Retrain Inception v3 Model
We retrain the final output layer of the Inception v3 model for three new categories: a) dog, b) cat, and c) others. We collected only 2000 images of each category from Instagram, and manually labeled them as our training set. The dog and cat images contain at least one dog or cat, and others can contain any scene except animals. Figure 2 shows a few sample images from each category. We utilize Tensorflow as our computation backend; and with a single Nvidia Tesla K20X GPU, the entire retraining process takes approximately 10 hours.


The model is retrained through 600 steps with the 0.1 default initial learning rate. To avoid over-fitting, we split 80% of the entire dataset as our main training set, 10% as the testing set, and the remaining 10% as the validation set. Also, during the retraining phase, 10% of these training images were randomly cropped, flipped, scaled, mirrored, and brightness-adjusted for improving model adaptability.
4.1.3. Retrained Model Validation
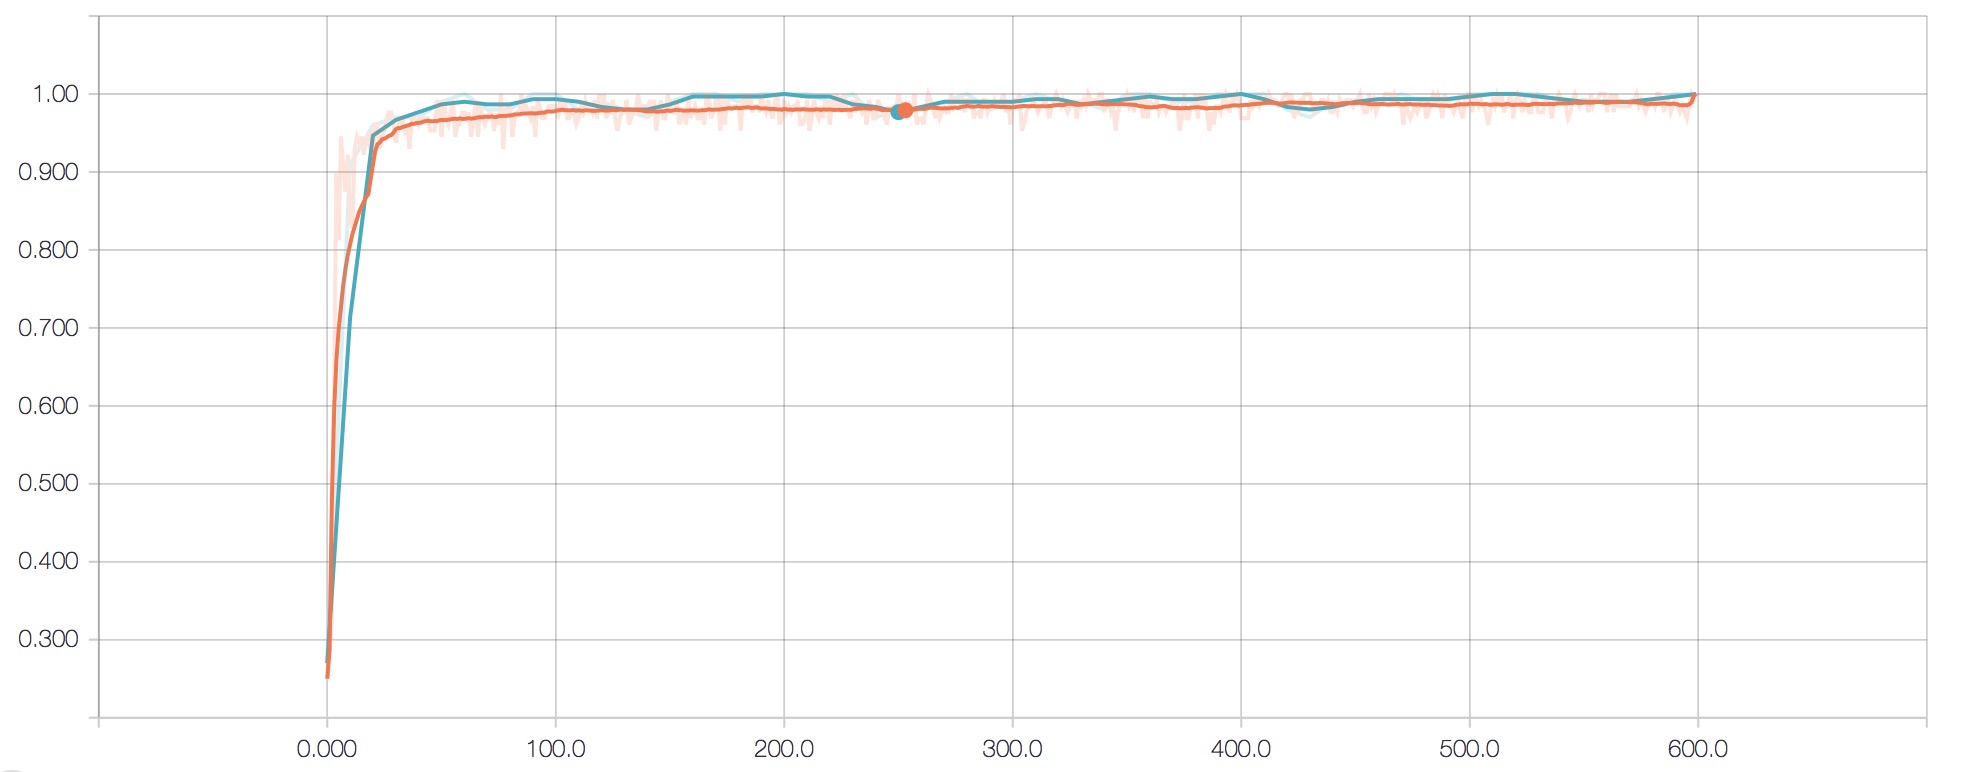
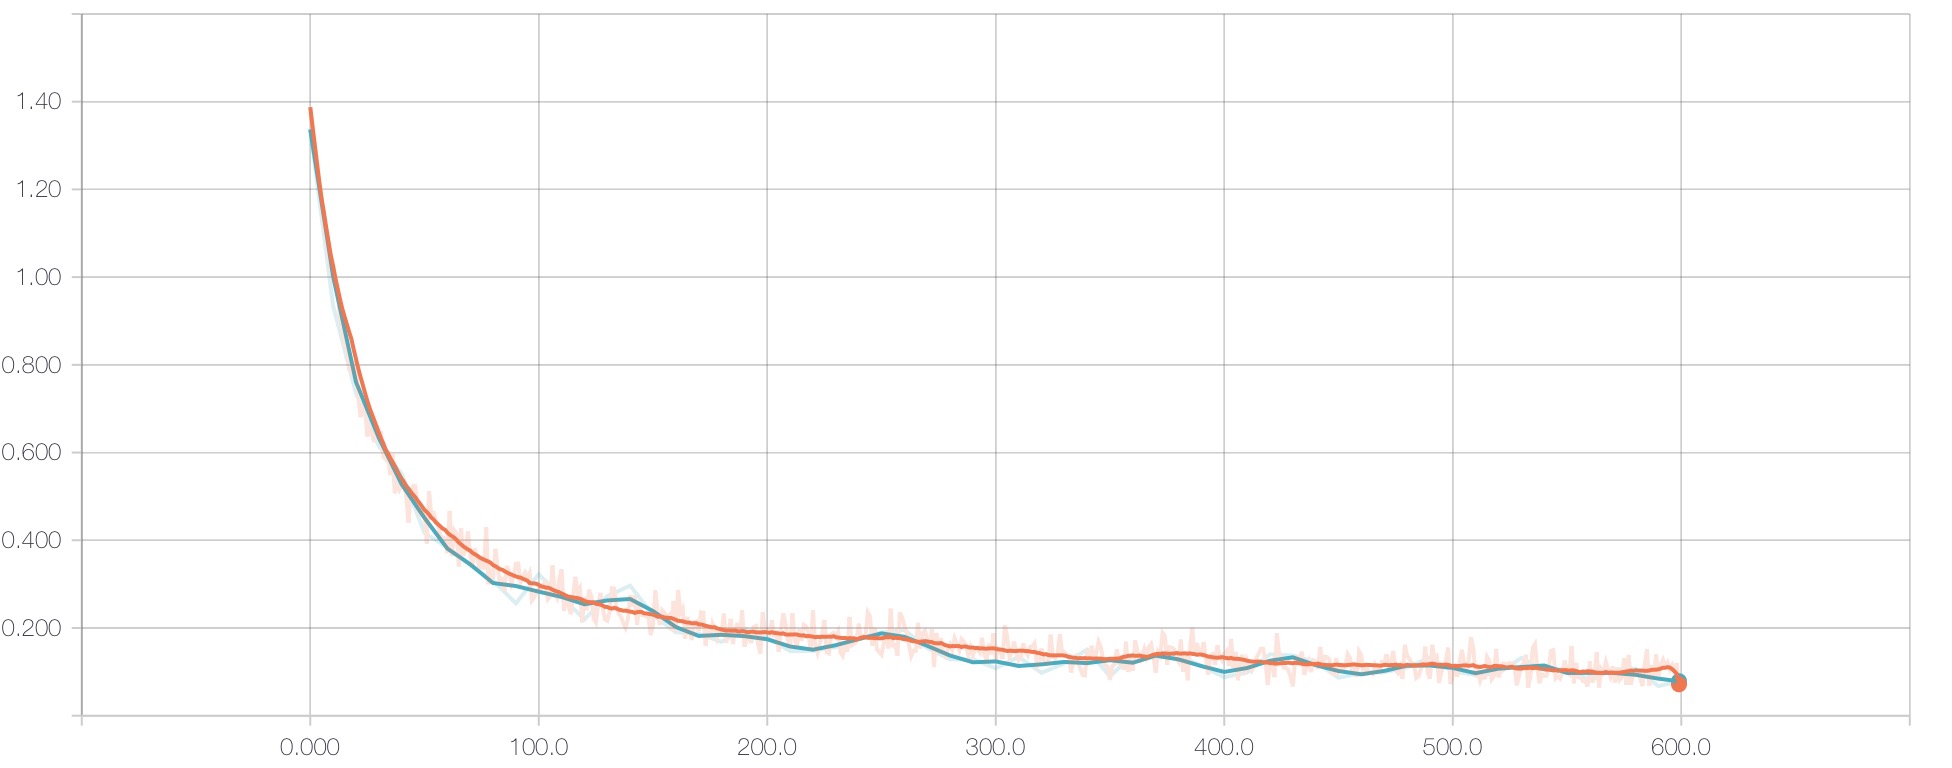
In the final step, the retrained model achieves 98.4% testing accuracy, and 100% validation accuracy. Cross-entropy for testing and validation sets decreased from 0.9268 and 1.051 to 0.04 and 0.03 at the end of retraining, respectively. Figure 3 shows the accuracy curves, and Figure 4 shows the cross-entropy curves.
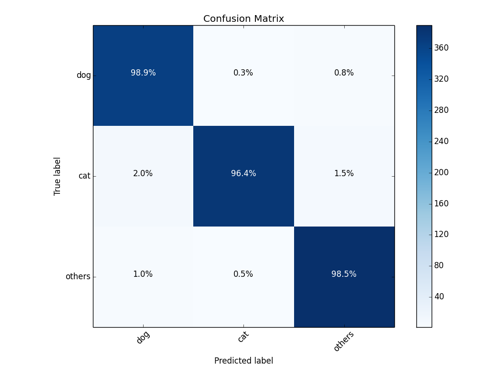
We further verify our model by classifying 1500 manually-labeled unseen images for each class collected from Instagram, the retrained model achieves high accuracy of 99.0%, 96.4%, and 98.5% for dog, cat, and others, respectively. The confusion matrix is shown in Figure 5.
4.2. Identification
We use two criteria to identify if a user is a pet owner. First, we collect users who have post images tagged with either dog or cat related topic as described in section 3. Tags such as #mydog, #mycat, etc. are strong indicators that these users own pets; however, exceptions may exist. Therefore, we develop the pet classifier to further assure that there are indeed dogs or cats in a pet owner’s timeline. Furthermore and more importantly, since a none-pet owner may post pet images while visiting a friend who is a pet owner, we also took the frequency of posting pet images into consideration. We treat one week as a time window, and a user is considered as a pet owner only if the user posts images of the same type of pet, namely dog or cat, more than one time window throughout his/her timeline. If a user post pet images only within one time window (one week), this person is not considered as a pet owner regardless the amount of pet pictures post. This is similar to the approach adopted in (Wu et al., 2016).
5. TIMELINE ANALYSIS
Face++ is an open source face engine with both an online API and an offline SDK that provide services including face detection, face recognition and face analysis. The system is built with a CNN structure similar to the ImageNet structure as discussed in section IV-A (Krizhevsky et al., 2012), where five convolutional layers with maxpooling are connected with two fully connected layers and a softmax layer on top of them.
In addition, Face++’s services have been widely used in commercial applications by many major companies in China. By integrating Face++, AliPay, used by more than 120 million people, allows users to transfer money securely by using their faces as credentials. Meanwhile, Didi, China’s dominant ride-hailing company, uses the Face++ software to allow passengers to confirm the driver’s identity. Lenovo, a world-wide computer manufacturer, also adopts the biologic identification solution from Face++.
We adopt the reliable services provided by the Face++ engine (Fan et al., 2014) to detect, analyze, and recognize faces in each user’s timeline for three purposes:
-
•
Identify a user’s faces and infer his/her demographics such as age, gender, and race.
-
•
Identify the frequently appeared faces in user’s timeline, and infer their demographics.
-
•
Analyze the smiles of user faces to infer his/her overall happiness.
5.1. Face detection
Given a user, face detection is applied to every image within his/her timeline. Note that if a user’s timeline contains less than five faces, such user will be discarded from further analysis. Besides, since more posts will assist us to identify more accurately if user is a pet owner, or if a user has a partner, we also discard user whose timeline contains less than 25 posts from further analysis.
For each detected face, its attributes including gender, age, race, smiling, glass and pose will be computed. The attributes we are interested in are age, gender, race, and smiling. Figure 6 shows few examples of applying Face++ on faces.

Gender: Male
Smiling: 54.10
Race: Black

Gender: Female
Smiling: 94.68
Race: white

Gender: Male
Smiling: 1.20
Race: white

Gender: Female
Smiling: 2.63
Race: white
5.2. Face grouping
It is possible that photos in a user’s timeline contain not only his/her own faces, but also the faces of his/her friends, family members, and even strangers. Therefore, we need to group the faces into several face sets where each face set consists of only one individual’s faces. To achieve this, for each user, 1) we create a faceset, 2) detect every face in user’s timeline posts, and add them into the faceset, 3) utilize face recognition technology (Zhou et al., 2013) to group faces in the faceset.
Figure 7 shows the entire process from face detection to face grouping.
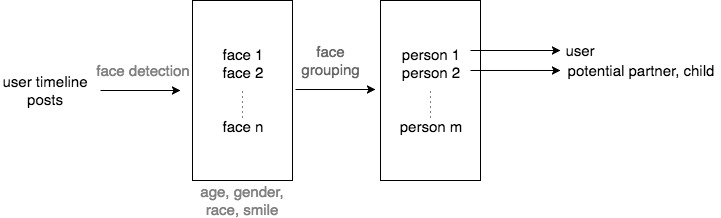
5.2.1. User Identification
The person list in Figure 7 is sorted in a descending order by the number of faces. We consider the most frequently appeared face as the user’s face. Based on this assumption, in the grouped faceset, we can easily locate the user. We conduct the happiness analysis solely for the faces identified as the user.
5.2.2. Relationship Status, Having-Children Inference
As shown in Figure 7, the second and third most frequently appeared faces in a user’s timeline may have close relationships with the user. We further infer such relationship by checking the age. Similar to how we identify pet owners, we also consider the frequency while determining if a user has a partner or child. A user is considered to have a partner, if another person’s face appears throughout the user’s timeline for more than a time window (one week), and the age difference between the user and the person is less than 5 years. In the same vein, a user is considered to have a child if 1) the user is older than 18 years old, and 2) another person’s face appears throughout the user’s timeline for more than one time window, and the age difference between the user and the person is more than 18 years.
5.3. Happiness Analysis
We consider both visual and textual context in our study of happiness.
5.3.1. Visual Context
Our methodology of quantifying user happiness is in the same vein as [4, 17]. Let denotes the visual happiness score of a user over a period of , and denotes the number of user faces in the timeline over the time frame , and indicates the confidence score of smiling for user face appeared in the post . Equation 1 calculates the final visual happiness score for any given user.
| (1) |
Note that the smiling confidence score for each face is acquired during the face detection phase.
5.3.2. Textual Context
We also utilize the sentiment analysis on the user post captions to infer user happiness. In particular, we take advantage of Valence Aware Dictionary and sEntiment Reasoner (VADER) (Hutto and Gilbert, 2014) as our lexicon and rule-based sentiment analysis tool. This analyzer is specifically attuned to sentiments expressed over social multimedia. Moreover, VADER is particularly suitable for our study as it can capture many sentiment-laden slangs, emoticons, initialisms, and acronyms such as ”:)”, ”:D”, ”friggin”, ”sux”, and ”lol”, which are prevalent in Instagram post captions. According to (Hutto and Gilbert, 2014), for each given caption, a normalized, weighted composite score from -1 (most extreme negative) to 1 (most extreme positive) is generated to measure its emotion. In our study, we use the average composite score to infer user happiness. Let denotes the textual happiness score of a user over a period of , and denotes the number of all user captions in the timeline over the time frame , and indicates the composite score of the caption for user timeline post . Like Equation 1, Equation 2 calculates the final textual happiness score.
| (2) |
6. MAIN RESULTS
In this section, we present our findings. We first show the demographic distribution of our users in section 6.1. Then in section 6.2, we investigate the happiness over pet and none-pet owners separately in terms of relationship status, and if having children.
6.1. Demographics
In our study, we process over 20,000 users, but the filter step described in section 5.1, and the pet-owner identification step together help us refine our user collection. 10,536 users were kept for our happiness analysis. In terms of gender, we have 7308 females and 3228 males; for race, there are 2210 Asians, 681 African Americans, and 7654 Caucasians. Table 1 summarized the gender and race distributions.
| Asian | African American | Caucasian | Sum | |
|---|---|---|---|---|
| Male | 562 | 333 | 2333 | 3228 |
| Female | 1648 | 348 | 5312 | 7308 |
| Sum | 2210 | 681 | 7645 | 10536 |
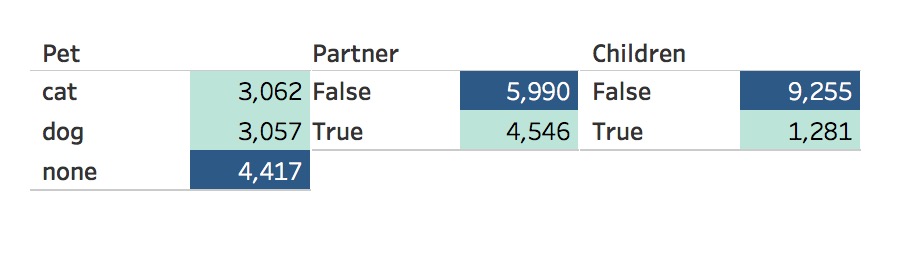
Figure 8 shows the distribution of pet, partner, and children.
6.2. Happiness
In this subsection, we present happiness score comparisons. Note that we report and in parallel along with the significance tests. The statistical significance test we employed is multiple comparison test (Hochberg and Tamhane, 1987), which compares the means of several groups to test the hypothesis that they are all equal, against the general alternative that they are not all equal. This testing procedure also provides the information about which pairs of means are significantly different. Also note we used the 95% confidence level throughout our analysis.
6.2.1. Pet and None-pet owners
The multiple comparison test results are presented in Table 2.
| categories | lower | est. mean diff | upper | p-val |
|---|---|---|---|---|
| dog-cat | 1.6018 | 3.3093 | 5.0168 | 0 |
| dog-none | 10.9853 | 12.5968 | 14.2084 | 0 |
| cat-none | 7.6883 | 9.2875 | 10.8868 | 0 |
| dog-cat | 0.0187 | 0.0252 | 0.0317 | 0 |
| dog-none | 0.0323 | 0.0384 | 0.0445 | 0 |
| cat-none | 0.0071 | 0.0132 | 0.0192 | 0 |
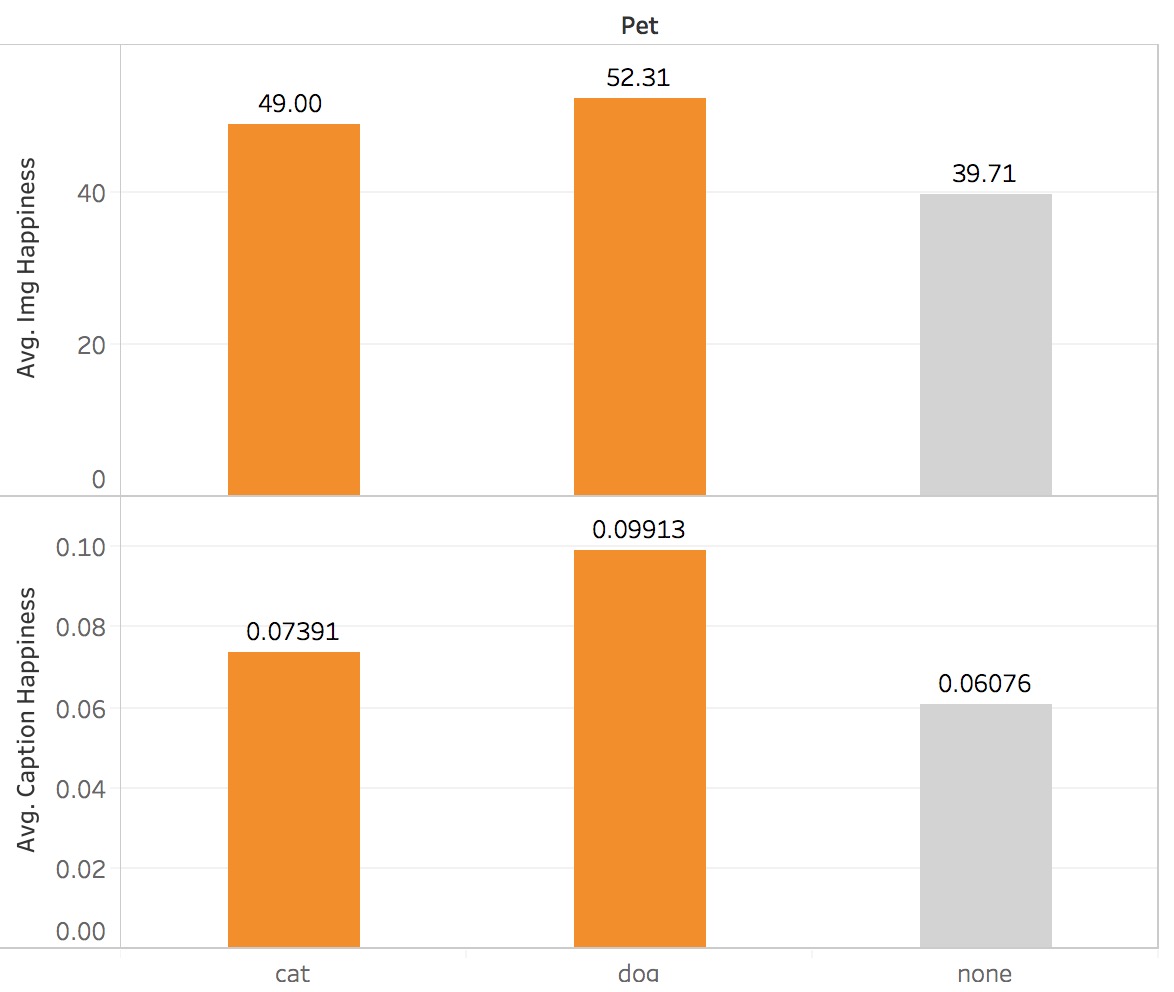
and share the same trends among dog, cat, and none-pet owners. Dog owners possess the highest scores, followed by cat owners, and then none-pet owners. If we combine dog and cat owners as pet owners, then the significant test denotes that and of pet owner are higher than that of none-pet owner by , with p-values both equal to zero.
Note that we merge dog and cat owners as pet owners for the rest of analyses.
6.2.2. Gender
We compare the and over different genders among pet and none-pet owners.
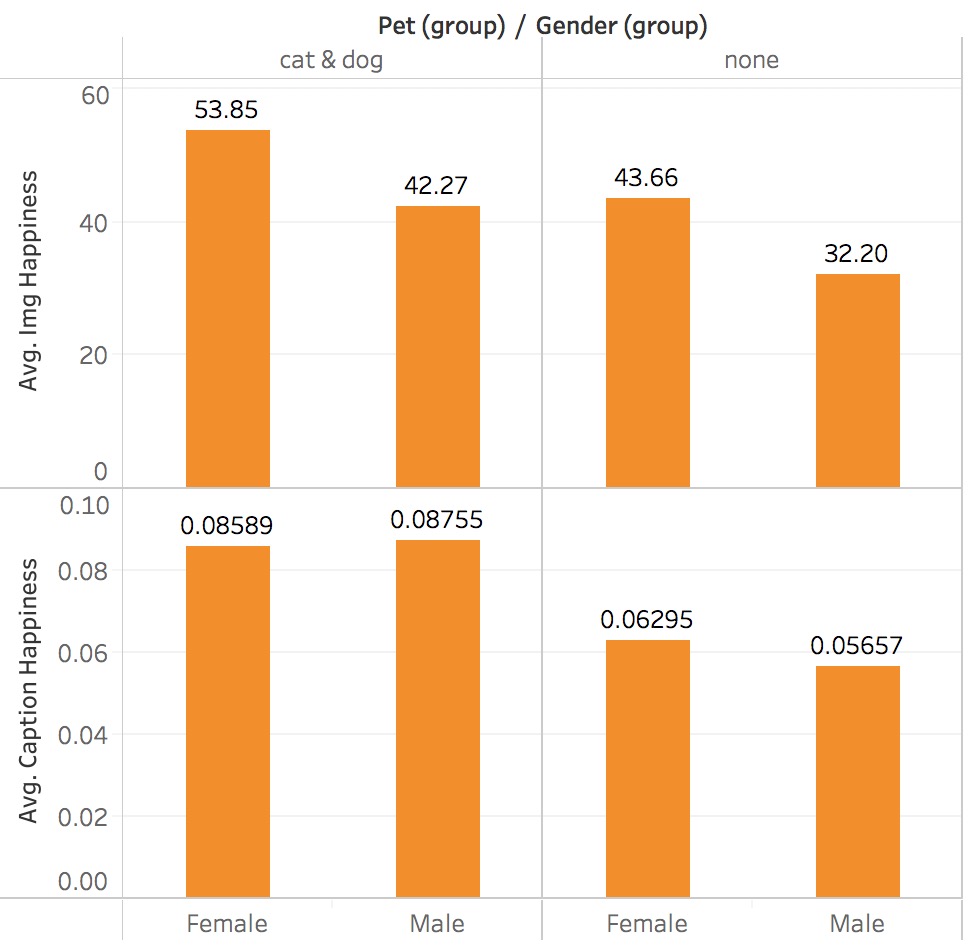
The test results suggest that for pet and none-pet owners, the differences of between female and male are (p-value=0), (p-value=0), respectively. No significant differences were found between genders for both groups.
6.2.3. Race
We also compare the and over different race groups among pet and none-pet owners.
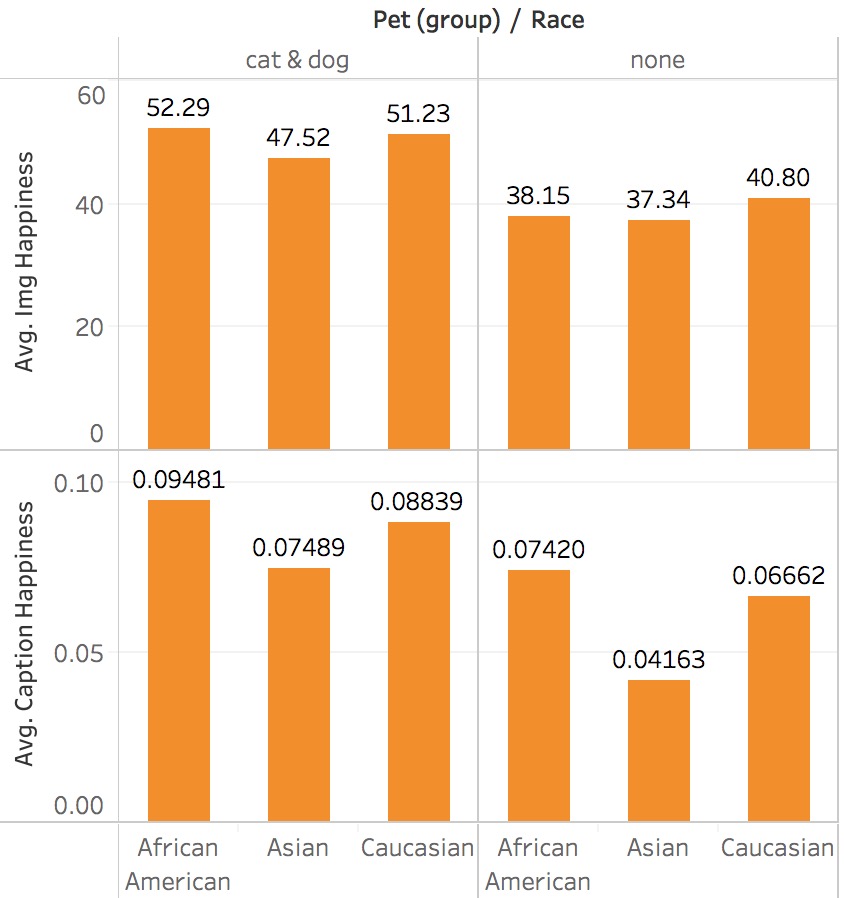
In terms of , the difference between Asian and Caucasian pet owners is significant, and its value is (p-value=0.0016). Similarly, among none-pet owners, the of Asian is (p-value=0.0121) lower than that of Caucasian. The significant differences of among different racial groups are summarized in Table 3.
| Pet Owner | ||||
|---|---|---|---|---|
| categories | lower | est. mean diff | upper | p-val |
| Asian - Caucasian | -0.0239 | -0.0135 | -0.0031 | 0.0029 |
| Asian - African. A | -0.0392 | -0.0199 | -0.0006 | 0.0391 |
| None Pet Owner | ||||
| Asian - Caucasian | -0.0363 | -0.0250 | -0.0137 | 0 |
| Asian - African. A | -0.0527 | -0.0326 | -0.0124 | 0.001 |
In general, in both pet and none-pet groups, Asian has lower and than those of Caucasian and African Americans.
6.2.4. Partner
In this subsection, we investigate the effect of having a partner on happiness for pet and none-pet owners.
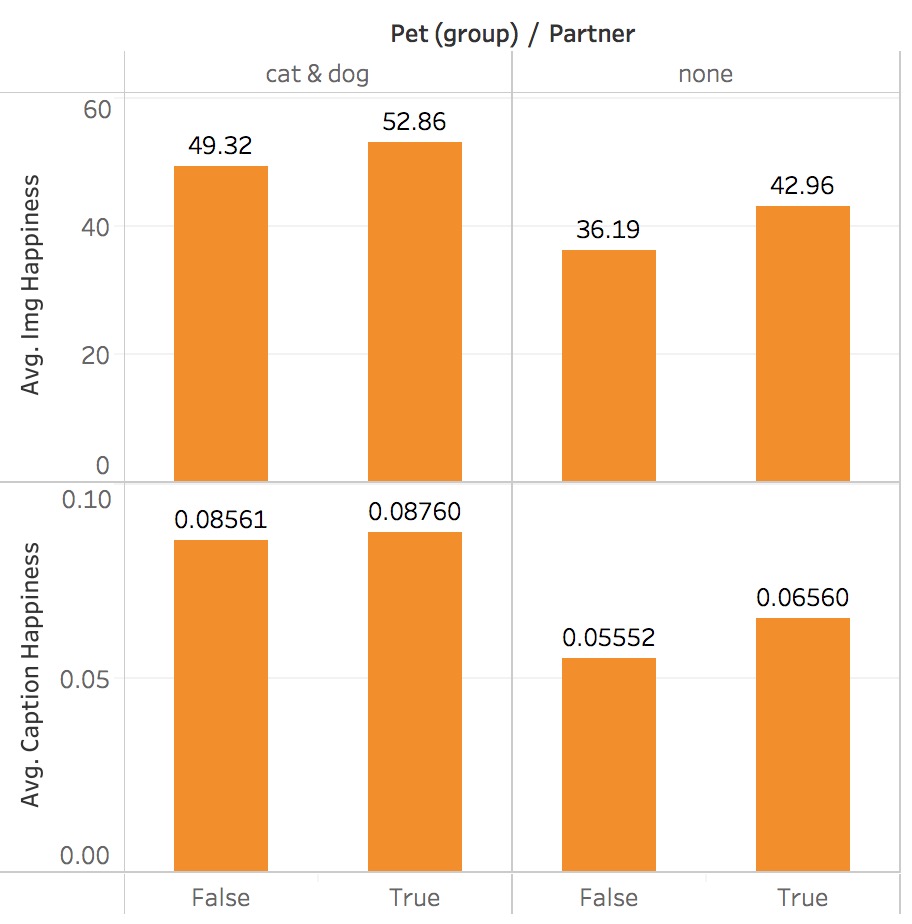
As shown in the Figure 12, and share the same trends over population having partner and having no partner in both pet and none-pet owner groups. More specifically, in both groups, those who have partners possess higher and . The significant tests suggest that among pet owners, for those who have partner are (p-value=0.0) higher than that for those who have no partner. No statistically significant difference exists with respect to .
Among none-pet owners, and for those who have partner are (p-value=0.0), and (p-value=0.0) higher.
6.2.5. Child
In this subsection, we examine the effect of having children on happiness for pet and none-pet owners.
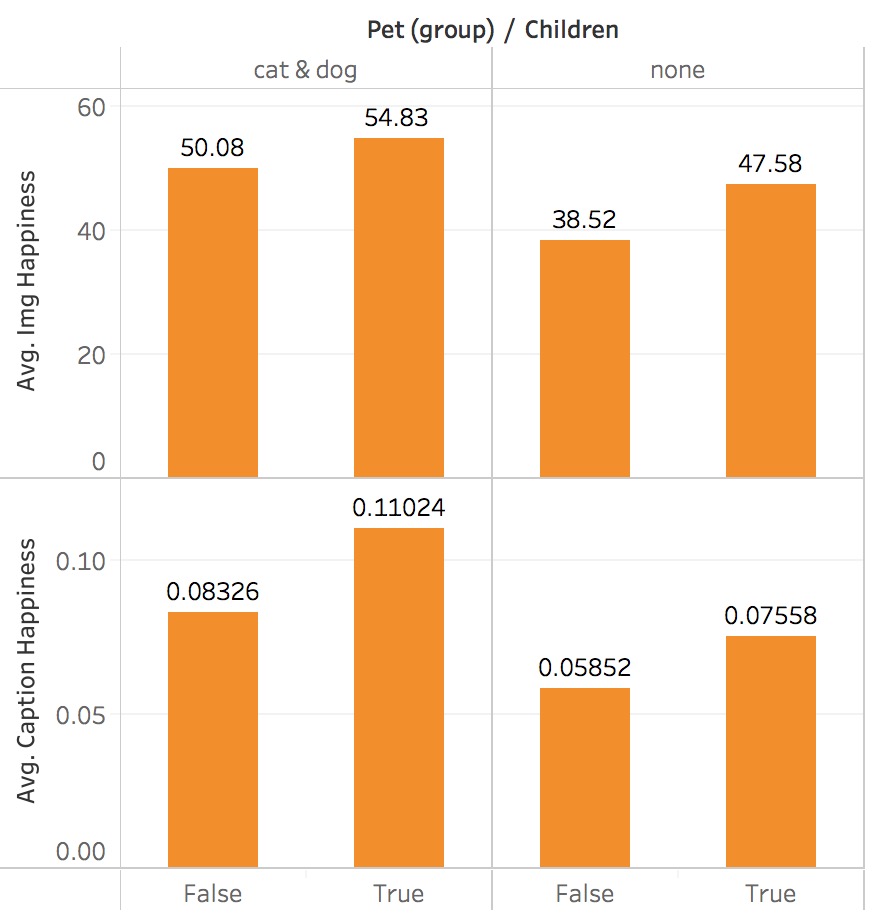
As Figure 13 shows, in both pet and none-pet owner groups, the population with children possess higher and . We present the significant test results in Table 4.
| Pet Owner | ||||
| score | lower | est. mean diff | upper | p-val |
| 1.8128 | 4.7442 | 7.6756 | 0.0002 | |
| 0.0158 | 0.0270 | 0.0381 | 0 | |
| None Pet Owner | ||||
| 5.6261 | 9.0561 | 12.4861 | 0 | |
| 0.004 | 0.0171 | 0.0301 | 0 | |
7. CONCLUSIONS
In this study, we present a computational framework of using user-level multimedia posts from Instagram to investigate the effects of pets on happiness in terms of multiple aspects of user demographics. An Inception V3, which is retrained specifically on social media data, and timeline analysis together form the pet-owner classifier. The Face++ engine is employed for face detection, recognition, and user demographics inference. Among pet and none-pet owners, we also examine the happiness over different genders, different races, having partner or not, and having child or not. We believe our proposed framework is applicable to other related domains as a scalable, efficient, and effective methodology of social media user behavioral, and psychological well-being modeling and analysis.
8. LIMITATION AND FUTURE WORK
Our study infers user relationship status, and if having children by checking the posting frequency of faces, plus age differences. However, there are possible and perhaps rare exceptions. For instance, if a user frequently posts pictures with his/her close friends, this user maybe classified as having a partner (although arguably a close friend serves some of the social fucntions of a partner). It is also possible that a user frequently posts a child star, and this user could be identified as having a child. Nonetheless, we believe the trends and distributions in our large-scale study will remain consistent and valid, especially given that a significantly large number of users and images are analyzed.
Our work only includes data collected from Instagram, so this may not reflect the happiness level across different cultures outside US. Indeed, culture is one of the most important variables that impacts happiness (Mathews, 2014). In the future, we plan to collect multimedia posts through other countries’ social media platforms, such as Chinese Wechat and Weibo, to analyze happiness in terms of culture - another important factor. Also in our current work, we consider the happiness scores derived from visual and textual contexts separately. It can be even more effective to infer individual’s happiness if integrating those two types of scores organically.
According to (Ura, 2016), many other factors, such as education, community and living standard, can impact individual happiness; those factors can be integrated into our happiness analysis if users education and employment records are accessible from social media such as LinkedIn. Furthermore, personality is also associated with the pursuit of happiness (Tkach and Lyubomirsky, 2006), and may be used as a predictor of happiness (Cheng and Furnham, 2002). According to (Gottschalk, 1997), words people use in their daily lives can provide rich information about their beliefs, fears, thinking patterns, social relationships, and personalities. By collecting user-level tweets plus leveraging Language and Inquiry and Word Count (LIWC2015) (Pennebaker, 2015), (Pan et al., 2017) successfully connected the personality with career progression. In the same vein, we can also form an effective and automatic personality analysis tool for studying the effects of personality on happiness at a large scale.
Furthermore, social multimedia posts offer the potential to provide a method for mass screening for individuals at risk for a range of poor health and psychological conditions. In particular, insufficient and low-quality sleep, unhealthy work-life balance are highly accountable for one’s loss of happiness. (Peng et al., 2017a) and (Peng et al., 2017b) used user-level multimedia posts to study sleep deprivation and human fatigue in a massive scale. With some extension, the correlation between sleep, fatigue and happiness can also be quantified. In addition, Instagram has been used to pick up signals when individuals use language that could be related to risky behaviors (Pang et al., 2015). In the same way, our proposed framework can be extended to an automatic tool to monitor individual happiness to detect risk such as depressions, and allow for early intervention.
Acknowledgements.
We thank the support of New York State through the Goergen Institute for Data Science, our corporate research sponsors Xerox and VisualDX, and NSF Award #1704309.References
- (1)
- Budge et al. (1998) R. Claire Budge, Ross St. George, John Spicer, and Boyd Jones. 1998. Health Correlates of Compatibility and Attachment in Human-Companion Animal Relationships. Society & Animals 6, 3 (Jan 1998), 219–234. https://doi.org/10.1163/156853098x00168
- Cheng and Furnham (2002) Helen Cheng and Adrian Furnham. 2002. Personality, peer relations, and self-confidence as predictors of happiness and loneliness. Journal of Adolescence 25, 3 (2002), 327–339. https://doi.org/10.1006/jado.2002.0475
- Fan et al. (2014) Haoqiang Fan, Mu Yang, Zhimin Cao, Yujing Jiang, and Qi Yin. 2014. Learning Compact Face Representation. Proceedings of the ACM International Conference on Multimedia - MM 14 (2014). https://doi.org/10.1145/2647868.2654960
- Garrity et al. (1989) Thomas F. Garrity, Lorann Stallones, Martin B. Marx, and Timothy P. Johnson. 1989. Pet Ownership and Attachment as Supportive Factors in the Health of the Elderly. Anthrozoos: A Multidisciplinary Journal of The Interactions of People & Animals 3, 1 (Jan 1989), 35–44. https://doi.org/10.2752/089279390787057829
- Glenn and Weaver (1988) Norval D. Glenn and Charles N. Weaver. 1988. The Changing Relationship of Marital Status to Reported Happiness. Journal of Marriage and the Family 50, 2 (1988), 317. https://doi.org/10.2307/351999
- Gottschalk (1997) L. A. Gottschalk. 1997. The unobtrusive measurement of psychological states and traits. In C.W. Roberts (Ed.) Text analysis for the social sciences: Methods for drawing statistical inferences from texts and transcripts (1997), 117–129.
- Hochberg and Tamhane (1987) Y. Hochberg and A. C. Tamhane. 1987. Multiple Comparison Procedures. Multiple Comparison Procedures (1987), 28–46. https://doi.org/10.4135/9781412985178.n2
- Hutto and Gilbert (2014) C.J. Hutto and E.E. Gilbert. 2014. VADER: A Parsimonious Rule-based Model for Sentiment Analysis of Social Media Text. Eighth International Conference on Weblogs and Social Media (ICWSM-14). Ann Arbor, MI (June 2014). https://doi.org/10.1145/2675133.2675186
- Krizhevsky et al. (2012) Alex Krizhevsky, Ilya Sutskever, and Geoffrey E Hinton. 2012. Imagenet classification with deep convolutional neural networks. In Advances in neural information processing systems. 1097–1105.
- Kumar et al. (2009) Neeraj Kumar, Alexander C Berg, Peter N Belhumeur, and Shree K Nayar. 2009. Attribute and simile classifiers for face verification. 2009 IEEE 12th International Conference on Computer Vision (2009). https://doi.org/10.1109/iccv.2009.5459250
- Mathews (2014) G. Mathews. 2014. Happiness, culture, and context. International Journal of Wellbeing 2.4 (2014). https://doi.org/10.1145/2675133.2675186
- Ory and Goldberg (1983) M. G. Ory and E. L. Goldberg. 1983. Pet Possession and Well-Being in Elderly Women. Research on Aging 5, 3 (Jan 1983), 389–409. https://doi.org/10.1177/0164027583005003007
- Pan et al. (2017) Yiming Pan, Xuefeng Peng, Tianran Hu, and Jiebo Luo. 2017. Understanding what affects career progression using linkedin and twitter data. In Big Data (Big Data), 2017 IEEE International Conference on. IEEE, 2047–2055.
- Pang et al. (2015) Ran Pang, Agustin Baretto, Henry Kautz, and Jiebo Luo. 2015. Monitoring adolescent alcohol use via multimodal analysis in social multimedia. 2015 IEEE International Conference on Big Data (Big Data) (2015). https://doi.org/10.1109/bigdata.2015.7363914
- Peng et al. (2017a) Xuefeng Peng, Jiebo Luo, Catherine Glenn, Li-Kai Chi, and Jingyao Zhan. 2017a. Sleep-deprived fatigue pattern analysis using large-scale selfies from social media. In Big Data (Big Data), 2017 IEEE International Conference on. IEEE, 2076–2084.
- Peng et al. (2017b) Xuefeng Peng, Jiebo Luo, Catherine Glenn, Jingyao Zhan, and Yuhan Liu. 2017b. Large-Scale Sleep Condition Analysis Using Selfies from Social Media. In International Conference on Social Computing, Behavioral-Cultural Modeling and Prediction and Behavior Representation in Modeling and Simulation. Springer, 151–161.
- Pennebaker (2015) et al Pennebaker, James W. 2015. The development and psychometric properties of LIWC2015. (2015).
- Russakovsky et al. (2015) Olga Russakovsky, Jia Deng, Hao Su, Jonathan Krause, Sanjeev Satheesh, Sean Ma, Zhiheng Huang, Andrej Karpathy, Aditya Khosla, Michael Bernstein, and et al. 2015. ImageNet Large Scale Visual Recognition Challenge. International Journal of Computer Vision 115, 3 (Nov 2015), 211–252. https://doi.org/10.1007/s11263-015-0816-y
- Szegedy et al. (2016) Christian Szegedy, Vincent Vanhoucke, Sergey Ioffe, Jon Shlens, and Zbigniew Wojna. 2016. Rethinking the Inception Architecture for Computer Vision. 2016 IEEE Conference on Computer Vision and Pattern Recognition (CVPR) (2016). https://doi.org/10.1109/cvpr.2016.308
- Tkach and Lyubomirsky (2006) Chris Tkach and Sonja Lyubomirsky. 2006. How Do People Pursue Happiness?: Relating Personality, Happiness-Increasing Strategies, and Well-Being. Journal of Happiness Studies 7, 2 (2006), 183–225. https://doi.org/10.1007/s10902-005-4754-1
- Ura (2016) Dasho Karma Ura. 2016. Gross National Happiness, Values Education and Schooling for Sustainability in Bhutan. Reorienting Educational Efforts for Sustainable Development (2016), 71–88. https://doi.org/10.1007/978-94-017-7622-6_5
- Weiss et al. (2016) Karl Weiss, Taghi M. Khoshgoftaar, and Dingding Wang. 2016. A Survey of Transfer Learning. Journal of Big Data 3, 1 (2016). https://doi.org/10.1186/s40537-016-0043-6
- Wu et al. (2016) Yuchen Wu, Jianbo Yuan, Quanzeng You, and Jiebo Luo. 2016. The Effect of Pets on Happiness: A Data-driven Approach via Large-scale Social Media. 2016 IEEE International Conference on Big Data (Big Data) (2016). https://doi.org/10.1109/bigdata.2016.7840808
- Zhou et al. (2013) Erjin Zhou, Haoqiang Fan, Zhimin Cao, Yuning Jiang, and Qi Yin. 2013. Extensive Facial Landmark Localization with Coarse-to-Fine Convolutional Network Cascade. 2013 IEEE International Conference on Computer Vision Workshops (2013). https://doi.org/10.1109/iccvw.2013.58