C+ distribution around S 1 in Ophiuchi
We analyze a [C ii] 158 m map obtained with the L2 GREAT receiver on SOFIA of the emission/reflection nebula illuminated by the early B star S 1 in the Oph A cloud core. This data set has been complemented with maps of CO(3–2), 13CO(3–2) and C18O(3-2), observed as a part of the JCMT Gould Belt Survey, with archival HCO+(4–3) JCMT data, as well as with [O i] 63 and 145 m imaging with Herschel/PACS. The [C ii] emission is completely dominated by the strong PDR emission from the nebula surrounding S 1 expanding into the dense Oph A molecular cloud west and south of S 1. The [C ii] emission is significantly blue shifted relative to the CO spectra and also relative to the systemic velocity, particularly in the northwestern part of the nebula. The [C ii] lines are broader towards the center of the S 1 nebula and narrower towards the PDR shell. The [C ii] lines are strongly self-absorbed over an extended region in the S 1 PDR. Based on the strength of the [13C ii] F = 2–1 hyperfine component, [C ii] is significantly optically thick over most of the nebula. CO and 13CO(3–2) spectra are strongly self-absorbed, while C18O(3–2) is single peaked and centered in the middle of the self-absorption. We have used a simple two-layer LTE model to characterize the background and foreground cloud contributing to the [C ii] emission. From this analysis we estimate the extinction due to the foreground cloud to be 9.9 mag, which is slightly less than the reddening estimated towards S 1. Since some of the hot gas in the PDR is not traced by low J CO emission, this result appears quite plausible. Using a plane parallel PDR model with the observed [O i](145)/[C ii] brightness ratio and an estimated FUV intensity of 3100–5000 G0 suggests that the density of the [C ii] emitting gas is 3 – 4 cm-3.
Key Words.:
ISM: Clouds – Submillimeter: ISM – ISM: lines and bands – ISM: individual ( Oph A) – ISM: molecules – H ii regions1 Introduction
Photon Dominated Regions (PDRs) are regions where FUV (6 eV h 13.6 eV) radiation from young massive stars dominate the physics and the chemistry of the interstellar medium (Tielens & Hollenbach, 1985). The PDRs play an important role in reprocessing much of the energy from stars and re-emitting this energy in the infrared-millimeter wavelengths. Most of the mass of the gas and dust in the Galaxy resides in PDRs (Hollenbach & Tielens, 1999). In the far infrared the most important cooling lines are the fine structure lines of [C ii] at 158 m, and [O i] at 63 & 145 m and to a lesser extent high- CO lines, while PAH emission and H2 lines dominate in the near- and mid-IR.
The Ophiuchi dark cloud complex is the nearest low- and intermediate-mass star forming region (see Wilking, Cagné & Allen (2008) for a recent review). The mean distance to Oph is 137.3 1.2 pc based on trigonometric parallax observations with the Very Long Baseline Array (VLBA), while the eastern streamer appears to be 10 pc further away (Ortiz-León et al., 2017). The most massive cores in Oph dark cloud complex are Oph A (Loren, Wootten, & Wilking, 1990) in L1688 and L1689 N, each of which is connected with a filamentary system of streamers extending to the north-east over tens of parsecs (e.g., Loren, 1989). While only little star formation activity is observed in the streamers, the westernmost core, Oph A, harbors a rich cluster of young stellar objects (YSOs) ranging from young Class 0 protostars to more evolved Class III objects and is distinguished by a high star-formation efficiency. Yui et al. (1993) did an extended [C ii] map with 15′ spatial resolution of the Ophiuchi dark cloud using the balloon-borne telescope BICE. They found extended [C ii] emission throughout the cloud (8 pc 6 pc) with the peak emission centered on the highly reddened B2 V star HD 147889 with perhaps minor contributions from the embedded B stars S 1 and SR 3.
Recently Larsson & Liseau (2017) have studied the Oph A region with HIFI and PACS on the Herschel Space Observatory together with archival ISO ISOCAM-CVF data. Their spectrophotometric ISOCAM observations of pure rotational lines of H2 and polycyclic aromatic hydrocarbon (PAH) molecules outline a clear spherical shell structure of warm PDR gas around the embedded star S 1 with a radius of 80″. The observations of the [O i] lines at 63 and 145 m using PACS show that not only do the [O i] lines mark the boundary seen in H2, but also show significant emission throughout the region around the exciting star S 1. The map of the line flux ratio shows remarkably low values in some regions, which suggests the presence of a cold foreground cloud that absorbs most of the 3P1–3P2 63 m radiation but leaves the higher level 3P0–3P1 145 m line unaffected. All the existing observations of the PDR tracers of the S 1 PDR unfortunately lack velocity information, hence the interplay between the cold foreground cloud and the warmer background PDR material is still unexplored.
In this paper we present velocity resolved [C ii] maps of an area around the S 1 PDR in Oph A. Here we aim to study the emission from the S 1 PDR to (a) understand the impact of the PDR if any on the molecular cloud to the west and (b) detect and characterize the foreground absorbing cloud observed in [O i].
2 Datasets
2.1 SOFIA
We have retrieved observations of the fine structure transition of ionized carbon (C+) at 1900.5369 GHz (157.74 m) and the [N ii] line at 1461.1338 GHz (205 m), of Oph A from the data archive of the Stratospheric Observatory for Infrared Astronomy (SOFIA Young et al., 2012). The observations (PI: Di Li) were done using the German REceiver for Astronomy at Terahertz frequencies (GREAT; Heyminck et al., 2012) on July 16 and 20, 2011. The beam size for [C ii] was 153 and the velocity resolution before smoothing was 0.029 km s-1, while the beamsize for [N ii] was 21″. The [C ii] map extends over a 220″200″ area and was done in total power on-the-fly mode. The map was divided into five sub-maps, each scanned in Dec, and sampled every 8″, with a step size between scans of 8″. The map was centered on (, ) = (16h 26m 2760, -24°23′563) (J2000) using an off-position at 16h 29m 49s0, -24°29′310 (J2000). We used a main beam efficiency of 0.51 and 0.54 (Heyminck et al., 2012) to convert the observed antenna temperatures to main beam brightness temperature () for [C ii] and [N ii], respectively. [N ii] was not detected anywhere in the map.
Finally we retrieved fully processed level 3 SOFIA/FORCAST images at 11.1, 19.7, 31.5, and 37.1 m (Herter et al., 2012). These were taken in dichroic mode on 2014-03-29 covering the S 1 field (Program ID: 02_0070/Lee Mundy). For a description of the FORCAST data reduction pipeline, see Herter et al. (2013).
2.2 JCMT Gould Belt Survey and ISOCAM data
For comparison with the [C ii] data, we have used maps of the =3–2 transition of CO, 13CO and C18O (White et al., 2015) and =4–3 transition of HCO+. The CO (and its isotopes) datacubes were kindly provided to us by Dr. Emily Daubrek-Maunder. The observations were taken using the Heterodyne Array Receiver Program (HARP)(Buckle et al., 2009) on the James Clerk Maxwell Telescope (JCMT)111The James Clerk Maxwell Telescope is operated by the East Asian Observatory on behalf of The National Astronomical Observatory of Japan; Academia Sinica Institute of Astronomy and Astrophysics; the Korea Astronomy and Space Science Institute; the Operation, Maintenance and Upgrading Fund for Astronomical Telescopes and Facility Instruments, budgeted from the Ministry of Finance (MOF) of China and administrated by the Chinese Academy of Sciences (CAS), as well as the National Key R&D Program of China (No. 2017YFA0402700). Additional funding support is provided by the Science and Technology Facilities Council of the United Kingdom and participating universities in the United Kingdom and Canada., Hawaii. The C18O, 13CO and CO = 3–2 rest frequencies are 329.3305525, 330.5879601 and 345.7959899 GHz, respectively. HARP has a beamsize of 14″ at 345 GHz. The CO(3–2) data have a spectral resolution of 1 km s-1, while the C18O and 13CO data have a resolution of 0.1 km s-1. The HCO+(4–3) data set, corresponding to the proposal M11AU13, was downloaded directly from the JCMT archive at the Canadian Astronomical Data Centre (CADC).
We have also retrieved fully processed ISOCAM image cubes (CAM1 & CAM4) including pipeline processed photometry of S 1 from the ISO Data Archive (Lorente, 2006).
3 FUV sources in the Oph A cloud
The Oph A cloud core is between the large reflection nebula illuminated by the B2 V star HD 147889 on the western side and the H ii region illuminated by the early B star S 1 on the eastern side with the embedded B9 - A0 V star SR 3 (Lada & Wilking, 1984) to the south, (see Fig. 1). In the Oph A core region there is another bright star 175″ west of S 1. This bright mid-IR source is GSS 30 IRS 1 (2MASS J16262138-2423040), a low mass Class I source illuminating a small bipolar reflection nebula (Weintraub et al., 1993). In the mm/sub-mm Oph A stands out as a north-south ridge of several bright dust condensations curving to the south-east at the southern end (André, Ward-Thompson & Barsony, 1993; Motte et al., 1998; Liseau et al., 2015). One of these sub-mm sources is VLA 1623, the prototypical Class 0 source (André, Ward-Thompson & Barsony, 1993), which drives a large, highly collimated jet in the NW-SE direction.
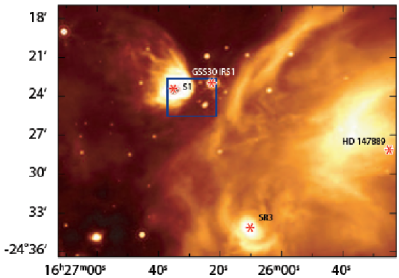
S 1: S 1 is an embedded early B star in the Oph A cloud at a distance of 1381.7 pc (Ortiz-León et al., 2017). It is the brightest near-IR source in Ophiuchus (Grasdalen, Strom, & Strom, 1973) and a strong X-ray source (Montmerle et al., 1983). It was first detected as a radio source in Oph by Brown & Zuckerman (1975) (BZ #4), who suggested that it was a compact H ii region ionized by a B3 star. A detailed VLA study by André et al. (1988) at 5 and 15 GHz in the C/D hybrid configuration showed that the radio emission originates from a nonthermal unresolved core surrounded by a thermal extended halo. They inferred that the compact nonthermal emission is gyrosynchrotron emission from an extended magnetosphere around the star, while the the halo is free-free emission from an optically thin H ii region. From the observed free-free emission, 4 mJy, at 5 GHz, and a half power radius of 10″, they derived a spectral type of B3.5 (ZAMS) with an effective temperature of Teff = 17,000 K. The multi-epoch VLBI trigonometric parallax study (Ortiz-León et al., 2017) resolves S 1 into a binary with a separation of 20 – 30 mas consistent with near-IR lunar occultations by Richichi et al. (1994); Simon et al. (1995), who found S 1 to have a late type secondary with a projected distance of 20 mas. From an orbit analysis of the VLBA data Ortiz-León et al. (2017) derive a mass of 5.8 for the primary and 1.2 for the secondary. These mass estimates correspond roughly to B4V and F5V spectral types.
S 1 is too faint in the optical (V = 16.5 mag) to allow accurate spectral classification. Cohen & Kuhi (1979) did not detect H at all and assigned it a spectral class of B2. Later, based on the equivalent width of the H line, Bouvier & Appenzeller (1992) classified it as a B4 star, while Wilking et al. (2005) suggested a spectral type of B3. The star is very bright in the near-IR and barely visible in the mid-IR, where the emission is completely dominated by the surrounding reflection nebula, which saturates the MIPS image close to S 1, see Fig. 1. It was not detected in any of the WISE bands. Lada & Wilking (1984) used ground based near and mid-IR photometry to determine the bolometric luminosity of S 1. They found no IR excess for the star after dereddening the observed flux densities with 12 mag of visual extinction. By fitting a blackbody curve to the extinction corrected spectral energy distribution they derived an effective temperature, Teff = 16000 K, and a luminosity, L = 1100 (corrected for a distance of 140 pc).
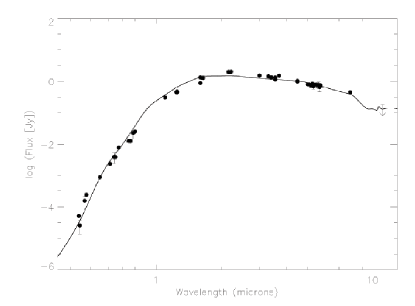
Using the VizieR photometry viewer, we have compiled all available photometric measurements (with uncertainties) of S 1. The measurements include values in the Johnson optical (B band) and near-infrared (JHK) filters, POSS filters (J, F, i), Gaia G band filter, PanStarrs optical (g, r, i) filters, SDSS optical (i′) filter, Elias near-infrared (J, H, K, L′) filters, 2MASS near-infrared (J, H, Ks) filters, IRAC infrared (3.6, 4.5, 5.8, and 8.0 m) filters, NICMOS near-infrared (1.10 and 1.60 m) filters, ISOCAM (CAM1: 3.0, 3.3, and 3.7 m; CAM4: 5.0 - 5,7 m). Analysis of the FORCAST images show that S 1 is undetected in all filters. The 3- upper limit at 11.1 m is 180 mJy. We then attempted to fit the resulting spectral energy distribution with a blackbody function with reddening. We adopted the Rieke & Lebofsky (1985); Rieke, Rieke & Paul (1989) extinction curve. A straightforward fit to the data, for a fixed distance of 138 pc, but without constraints on the reddening, radius, or temperature, does not yield results that are consistent with either main sequence stellar parameters or previous determinations of the extinction or spectral type for S 1.
Because the reddening appears to be so large, the photometric data
provide relatively little power to constrain the stellar temperature.
Therefore we fixed the temperature at 17000 K, corresponding to that for
a B4V star. For consistency, we also fixed the radius to be that
appropriate for a B4V star (4.35 R⊙; Schmidt-Kaler 1982). This
leaves the reddening, , as a free parameter. While a total
optical reddening value of AV 12 mag, consistent with
previous determinations, then provides a reasonable fit to the optical
data, we find that the model overestimates the photometric observations
in the near-infrared. In fact, we find that no value of the reddening
with the standard extinction law yields a model that can adequately fit
all of the photometric data. Various authors have claimed that the
reddening law towards the Ophiuchus cloud is non-standard, with values
of as high as 4.2 reported (Chini, 1981; Andersson & Potter, 2007; Lee et al., 2018).
Therefore we allowed the value to vary along with the
value. With the adopted stellar parameters, we find that and provides a good representation of all the
photometric data points from the optical out to 10 m, and is
consistent with our measured upper limit at 11.1 m (see Fig.
2). These values correspond to a total extinction in the
optical of mag. A slightly larger value of the total
reddening () is required to fit the data if an earlier
spectral type (B3V) is adopted, but again a non-standard value of
3.4 is necessary. Both of these RV values are consistent with the
angular variations in RV found by Lee et al. (2018) for the Oph
cloud complex.
GSS 30 IRS 1: This is a deeply embedded low-mass Class I protostar, which illuminates a bipolar reflection nebula and drives a molecular outflow. Je et al. (2015) did a full range scan of GSS 30 IRS 1 with Herschel/PACS and found extended emission in both [O i] and [C ii]. The [O i] emission is most likely shock excited, while the [C ii] emission is PDR emission from the reflection nebula. Je et al. (2015) estimate the far-ultraviolet radiation field is in the range 3 to 20 G0, where G0 is in units of the Habing field, defined as =1.610-3 erg cm-2 s-1 (Habing, 1968).
3.1 S 1 PDR
S 1 has created a large cigar shaped “cavity”, which may extend as far as 550″ to the east northeast, and 80″ to the west southwest, where the expansion is blocked by the dense surrounding molecular cloud, see Fig. 1. The projected major axis of the reflection/emission nebula is therefore 0.6 pc. The morphology of the S 1 reflection nebula resembles NGC 2023 (Sandell et al., 2015), i.e., both show ellipsoidal cavities, which interact strongly with the surrounding dense molecular cloud and expand more freely to the opposite side of the nebula, where the density of the surrounding cloud is much lower. As found in NGC 2023 we see filaments and lumpy ridges in the IRAC images, where the S 1 reflection nebula expands into the dense molecular cloud, suggesting that the dense surrounding cloud is clumpy. There is a bright ridge 20″ south of S 1, which dominates the emission in the mid-IR. The [C ii] emission in our map is completely dominated by the reflection nebulosity illuminated by S 1, although there may be some marginal contribution from GSS 30. The same is true for [O i], even though one can also see faint [O i] emission from shock excited [O i] in the VLA 1623 outflow and even stronger emission from GSS 30. (Larsson & Liseau, 2017; Nisini et al., 2015; Je et al., 2015).
4 Results
Figure 3 shows comparison of measured [C ii] intensity distribution integrated over the velocity interval 0–10 km s-1 with emission from other PDR tracers (8 m dust continuum and [O i] at 63 m) and from molecular material at moderate (CO(3–2) and its isotopes) and high densities (HCO+(4–3)). The emission distribution of the PDR tracers is markedly different from the molecular gas tracers. Among the molecular gas tracers the CO(3–2) emission is detected over the whole area and does not seem to trace the PDR emission at all. The strongest CO emission comes from the blue outflow lobe powered by the Class 0 source VLA 1623. There is strong HCO+(4–3) emission from the dense cores in the Oph A ridge. Additionally, HCO+ outlines the dense compressed gas layer to the west and south, where the PDR shell is expanding into the dense molecular cloud. The [C ii] emission is completely dominated by the strong PDR emission from the emission/reflection nebula surrounding S 1 with only faint emission west of the S 1 PDR. This faint [C ii] emission is probably mostly from the surface layers of the molecular cloud, possibly enhanced by FUV radiation from GSS 30 IRS 1. The 8 m emission, which is dominated by PDR emission is strikingly similar to [C ii], [C ii] and 8 m emission both peak west and south of S 1. The [O i] emission is also dominated by the S 1 PDR similar to [C ii]. However, [O i] also clearly shows shock excited emission from the bipolar outflows powered by VLA 1623 and GSS 30, where the [C ii] emission is faint or completely absent. Additionally [O i] shows a spur (protrusion) of emission sticking out of the PDR shell approximately straight west from S 1. This feature appears to be real, since it is also seen in the [O i] map analyzed by Nisini et al. (2015). It is not evident in the integrated [C ii] image, although there is a hint of it in the [C ii] channel maps (Fig 3) at +2 km s-1. In the H2 emission observed with ISOCAM-CVF (Larsson & Liseau, 2017) the hot PDR shell is completely dominating, but especially in the S2 line we can also see additional H2 emission inside the PDR region, particularly in the southwestern part of the PDR.
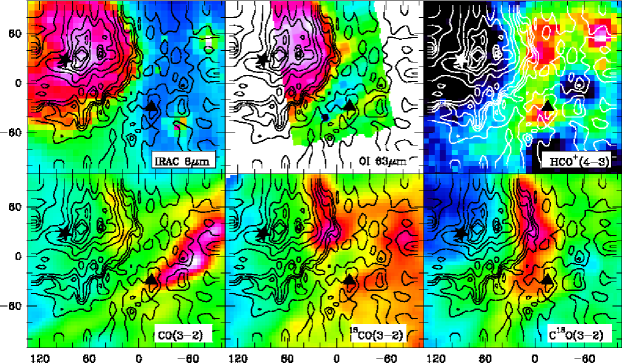
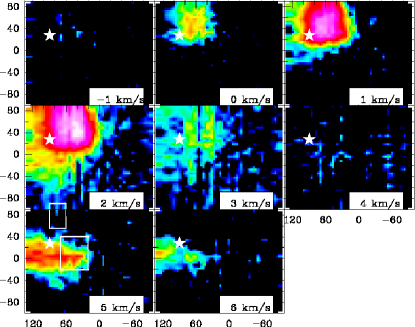
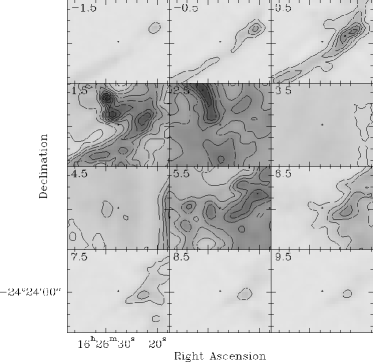
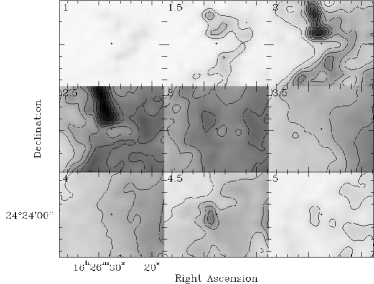
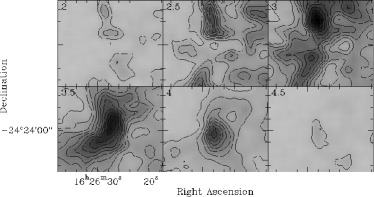
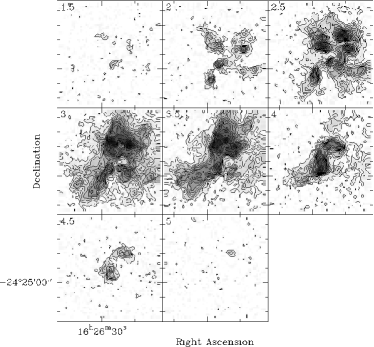
Figure 4 presents channel maps of 1 km s-1 wide velocity bins ranging from -1 km s-1 to 6 km s-1. The maps clearly show the two main velocity peaks, the first between 0–3 km s-1 and the second 5–6 km s-1. Comparison of the [C ii] channel maps with the CO (and its isotopologues) channels show that the higher velocity component is detected only in CO(3–2) and not in the rarer isotopologues (Fig. 9,10,11). HCO+(4–3) is our only high density tracer, ncrit = 2 - 3 cm-3 (Shirley, 2015), and the only line, perhaps with the exception of C18O, which is unaffected by self-absorption. The upper energy level, Eu/k = 42.8 K, however, is rather low. Therefore the emission is dominated by the dense cold cores in the Oph A cloud, which is seen both in the integrated intensity map (Fig.3) as well as in the channel maps (Fig. 12).
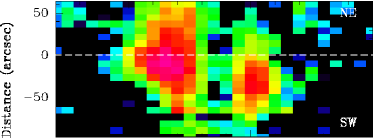
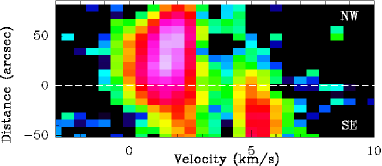
The position-velocity diagrams derived for cuts at position angles of -135∘ and -45∘ show that the [C ii] lines are broader towards the center of the S 1 nebula and narrower towards the PDR shell (Fig. 5). This suggests that the [C ii] emission has contribution from the entire C II region as well as the front and back of the PDR shell. The [C ii] emission is dominantly blue-shifted relative to the systemic velocity, indicating that the emission is dominated by photo evaporation flows from the dense PDR shell. Such emission would be blue-shifted if the densest PDR region is behind the star, i.e. the reflection nebula is inclined towards the line of sight, so that the large extended lobe northeast of the star is largely coming towards us. Unfortunately our [C ii] map does not cover the eastern part of the nebula. Therefore we cannot confirm the proposed geometry of the reflection nebula from the existing data sets.
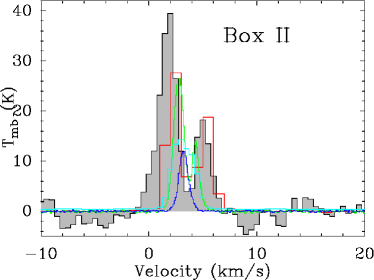
Figure 6 show the [C ii] spectrum averaged over the two regions shown in Fig. 4, compared with the average spectra of CO and its isotopes over the same region. We find that in Box 1, located to the north, only CO(3–2) and [C ii] show double peaked spectra, while there is a hint of a shoulder in 13CO(3–2). C18O(3–2) shows a single-peaked spectrum. The strongest hyperfine component of [13C ii], i.e. F = 2–1, red-shifted by 11.2 km s-1, is also detected with a peak temperature of K, suggesting that the [C ii] emission is optically thick in most of the region. A Gaussian fit of the [13C ii] component gives a VLSR = 3.1 km s-1 (relative to the rest frequency of the F = 2–1 line). We get exactly the same velocity for C18O, confirming that both CO and [C ii] are strongly self-absorbed. The ratio of the integrated intensities of [C ii] and 13[C ii] F = 2–1 is . The intensity of the F = 2–1 transition of [13C ii] is 0.625 of the total [13C ii] intensity. Thus, the ratio of intensities of [C ii] to [13C ii] is , which corresponds to an optical depth of 3.7 for [C ii]. Further based on the two-component LTE model (Table 1) for the emission (background) component we had derived N(C+) = 5.61018 cm-2. This N(C+) corresponds to an optical depths of 1.6 and 6, for temperatures of 300 K (typical PDR temperature) and 80 K ( derived from the LTE analysis) respectively. This confirms that [C ii] is optically thick and it is not possible to discern any depletion of 13C+ due to fractionation. For Box 2, which is south of S 1, the self-absorption, is even more striking and seen in 13CO as well. Here there is only a hint of the [13C ii] F = 2–1 hyperfine component, because some of the spectra had rather poor baselines. However, as in Box 1, C18O peaks in the middle of the self-absorption confirming that double peaked spectra are caused by self-absorption from cold foreground gas. We discuss the foreground absorption in more detail in Sec. 5.

5 The self-absorbing C+ cloud
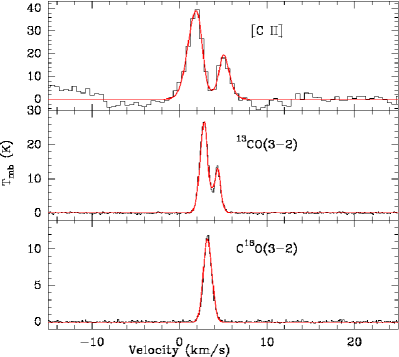
The available velocity resolution of the [C ii] data has enabled the detection of strongly self-absorbed spectral profiles over an extended region in the S 1 PDR of Oph A. This absoprtion dip is consistent with the results of spectrally unresolved observations of the two fine-structure transitions of [O i] at 63 and 145 m, which had also suggested the presence of a foreground absorbing cloud. Here, we take advantage of the available velocity information and characterize the background and foreground cloud using a two-layer Local Thermodynamic Equilibrium (LTE) model. We used the CASSIS222http://cassis.irap.omp.eu software (Vastel et al., 2015), to model the average spectral profiles of [C ii], 13CO(3–2) and C18O(3–2) assuming a warm background and a colder foreground component (Fig. 7). CASSIS allows a combined fit of the two components to the observed spectrum of a species with the following adjustable parameters: column density (), excitation temperature (), , FWHM of the line () and size of the source (). We have assumed both components to be Gaussians. The results of the fit are presented in Table 1. We find that the relative abundance of the C18O and 13CO molecules in the two components are significantly different. For the warmer component the ratio is , while it is for the colder component, showing that 13CO is significantly optically thick both in the foreground and the background cloud. We can convert the derived C18O column densities (Table 1) to total column densities using the empirical relationship derived by Frerking, Langer & Wilson (1982) for Oph:
which gives us 9.3 1021 cm-2 and 5.6 1022 cm-2 for the foreground and background cloud, respectively. If we take the derived foreground column density and transform it to visual extinction assuming normal gas to dust ratio, i.e., H2)/AV = 0.94 1021 molecules cm-2 mag-1 (Bohlin et al., 1978; Frerking, Langer & Wilson, 1982), we get an extinction of 9.9 mag. This is lower than the estimated reddening towards S 1, = 12.7 mag, see Sect. 3. This is to be expected, since C18O does not trace the hot gas in the PDR. We can get a rough estimate for the column density of the gas in the PDR by using the derived (C+) for the foreground [C ii] (Table 1). If we assume that most of the carbon is ionized, i.e. [C/H] = 10-4, we get H2) = 5.3 1021 cm-2, or 5.6 mag. This is almost certainly an overestimate, since some of the carbon is likely to be neutral or tied up in molecules like CO.
| Species | |||||
|---|---|---|---|---|---|
| km s-1 | km s-1 | K | cm-2 | ″ | |
| C+ | 3.10.1 | 2.70.2 | 80.87.0 | (5.62.3) 1018 | 50 |
| 3.70.1 | 1.60.1 | 10.50.3 | (5.30.8) 1017 | 30 | |
| 13CO | 3.40.1 | 1.50.1 | 66.310.5 | (7.50.1) 1016 | 435 |
| 3.70.1 | 0.90.1 | 6.81.3 | (1.30.1) 1016 | 31.22.1 | |
| C18O | 3.30.1 | 1.10.1 | 70 | (8.90.5) 1015 | 50 |
| 3.60.1 | 0.80.1 | 12 | (9.23.3) 1014 | 30.10.1 |
6 Discussion
[C ii] and [O i] are some of the best tracers of PDRs (Hollenbach & Tielens, 1999), since they cover a large range of physical condition present in many PDRs. The [C ii] 158 m line, assumed to be largely optically thin, can be used to determine the total mass of the emitting gas. However, with the advent of the high spectral resolution spectrometers like Herschel/HIFI and SOFIA/GREAT there has been a paradigm shift in our understanding of the abundance and ubiquity of C+. Not only was the [C ii] line found to be optically thick, a fact often clearly substantiated by the detection of hyperfine lines of 13C+ (Ossenkopf et al., 2013), but a significant fraction of C+ emission was found to arise from the ISM where no corresponding CO emission was detected in both our Galaxy (GOTC+ Langer et al., 2010) and external galaxies (Mookerjea et al., 2016).
Our [C ii] observations of Oph-A with SOFIA/GREAT has also provided useful insight into the distribution of the PDR material, particularly in the region around the B-type star S 1. Unlike the emission from CO (and its isotopes) and to some extent [O i] the [C ii] emission is completely dominated by the emission/reflection nebula illuminated by S 1. This suggests that the observed [C ii] emission is primarily due to the FUV radiation from S 1 with a negligible contribution from HD 17889. The PDR is a slightly asymmetric sphere which is pressure-bound to the south and west due to the enhanced density of the dense Oph-A molecular cloud and has an average radius of 80″. It almost certainly extends much further to the northeast (see Fig. 1), where the [C ii] emission has not yet been observed.
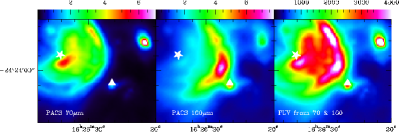
Because we only have velocity resolved C+ spectra of the PDR emitted region, the two-component (emission and absorption) model fitted to the [C ii] emission is not well constrained. There is a possible degeneracy between the column density of C+ and the size of the emission region. Our current model shows consistent excitation temperatures and sizes for [C ii] and the CO lines, although owing to the complication of the presence of the foreground absorption, the intrinsic [C ii] emission is not well constrained. Graf et al. (2012) detected similar optically thick [C ii] lines affected by strong self-absorption in NGC 2024 and estimated a very high value of (C+)= 1.6 cm-2. For the foreground cloud in NGC 2024 these authors estimated (C+) cm-2 for a gas temperature above 40 K, but this is a very extreme region. The (C+) we obtain for the foreground and background clouds in the S 1 PDR are about 50% of the column densities estimated for NGC 2024 and the temperatures we estimate are also much lower. Using the stellar parameters for S 1 Larsson & Liseau (2017) estimated the FUV flux in the PDR to be 5000 G0. In another method we first estimated the total far-infrared (FIR) intensity from the PACS 70 and 160 m flux densities (Fig 8) following the method described by Roccatagliata et al. (2013). Next we assumed that the FUV energy absorbed by the grains is re-radiated in the far-infrared (Mookerjea et al., 2011) and estimated the FUV flux, (6 eV h 13.6 eV) impinging onto the cloud surfaces from the emergent FIR intensities () using (expressed in units of G0)= 4 . From the second approach, we find the FUV intensity at the position = +65″, = +58″ to be 3100 G0. The [OI(145)]/[OI(63)] ratio at this position is 0.15, which is much larger than the typical ratio of 0.05–0.1 found in PDRs when both lines are optically thin. Larsson & Liseau (2017) explained the high values of [OI(145)]/[OI(63)] ratio to be due to [O i](63) being partially absorbed by a cold foreground cloud, while [O i](145) remained unaffected. Our observations support this conjecture. The OI(145) emission, however, should mostly be optically thin. We can therefore use the [O i](145)]/[C ii] ratio and compare it to predictions of the plane-parallel PDR model by Kaufman et al. (2006). At this position the [O i](145)]/[C ii] ratio is 0.27 (in energy units), which for the FUV intensities of 3000 and 5000 G0 correspond to the densities of 4 cm-3 and 3 cm-3 respectively. This matches very well with the critical density of the 158 m transition of [C ii]. The critical density of the [O i] 145 m transition however is cm-3, suggesting that [O i] mostly comes from high density gas compressed between the [C ii] emitting gas and the surrounding dense molecular cloud. For the above mentioned results the plane-parallel PDR model predicts an integrated intensity of 100 K km s-1 for the [C ii] line. The background component for the two-component LTE model fitted to the observed spectrum corresponds to an integrated intensity of 170 K km s-1. This suggests the existence of multiple [C ii] emitting PDR surfaces in contrast to a single PDR slab, and is consistent with the scenario in which high density clumps with PDR surfaces emitting both [C ii] and [O i](145) and low density PDR gas emitting only [C ii] co-exist.
In this analysis, we have assumed that the entire [C ii] emission arises from neutral PDR. However since carbon has an ionization potential of 11.26 eV, C+ is also likely to exist in the H ii region, and this will contribute to some extent to the observed [C ii] emission. As detailed in Sec. 3, based on radio observations the emission from the H ii region is rather faint, 4 mJy at 5 GHz. The diameter of the H ii region 20″, which is more than three times smaller than the strongest emission feature observed in [C ii] and the other PDR tracers. These indicate that the contribution of the H ii region to the [C ii] emission is likely to be insignificant, although an accurate estimate of not being available direct comparison with the models by Abel (2006) is not possible. An alternative method, is to compare with the fine-structure transitions of N+ at 122 and 205 m, since these lines arise only in the H ii region and have excitation condition and critical density similar to that of [C ii]. For this purpose we have used the GREAT/SOFIA observations of the 205 m [N ii] spectra. We do not have any detection of the 205 m line in the entire observed region good to an r.m.s. of integrated intensity of 0.7 K km s-1. Abel (2006) showed that the [C ii] intensities originating from H ii regions and the intensities of the [N ii] 205 m line are tightly correlated following the relation (erg cm-2 s-1). Considering the [N ii] (205 m) beamsize of 21″, for the upper limit of [N ii] intensity being 0.7 K km s-1, we obtain K km s-1. The peak integrated intensity of the observed [C ii] map is 183 K km s-1 and goes down to about 130 km s-1 in a radius of 20″ (upper limit on the size of the H ii region) from the peak position. Thus we derive an upper limit of 12-17% for the contribution of the H ii region to the [C ii] emission. Given that the contribution is low and is also an upper limit, we conclude that our assumption that the entire [C ii] arises from the neutral PDR does not affect the outcome of PDR models.
7 Summary & Conclusion
We have used the velocity information of the [C ii] data observed with SOFIA/GREAT to obtain a cohesive picture of the geometry and illumination of the PDR around S 1 in Ophiuchus. The [C ii] emission appears to arise from both photo-evaporated flow from the dense PDR shell as well as from ionized gas inside the PDR shell. The [C ii] emitting PDR is of moderate density ( cm-3), while the 63 and 145 m emission of [O i] requires much higher densities, i.e., it is mostly coming from the compressed neutral layer between the ionized C+ gas and the dense surrounding cloud as well as from dense clumps embedded in the diffuse ionized gas. The [C ii] map was observed during the Early Science phase of SOFIA and does not cover the nebula to the north-east, which prohibits us from fully constraining the geometry of the C ii region excited by S 1. With the Low Frequency Array (LFA) (Risacher et al., 2016), which is a 2 7 pixel LFA array, where each pixel is about four times as sensitive as the L2 receiver used in Early Science, one can map the whole S 1 reflection nebula with significantly higher S/N in a fraction of the time it took to obtain the [C ii] map discussed here. Since the LFA array is operated in parallel with the High Frequency Array (HFA) in upGREAT, one will additionally get velocity resolved [O i] 63 m the same time. The only thing missing to fully characterize the PDR emitting regions is high-J CO lines, which will be quite strong in the PDR shell. We know from our work on NGC 2023 (Sandell et al., 2015) that the hot molecular gas in the PDR starts to dominate from J = 6–5 upwards. CO(6–5), (7–6), and (8–7) can be observed with ground based telescopes, while upGREAT on SOFIA can observe higher J transitions starting from CO(11–10). To accurately determine the density and temperature of the hot molecular PDR emission we therefore need follow up observations of high-J CO transitions both with ground based telescopes and SOFIA.
Acknowledgements.
Based on observations made with the NASA/DLR Stratospheric Observatory for Infrared Astronomy (SOFIA). SOFIA is jointly operated by the Universities Space Research Association, Inc. (USRA), under NASA contract NAS2-97001, and the Deutsches SOFIA Institut (DSI) under DLR contract 50 OK 0901 to the University of Stuttgart. The development of GREAT was financed by the participating institutes, by the Federal Ministry of Economics and Technology via the German Space Agency (DLR) under Grants 50 OK 1102, 50 OK 1103 and 50 OK 1104 and within the Collaborative Research Centre 956, sub-projects D2 and D3, funded by the Deutsche Forschungsgemeinschaft (DFG). This research has made use of the VizieR catalogue access tool, CDS, Strasbourg, France. The original description of the VizieR service was published in A&AS 143, 23.References
- Abel (2006) Abel, N. P. 2006, MNRAS, 368, 1949
- Andersson & Potter (2007) Andersson, B.-G., & Potter, S. B. 2007, ApJ, 665, 369
- André, Ward-Thompson & Barsony (1993) André, P., Ward-Thompson, D., Barsony, M. 1993, ApJ, 406, 122
- André et al. (1988) André, P., Montmerle, T., Feigelson, E. D., et al. 1988, ApJ, 335, 940
- Bohlin et al. (1978) Bohlin, R. C., Savage, B. D., & Drake, J. F. 1978, ApJ, 224, 132
- Bouvier & Appenzeller (1992) Bouvier, J., & Appenzeller, I. 1992, A&AS, 92, 481
- Brown & Zuckerman (1975) Brown, R. L., & Zuckerman, B. 1975, ApJ, 202, L125
- Buckle et al. (2009) Buckle, J. V., Hills, R. E., Smith, H., et al. 2009, MNRAS, 399, 1026
- Chini (1981) Chini, R. 1981, A&A, 99, 346
- Cohen & Kuhi (1979) Cohen, M., & Kuhi, L. V. 1979, ApJS, 41, 743
- Frerking, Langer & Wilson (1982) Frerking, M. A., Langer, W. D., & Wilson, R. W. 1982, ApJ, 262, 590
- Graf et al. (2012) Graf, U. U., Simon, R., Stutzki, J., et al. 2012, A&A, 542, L16
- Grasdalen, Strom, & Strom (1973) Grasdalen, G. L., Strom, K. M., & Strom, S. E. 1973, ApJ, 184, L53
- Habing (1968) Habing, H. J. 1968, Bull. Astron. Inst. Netherlands, 19, 421
- Herter et al. (2013) Herter, T. L., Vacca, W. D., Adams, J. D., et al. 2013, PASP, 125, 1393
- Herter et al. (2012) Herter, T. L., Adams, J. D., De Buizer, J. M., et al. 2012, ApJ, 749, L18
- Heyminck et al. (2012) Heyminck, S., Graf, U. U., Güsten, R., et al. 2012, A&A, 542, L1
- Hohle, Neuhäuser & Schutz (2010) Hohle, M. M., Neuhäuser, R., & Schutz, B. F. 2010, Astron. Nachr., 331, 349
- Hollenbach & Tielens (1999) Hollenbach, D. A., & Tielens, A. G. G. M. 1999 Rev. of Modern Physics, 71, 173
- Kaufman et al. (2006) Kaufman, M. J., Wolfire, M. G., & Hollenbach, D. J. 2006, ApJ, 644, 283
- Je et al. (2015) Je, H., Lee, J.-E., Lee, S., et al. 2015, ApJS, 217, 6
- Lada & Wilking (1984) Lada, C. J., & Wilking, B. A. 1984, ApJ, 287, 610
- Langer et al. (2010) Langer, W. D., Velusamy, T., Pineda, J. L., et al. 2010, A&A, 521, L17
- Larsson & Liseau (2017) Larsson, B., & Liseau, R. 2017, A&A, 608, A133
- Lee et al. (2018) Lee, A., Green, G. M., Schlafly, E. F., et al. 2018, ApJ, 854, 79
- Liseau et al. (2015) Liseau, R., Larsson, B., Luntilla, T., et al. 2015, A&A, 578, A131
- Loren (1989) Loren, R. B., 1989, ApJ, 338, 902
- Loren, Wootten, & Wilking (1990) Loren, R. B., Wootten, A., & Wilking, B. A. 1990, ApJ, 365, 269
-
Lorente (2006)
Lorente, B. 2006 ”VO compliant CAM products” memo at
https://www.cosmos.esa.int/web/iso/guide-to-iso-data-products - Montmerle et al. (1983) Montmerle, T., Koch-Miramont, L., Falgarone, E., et al. 1983, ApJ, 269, 182
- Mookerjea et al. (2016) Mookerjea, B., Kramer, C., Buchbender, C., et al. 2011, A&A, 586, A37
- Mookerjea et al. (2011) Mookerjea, B., Israel, F., Kramer, C., et al. 2016, A&A, 532, A152
- Motte et al. (1998) Motte, F., André, P., & Neri, R. 1998, A&A, 336, 150
- Nisini et al. (2015) Nisini, B., Santangelo, G., Giannini, T., et al. 2015, ApJ, 801,121
- Ortiz-León et al. (2017) Ortiz-León, G. N., Loinard, L., Kounkel, M. A., et al. 2017, ApJ, 834, 141
- Ossenkopf et al. (2013) Ossenkopf, V., Röllig, M., Neufeld, D. A., et al. 2013, A&A, 550, A57
- Padgett et al. (2008) Padgett, D. L., Rebull, L. M., Stapelfeldt, K. R., et al. 2008, ApJ, 672, 1013
- Palmeirim et al. (2013) Palmeirim, P., André, P., Kirk, J., et al. 2013, A&A, 550, A38
- Richichi et al. (1994) Richichi, A., Leinert, Ch., Jameson, R., & Zinnecker, H. 1994, A&A, 287, 145
- Rieke, Rieke & Paul (1989) Rieke, G. H., Rieke, M. J., & Paul, A. E. 1989, ApJ, 336, 752
- Rieke & Lebofsky (1985) Rieke, G. H., & Lebofsky, M. J. 1985, ApJ, 288, 618
- Risacher et al. (2016) Risacher, C., Güsten, R., & Stutzki, J., et al. 2016, A&A, 595, A34
- Roccatagliata et al. (2013) Roccatagliata, V., Preibisch, T., Ratzka, T., & Gaczkowski, B. 2013, A&A, 554, A6
- Sandell et al. (2015) Sandell, G., Mookerjea, B., Güsten, R., et al. 2015, A&A, 578, A41
- Shirley (2015) Shirley, Y. L. 2015 PASP, 127, 299
- Simon et al. (1995) Simon, M., Ghez, A. M., Leinert, Ch., et al. 1995, ApJ, 443, 625
- Schmidt-Kaler (1982) Schmidt-Kaler, Th. 1982 , Landolt-Bornstein New Series, Vol. 2b, Springer Verlag, New York
- Tielens & Hollenbach (1985) Tielens, A. G. G. M., & Hollenbach, D. 1985, ApJ, 291, 722
- Vastel et al. (2015) Vastel, C., Bottinelli, S., Caux, E., Glorian, J.-M., & Boiziot, M. 2015, SF2A-2015: Proceedings of the Annual meeting of the French Society of Astronomy and Astrophysics, 313
- Vuong et al. (2003) Vuong, M. H., Montmerle, T., Grosso, N., et al. 2003, A&A, 408, 581
- Weintraub et al. (1993) Weintraub, D. A., Kastner, J. H., Griffith, L. L., et al. 1993, AJ, 105, 271
- White et al. (2015) White, G. J., Drabek-Maunder, E., Rosolowsky, E., et al. 2015, MNRAS, 447, 1996
- Wilking, Cagné & Allen (2008) Wilking, B. A., Cagné, M., & Allen, L. E. 2008, in Handbook of Star Forming Regions, Vol. 2, ed. B. Reipurth (San Francisco, CA ASP), 351
- Wilking et al. (2005) Wilking, B. A., Meyer, M. R., Robinson, J. G., et al. 2005, AJ, 130, 1733
- Wilson & Rood (1994) Wilson, T. L., & Rood, R. 1994, ARA&A, 32, 191
- Young et al. (2012) Young, E. T., Becklin, E. E., Marcum, P. M., et al. 2012, ApJ, 749, L17
- Yui et al. (1993) Yui, Y. Y., Nakagawa, T., Doi, Y, et al. 1993, ApJ, 419, L37
Appendix A PACS continuum images and derived FUV intensity map
Appendix B Channel Maps for Molecular Tracers