A system architecture for parallel analysis of flux-balanced
metabolic pathways
Mona Arabzadeh1, Mehdi Sedighi1, Morteza Saheb Zamani1,
and Sayed-Amir Marashi2
1Department of Computer Engineering and Information Technology,
Amirkabir University of Technology, Tehran, Iran and
2Department of Biotechnology, College of Science, University of Tehran, Tehran, Iran.
{m.arabzadeh,msedighi,szamani}@aut.ac.ir, marashi@ut.ac.ir
Abstract
Elementary flux mode (EFM) analysis is a well-studied method in constraint-based modeling of metabolic networks. In EFM analysis, a network is decomposed into minimal functional pathways based on the assumption of balanced metabolic fluxes. In this paper, a system architecture is proposed that approximately models the functionality of metabolic networks. The AND/OR graph model is used to represent the metabolic network and each processing element in the system emulates the functionality of a metabolite. The system is implemented on a graphics processing unit (GPU) as the hardware platform using CUDA environment. The proposed architecture takes advantage of the inherent parallelism in the network structure in terms of both pathway and metabolite traversal. The function of each element is defined such that it can find flux-balanced pathways. Pathways in both small and large metabolic networks are applied to the proposed architecture and the results are discussed.
Keywords: Elementary Flux Mode (EFM); Graph Data Model; Graphics Processing Unit (GPU); Metabolic Pathways
1 Introduction
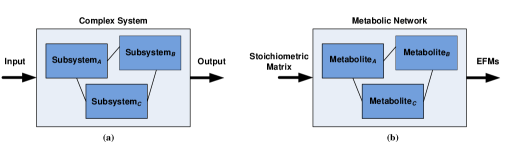
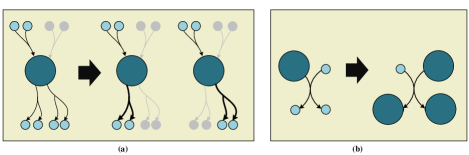
System architecture is defined as a generic discipline to handle “systems” considered as existing or to be created objects [1]. The main purpose of this modeling is to support reasoning about the structural behavior and properties of the objects. System architecture helps to consistently describe and efficiently design complex systems such as an industrial system or an organization which can be comprise of smaller parts called “subsystems” as shown in Fig 1-a. In the proposed method, each subsystem is considered as a metabolite. The approach is extensively described in Section 3.
Systems biology, known as the system-level integration of experimental and computational studies in biology, plays a significant role in understanding complex network systems [2]. In biological systems, functions emerge both from the elements and the network interconnections. This underscores the importance of computational analysis to extract useful information from biological data.
Reconstruction of genome-scale metabolic network models, which are among the best-studied models in biotechnology, is possible by collecting the gene-protein-reaction information from related biochemical databases, genome annotations and literature [3]. Imposing constraints on the fluxes of a reconstructed biochemical network results in the definition of achievable cellular metabolic functions [4]. Several mathematical representations of constraints are typically used for constraint-based modeling of metabolic networks, including flux-balance constraints (e.g., conservation of metabolic fluxes) and flux bounds. The former means the network should be at the steady-state condition and the latter limits the numerical ranges of network parameters such as the minimum and maximum range of fluxes for each reaction.
Elementary flux mode (EFM) analysis is a well-studied method in constraint-based modeling of metabolic networks. In EFM analysis, a network is decomposed into minimal functional pathways [5] based on the assumption of balanced metabolic fluxes. All various analogous concepts for generating flux vectors of a network, like extreme pathways [6]) and minimal generating vectors [7], produce a subset of EFMs.
The use of EFM analysis [8, 9] is of interest in several biological applications. Bioengineering [10], phenotypic characterization [11], drug target prediction [12] and strain design [13] can be mentioned among these applications.
Double-description is a technique to enumerate all extreme rays of a polyhedral cone that is widely used in finding EFMs. Some of these methods use the stoichiometric matrix itself [8] and some others use the null-space of the stoichiometric matrix to generate EFM candidates [14, 15, 16]. Computational approaches have been proposed to speed up double-description-based methods to compute EFMs [17, 18] and some of them led to the development of computational tools such as Metatool [19] and EFMtool [18]. Some recent methods, such as [20], try to bring the insights of graph-theory to generating EFM candidates. Hardware platforms such as GPUs are also used as accelerators to speed up the process of generating candidates [21]. Besides, methods that explore a set of EFMs with specific properties, such as -shortest EFMs [22], or EFMs with a given set of target reactions [23], have been proposed based on linear programming.
The main focus of this paper is to propose a system architecture based on the AND/OR graph data model [24]. In the AND/OR graph representation of a metabolic network, metabolites are considered as graph nodes and connected to each other through hyperarcs which model as reactions. The input of this system is the stoichiometric matrix of the given metabolic network. Its output is the set of EFMs of the network as shown in Fig 1-b. The term systems biology should not be confused with system architecture. “Systems biology” is a general term which is used for describing the holistic view of a biological entity. In systems biology, finding EFMs is a classical problem which can help in understanding the global behavior of metabolism. Here, the problem of finding EFMs in the context of systems biology is modeled as a system architecture. The smallest repetitive part of the system is considered as a module that emulates the function of a metabolite to find the set of minimal flux-balanced pathways known as EFMs. The system has a network topology that enables a parallelizable computational scheme. Designing a model to map a biological network to a hardware platform to take advantage of the potential multicore computational power, and not necessarily just a hardware accelerator, is the main contribution of this paper. The underlying innovation in our proposed method is not in a parallel computing implementation of the existing algorithms. Instead, we consider a metabolic network as a system with seemingly independent subsystems that have very intricate relationships with their surroundings. While each subsystem is acting in parallel with the other ones, it is tightly coupled with the rest in terms of the inputs it receives and outputs it generates. We call this architectural or topology-based parallelism. Inspired by this observation, we define a model that closely resembles a real metabolic network. In this model each metabolite is represented by an “independent” processing element that is busy performing its own reactions by processing its inputs and producing its outputs. Once this model is established, GPU seems like a natural choice to implement the notion of topology-based parallelism.
The rest of the paper is organized as follows. Preliminaries are provided in Section 2. The main system design along with required definitions are discussed in Section 3. Section 4 is devoted to implementation and results. The design metrics and specifications are discussed in Sections 5 and 6, finally, Section 7 concludes the paper.
2 Preliminaries
In this section, some basic concepts of metabolic networks and their counterpart graph data model, formal definition of EFMs and a brief introduction to parallel computing are provided.
2.1 Metabolic networks
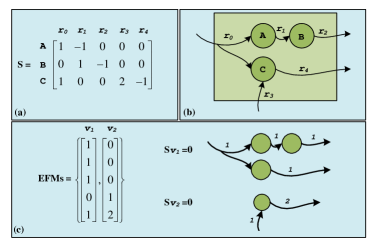
Metabolic networks model the metabolism of living cells in terms of a set of biochemical reactions. The biochemical reactions can be irreversible or reversible which means the reaction can be active only in one direction, or can be active in both directions, respectively. The contributing metabolites in a reaction can be either substrates or products. Substrates are consumed and products are produced during the operation of a reaction. The topology of a metabolic network is characterized by its stoichiometric matrix, S, where and correspond to the number of metabolites and the number of reactions, respectively. The value represents the stoichiometric coefficient of the metabolite in the reaction . is positive/negative if the metabolite is produced/consumed. If this coefficient is zero it means that the metabolite does not contribute to the reaction . The network is considered in the steady-state if for each internal metabolite, the rates of consumption and production are equal. The reactions connected to the external metabolites are called Boundary reactions.
Definition 1. Flux Mode. A flux mode illustrates flux distributions of a set of reactions in a given metabolic network. Non-zero values in v represent reaction fluxes.
Definition 2. Flux-Balanced Mode. A flux mode and is called flux-balance, if it meets the following conditions:
-
•
for all irreversible reactions (thermodynamic constraint) and
-
•
, i.e., the rates of consumption and production of internal metabolites are equal (steady-state condition). The low-dot operator simply is the matrix inner product.
Definition 3. Elementary Flux Mode. A flux mode and is considered an EFM, if it meets the following conditions:
-
•
v is flux-balanced based on Definition 2,
-
•
there is no with , where support of a mode is defined as , (minimality limitation).
In Fig 2, an example of a metabolic network is illustrated.
2.2 Metabolic network data model
The used data model in this paper is derived from [24]. The model is based on the conventional AND/OR graph in computer science with additional features to make the model appropriate for object-oriented methods considering the metabolites as objects. In this model, the coefficients of the metabolites in reactions are embedded in the graph structure as attributes of each node (defined in Definition 6). The information of the candidate pathways is also embedded in the graph structure.
Definition 4. Modified graph for representing a metabolic network, denoted as , is defined as a set of Nodes, i.e., = , where is the number of internal metabolites and each represents a metabolite in the network.
Definition 5. Each node in is a 3-tuple = (, , ) where
-
•
is the tag of a metabolite,
-
•
is an array of input reactions that produce the metabolite and
-
•
is an array of output reactions that consume the metabolite.
Definition 6. Each / in Definition 5 contains the following data:
-
•
The reaction , , where is the number of reactions consuming/producing the metabolite ,
-
•
/, an array of the metabolites consumed/produced by reaction . In other words, /=, where is the number of consumed/produced metabolites by the reaction ,
-
•
/, an array of the metabolites produced/consumed by reaction . In other words, /=, where is the number of produced/consumed metabolites by the reaction excluding the metabolite itself,
-
•
The direction of the reaction for reversible reactions,
-
•
/, the coefficient of the reaction for the produced/consumed metabolite in the stoichiometric matrix and
-
•
/, the flux of the input/output reaction for a certain path .
For bidirectional reactions, the term “direction” is used to clarify that either the reactants react to form the products, or the products react together to produce the reactants in the backward direction. A hyperarc links a set of nodes to another set in one connection. The incoming hyperarcs (i.e., in Definition 5) in each produce the metabolite and the outgoing hyperarcs (i.e., in Definition 5) consume it. Therefore, consumed metabolites, , and produced metabolites, , contributing to reaction as shown in Eq 1, are as hyperarcs between nodes each associated to one metabolite. hyperarcs and hyperarcs in nodes are related to each other by reaction tags in Definition 6. The set of metabolites in , , are AND-related. The incoming (outgoing ) hyperarcs for each are OR-related.
| (1) |
Definition 7. Pathway. A pathway in a graph data model is defined as a chain of adjacent nodes such that they form a hyperpath from a source node to a sink node. Adjacent nodes represent the metabolites which contribute in a common reaction.
A pathway can be seen as a subgraph of the AND/OR representation of a metabolic network. In addition, a pathway can be represented as a vector in a convex flux cone. It should be noted here that these two definitions are shown to be equivalent [25].
2.3 Parallel computing and programming
Parallel computing is a type of computation in which independent executable elements of a system can run simultaneously. This is based on the assumption that large problems can often be divided into smaller ones, which can then be solved at the same time. Solving complex scientific and engineering problems require huge computational power. Processing power in high performance computing (HPC) is measured by floating point operations per second, or FLOP/s and the size of data in Bytes considering that a double precision floating point number takes 8 bytes of memory. Memory and timing constraints are among principal reasons that move the trend to parallel computing and programming frameworks. Each memory access can take several CPU cycles and increasing clock frequency does not readily improve performance anymore.
There are several forms of parallel computing such as instruction-level and thread-level schemes. Instruction-level parallelism (ILP) is defined as a parallelism among individual instructions executed by a microprocessor. Parallel parts are automatically extracted by the microprocessor. This type of parallelism is limited by the pipeline depth and instruction dependencies. On the other hand, thread-level parallelism (TLP) happens when a set of multiple concurrent tasks are running and the programmer's involvement is required to extract the parallelism as done in our model.
Considering data along with instructions, two models are defined. In single instruction multiple data (SIMD) model, a large number of (usually small) processing elements apply a single instruction on multiple data sets. In other words, a single controlling processor issues each instruction and each processing element executes the same instruction. Multiple instruction multiple data (MIMD) is another model in which each processor executes its own sequence of instructions independently. An extended model of SIMD, single thread multiple data (STMD), is used in the proposed model and will be explained later.
A programming model is a bridge between a system developer's natural model of an application and an implementation of that application on the target hardware. A programming model must allow the programmer to balance the competing goals of productivity, in terms of time and resource, and implementation efficiency [26].
Different hardware platforms and programming environments are introduced in the recent years to address the parallel computing requirements. The proposed system independent of the underlying hardware is presented in Section 3 and the appropriate hardware for our proposed model and its programming requirements are discussed in Section 4.
3 Materials and methods
In this section, the proposed system architecture is introduced and then the relationship between the system and the applied data model is discussed. The main target of the system is to model the function of each metabolite and create minimal pathways along these functional systems. To better describe the model, a set of terms are defined in the following section.
3.1 Definitions
Definition 8. Pathway Creation. Pathway creation in a graph data model is defined as the process of starting from a boundary reaction (i.e., an external arc) and following the chain of reaction-metabolites, recursively adding the AND-related nodes to a list. When a reaction adds a metabolite to the list of the pathway, the metabolite is called to be triggered by the reaction.
Definition 9. Forward/Backward Flow.
The term is applied to a flow when the process of pathway creation is in a forward direction for a particular metabolite, which means that the metabolite is produced according to the flux changes of the input/output reactions of that metabolite. The term is applied when the flow is in a backward direction, i.e, the metabolite is consumed according to the flux changes.
Definition 10. Primary and Secondary Reactions.
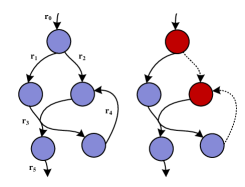
On each pathway, each node (metabolite) has a primary input (PI) and a primary output (PO). In forward/backward flow, a PI/PO is the first reaction which enters a node and a PO/PI is the first reaction which directs the flow of the pathway and tags the node as visited. When an edge (i.e., a reaction) enters an already visited node in that pathway in a forward/backward flow as an input/output, that reaction is tagged as a secondary input/output (SI/SO) of that node.
For example, when metabolites and are AND-related, if is consumed during the reaction ++, then should also be present in the medium which means and should be consumed simultaneously. The forward/backward flow is designed for the produced/consumed metabolites [24]. In this example, the metabolites and are consumed while and are produced. The order of adding nodes to the list in the pathway creation process in the forward/backward flow names reactions as primary or secondary. An example of primary and secondary reactions is illustrated in the graph model of Fig 3.
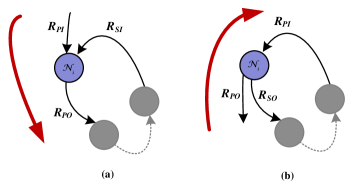
Definition 11. Flux-dependent reactions.
A primary output and a secondary input in a forward flow (or a primary input and a secondary output in a backward flow) are called flux-dependent reactions if the pathway which goes through the primary reaction, extends to the secondary reaction. In this case, their fluxes are linearly dependent over the target node. The dependency is shown by the sign in the rest of the paper. The two dependent types are illustrated in Fig 4.
3.2 The proposed architecture
In this section, the main architecture of the system to model and analyze metabolic networks is provided. The main goal of the system is to create minimal flux-balanced metabolic pathways. In the proposed architecture, each node in an graph is considered as a processing element or module with a local memory. The whole system has a global memory used by the processing elements to synchronize their tasks. The concept behind the model is that by starting from boundary metabolites (or any other internal metabolite set), each incoming flux in a pathway produces a set of metabolite(s), and each produced metabolite should be consumed. The flux of the contributed reactions can be obtained according to the stoichiometric coefficients in order to make sure that the constructed pathway is in steady-state. Only one output from the node should be considered when constructing a pathway. When one metabolite is consumed by a reaction, the presence of its AND-related metabolites is required. Therefore, the algorithm is designed to have a forward/backward flow for the produced/consumed metabolites. The system architecture is illustrated in Fig 5. It consists of META modules, each corresponding to one node, and an arbiter which evaluates the constructed pathways and decides whether they belong to a subset of the desired pathways or not. The modules are introduced in further detail below.
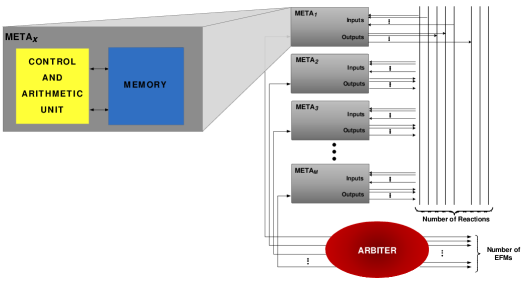
3.2.1 Modules: META
Each META module with the index consists of a control/arithmetic unit and a memory unit. The task of the module is to keep the information of the pathways (i.e., EFM candidates) and to execute the required instructions based on the obtained information from the neighboring META modules. Two modules are neighbors if they are data dependent (i.e., have shared reactions). The two internal units of the META module are discussed below.
Control and arithmetic unit. Fig 6 illustrates the flowchart of the operation of the control and arithmetic unit. The task of all boxes labeled as PROC in the figure are summarized in Table 1.
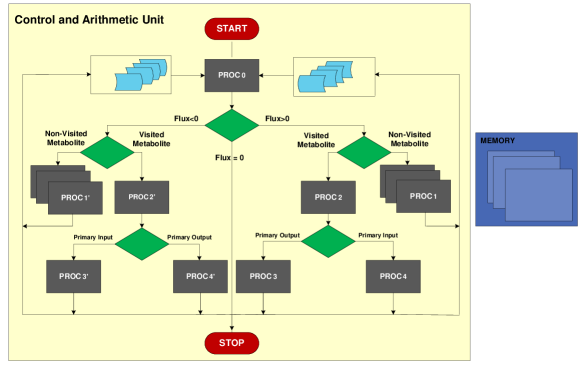
Process Name Task PROC0 Calculate metabolite balance for each pathway using Eq. (2) PROC For each output/input, start a new pathway using Eq. (3) and go to PROC0; Tag input/output reactions PROC Check reaction dependency status PROC Use Eq. (4) to balance the flux and go to PROC0 go to STOP if MAX_LOOP is reached PROC Use Eq. (5) to balance the flux and go to PROC0 go to STOP if MAX_LOOP is reached
The thread inside the unit is running continuously until the arbiter closes the processing element or the maximum times a node is visited, represented by MAX_LOOP, is reached. In the beginning, the metabolite balance of each pathway, is calculated in PROC0 based on Eq 2.
| (2) |
In this equation, EF indicates the extra flux. Depending on the value of EF, one of the three routes in the chart should be selected. If the metabolite is visited for the first time, new pathways are created for each output/input in PROC1/PROC using Eq 3.
| (3) |
Otherwise in PROC2/PROC the reaction dependency is checked between the input/output flux-changed reactions. Based on the results of PROC2/PROC, if reactions are independent, Eq 4 is used in PROC3/PROC to pass the flux to PO/PI reactions.
| (4) |
Otherwise, Eq 5 is used and fluxes are passed to PI/PO reactions. In both PROC3/PROC and PROC4/PROC, a variable which keeps track of the number of times a metabolite is visited is checked against a constant MAX_LOOP to avoid the loop over a node forever.
| (5) |
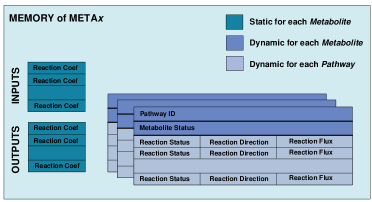
Memory unit. The data stored in the memory unit of the META can be divided into two categories.
-
•
Metabolite local: Consists of static and dynamic information. Static information of each metabolite includes input/output stoichiometry coefficients and dynamic information includes the metabolite status in each pathway which is changed over time.
-
•
Path local: Consists of dynamic information of a pathway.
Static and dynamic terms indicate Read-Only and Read/Write memory types, respectively. Fig 7 illustrates the structure of the memory unit.
3.2.2 Modules: Arbiter
Based on the pathway information stored in META modules, the arbiter decides which pathway candidates are balanced and to be considered as EFMs. When all META modules are done with the analysis of all in-process pathways, the arbiter reports the result. The function of the arbiter is considered as a part of META function in Algorithm 3. The decision is made based on the status of each pathway specified in the algorithm as discussed later.
4 Implementation and analysis
The hardware platform introduced in Section 3 is implemented on a graphic processor unit (GPU). To demonstrate the operation of this platform, a metabolic network is considered for experiments and the results are provided in the remainder of this section. The platform consists of a set of parallel threads of STMD type where each META module runs the same thread for various data sets. Complication arises because of the inevitable dependencies between the modules's data.
4.1 General-purpose graphics processor units
GPUs were originally developed for computationally intensive graphics of games and image processing applications in computer systems. But recently, their vast computational power has been utilized in general purpose computing.
There are several reasons to consider GPUs as the hardware platform to emulate metabolic networks in this research. Firstly, a suitable environment for software development based on C/C++ is available for high-level and easy programming which is convenient to try alternative options for running test routines. Secondly, a large number of floating point units (FPUs) in GPUs can operate in parallel to accelerate our analysis.
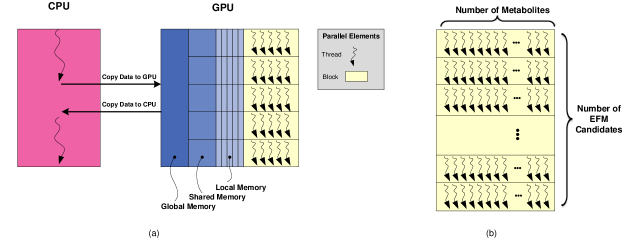
A general architecture of a GPU is shown in Fig 8-a in which the main program is running on a CPU. To run a process on the GPU, first the data in the CPU memory is copied to the GPU memory. When the process is done on the GPU, the result is copied from the GPU memory to the CPU memory. The parallel functional units of the GPU are , each consisting of a set of . All threads in all blocks perform the same function in one access to the GPU. In other words, the main stream of the program is running on the CPU and function calls from the CPU initialize a process on all GPU threads. By the term access, we mean the function call that is invoked by the CPU to setup the GPU. Therefore, all threads run simultaneously from a programmer's point of view. A typical GPU has three memory levels: a local memory for each thread, a shared memory between threads of a block and a global memory.
The correspondence between the system architecture and the GPU platform is illustrated in Fig 8-b. Each META element stands on a thread and each block is dedicated to a candidate EFM pathway which means that different pathways are processed by different blocks.
Algorithm 1 shows the main function running on the CPU. Three accesses, called kernel functions, are made from CPU to GPU as shown in Fig 9. Details of each function are discussed below.
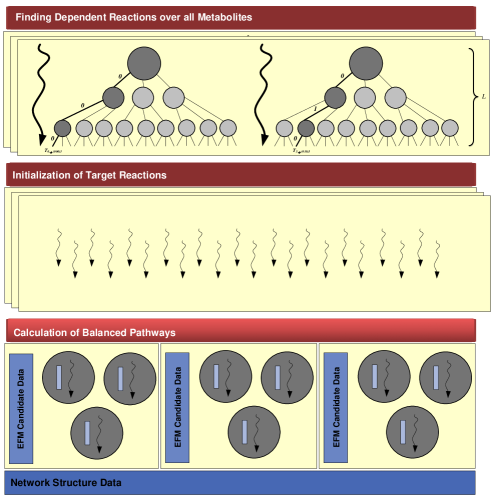
Finding dependent reactions over all metabolites. In the flowchart of the control/arithmetic unit (Fig 6), flux-dependent reactions of a metabolite should be identified to make better decisions. Algorithm 2 describes the DEPTH function which starts a path through a metabolite and continues until the path length (i.e., the number of involved reactions on the path) is equal to . If is reached again in the created path with length , the involved reactions of are characterized as flux-dependent. To do this using the GPU, one block is dedicated to each metabolite. Each thread of each block is dedicated to a path starting from . Therefore, DEPTH function is executed on each thread of each block to traverse paths and resolve dependencies. Each thread of a block is identified by a block ID and a thread ID. The block ID is set to for the metabolite . The thread ID should specify a unique path. To do this, the thread ID is used to route the path and to reveal the route. We propose a static path-generator method in which the thread ID as a decimal number is converted to a number in base and length as ==. is the maximum number of output reactions of a node . So, the pair ( of blocks, of threads) is set as (,) and DEPTH is set up on each. We start from a node . The index counts the number of nodes traversed on the graph, that is, the parameter . The digit in position represents the order of the reaction which should be selected in depth . Consider that the node in depth in the queue is represented by . The number of outputs of is considered as which is the size of array of the node. If , the process goes on, otherwise the path is undefined. To continue the process, check to see if the node is in the set of output metabolites of reaction shown by (see Definition 6). If the node is in the array, the process ends. Otherwise, it continues until reaches .
Initialization of target reactions. In this function, the target reactions which are selected to contribute in the pathway are initialized with a default value (“1” in our implementation). These reactions can be boundary reactions or any other set of reactions. Connected metabolites to the initialized reactions are triggered by them. To do this using the GPU, the pair ( of blocks, of threads) is set as (,) where is the number of EFM candidate pathways and is the number of reactions of the network. This is done on the GPU in one pass. Each thread sets/resets the initial value of a reaction on each block which is dedicated to a candidate pathway.
Calculation of balanced pathways. In META function in Algorithm 1, the pair ( of blocks, of threads) is set as (,). Each block is dedicated to an EFM candidate pathway and each thread of the block is dedicated to a metabolite. The META function is set up on all threads. Algorithm 3 shows the function as sketched in the system design flow in Fig 5. In this function, each pathway is created using randomly selected output/input in the forward/backward flow. EFM candidates at the end of the algorithm change to either Done or notEFM status. The status remains as notDone as long as there are still unbalanced metabolites on the pathway. Each thread executes a while(true) loop. The while loop is broken when all candidates take a Done or notEFM status. The function of the arbiter module in Fig 5 is embedded in the META modules performing META functions. This is because all threads should run the same function in each GPU access.
4.2 Application on biologically relevant metabolic networks
4.2.1 CHO cell metabolism
To prove the proposed concept on metabolic networks, a core model of Chinese Hamster Ovary (CHO) cell metabolism was chosen from [27, 28]. CHO derived cell lines are the preferred host cells for the production of therapeutic proteins [29]. The stoichiometric matrix of this network is of size with two boundary reactions and . An NVIDIA GeForce GT330M GPU and CUDA version 5.5 platform were chosen. An Intel Core-i5 CPU with 4 GB RAM was used to run the test. The source code and results are provided at https://github.com/marabzadeh/GPU-GB-EFM. The network has 7 EFMs. Using random pathway creation, five EFMs were obtained. Table 2 summarizes the results after attempting 48 EFM candidates with depth and . The global memory used to store the network on GPU was approximately 2 MBytes. To test that all EFMs are computable by the approach, contributing reactions of each EFM were selected intentionally in the algorithm and their pathway were created. This test was passed and all EFMs were observed. Considering enough time and resource, the approach can lead to the calculation of all EFMs, as proved by Theorem 1.
Function Name of Candidates of Threads Duration () Local M/Thread Shared M/Block Registers/Thread DEPTHy 12 256 149.7 816 24 23 INIT 48 18 17.9 0 32 12 METAx 48 12 15583.2 60 40 27
Fig 10 illustrates the steps for creating one of the EFMs in the metabolic network of CHO cell. The table in the top-right corner of this figure shows the flux of reactions from the point of view of the in-process metabolites step by step. There are six steps to balance the pathways and Step 7 shows the fluxes of the balanced pathway. The in-process metabolites in each step are shown by big-circles. In each step, fluxes are not equal in active threads. This happens due to the accessibility of threads to the shared data of the reactions. To overcome the conflict, a flag is set when a reaction flux is read in Eq (1) and reset after write. If another thread reads the flag as set, it should wait for the flag to reset.
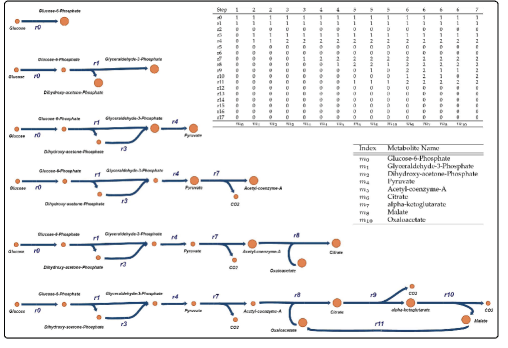
Table 3 reports some observations when different sets of reactions are initialized. It should be mentioned that different starting reaction sets may potentially lead to different EFMs. For each metabolite, the unbalanced status of the metabolite is counted. The number of conflicts is also reported. Subtracting the number of conflicts from the number of steps gives the actual number of parallel steps. The Sum column shows the total number of times that all threads were activated and the Ave column shows the average number of a thread is active, that is, the thread has the computational load of updating fluxes. The column Meta/Step shows the average number of in-process metabolites at each step. As can be derived from the table, by initializing internal reaction(s), more steps are taken to make the pathway stable.
Selected reactions Steps() Conflict Step-Conf Sum Ave Meta/step r0 8 1 7 16 1.8 2.3 2 1 2 2 2 2 2 1 2 r1 8 1 7 16 1.8 2.3 2 1 2 2 2 2 2 1 2 r7 60 14 46 67 7.4 1.5 4 3 6 4 6 14 20 4 6 r9 61 14 47 77 8.6 1.6 4 3 6 4 6 14 19 15 6 r1,10 57 14 43 77 8.6 1.8 4 3 6 4 6 14 19 14 7 r4,11 59 14 45 77 8.6 1.7 4 3 6 4 6 15 19 14 6 r1,7,9 55 16 39 78 8.7 2.0 4 3 7 4 7 13 19 15 6 r0,3,8 56 15 41 78 8.7 1.9 5 3 6 4 6 14 20 14 6
4.2.2 E.coli model iAF1260
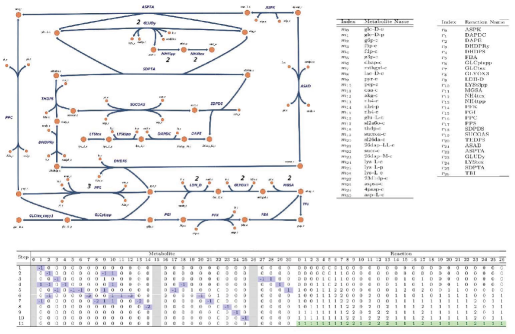
To analyze the applicability of the proposed architecture on other metabolic networks, the model of E.coli network with 1668 metabolites and 2382 reactions was chosen from [31]. ATP, AMP, ADP, H, Pi, CO2, H2O, COA, NAD, NADP, NADH and NADPH are considered as cofactors. As stated in the literature [22], some simplifications to the system's model can be performed in order to reduce the complexity of the problem, such as setting currency metabolites like cofactors and energy metabolites to external. According to [22], for energy currency metabolites like ATP, NADH and FADH, since their concentration is assumed to be constant, they are not required to be balanced by an EFM. Notations are taken of the COBRA model from [31].
The set of shortest EFMs producing L-Lysine calculated by [22] was extracted. The observability of 7 shortest EFMs with length 27 and 28 was studied on the proposed architecture. Fig 11 illustrates the steps of constructing the EFM depicted in the figure. At each step, the set of unbalanced metabolites are specified and the required changes on the reaction set are illustrated. Reaction fluxes are changed so as to achieve the least required steps to create and balance the targeting EFM.
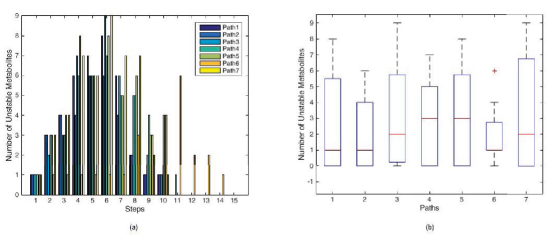
The same information for all 7 paths are provided in Supplementary material File 1 (S1.exe) and the resulting EFMs are depicted in Supplementary material File 2 (S2.pdf). Summary of the results are provided in Fig 12. As shown in Fig 12-a, the number of unstable metabolites tends to match a normal curve which means that the number of unbalanced metabolites is increased in the intermediate steps. The box plots are also depicted in Fig 12-b for each path to show the distribution and the average of the unbalanced metabolites.
This study shows the potentiality of the proposed architecture for finding EFMs on large-scale metabolic networks. Three sets of variables influence the generation of an EFM, specially on large-scale metabolic networks: (1) a set of first-initialized reactions, (2) the primary input and output selection at first-visited metabolites, (3) the decision on how to pass the flow on the metabolites which are not first-visited. In this test, the external input reaction is initialized and for the rest, the best decisions were taken to pass the flow through one of the reactions of the in-process metabolite. In this example, an exhaustive search is applied to find the best selection to pass the flow. However, to make the approach automated for large-scale networks, further studies are required. The order of metabolites and their accessibility to the reaction's shared data and the decision on how to pass a flow to balance a pathway or report it as an unstable path is important. The convergence of the solution is discussed in Section Theoretical analysis. However, a practical implementation to reach the desired solution in a reasonable time can be proposed by further research. An example is provided in Supplementary material File 4 (S4.pdf) to illustrate the benefit of linear random pathway construction.
5 Technical details
5.1 Design parameters
In parallel computing, several design parameters should be considered to make the system work efficiently on the hardware platform. Some of these parameters and the way they are treated in the proposed design are discussed.
Granularity. The level of details considered in a model or decision making process is considered as Granularity. The coarser granularity results in the deeper level of details. Granularity in parallel systems is defined as the size of a part of a system which is selected to work independently. In the proposed design, the granularity is chosen as the size of a metabolite according to the data stored in each metabolite and the instructions to be executed in each of them. Besides, the function of a metabolite is the smallest repeatable part of the system.
Coordination and Synchronization. The memory and timing cost of data communication and resolving inconsistencies, which may occur because of data sharing, should be considered in the design. Uniform shared memory over different blocks and message passing are among data coordination methods. In the proposed design, the hierarchical memory structure with different sharing levels is used for data communication. To overcome the conflicts, solutions are proposed as discussed earlier.
5.2 Topology-based parallelism analysis
In the proposed model, two levels of parallelism are used as explained below.
5.2.1 Block-level (pathway-level) parallelism
This level of parallelism is based on the independence of different pathways in the network. In order words, distinct pathways are created from different outputs of a metabolite. Each new pathway is independent of the others. In our implementation, each block is dedicated to a pathway which executes independently. The idea is shown in Fig 13-a for a metabolite with two reactions.
5.2.2 Thread-level (metabolite-level) parallelism
This level of parallelism is based on the node structure. When a reaction takes an updated flux, all connected nodes to that reaction, except the one which was in-process, are triggered. In the proposed implementation, the metabolite-level parallelism is applied by performing a META function on different threads of a block. The idea is shown in Fig 13-b for a reaction with four connected metabolites.
5.2.3 Performance modeling
It is usually hard to model the performance of a parallel system. Modeling the performance of the proposed design is even harder since each thread executes in a while loop either to make a pathway flux-balanced or discard it. function in Eq 6 is defined to model the number of active parallel metabolites (threads) at Step of the system.
| (6) |
In this equation, is the number of input or output reactions at each step and is the number of metabolites involved in a reaction. At step , for each metabolite there are reactions and each reaction has triggered metabolites. Going through the steps, the dependencies in the graph structure cause the nodes to be visited more than once and pathways to be duplicated. and functions are used in the model to consider the graph dependencies in terms of pathway and metabolite, respectively. and are probability functions which are estimated to have high probabilities at first and then converge to zero. These functions can be modeled by more experiments on metabolic networks. A CPU-GPU comparison analysis based on this performance model is provided in Supplementary material File 3 (S3.pdf).
5.3 Theoretical analysis
In this section, the proposed system architecture for finding EFMs is discussed theoretically on the graph model.
Proposition 1.
By initializing a selected set of reactions = with a default flux value, all minimal pathways which are including are explored in the graph of a given metabolic network; the set “indices” indicates a subset of reactions in .
A set of output and and-related metabolites of the reactions in the set are triggered at each step by those reactions. From each first-visited metabolite, new pathways are created through outputs/inputs in forward/backward flow getting primary tags. Recursively, all pathways including the set are created until there are no metabolites to be triggered for each path.
Since an arbitrarily selected set of reactions can be given, disconnected subgraphs might be generated and the given selection may violate the elementarity of the generated path. Therefore, undesired paths should be removed from the results.
Proposition 2.
Starting with an initialized set of reactions with certain fluxes, all nodes are traversed and all reactions in a pathway are assigned a flux using Eq. 2, as each node has a primary input and a primary output to be used in this equation. Equation 2 states that the amount of the incoming and outgoing fluxes in should be equal.
Proposition 3.
Flux dependencies can prevent the rate of the production/consumption of an internal metabolite in a given topology of a pathway from being zero. Eq. 3 is used to calculate an update for the consumption/production rate of the node. In the following cases, the pathway is discarded:
-
•
or
-
•
,
-
•
a loop is repeated over a node (i.e., getting back to a node from the same reaction multiple times), while trying to find a way out in a subgraph of the pathway.
Lemma 1.
If a pathway is EFM, its graph model is reachable by graph traversal of Proposition 1.
Proof.
An EFM is a flux-balanced pathway with no flux-balanced subset. Node-dependent pathways are referred to the pathways in which all related nodes of a selected reaction are traversed. All node-dependent pathways are produced according to Proposition 1 through different reaction choices. Therefore, either a flux-balanced pathway has a flux-balanced subset (which is node-dependent and reachable by Proposition 1) or it is an EFM itself and reachable by Proposition 1 as well. ∎
Lemma 2.
In a consistent network, for two types of pathways there exists a flux-balanced solution. Type I pathways are defined as pathways with no hyperarcs; either cycles or pathways from an input to an output with one input and one output for each node. Type II pathways are those with nodes with more than one input or more than one output but with no flux-dependent reactions.
Proof.
For type I pathways, all nodes have one primary input and one primary output. Using Eq. 2 subsequently, as stated in Proposition 2, fluxes are assigned to all reactions such that consumption/production of metabolites are balanced. For type II pathways, using Eq. 3, as stated in Proposition 3, for all visited nodes there is a sequence of reactions through primary inputs/outputs to balance production/consumption of metabolites. ∎
To analyze pathways with flux-dependent nodes, an optimization problem is defined in Lemma 3.
Lemma 3.
Finding flux values for potentially flux-balanced pathways in the proposed architecture can be defined as an optimization problem.
Proof.
Function for node is defined as . The problem of finding flux-balanced pathways, considering that the function of each metabolite is independent, is defined as follows:
Minimize: , , in which is the number of active metabolites in the candidate pathway .
Constraints: For each node , the outgoing/ingoing output/input reaction should be selected such that . The selected reaction carries the flux from the set of active reactions in as stated in Propositions 2 and 3.
∎
Theorem 1.
Sampling parallel pathways on the proposed system architecture, leads to exploration of a set of EFMs which includes all type I and type II EFMs.
Proof.
Based on the result of coupon collector's problem in probability theory, the expected number of picks required to choose all the elements of a set is which for large is approximately . Consider the length of a pathway as the number of its contributed metabolites. For a pathway with length , for each metabolite, selections are possible, in which is the maximum size of output/input array in the forward/backward flow. Therefore, efforts for a pathway with length are required to create all possible routes. Number of efforts reflects number of parallel pathways, considered as distinct blocks on the GPU platform. The result of Lemma 1 is used to show that by selecting all outputs/inputs (in forward/backward flow), all pathways are produced. The results of Lemma 2 and Lemma 3 are used to show that the function running on each GPU thread keeps metabolite production/consumption rates balanced and leads to the construction of type I and type II flux-balanced pathways. With a proper solution for the optimization problem of Lemma 3, a balanced solution for other pathways can be explored. ∎
6 Discussion
The proposed model traverses the graph and keeps both the stoichiometry information and the minimality of the path with the opportunity of not exploring the whole solution space. Our approach tries to decide if a certain “path” is EFM or not, merely based on topology rules (instead of recognizing the elementarity through rank test or comparing new candidates with produced ones). The graph structure makes a good track of unbalanced metabolites. Each metabolite is considered as an object and the graph structure makes it easier to set-up rules for paths and explore the intended solution space via rules; e.g., initializing a set of reactions to find their including EFMs.
The modified AND/OR graph is a simplified type of a hypergraph and the application of hypergraphs in biological networks has been reviewed in [32]. In the proposed model, each arc has two different input and output coefficients. Besides, for each arc, a dynamic label for each pathway is defined, that is, the flux of the reaction represented by that arc [24]. In this context, the edges are directed and each has been associated with a weight. However, the weight of an output arc of a node may be different from the weight of the arc entering another node as an input. The reason is that the production rate of a metabolite in one reaction can be different from its consumption rate in another reaction. It has been studied that the hypergraph structure complicates pathway topology [33]. The complication arises since fluxes of contributing input and output reactions over a node may be related. This results to the non-linear property of fluxes. The non-linearity has been considered in our flux calculation procedure (see Eq. 2 and Eq. 3). Besides, since in this model, each metabolite is considered as a subsystem, the linear or non-linear relations of reactions over a metabolite, i.e. a subsystem, are of interest as defined in Definition 11. Other definitions such as enzyme subsets as defined in [34] are not directly related to our definitions and Definition 11 can be considered as a subset of enzyme subsets. Enzyme subsets are defined in [34] as groups of enzymes that operate together in fixed flux proportions in all steady states of the system over a whole pathway.
In comparison to the method of [22], both methods are exploring the non-steady-state solution space and try to apply additional constraints to reduce the complexity. However, in this approach instead of using the support of LP-based tools, we used an inherent parallel structure of the network and developed a model on hardware. However, while the basic framework is sketched and the potential of the method on pathways belongs to large networks is shown, further studied are required to automatize the approach to get desired output EFMs.
The first introduced double-description method for finding EFMs explores the whole set of pathways to find pathways that are in the steady-state solution space and then selects EFMs by comparing the reaction subset of pathways [8] as used in several tools such as COPASI [35]. In the improved double-description versions of the method which use null-space of the stoichiometry matrix as an input, different combinations of pathways in the null-space are calculated and then the reaction subset of pathways are compared [14, 15, 16]. In [24], GB-EFM method first calculates the reaction-dependent pathways in the solution space and then checks to see if these pathways can be in the steady-state by using some rules on the topology of the pathway. In the proposed model the procedure of constructing the paths and balancing them are combined together to introduce a hardware independent core so as to combine the results of all these cores with the same decision table and distributed data on the network to calculate EFMs.
There are two different categories of approaches for constraint-based analysis, namely FBA and EFM analysis. Both approaches use the concept of “balanced fluxes”. However, in FBA, LP is applied to find fluxes in metabolic networks with an optimized objective function. In contrast, in our approach, which is in the category of EFM analysis approaches, we use the concept of “balanced fluxes” in a graph representation of a metabolic network to find flux-balanced pathways. To be more precise, we did not use the LP-based methods like flux balance analysis (FBA) as used in [36] and [37]. In contrast, we use an AND/OR graph to find pathways with specific properties.
Using acceleration methods to speed-up the calculation of computational biology algorithms has been a challenge for years [37]. However, in our proposed method we aimed to introduce a system modeling rather than just an acceleration technique.
Several models have been introduced so far for the analysis of metabolic networks including convex analysis [34] and topological analysis [25]. While all these approaches persue the same goal, there are important differences in the way they can be interpreted and be useful for a specific application. Considering a system as a collection of subsystems has been modeled using cellular automata and were used in several applications [38, 39]. The relation of graph models and cellular automata has been studied before [40]. However, to the best of our knowledge, in constraint-based approaches, the system view of a metabolic network, that is considering a metabolic network as a set of subsystems to analyze the network, has not been used before. To avoid the complexity of such modeling as cellular automata and because the main goal of the introduced method was to propose a hardware parallel model, our method is proposed in terms of graph objects and the relationship between subsystems defined based on flux calculation. However, the correspondence of the proposed method with cellular automata and using GPU in the context of topology-based parallelism to implement cellular automata (which leads to an acceleration tool to implement it) can be considered as a future work.
For computing minimal pathways of metabolic networks, some approaches, like MinSpan [7], try to find the sparsest linear basis of the null space of the stoichiometric matrix, S. However, finding only the shortest pathways (as in [22]) may introduce a bias in computing EFMs, since in large-scale networks the majority of EFMs are known to be the large ones [41]. Furthermore, approaches which consider computing the shortest EFMs typically formulate their problem as a mixed-integer linear program (MILP), which is known to be NP-hard. More specifically, these algorithms find EFMs one by one, which means that after finding an EFM by solving an MILP, a new “not-equal” constraint should be added to the set of constraints in order to avoid finding the previous EFMs. Such constraints often make the latter MILP problem harder to solve [22]. In contrast, our approach is unbiased, in the sense that all EFMs, including the long ones, have the same chance to be found. Moreover, our approach applies parallelism for computing EFMs. Therefore, the EFMs that are found are independent of each other.
The proposed approach relies on availability of an array of hardware resources to achieve its goal. Taking advantage of the inherent structural parallelism of the hardware resources, we attempt to find as many EFMs as possible given the available hardware resources, i.e., the more parallel resources are available, the more EFMs may be found. Therefore, the user is not “directly” setting a limit on the number of EFMs. However, their choice of hardware resources will “indirectly” determine that. Since the hardware platform features a parallel structure, the time complexity of the proposed approach is very low. Needless to say, in the latter case, expanding hardware resources would resolve the impasse and provide a set of EFMs. We believe that overcoming this obstacle and the related analysis can be the topic of another research.
7 Conclusion
In this paper, a modular system architecture was proposed to calculate minimal flux-balanced metabolic pathways. The architecture is based on the AND/OR graph model. Each META module was designed in order to emulate the internal function of a metabolite for finding EFMs. The proposed architecture was implemented on a GPU platform to take advantage of the parallel architecture provided in the GPU based on multiple cores and hierarchical memory. The memory levels of the GPU are used to illustrate the memory hierarchy in the system. The topology-based parallelism obtained by the system was the main achievement of the model. Additionally, the simplified metabolic network of the CHO cell was studied to prove the concept of the design on metabolic networks to find EFMs. Besides, the potential of the model was studied on shortest pathways of the E.coli model.
Studying genome-scale models and finding biologically meaningful pathways [42, 43] by setting rules in the module's function are considered as our future research. In this paper, the static structure of the GPU was used. Using dynamic thread activation, as provided in recent GPU architectures, and store accurate pathway information according to the available memory space are the ideas to make the model appropriate for genome-scale analysis. In addition, core function decisions can be improved by randomized decisions while keeping a global cost function to manage the moves, which is considered to investigate in our future research. Besides, partitioning and compression preprocessing methods can be used further to overcome the limitation of the hardware platforms.
Supporting information
S1 excel file.
Applying the proposed model on E.coli shortest paths. Complementary data are provided in the excel file.
S2 pdf file.
Applying the proposed model on E.coli shortest paths. Complementary figures are provided in the pdf file.
S3 pdf file.
CPU-GPU comparison model. Complementary figure is provided in the pdf file.
S4 pdf file.
Benefit of linear random pathway construction. Complementary data is provided in the pdf file.
Acknowledgments
Authors would like to thank Dr. Nathan Lewis (UCSD) for helpful discussions on the concept.
References
- [1] J. A. Crowder, J. N. Carbone, R. Demijohn, Multidisciplinary Systems Engineering: Architecting the Design Process, Springer, 2015.
- [2] H. Kitano, Computational systems biology, Nature 420 (6912) (2002) 206–210.
- [3] C. S. Henry, M. DeJongh, A. A. Best, P. M. Frybarger, B. Linsay, R. L. Stevens, High-throughput generation, optimization and analysis of genome-scale metabolic models, Nature biotechnology 28 (9) (2010) 977–982.
- [4] N. D. Price, J. L. Reed, B. Ø. Palsson, Genome-scale models of microbial cells: evaluating the consequences of constraints, Nature Reviews Microbiology 2 (11) (2004) 886–897.
- [5] E. Klipp, R. Herwig, A. Kowald, C. Wierling, H. Lehrach, Systems biology in practice: concepts, implementation and application, John Wiley & Sons, 2008.
- [6] J. A. Papin, N. D. Price, B. Ø. Palsson, Extreme pathway lengths and reaction participation in genome-scale metabolic networks, Genome research 12 (12) (2002) 1889–1900.
- [7] A. Bordbar, H. Nagarajan, N. E. Lewis, H. Latif, A. Ebrahim, S. Federowicz, J. Schellenberger, B. O. Palsson, Minimal metabolic pathway structure is consistent with associated biomolecular interactions, Molecular systems biology 10 (7) (2014) 737.
- [8] S. Schuster, C. Hilgetag, On elementary flux modes in biochemical reaction systems at steady state, Journal of Biological Systems 2 (02) (1994) 165–182.
- [9] S. Schuster, D. A. Fell, T. Dandekar, A general definition of metabolic pathways useful for systematic organization and analysis of complex metabolic networks, Nature biotechnology 18 (3) (2000) 326–332.
- [10] S. Schuster, S. Klamt, W. Weckwerth, F. Moldenhauer, T. Pfeiffer, Use of network analysis of metabolic systems in bioengineering, Bioprocess and Biosystems Engineering 24 (6) (2002) 363–372.
- [11] D. Radhakrishnan, M. Rajvanshi, K. Venkatesh, Phenotypic characterization of Corynebacterium glutamicum using elementary modes towards synthesis of amino acids, Systems and synthetic biology 4 (4) (2010) 281–291.
- [12] K. Parvatham, L. Veerakumari, Drug target prediction using elementary mode analysis in ascaris lumbricoides energy metabolism, Biotechnology and bioprocess engineering 18 (3) (2013) 491–500.
- [13] D. Machado, M. J. Herrgård, Co-evolution of strain design methods based on flux balance and elementary mode analysis, Metabolic Engineering Communications 2 (2015) 85–92.
- [14] C. Wagner, Nullspace approach to determine the elementary modes of chemical reaction systems, The Journal of Physical Chemistry B 108 (7) (2004) 2425–2431.
- [15] R. Urbanczik, C. Wagner, An improved algorithm for stoichiometric network analysis: theory and applications, Bioinformatics 21 (7) (2005) 1203–1210.
- [16] L. E. Quek, L. K. Nielsen, A depth-first search algorithm to compute elementary flux modes by linear programming, BMC systems biology 8 (1) (2014) 1.
- [17] J. Gagneur, S. Klamt, Computation of elementary modes: a unifying framework and the new binary approach, BMC bioinformatics 5 (1) (2004) 1.
- [18] M. Terzer, J. Stelling, Large-scale computation of elementary flux modes with bit pattern trees, Bioinformatics 24 (19) (2008) 2229–2235.
- [19] A. Von Kamp, S. Schuster, Metatool 5.0: fast and flexible elementary modes analysis, Bioinformatics 22 (15) (2006) 1930–1931.
- [20] E. Ullah, S. Aeron, S. Hassoun, gEFM: an algorithm for computing elementary flux modes using graph traversal, IEEE/ACM Transactions on Computational Biology and Bioinformatics 13 (1) (2016) 122–134.
- [21] F. Khalid, Z. Nikoloski, P. Tröger, A. Polze, Heterogeneous combinatorial candidate generation, in: European Conference on Parallel Processing, Springer, 2013, pp. 751–762.
- [22] L. F. De Figueiredo, A. Podhorski, A. Rubio, C. Kaleta, J. E. Beasley, S. Schuster, F. J. Planes, Computing the shortest elementary flux modes in genome-scale metabolic networks, Bioinformatics 25 (23) (2009) 3158–3165.
- [23] L. David, A. Bockmayr, Computing elementary flux modes involving a set of target reactions, IEEE/ACM Transactions on Computational Biology and Bioinformatics 11 (6) (2014) 1099–1107.
- [24] M. Arabzadeh, M. S. Zamani, M. Sedighi, S.-A. Marashi, A graph-based approach to analyze flux-balanced pathways in metabolic networks, Biosystems 165 (2018) 40–51.
- [25] I. Zevedei-Oancea, S. Schuster, Topological analysis of metabolic networks based on petri net theory, In silico biology 3 (3) (2003) 323–345.
- [26] K. Asanovic, R. Bodik, B. C. Catanzaro, J. J. Gebis, P. Husbands, K. Keutzer, D. A. Patterson, W. L. Plishker, J. Shalf, S. W. Williams, et al., The landscape of parallel computing research: A view from berkeley, Tech. rep., Technical Report UCB/EECS-2006-183, EECS Department, University of California, Berkeley (2006).
- [27] A. Provost, G. Bastin, Dynamic metabolic modelling under the balanced growth condition, Journal of Process Control 14 (7) (2004) 717–728.
- [28] K. P. Jayapal, K. F. Wlaschin, W. Hu, M. G. Yap, et al., Recombinant protein therapeutics from CHO cells-20 years and counting, Chemical Engineering Progress 103 (10) (2007) 40.
- [29] X. Xu, H. Nagarajan, N. E. Lewis, S. Pan, Z. Cai, X. Liu, W. Chen, M. Xie, W. Wang, S. Hammond, et al., The genomic sequence of the chinese hamster ovary (CHO)-K1 cell line, Nature biotechnology 29 (8) (2011) 735–741.
- [30] Z. A. King, A. Dräger, A. Ebrahim, N. Sonnenschein, N. E. Lewis, B. O. Palsson, Escher: a web application for building, sharing, and embedding data-rich visualizations of biological pathways, PLoS Comput Biol 11 (8) (2015) e1004321.
- [31] Z. A. King, J. Lu, A. Dräger, P. Miller, S. Federowicz, J. A. Lerman, A. Ebrahim, B. O. Palsson, N. E. Lewis, Bigg models: A platform for integrating, standardizing and sharing genome-scale models, Nucleic acids research 44 (D1) (2015) D515–D522.
- [32] S. Klamt, U.-U. Haus, F. Theis, Hypergraphs and cellular networks, PLoS computational biology 5 (5) (2009) e1000385.
- [33] S. A. Marashi, M. Tefagh, A mathematical approach to emergent properties of metabolic networks: Partial coupling relations, hyperarcs and flux ratios, Journal of theoretical biology 355 (2014) 185–193.
- [34] T. Pfeiffer, I. Sánchez-Valdenebro, J. Nuño, F. Montero, S. Schuster, Metatool: for studying metabolic networks., Bioinformatics (Oxford, England) 15 (3) (1999) 251–257.
- [35] S. Hoops, S. Sahle, R. Gauges, C. Lee, J. Pahle, N. Simus, M. Singhal, L. Xu, P. Mendes, U. Kummer, Copasi- a complex pathway simulator, Bioinformatics 22 (24) (2006) 3067–3074.
- [36] S. A. Riemer, metano-an open-source toolbox for the reconstruction and analysis of genome-scale metabolic models, Ph.D. thesis (2013).
- [37] S. H. Chan, L. Wang, S. Dash, C. D. Maranas, Accelerating flux balance calculations in genome-scale metabolic models by localizing the application of loopless constraints, Bioinformatics 34 (24) (2018) 4248–4255.
- [38] H. Silva, M. Martins, A cellular automata model for cell differentiation, Physica A: Statistical Mechanics and its Applications 322 (2003) 555–566.
- [39] D. S. Wishart, R. Yang, D. Arndt, P. Tang, J. Cruz, Dynamic cellular automata: an alternative approach to cellular simulation, In silico biology 5 (2) (2005) 139–161.
- [40] G. J. Martínez, A. Adamatzky, B. Chen, F. Chen, J. C. Seck-Tuoh-Mora, Simple networks on complex cellular automata: from de bruijn diagrams to jump-graphs, in: Evolutionary Algorithms, Swarm Dynamics and Complex Networks, Springer, 2018, pp. 241–264.
- [41] D. Machado, Z. Soons, K. R. Patil, E. C. Ferreira, I. Rocha, Random sampling of elementary flux modes in large-scale metabolic networks, Bioinformatics 28 (18) (2012) i515–i521.
- [42] N. Hadadi, J. Hafner, K. C. Soh, V. Hatzimanikatis, Reconstruction of biological pathways and metabolic networks from in silico labeled metabolites, Biotechnology journal 12 (1).
- [43] Y. Huang, C. Zhong, H. X. Lin, J. Wang, A method for finding metabolic pathways using atomic group tracking, PloS one 12 (1) (2017) e0168725.