Multiband Plasmonic Sierpinski Carpet Fractal Antennas
Abstract
Deterministic fractal antennas are employed to realize multimodal plasmonic devices. Such structures show strongly enhanced localized electromagnetic fields typically in the infrared range with a hierarchical spatial distribution. Realization of engineered fractal antennas operating in the optical regime would enable nanoplasmonic platforms for applications, such as energy harvesting, light sensing, and bio/chemical detection. Here, we introduce a novel plasmonic multiband metamaterial based on the Sierpinski carpet (SC) space-filling fractal, having a tunable and polarization-independent optical response, which exhibits multiple resonances from the visible to mid-infrared range. We investigate gold SCs fabricated by electron-beam lithography on CaF2 and Si/SiO2 substrates. Furthermore, we demonstrate that such resonances originate from diffraction-mediated localized surface plasmons, which can be tailored in deterministic fashion by tuning the shape, size, and position of the fractal elements. Moreover, our findings illustrate that SCs with high order of complexity present a strong and hierarchically distributed electromagnetic near-field of the plasmonic modes. Therefore, engineered plasmonic SCs provide an efficient strategy for the realization of compact active devices with a strong and broadband spectral response in the visible/mid-infrared range. We take advantage of such a technology by carrying out surface enhanced Raman spectroscopy (SERS) on Brilliant Cresyl Blue molecules deposited onto plasmonic SCs. We achieve a broadband SERS enhancement factor up to , thereby providing a proof-of-concept application for chemical diagnostics.
keywords:
Au sierpinski carpet fractal; quasi-periodic photonic crystal; surface enhanced Raman spectroscopy; localized surface plasmon; chemical sensor; antenna metamaterial![[Uncaptioned image]](/html/1804.02866/assets/TOC.jpg)
Artistic illustration of an Au Sierpinski carpet.
Over the past decade, there has been a strong and ongoing interest in developing the design of fractal metamaterials for compact, multiband, and high-gain antennas intended for radio-frequency applications 1, THz resonators 2, 3, 4 and lasers 5, and microwave devices 6, 1. Also, in the mid-infrared range plasmonic fractal structures have been reported to act as frequency-selective photonic quasi-crystals 7, 8, 9, 10, 11, 12, 13, 14, 15. Besides a few attempts by Dal Negro et al. 16, 17, research in the visible range is still in an early stage. This is due to the expensive and challenging fabrication of nanofractals, resulting from the need of high-resolution electron- or ion-beam techniques.
In this regard, plasmonic deterministic fractals 7 offer the effective control and reproducibility of their optical properties, by adjusting their size, shape, and position. The scale-invariance property of deterministic fractals may be exploited to realize devices with a tailorable, self-similar, and multimodal spectral response. Furthermore, such fractals can provide a potential platform to study enhanced light-matter interactions. Moreover, the tunable plasmonic near-field enhancement may lead to the realization of advanced optoelectronic devices, such as solar cells 18, photodetectors 14, 19, and on-chip sensors of multiple bio/chemical assays (multiplexers) 15, 10, 20, 17.
Here, we present the fabrication, optical characterization, and electromagnetic simulation of Au plasmonic structures inspired by the Sierpinski carpet (SC) deterministic fractal 21. Up to date, such SCs have been experimentally studied mainly in the far-infrared range 12, 13, while at optical frequencies only calculations have been reported 22, 18. We systematically investigated both experimentally and theoretically plasmonic SCs from the visible to mid-infrared (VIS-MIR) range. In particular, we realized for the first time a space-filling SC with five orders of complexity. We show that the fractal acts as a photonic quasi-crystal 23, due to the self-similar and hierarchical arrangement of its elements, with a multiband spectral response over the full investigated range, which can be tuned by controlling the fractal size, thickness, and order. We demonstrate that the resonances observed in the extinction spectra are diffraction-mediated surface plasmons. Furthermore, we illustrate by means of surface enhanced Raman spectroscopy (SERS) 24, 25, 26, 27 that such plasmonic SCs are able to confine strong electromagnetic fields down to the nanoscale (sub-diffraction focusing) and on a broadband range of the electromagnetic spectrum, thereby providing a promising application for bio/chemical sensing.
Results and discussion
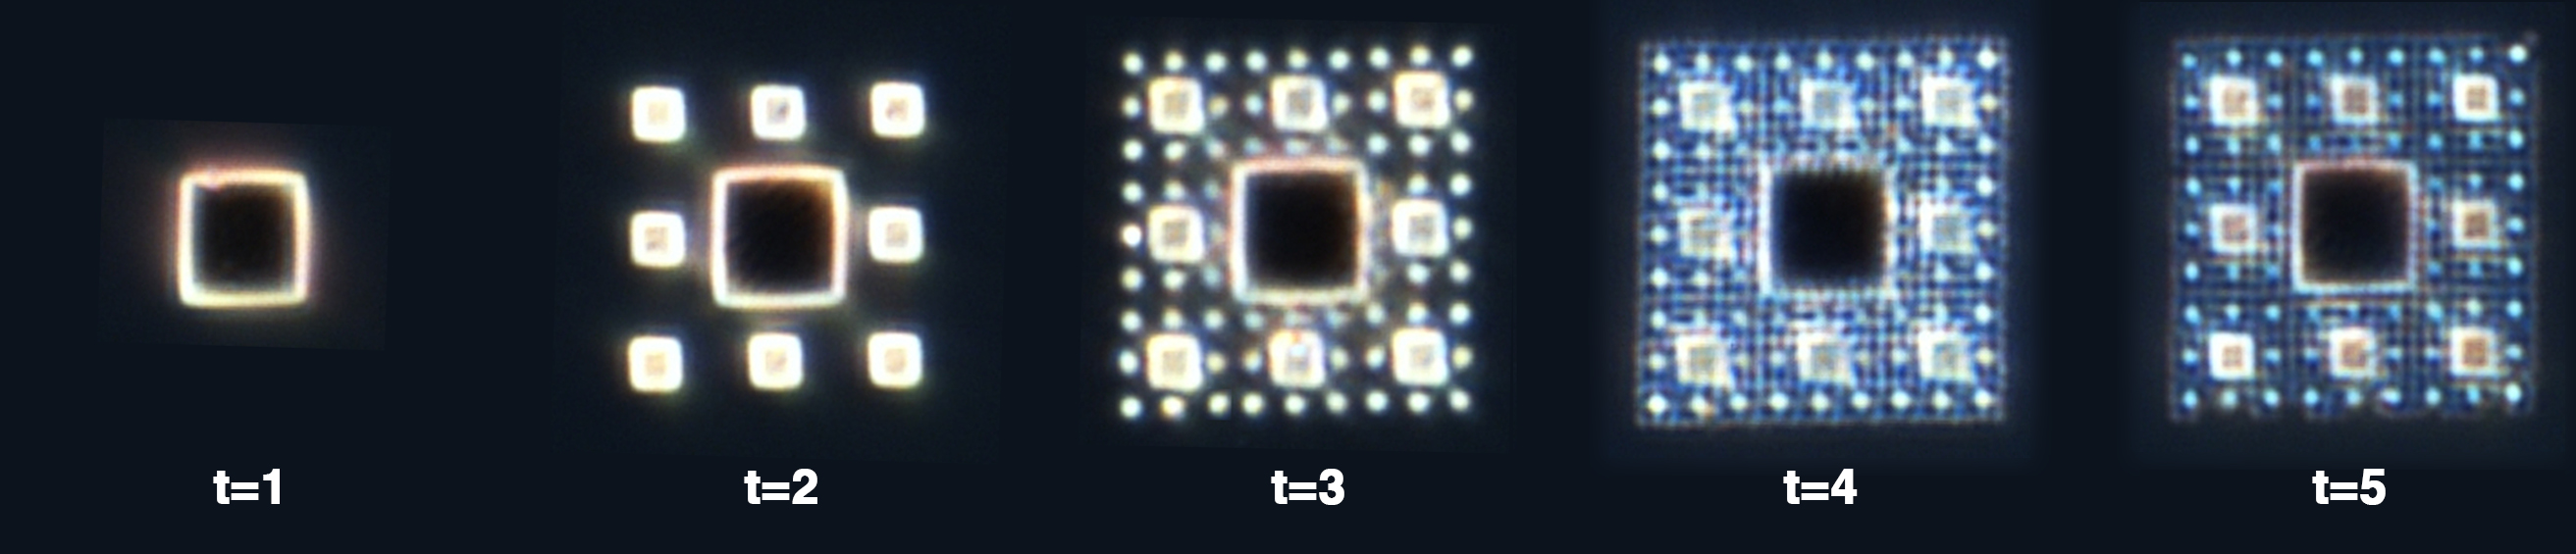
Deterministic fractals 21 are self-similar objects generated by geometrical rules, having a non-integer (Hausdorff-Besicovitch) dimension. Sierpinski carpets can be generated by a recursive geometrical algorithm employing a Lindenmayer system implementation 28 (see Supporting Information 1). Practically, our Au SCs are designed starting from a unit cell of side m that is divided into a array of sub-cells of lateral size , with an Au square placed in the central sub-cell. By iteratively applying the same rule to the generated sub-cells of size , it is possible to obtain fractals for higher orders of complexity. At each iteration the side of the sub-cells is reduced by a factor . Since the number of empty sub-cells in the SC increases by a factor at every iteration, the fractal dimension is , while the topological dimension of such a discrete system is zero.
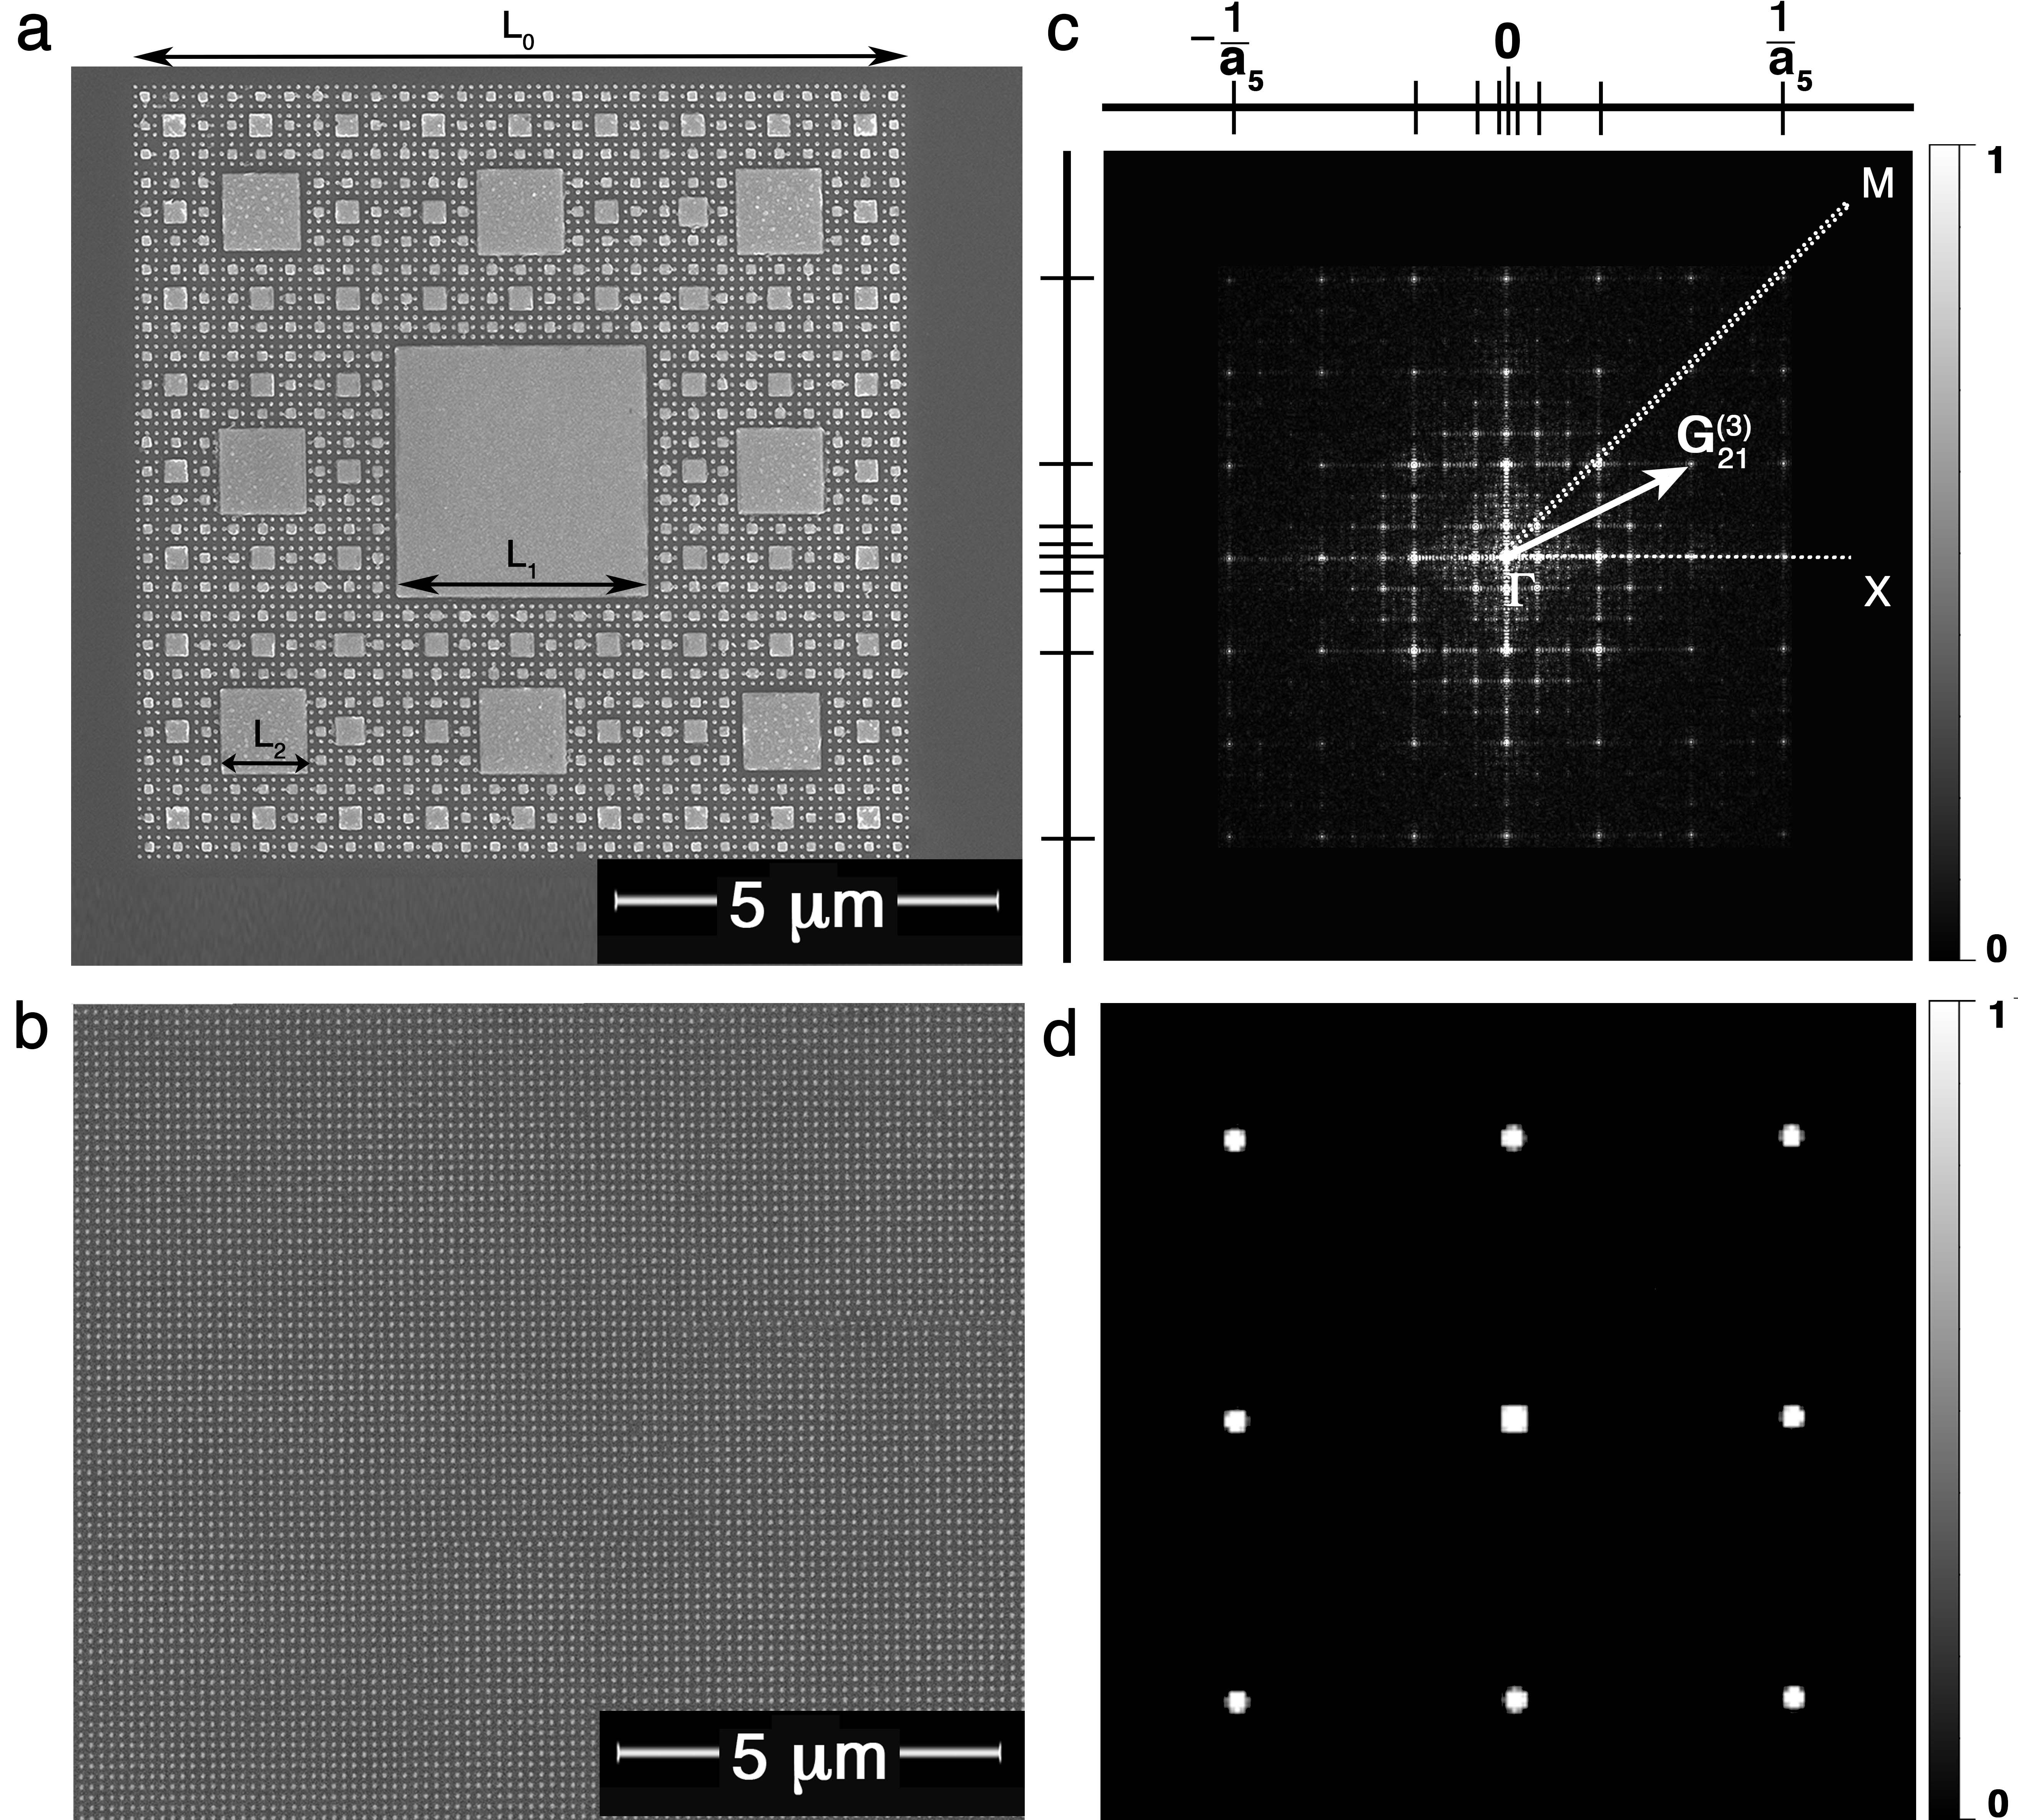
By employing electron-beam lithography, metal evaporation, and lift-off techniques (see Methods), we fabricated the first five orders of an Au SC on CaF2 and Si/SiO2 substrates (Supporting Information 2). The nominal thickness of the Au squares ranged from nm to nm, while their lateral sizes were m, m, nm, nm, and nm. The representative scanning electron microscopy (SEM) micrograph of the sample for in Figure 1 show the excellent homogeneity and uniformity of the fractal structure. In addition, we realized periodic arrays of Au squares with lateral size , as a reference. A periodic array with size is reported in Figure 1b.
Our fractal structure can be regarded as a metallo-dielectric photonic crystal. However, the quasi-periodic 23 and self-similar arrangement of the square elements forming the SC crystalline lattice breaks, due to its long-range order, the translational invariance property typical of periodic photonic crystals 29, while retaining a scale invariance. Therefore, fractals have also self-similar and non-discrete reciprocal lattices 7. In Figure 1c,d a comparison between the singular-continuous 7 reciprocal lattice of the SC for and the discrete square reciprocal lattice of the periodic array with square size is provided, respectively, by computing the Fourier transform of their SEM micrographs. As confirmed by the box-counting method (see Supporting Information 3), the reciprocal lattice of the SC is self-similar. Also, the SC has a larger number of points in the reciprocal space than the periodic array, since its fractal reciprocal lattice is a superposition of five periodic lattices with different constants , under the periodic approximation 7, 30. Starting from the origin, each point of the SC reciprocal lattice in Figure 1c is defined by a reciprocal lattice vector . It is worth mentioning that also is scale-invariant as , thereby realizing a hierarchy of first pseudo-Brillouin zones . It follows that the diffraction patterns and the related optical spectra of such fractals are themselves self-similar 31, 23, 7, with a larger number of allowed optical states than in periodic arrays (Figure 1d). All these features make fractals, such as the SC, an intriguing geometry for the realization of a novel class of photonic quasi-crystals 7.
Surface plasmons are collective charge oscillations at the interface between a dielectric and a thin metal surface, which can be excited by light, for instance 32. When the conductor size is much smaller than the wavelength of the incident light (), surface plasmons tend to be spatially localized around the structure 33.
In the case of periodic and quasi-periodic photonic crystals, when the wavelength of a localized surface plasmon (LSP) resonance is slightly larger than the lattice constant, the photonic mode, due to the optical diffraction associated with the lattice, couples to the plasmonic mode of each particle to produce a hybrid mode 7, 34, 35, 36, 37, 12, 13, 16, 38, 39 (Wood anomaly). In particular, when the wavelength of the incident light is larger than the lattice spacing (Rayleigh cutoff), all the diffracted waves other than the zeroth order are evanescent and all the particles are radiating in phase by dipolar coupling in the plane of the grating. This results from the momentum-matching condition 35, 36, 16, 38 , where is the diffracted beam wavevector, is the effective dielectric constant of the lattice, is the wavevector of the incident light, is its angle of incidence with respect to the lattice surface normal, and are the lattice wavevectors. Herein, are the SC reciprocal vectors . At normal incidence, diffraction-mediated LSPs can be excited when . We predict a set of four-fold degenerate LSP resonances, due to the square lattice symmetry, emerging in the Au SC optical spectra at self-similar wavelengths (critical modes 7)
| (1) |
where is the -th resonance at the -th fractal order.
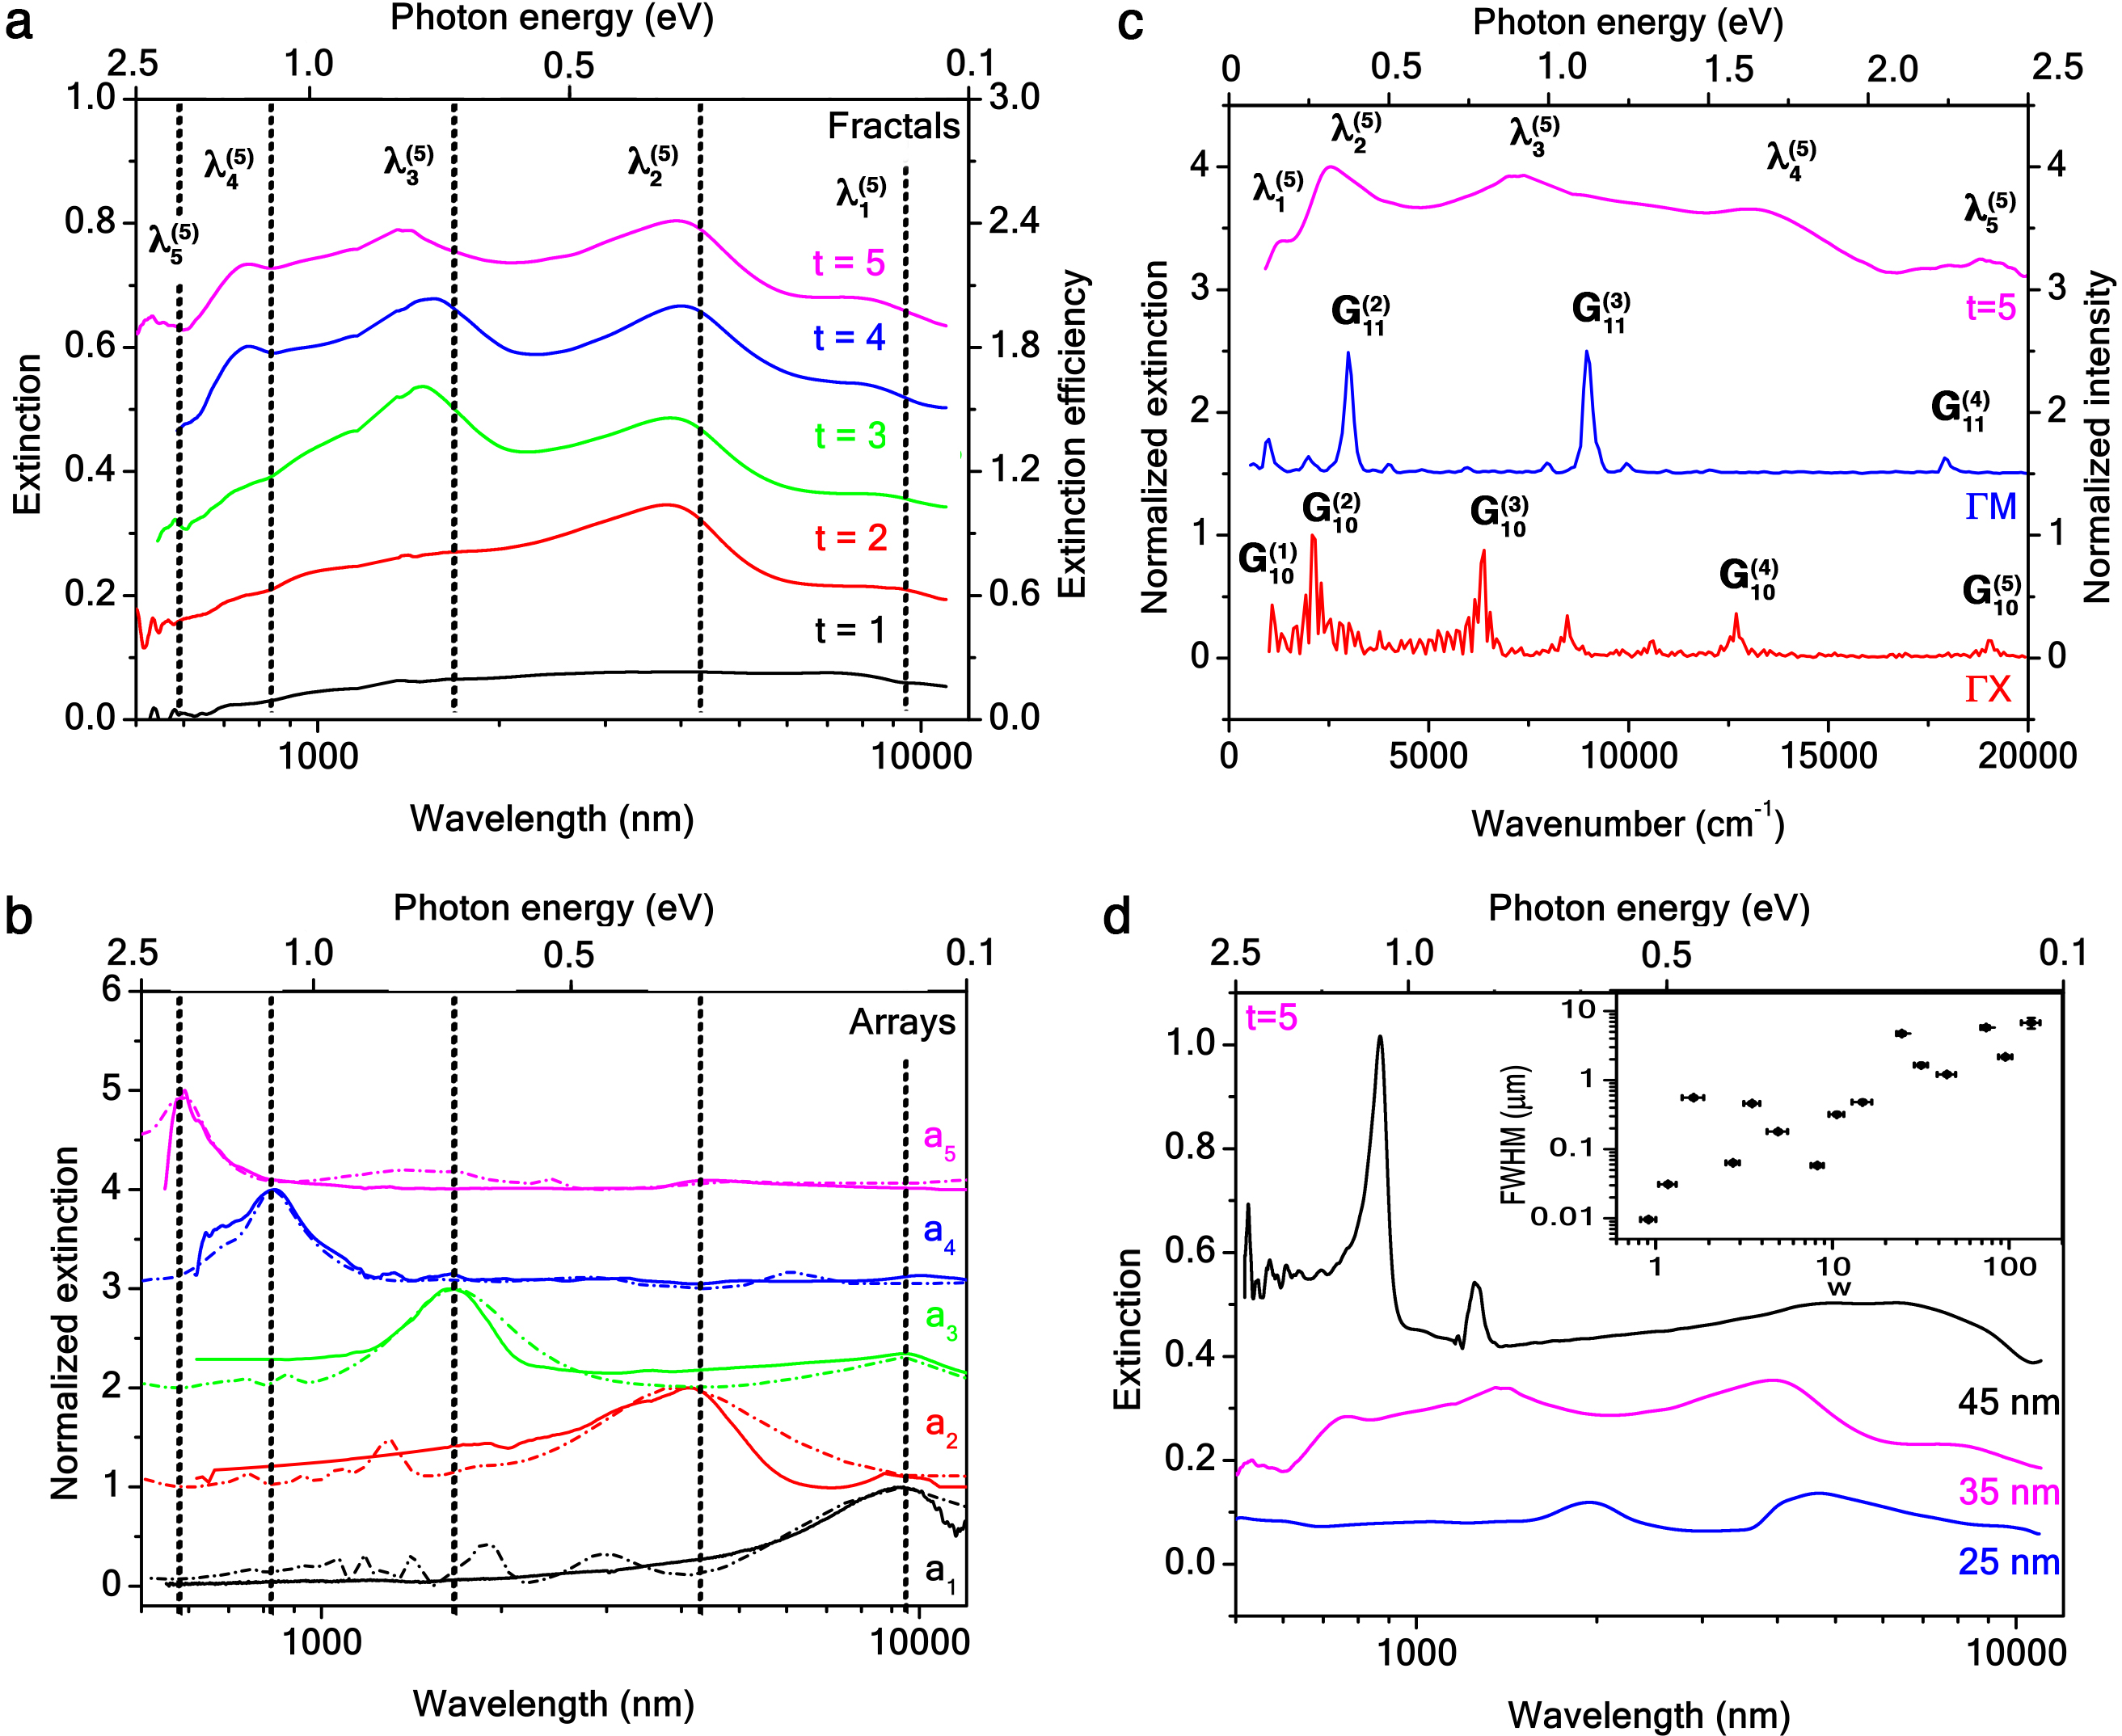
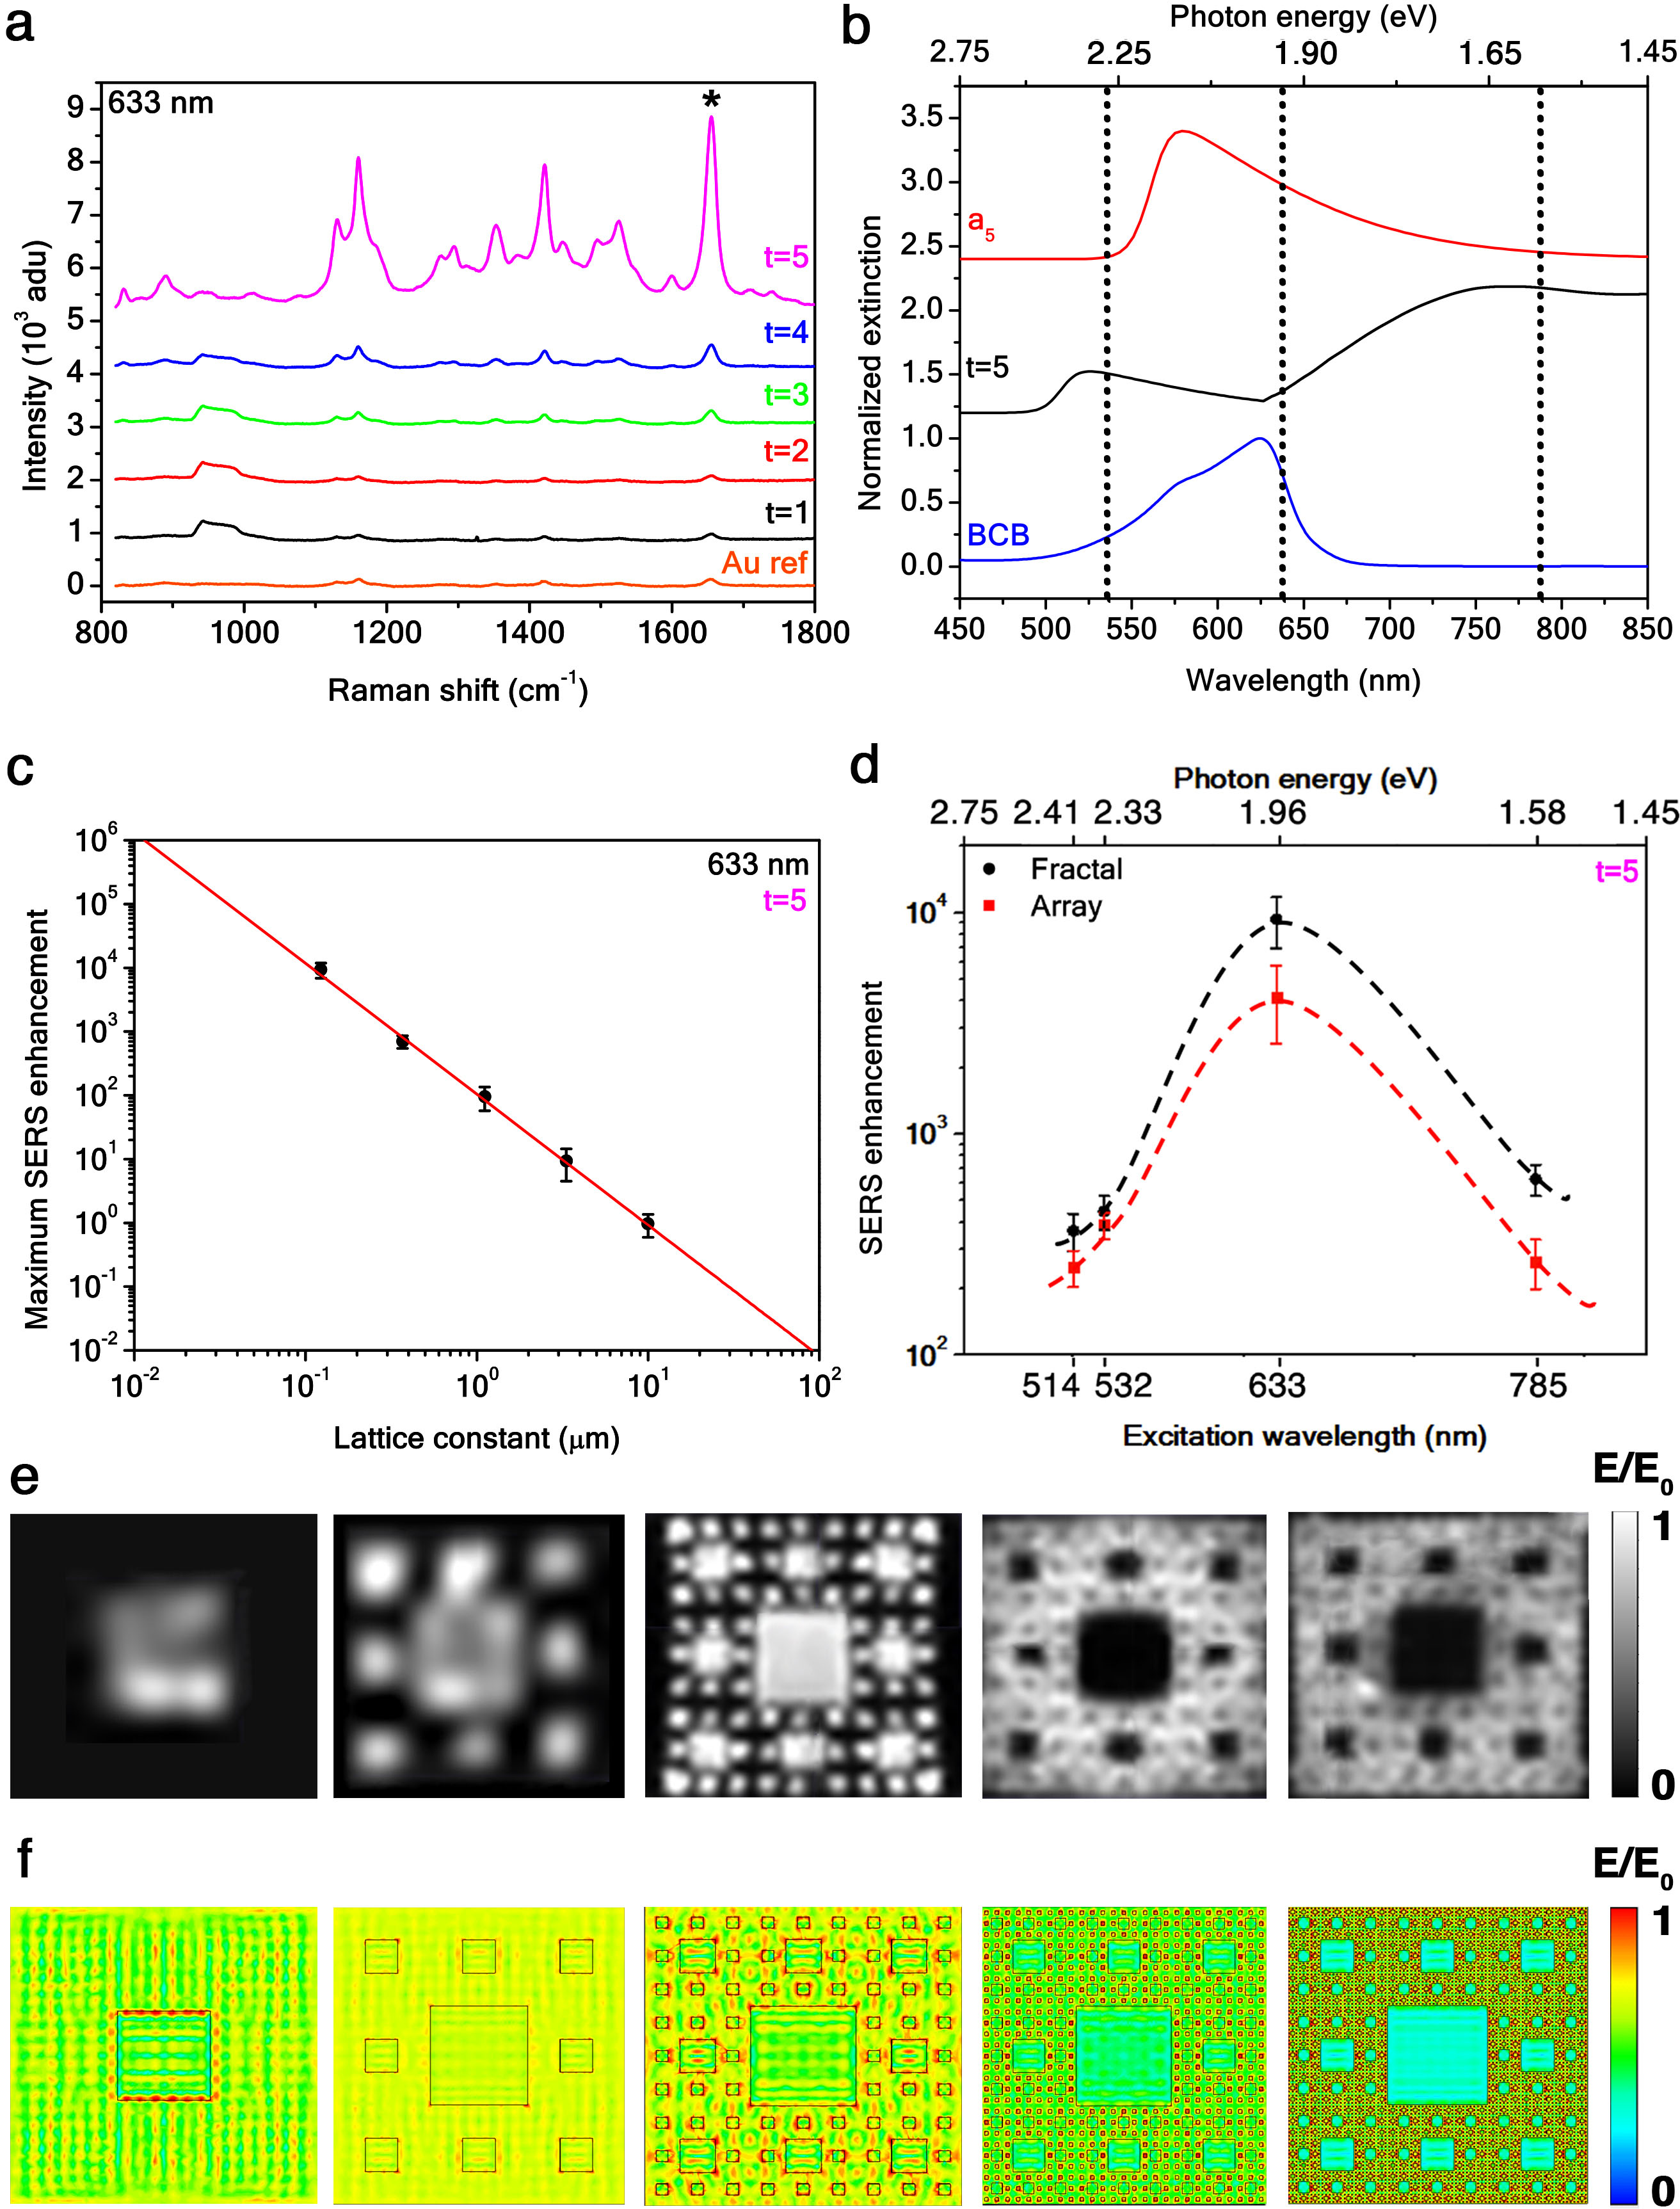
In Figure 2a, we observed the zeroth-order (the incident and detected light are collinear) extinction spectra of the Au SCs exhibiting multiple resonances in the VIS-MIR range. The extinction efficiency (i.e., the extinction divided by the total area of the fractal) of the resonances is up to 185%, thus showing an extraordinary extinction 40. From the comparison with the extinction spectra of the periodic arrays (Figure 2b), it is possible to infer that the position of the SC resonances scales linearly with the lattice constant (Figure 2b). The SC resonances are blue-shifted with respect to those of the periodic arrays, due to the coupling between the squares belonging to the different fractal orders. As depicted in Figure 2c, the position of the resonances in the SC extinction correspond to the first reciprocal lattice vector of each fractal order. However, such modes occur at slightly smaller wavenumbers than the Fourier peaks in the and directions obtained from Figure 1c (i.e., at wavelengths slightly larger than the lattice constants ), thus confirming that the origin of such resonances in the Au SC extinction spectra is not due to a diffraction mechanism, but to diffraction-mediated LSPs.
Furthermore, Au SCs are insensitive to the linear and diagonal polarization of the incident light, having a centrosymmetric geometry (see Supporting Information 4). This is an important feature in order to realize polarization-independent devices, since other fractal geometries 10, 11, 2, 7, 41 and conventional plasmonic structures 34, 33 usually depend strongly on light polarization.
On the other hand, SCs do depend on the thickness of the metal squares, since they must be optically thick to achieve a large extinction. This implies that the thickness must be several times the skin depth of the metal 34. Typical skin depths are on the order of 30-170 nm for Au in the VIS-MIR range. As illustrated in Figure 2d for an Au SC at , the extinction spectrum changes qualitatively for metal thicknesses ranging from nm to nm displaying sharp Fano resonances 42 in place of broad peaks (see Supporting Information 5). This suggests that the full-width-half-maximum (FWHM) of the LSPs depends on the aspect ratio (i.e., lateral size to thickness) 36. Indeed, the inset in Figure 2d shows that the closer the aspect ratio to unity, the sharper and the shorter in wavelength the resonance (see Supporting Information 6). Therefore, the sharpest resonance occurs when the structures are isotropic (cubic), and the broadest when they are oblate.
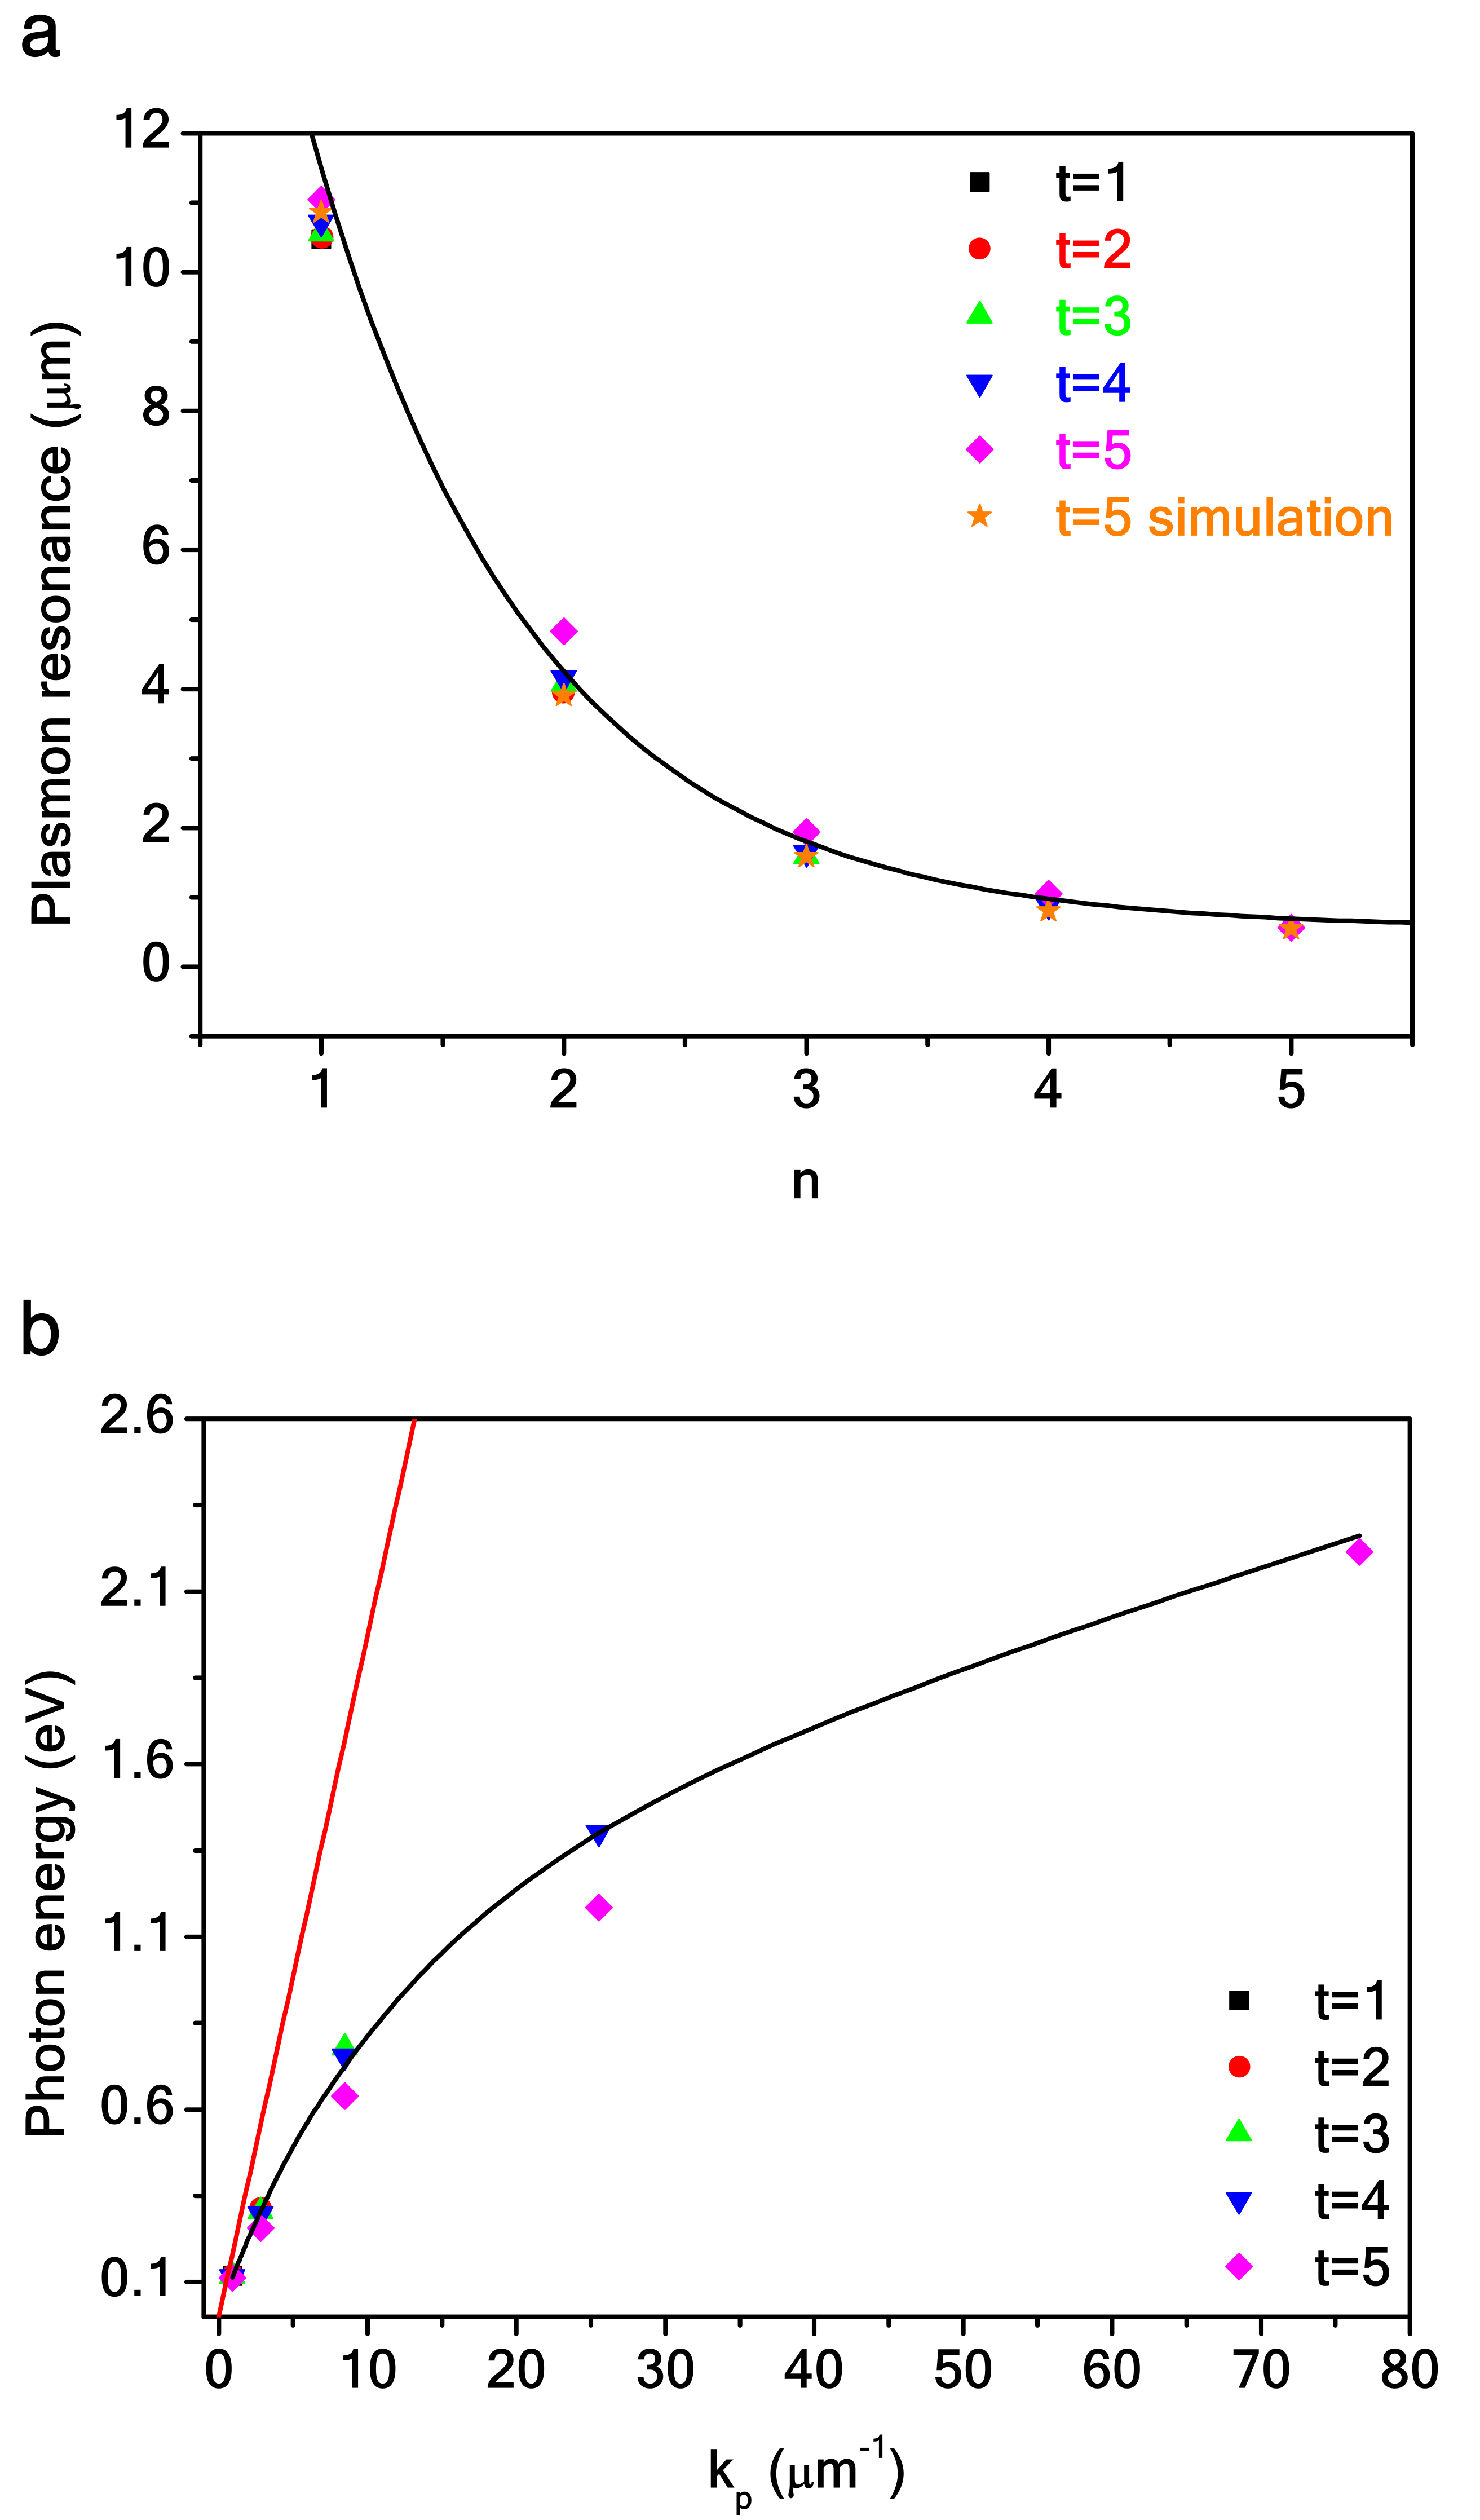
The SC optical spectrum at a given fractal order exhibits resonances with wavelength corresponding mainly to the first order of diffraction . Of such resonances, refer to the SC at order , although shifted by a factor owing to the far-field diffraction coupling among the increased number of squares 33. In Figure 3a the wavelengths of the peaks in the extinction measurement for each fractal order are plotted, along with the calculated data for . The best fit of the experimental data, which is in excellent agreement with the numerical simulations, is given by Equation 1 (where is treated as the fitting parameter), setting . The fit returns a fractal dimension . As predicted, such LSP resonances are self-similar as their wavelength has the same scale-invariance law () as the SC, depending on the fractal dimension as an exponential law. From data in Figure 2a, we can draw in Figure 3b the dispersion relation of diffraction-mediated LSP modes. Here, is the LSP wavevector of the SC, as shown in Figure 4. It follows that also is self-similar.
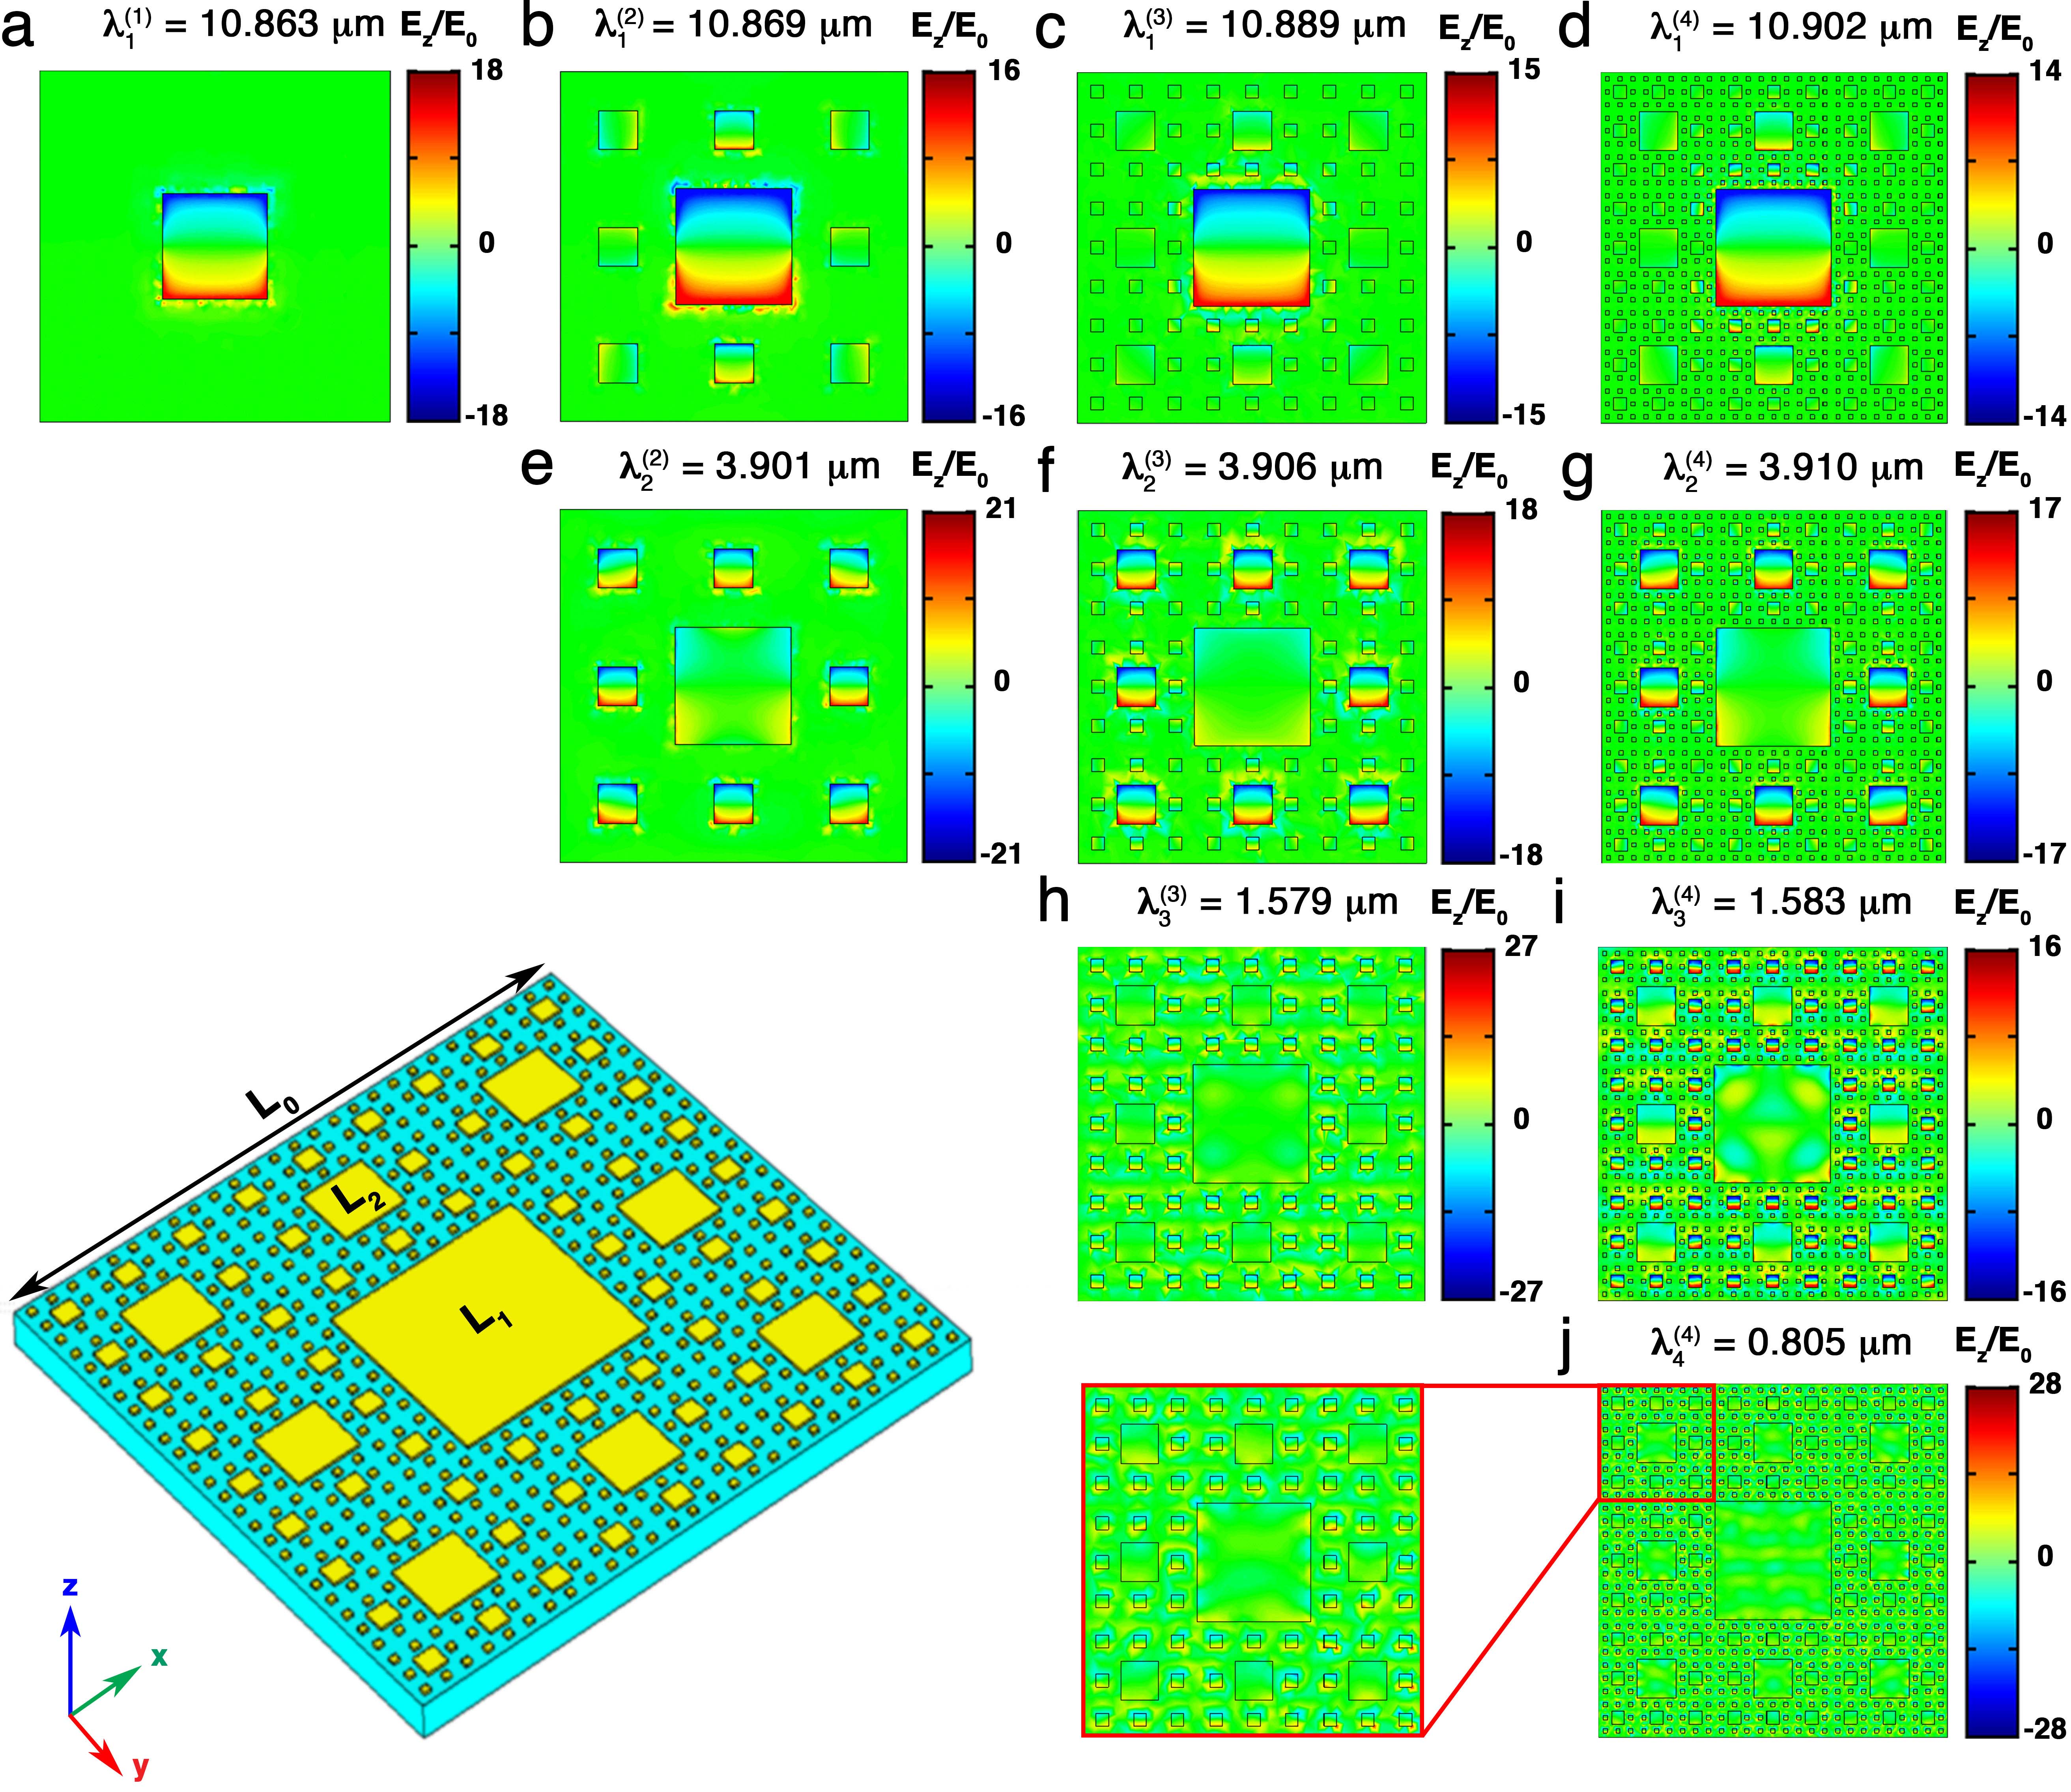
In order to investigate the electromagnetic behavior of the plasmonic SCs, we computed their electromagnetic near-field spatial distributions by finite element method analysis. In Figure 4, the calculated electric near-field enhancement is depicted for the fractal orders -4 at their LSP resonances. Our calculations show a resonant excitation of coupled dipolar antennas centered on the elements constituting the fractal. On the other hand, by increasing the fractal order, the system exhibits highly localized electromagnetic fields (hot spots) located on a sub-wavelength scale, resulting in additional plasmonic modes at shorter wavelengths. This mechanism provides a hierarchical multiscale of hot spots that transfer the excitations towards progressively smaller length scales, exhibiting large values of electric near-field enhancement. As a consequence of the SC fractal scaling the hot spot distribution of the resonant modes is self-similar. Two main phenomena can be distinguished. On one hand, a red-shift at a given LSP wavelength along with a decrease of its electric near-field intensity. As already stated for the far-field optical spectra, this is attributed to the coupling among structural elements of different size, with the difference that near-fields couple by dipolar interactions. On the other hand, new LSP modes arise at shorter wavelengths with higher intensity. Analogous considerations can be drawn for the magnetic field enhancement (see Supporting Information 7).
Another experimental evidence that LSPs can strongly couple by diffraction-mediated far-field interactions is presented in Figure 5. The micrographs, which refer to dark-field scattering maps of SCs illuminated using white light, illustrate characteristic localized spatial distributions with peculiar colors 16, which critically depend on the fractal order and on the distance between the squares. Hence, the interplay between short-range dipolar coupling (sub-wavelength near-field localization) and long-range far-field coupling (radiative multiple scattering) produces a variation of the near-field intensity and spatial distribution (Figure 4), and a wavelength shift of the LSP resonances along with a change in their intensity (Figure 2a) and far-field spatial distribution (Figure 5).
In order to experimentally confirm the computational model, we investigated the SC electric near-field spatial distributions by SERS measurements on a thin layer ( nm) of Brilliant Cresyl Blue (BCB) dye [(C17H20ClN3O)2ZnCl2], as a probe deposited on the Au SCs. Average Raman spectra of the samples acquired at nm are plotted in Figure 6a for fractal orders -5 and for an unpatterned Au film, as a reference. The excitation wavelength is resonant with the dye (Figure 6b). The Raman spectra show a series of vibrational bands, arising from the molecule, with an increasing intensity as a function of the fractal order. The enhancement of the Raman signal attributed to the SCs at higher orders is much stronger than that of the reference Au film, thus confirming the presence of hot spots. We selected the strongest BCB vibrational mode , corresponding to the coupling of NH2 scissor mode with the asymmetric stretch mode of C rings 43, in order to evaluate the maximum SERS enhancement factor (see Supporting Information 8). The at nm as a function of the lattice constant of the fractals is reported in Figure 6c, while for the fractal at as a function of the incident wavelength is reported in Figure 6d. We found that increases with the fractal order as a power law. Despite BCB is resonant at nm, for orders -3 the enhancement factor is very small as no LSP mode is in resonance (Figure 6b). For orders -5, is highest as the excitation wavelength is not only resonant with the dye, but also with a LSP resonance of the SC. The resonant obtained at nm is about , while in the non-resonant case, for instance at nm, is about (Figure 6d). It means that a maximum electric field enhancement factor of about is provided in the resonant case, while of about in the non-resonant case. In particular, the latter factor is not affected by the dye fluorescence, thus is purely a surface-enhanced electromagnetic effect. We infer that the plasmonic fractal has a broadband , which is about twice higher in absolute value than an equivalent periodic array (Figure 6d), and such a structure could be used for multiplexing experiments with several assays absorbing in different ranges of the electromagnetic spectrum.
In Figure 6e, the spatial distributions of electric field enhancement , obtained from the the experimental Raman intensity maps of at nm normalized to the signal of the reference Au film, are reported for fractal orders -5. The contour plots present a maximum of contrast localized over the elements constituting the fractals for -3 orders. Differently, for -5 a large enhancement of the electric field is shown in between the structures of the previous orders, respectively in correspondence of the squares with size and . Note that since the area of the laser spot is 0.785 m2, the instrument averages out over the structures and . For instance, the intensity profile across the map at changes by a factor from the central square to the surrounding smaller squares (see Supporting Information 8). Therefore, the smaller the element size, the larger the electric field localization occurring on it due to LSPs supported by the Au structures, which decay rapidly outside the squares. Our results are in good agreement with those obtained by electromagnetic simulations shown in Figure 6f, and with the work by Hsu et al. 20. Notably, the computed map for has a maximum value of the electric field enhancement on squares at nm, which is comparable with the experimental value obtained .
In conclusion, we have demonstrated both experimentally and theoretically a novel multiband plasmonic antenna based on the compact design of a gold-based Sierpinski carpet fractal yielding multiresonant modes from the visible to mid-infrared range. This class of engineered devices offer promising applications for bio-chemical detection. As an example, we have carried out surface enhanced Raman spectroscopy on Brilliant Cresyl Blue molecules deposited onto a plasmonic Sierpinski carpet achieving a broadband enhancement factor up to . The exploitation of such plasmonic fractal antennas to improve the versatility of Raman spectroscopy in the routine application to biology and chemistry.
Methods
Sample fabrication
Sierpinski carpets were patterned by electron-beam lithography (Raith 150-Two) on CaF2 and Si/SiO2 substrates. A layer of approximately 160 nm of 950K poly-methyl-methacrylate (PMMA A2 1:1, 1% in anisole) was deposited by spincoating on the substrates previously cleaned by O2 plasma, then post-baked for 7 min on a hot plate at 180∘ C. In order to prevent charge accumulation due to the electron beam, a 10 nm thick Al conductive layer was deposited on CaF2 substrates at a rate of 0.2 Å/s by thermal evaporation (Kurt J. Lesker) at an operating pressure of mbar. The electron beam was operated at 20 kV with a current of 35 pA. The SC patterns were exposed with a varying dose inversely proportional to the size of the squares of the fractal. The conductive layer was removed by washing it in KOH (1 M) for 10 seconds, followed by rinsing in deionized water. The resist was developed for 30 s in a cold (8∘ C) 1:3 mixture of MIBK:IPA. A nm (where is 25-45 nm) thick Ti/Au film was deposited on the substrates at a rate of 0.2 Å/s by electron-beam evaporation (Kenosistec) at an operating pressure of mbar. Lift-off was then performed by hot acetone. For Raman measurements, SCs were dip-coated for 1 h in 1 mM BCB aqueous solution, then rinsed in deionized water to wash the excess molecules in order to form a thin layer about 10 nm thick, and finally dried in nitrogen flow.
Sample characterization
Scanning electron microscopy micrographs of SC samples deposited on Si/SiO2 were acquired by FEI Helios NanoLab DualBeam 650. Atomic force microscopy height profiles of the samples deposited on Si/SiO2 were measured in tapping mode by Bruker Innova in combination with V-type cantilever and SiN tips. Optical spectroscopy in transmission mode was performed with unpolarized and polarized light on SCs deposited on CaF2 substrates, by Thermo Fisher FTIR spectrometer and Thermo Scientific Nicolet Continum microscope equipped with NO2-cooled MCT and Si detectors, KBr and quartz beamsplitters, and a 15 (0.58 N.A.) Cassegrain objective. Surface enhanced Raman spectroscopy was carried out by Renishaw inVia micro-Raman microscope equipped with a 150 (0.95 N.A.) objective and nm, nm, nm, and nm laser sources at a power 0.5 mW and integration time 10 s. All spectra were calibrated with respect to the first-order silicon LO phonon peak at 520 cm-1 and recorded in backscattering geometry at room temperature. Raman measurements were performed on BCB adsorbed on SCs and as a reference on a nm thick (3 nm root-mean-square roughness) Au film deposited on the same Si/SiO2 substrate of the fractals. Raman maps of the BCB cm-1 vibrational mode were scanned at 0.3 m steps in both the directions in the plane of the sample. Renishaw WiRE 3.0 software was used to analyze the collected spectra, whose baseline was corrected to the third-order polynomial. Dark-field images of the SC samples were recorded by Nikon Eclipse upright microscope. Samples were illuminated with unpolarized white light by a 50 W halogen lamp in transmission mode. The light scattered by the SCs was collected with a 100 (0.96 N.A.) objective and imaged by a digital camera.
{acknowledgement}
This work was supported by the European Union’s Horizon 2020 research and innovation programme under Grant Agreement No. 696656 Graphene Flagship – Core1.
The authors declare no competing financial interests.
Supporting Information. Detailed information on the generating algorithm of the fractals, additional experimental data, fractal analysis, optical response with polarized light, fitting of the extinction resonances, scaling of the plasmons, magnetic near-field simulations of the fractal, details on SERS measurements.
References
- Werner and Ganguly 2003 Werner, D. H.; Ganguly, S. An Overview of Fractal Antenna Engineering Research. IEEE Antennas Propag. Mag. 2003, 45, 38–57
- Miyamaru et al. 2008 Miyamaru, F.; Saito, Y.; Takeda, M. W.; Hou, B.; Liu, L.; Wen, W.; ; Sheng, P. Terahertz Electric Response of Fractal Metamaterial Structures. Phys. Rev. B 2008, 77, 0451241–0451246
- Maraghechi and Elezzabi 2010 Maraghechi, P.; Elezzabi, A. Y. Enhanced THz Radiation Emission from Plasmonic Complementary Sierpinski Fractal Emitters. Opt. Express 2010, 18, 27336–27345
- Agrawal et al. 2009 Agrawal, A.; Matsui, T.; Zhu, W.; Nahata, A.; Vardeny, Z. V. Terahertz Spectroscopy of Plasmonic Fractals. Phys. Rev. Lett. 2009, 102, 1139011–1139014
- Mahler et al. 2010 Mahler, L.; Tredicucci, A.; Beltram, F.; Walther, C.; Faist, J.; Beere, H. E.; Ritchie, D. A.; Wiersma, D. S. Quasi-Periodic Distributed Feedback Laser. Nature Photonics 2010, 4, 165–169
- Wen et al. 2005 Wen, W.; Zhou, L.; Hou, B.; Chan, C. T.; Sheng, P. Resonant Transmission of Microwaves through Subwavelength Fractal Slits in a Metallic Plate. Phys. Rev. B 2005, 72, 1534061–1534064
- Dal Negro and Boriskina 2012 Dal Negro, L.; Boriskina, S. V. Deterministic Aperiodic Nanostructures for Photonics and Plasmonics Applications. Laser Photonics Rev. 2012, 6, 178–218
- Hou et al. 2010 Hou, B.; Liao, X. Q.; Poon, J. K. S. Resonant Infrared Transmission and Effective Medium Response of Subwavelength H-Fractal Apertures. Opt. Express 2010, 18, 3946–3951
- Huang et al. 2010 Huang, X.; Xiao, S.; Ye, D.; Huangfu, J.; Wang, Z.; Ran, L.; Zhou, L. Fractal Plasmonic Metamaterials for Subwavelength Imaging. Opt. Express 2010, 18, 10377–10387
- Aslan et al. 2016 Aslan, E.; Aslan, E.; Wang, R.; Hong, M. K.; Erramilli, S.; Turkmen, M.; Saracoglu, O. G.; Negro, L. D. Multispectral Cesaro-Type Fractal Plasmonic Nanoantennas. ACS Photonics 2016, 3, 2102–2111
- Gottheim et al. 2015 Gottheim, S.; Zhang, H.; Govorov, A. O.; Halas, N. J. Fractal Nanoparticle Plasmonics: The Cayley Tree. ACS Nano 2015, 9, 3284–3292
- Bao et al. 2007 Bao, Y.-J.; Zhang, B.; Wu, Z.; Si, J.-W.; Wang, M.; Peng, R.-W.; Lu, X.; Shao, J.; Li, Z.-F.; Hao, X.-P.; Ming, N.-B. Surface-Plasmon-Enhanced Transmission through Metallic Film Perforated with Fractal-Featured Aperture Array. Appl. Phys. Lett. 2007, 90, 2519141–2519143
- Bao et al. 2008 Bao, Y.-J.; Li, H.-M.; Chen, X.-C.; Peng, R.-W.; Wang, M.; Lu, X.; Shao, J.; Ming, N.-B. Tailoring the Resonances of Surface Plasmas on Fractal-Featured Metal Film by Adjusting Aperture Configuration. Appl. Phys. Lett. 2008, 92, 1519021–1519023
- Aygar et al. 2016 Aygar, A. M.; Balci, O.; Cakmakyapan, S.; Kocabas, C.; Caglayan, H.; Ozbay, E. Comparison of Back and Top Gating Schemes with Tunable Graphene Fractal Metasurfaces. ACS Photonics 2016, 3, 2303–2307
- Aouani et al. 2013 Aouani, H.; Rahmani, M.; Šípová, H.; Torres, V.; Hegnerová, K.; Beruete, M.; Homola, J.; Hong, M.; Navarro-Cía, M.; Maier, S. A. Plasmonic Nanoantennas for Multispectral Surface-Enhanced Spectroscopies. J. Phys. Chem. C 2013, 117, 18620–18626
- Gopinath et al. 2008 Gopinath, A.; Boriskina, S. V.; Feng, N.-N.; Reinhard, B. M.; Negro, L. D. Photonic-Plasmonic Scattering Resonances in Deterministic Aperiodic Structures. Nano Lett. 2008, 8, 2423–2431
- Lee et al. 2010 Lee, S. Y.; Amsden, J. J.; Boriskina, S. V.; Gopinath, A.; Mitropolous, A.; Kaplan, D. L.; Omenetto, F. G.; Negro, L. D. Spatial and Spectral Detection of Protein Monolayers with Deterministic Aperiodic Arrays of Metal Nanoparticles. PNAS 2010, 107, 12086–12090
- Zhu et al. 2013 Zhu, L.-H.; Shao, M.-R.; Peng, R.-W.; Fan, R.-H.; Huang, X.-R.; Wang, M. Broadband Absorption and Efficiency Enhancement of an Ultra-thin Silicon Solar Cell with a Plasmonic Fractal. Opt. Express 2013, 21, 313–323
- Fang et al. 2017 Fang, J.; Wang, D.; DeVault, C. T.; Chung, T.-F.; Chen, Y. P.; Boltasseva, A.; Shalaev, V. M.; Kildishev, A. V. Enhanced Graphene Photodetector with Fractal Metasurface. Nano Lett. 2017, 17, 57–62
- Hsu et al. 2010 Hsu, K. H.; Back, J. H.; Fung, K.-H.; Ferreira, P. M.; Shim, M.; Fang, N. X. SERS EM Field Enhancement Study through Fast Raman mapping of Sierpinski Carpet Arrays. J. Raman Spectrosc. 2010, 41, 1124–1130
- Mandelbrot 1982 Mandelbrot, B. The Fractal Geometry of Nature; W. H. Freeman and Co.: New York, 1982
- Volpe et al. 2011 Volpe, G.; Volpe, G.; Quidant, R. Fractal Plasmonics: Subdiffraction Focusing and Broadband Spectral Response by a Sierpinski Nanocarpet. Opt. Express 2011, 19, 3612–3618
- Janot 1994 Janot, C. Quasicrystals - A Primer; Clarendon Press: Oxford, 1994
- De Angelis et al. 2011 De Angelis, F. et al. Breaking the Diffusion Limit with Super-Hydrophobic Delivery of Molecules to Plasmonic Nanofocusing SERS Structures. Nat. Photon. 2011, 5, 682–687
- Kneipp et al. 1997 Kneipp, K.; Wang, Y.; Kneipp, H.; Perelman, L. T.; Itzkan, I.; Dasari, R. R.; Feld, M. S. Single Molecule Detection Using Surface-Enhanced Raman Scattering (SERS). Phys. Rev. Lett. 1997, 78, 1667–1670
- Chirumamilla et al. 2014 Chirumamilla, M.; Toma, A.; Gopalakrishnan, A.; Das, G.; Zaccaria, R. P.; Krahne, R.; Rondanina, E.; Leoncini, M.; Liberale, C.; De Angelis, F.; Di Fabrizio, E. Plasmonic Nanostructures: 3D Nanostar Dimers with a Sub-10-nm Gap for Single-/Few-Molecule Surface-Enhanced Raman Scattering. Adv. Mater. 2014, 26, 2353–2358
- Gopalakrishnan et al. 2014 Gopalakrishnan, A.; Chirumamilla, M.; De Angelis, F.; Toma, A.; Proietti Zaccaria, R.; Krahne, R. Bimetallic 3D Nanostar Dimers in Ring Cavities: Recyclable and Robust Surface-Enhanced Raman Scattering Substrates for Signal Detection from Few Molecules. ACS Nano 2014, 8, 7986–7994
- Lindenmayer and Prusinkiewicz 1990 Lindenmayer, A.; Prusinkiewicz, P. The Algorithmic Beauty of Plants; Springer: New York, 1990
- Sakoda 2005 Sakoda, K. Optical Properties of Photonic Crystals; Springer: New York, 2005
- Gambaudo and Vignolo 2014 Gambaudo, J.-M.; Vignolo, P. Brillouin Zone Labelling for Quasicrystals. New Journal of Physics 2014, 16, 1–11
- Allain and Cloitre 1986 Allain, C.; Cloitre, M. Optical Diffraction on Fractals. Phys. Rev. B 1986, 33, 3566–3569
- Kittel 2005 Kittel, C. Introduction to Solid State Physics; John Wiley & Sons: New York, 2005
- Maier 2007 Maier, S. A. Plasmonics: Fundamentals and Applications; Springer: New York, 2007
- Genet and Ebbesen 2007 Genet, C.; Ebbesen, T. W. Light in Tiny Holes. Nature 2007, 445, 39–46
- Ghaemi et al. 1998 Ghaemi, H. F.; Thio, T.; Grupp, D. E.; Ebbesen, T. W.; Lezec, H. J. Surface Plasmons Enhance Optical Transmission through Subwavelength Holes. Phys. Rev. B 1998, 58, 6779–6782
- Ebbesen et al. 1998 Ebbesen, T. W.; Lezec, H. J.; Ghaemi, H. F.; Thio, T.; Wolff, P. A. Extraordinary Optical Transmission through Sub-Wavelength Hole Arrays. Nature 1998, 391, 667–669
- Matsui et al. 2007 Matsui, T.; Agrawal, A.; Nahata, A.; Vardeny, Z. V. Transmission Resonances through Aperiodic Arrays of Subwavelength apertures. Nature 2007, 446, 517–521
- Kravets et al. 2008 Kravets, V. G.; Schedin, F.; Grigorenko, A. N. Extremely Narrow Plasmon Resonances Based on Diffraction Coupling of Localized Plasmons in Arrays of Metallic Nanoparticles. Phys. Rev. Lett. 2008, 101, 0874031–0874034
- Auguie and Barnes 2008 Auguie, B.; Barnes, W. L. Collective Resonances in Gold Nanoparticle Arrays. Phys. Rev. Lett. 2008, 101, 1439021–1439024
- Lochbihler 1994 Lochbihler, H. Surface Polaritons on Gold-Wire Gratings. Phys. Rev. B 1994, 50, 4795–4801
- Chirumamilla et al. 2017 Chirumamilla, M.; Chirumamilla, A.; Roberts, A. S.; Proietti Zaccaria, R.; De Angelis, F.; Kristensen, P. K.; Krahne, R.; Bozhevolnyi, S. I.; Pedersen, K.; Toma, A. Hot-Spot Engineering in 3D Multi-Branched Nanostructures: Ultrasensitive Substrates for Surface-Enhanced Raman Spectroscopy. Adv. Optical Mater. 2017, 5, 1600836–1600836
- Luk’yanchuk et al. 2010 Luk’yanchuk, B.; Zheludev, N. I.; Maier, S. A.; Halas, N. J.; Nordlander, P.; Giessen, H.; Chong, C. T. The Fano Resonance in Plasmonic Nanostructures and Metamaterials. Nat. Mater. 2010, 9, 707–715
- Nieckarz et al. 2013 Nieckarz, R. J.; Oomens, J.; Berden, G.; Sagulenkoa, P.; Zenobi, R. Infrared Multiple Photon Dissociation (IRMPD) Spectroscopy of Oxazine Dyes. Phys. Chem. Chem. Phys. 2013, 15, 5049–5056