11email: royslater@astro-udec.cl,nagar@astro-udec.cl 22institutetext: Departamento de Física, Universidad de Concepción, Casilla 160-C, Concepción, Chile 33institutetext: Max-Planck-Institut für extraterrestrische Physik, Giessenbachstr. 1, D-85741, Garching, Germany 44institutetext: CAPES Foundation, Ministry of Education of Brazil, 70040-020, Brasília, Brazil 55institutetext: Instituto de Física, Universidade Federal do Rio Grande do Sul, 91501-970, Porto Alegre, RS, Brasil 66institutetext: SRON, Netherlands Institute for Space Research, Sorbonnelaan 2, NL-3584 CA Utrecht, the Netherlands 77institutetext: Department of Astrophysics/IMAPP, Radboud University, Nijmegen, PO Box 9010, NL-6500 GL Nijmegen, the Netherlands 88institutetext: Department of Physics, University of Bath, Claverton Down, Bath, BA2 7AY, UK 99institutetext: Departamento de Física/CCNE, Universidade Federal de Santa Maria, 97105-900, Santa Maria, RS, Brazil 1010institutetext: Department of Astronomy, The Ohio State University, 140 W 18th Avenue, Columbus, OH 43210, USA 1111institutetext: Center for Cosmology and AstroParticle Physics, The Ohio State University, 191 West Woodruff Avenue, Columbus, OH 43210, USA 1212institutetext: School of Physics and Astronomy, Rochester Institute of Technology, 85 Lomb Memorial Dr., Rochester, NY 14623, USA 1313institutetext: Instituto de Física y Astronomía, Universidad de Valparaíso, Avda. Gran Bretaña 1111, Valparaíso, Chile
Outflows in the inner kiloparsec of NGC 1566 as revealed by molecular (ALMA) and ionized gas (Gemini-GMOS/IFU) kinematics
Abstract
Context. Tracing nuclear inflows and outflows in AGNs, determining the mass of gas involved in these, and their impact on the host galaxy and nuclear black hole, requires 3-D imaging studies of both the ionized and molecular gas.
Aims. We aim to map the distribution and kinematics of molecular and ionized gas in a sample of active galaxies, to quantify the nuclear inflows and outflows. Here, we analyze the nuclear kinematics of NGC 1566 via ALMA observations of the CO J:2-1 emission at 24 pc spatial and 2.6 km s-1 spectral resolution, and Gemini-GMOS/IFU observations of ionized gas emission lines and stellar absorption lines at similar spatial resolution, and 123 km s-1 of intrinsic spectral resolution.
Methods. The morphology and kinematics of stellar, molecular (CO) and ionized ([N II]) emission lines are compared to the expectations from rotation, outflows, and streaming inflows.
Results. While both ionized and molecular gas show rotation signatures, there are significant non-circular motions in the innermost 200 pc and along spiral arms in the central kpc (CO). The nucleus shows a double-peaked CO profile (Full Width at Zero Intensity of 200 km s-1), and prominent (80 km s-1) blue and redshifted lobes are found along the minor axis in the inner arcseconds. Perturbations by the large-scale bar can qualitatively explain all features in the observed velocity field. We thus favour the presence of a molecular outflow in the disk with true velocities of 180 km s-1 in the nucleus and decelerating to 0 by 72 pc. The implied molecular outflow rate is , with this gas accumulating in the nuclear 2″ arms. The ionized gas kinematics support an interpretation of a similar, but more spherical, outflow in the inner 100 pc, with no signs of deceleration. There is some evidence of streaming inflows of 50 km s-1 along specific spiral arms, and the estimated molecular mass inflow rate, , is significantly larger than the SMBH accretion rate ().
Key Words.:
Galaxies: nuclei – Galaxies: active – Galaxies: kinematics and dynamics – Galaxies: Seyfert1 Introduction
Supermassive black holes (SMBH) are thought to be ubiquitous in galaxies with bulges and may be key to the formation and evolution of galaxies (Kormendy & Ho, 2013). The correlation between the host bulge and central black hole mass (Ferrarese & Merritt, 2000; Gebhardt et al., 2000; Tremaine et al., 2002; Ferrarese & Ford, 2005; Gültekin et al., 2009; Kormendy & Ho, 2013) has been argued to imply a direct causal relationship between the accretion of material by the black hole, the host galaxy star formation and AGN-driven feedback, but direct observational evidence of the mechanisms responsible has remained elusive (Heckman & Best, 2014). Over the past decade, there have been a growing number of facilities providing 3-D spectroscopic imaging observations which have been supporting the study of gaseous and stellar kinematics in active and inactive galaxies at radio (e.g. Morganti et al., 2009; Nesvadba et al., 2010), infrared wavelengths (e.g. Storchi-Bergmann et al., 2010; Riffel et al., 2013; Diniz et al., 2015) and optical (e.g. Dumas et al., 2007; Storchi-Bergmann et al., 2007; Dicaire et al., 2008; Westoby et al., 2012; Schnorr-Müller et al., 2014a; Lena et al., 2015; Roche et al., 2016). The combination of enhanced sensitivity at unprecedented spatial and spectral resolution provided by ALMA has opened a new window on molecular gas dynamics to study the central kiloparsec of local galaxies where the dynamical and AGN-activity timescales become comparable, and nuclear fueling, AGN feedback and host galaxy quenching can be probed directly.
NGC 1566, a nearly face-on barred spiral galaxy (morphological type SAB) is the dominant (de Vaucouleurs, 1973) and brightest member of the Dorado group (Bajaja et al., 1995; Agüero et al., 2004; Kilborn et al., 2005), and one of the nearest and brightest Seyfert galaxies. Despite having many features of a Seyfert 1, several studies (Alloin et al., 1985; Bottema, 1992; Ehle et al., 1996; Kawamuro et al., 2013) have indicated this nature as uncertain. NGC 1566 has an intermediate-strength bar (projected radius 33″ or 1.5 kpc and P.A. 0°; Agüero et al., 2004), and two strongly contrasted spiral arms. Both the assumption of trailing spiral arms and the more marked dust obscuration on the NW side (dust in the disk obscuring light from the bulge) seen in Hubble Space Telescope (HST) imaging (Malkan et al., 1998), point to the NW side as the near side and the SE as the far side of the disk.
Despite its proximity, the distance of NGC 1566 is controversial. Several studies using the Tully Fisher Relation (TFR) have claimed distances between 18 Mpc (EDD111http://edd.ifa.hawaii.edu/dfirst.php) to around 6 Mpc (Sorce et al., 2014; Tully et al., 2013). The H I spectra used in these studies, though of high signal to noise, clearly show a double-peaked structure, which could lead to significant underestimations of the rotation velocity and thus the TFR based distance. Consequently, in this work, we use the mean distance of 10 Mpc from NED222The NASA/IPAC Extragalactic Database (NED) is operated by the Jet Propulsion Laboratory, California Institute of Technology, under contract with the National Aeronautics and Space Administration., in agreement with the distance used by Combes et al. (2014, hereafter C14). At this adopted distance, the linear scale in our images is 48 pc/arcsec.
The systemic velocity of NGC 1566 is 1504 km s-1 from H I observations (NED), but there is wide range in the optical-spectroscopy based recession velocity values found by different authors. C14 found a systemic velocity of 1516 km s-1 for CO J:3-2; offset 12 km s-1 from the H I- derived value. We (see below) find that the galaxy’s integrated CO J:2-1 profile is centered on a systemic velocity of km s-1. As we discuss in this work, the nuclear CO profiles are highly perturbed and non-axisymmetric about the nucleus. Thus the molecular gas derived systemic velocities do not necessarily trace the true systemic velocity of the nucleus of NGC 1566.
The position angle of the major axis of NGC 1566 is 45° (HyperLEDA; Makarov et al., 2014)333http://leda.univ-lyon1.fr/, and the inclination of the disk was found to be i=35° (C14, Agüero et al., 2004). In this work we use this major axis position angle and a galaxy disk inclination of i=33°, as derived from our CO data (Sect. 2).
H I studies of the local group of NGC 1566 (a sub-part of the Dorado group) show that NGC 1566 is interacting with its smaller companions (Kilborn et al., 2005), and this finding is reinforced with the strong correlation found between galaxies with prominent barred structures and companions in the Dorado group (Kendall et al., 2011). Given its strong and symmetric spiral arms, its active nucleus (AGN), and its proximity, NGC 1566 has been the subject of great interest within the community, and has extensive studies of its spiral arm formation (Korchagin et al., 2000; Ma, 2001; Erwin, 2004; Kendall et al., 2011), its gas kinematics (Pence et al., 1990; Bottema, 1992; Bajaja et al., 1995; Agüero et al., 2004; Dicaire et al., 2008; Mezcua et al., 2015) and the feeding and feedback of the SMBH in its center (Elvis et al., 1989; Schmitt & Kinney, 1996; Combes et al., 2014; Smajić et al., 2015; Davies et al., 2016; da Silva et al., 2017).
An early kinematic study of NGC 1566 in H I and H (Pence et al., 1990) showed that the most significant H kinematic feature (after subtraction of regular rotation) was a spiral arc located 26″ from the nucleus towards the main spiral arm on the southeast (far) side of the galaxy. This spiral arc has a redshifted velocity of 60 km s-1, i.e. gas moving away from the nucleus under the assumption of motion in the disk of the galaxy. Under this assumption, Pence et al. (1990) estimated outflow velocities, most plausibly driven by the AGN, of 130 km s-1 in the plane of the galaxy, i.e., an equatorial outflow. Schmitt & Kinney (1996) also supported the presence of an outflow when analyzing the morphology of the nuclear [O III] emission; they observed a total extension of 07, mainly to the SE, which they interpreted as the base of a conical NLR originating in the nucleus and oriented perpendicular to the plane of the disk, i.e. a polar outflow. An extension in the nuclear [O III] emission to the SW was also found by da Silva et al. (2017) in integral field unit (IFU) imaging. They interpreted the morphology and blue-shifted kinematics of the [O III] line as being consistent with an outflow of 500–800 km s-1 driven by the AGN perpendicular to the plane of the disk. Agüero et al. (2004) found a H II deficiency in the inner regions of NGC 1566 (see also Pence et al., 1990), reinforcing the evidence of outflows to the SE, and posited that the blueshifted knot found 8″ from the nucleus on the far side of the disk signaled the presence of inflows along the galaxy minor axis. Using optical integral field spectroscopy, Davies et al. (2016) found a high (100–200 km s-1) dispersion in the H line over a region 200pc to the SW of the nucleus, which they interpret as most likely due to an outflowing gas illuminated by the radiation field of the AGN. They find that the latter is sufficiently high to drive outflows in this galaxy. In X-rays, Elvis et al. (1989) found extended X-ray emission centered at a position 10″ from the nucleus along PA=308° and at 30″ from the nucleus on the (roughly) opposite side (PA=130°). Pence et al. (1990) compared their posited outflow model with these extended X-ray emission regions and found that they share the same center. Radio imaging with Australia Telescope Compact Array (ATCA) at 3.5 cm (1.3 0.75 arcsec synthesized beam; Morganti et al., 1999) detected the nucleus in continuum, with a potential extension in PA 10°, and a weak radio blob 3 arcsec to the N (PA 10°). The nucleus is detected by the Parkes Tidbinbilla Interferometer (PTI) at 13 cm (5 mJy; Roy et al., 1994), i.e. it hosts a compact radio source. The previous reports of outflows in NGC 1566 are consistent with a picture of a nuclear outflow driven by the AGN in which the compact base detected in blue-shifted [O III] is primarily from a polar ionization cone tilted towards the observer and close to face-on and a more extended (out to 1 kpc) equatorial outflow component detected in a H arc in the disk of the galaxy. The reason that only the blueshifted inner (¡1″) ionization cone has been detected towards the far side of the galaxy disk most likely lies in the dusty features seen on the opposite side (NW) of the nucleus (see Fig. 8 of da Silva et al. (2017) and our structure map in Fig. 3).
C14 have presented CO J:3-2 observations of NGC 1566 using ALMA in Cycle 0: their relatively low spectral resolution (10.2 km s-1 per channel) and relatively sparse coverage limited the interpretation of the molecular gas kinematics in the nuclear region. Their kinematic study of the CO emission showed a relatively regular rotational velocity field with redshifted streaming motions on the far side of the minor axis, and blueshifted streaming motions on the near side, both centered on, and within a few arcsec of the nucleus. However, they argued that the small velocity amplitudes (total width 100 km s-1) of these perturbations, and the fact that they were only seen in the central 1″, makes an outflow scenario improbable, and instead attributed the non-circular rotational motions to other factors, e.g. streaming and bars. More recently Smajić et al. (2015) extended the same study by adding SINFONI observations of near-IR molecular emission lines, and came to similar conclusions, i.e. reinforcing the idea that the velocity perturbations are more easily explained by streaming motions along the minor axis as a consequence of the central bar, rather than outflows.
In this work, we reanalyze the nuclear molecular and ionized gas kinematics using new ALMA and Gemini-GMOS/IFU data. We present new ALMA observations of NGC 1566 in the CO J:2-1 emission line which covers the inner 12″ (600 pc) at 1.3 km s-1 channel spacing, i.e. a 2.6 km s-1spectral resolution. These new CO J:2-1 observations are more sensitive allowing us to create datacubes at the intrinsic channel spacing of the observations and have a higher image fidelity (due to the improved coverage from the 32 antenna array) as compared to the previously published Cycle 0 CO J:3-2 observations. We compare the distribution and kinematics of molecular gas with that of ionized gas (specifically the [N II] 6583Å emission line) and stellar absorption lines observed with Gemini-GMOS/IFU at optical wavelengths. We argue that the kinematics can be best explained by a quenched spherical outflow in ionized gas, a decelerating outflow of molecular gas in the plane of the inner (300 pc) disk (a scenario we favor over only bar-perturbed kinematics and streaming), and discuss molecular gas streaming inflows to the nucleus.
This work is structured as follows: In Sect. 2 we present the observations and data processing. In Sect. 3 we present our results, including the morphology and kinematics of the ionized and molecular gas and stars, a comparison with our outflow, bar-perturbation and streaming models, and a discussion of the results. Finally, in Sect. 4, we present our summary and conclusions.
2 Observations, Data Processing, and Software
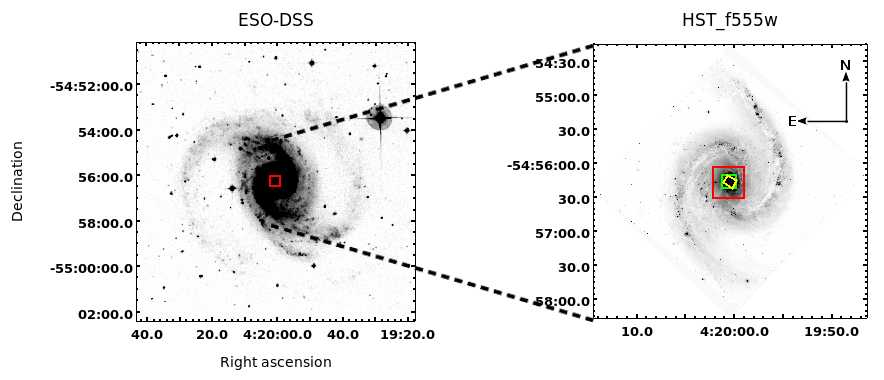
We observed NGC 1566 with ALMA and Gemini-GMOS/IFU in order to obtain a comprehensive picture of the morphology and kinematics of the molecular gas, ionized gas, and stars. Images of NGC 1566, illustrating the FOVs of our observations are shown in Fig. 1.
We observed NGC 1566 with ALMA as part of a survey of five nearby Seyfert galaxies during Cycle 2: project-ID 2012.1.00474.S (PI: Nagar) originally approved for Cycle 1 but carried over to Cycle 2. The observations of NGC 1566 were taken on June 29, 2014, using the ALMA Band 6 receivers on thirty-two 12-meter antennas. Four spectral windows (SPWs) were used; two in the lower sideband (LSB) and two in the upper sideband (USB). Three of the SPWs were configured to cover the following lines at relatively high channel spacing (1.3 km s-1): CO J:2-1 ( = 229.401922 GHz) , 13CH3OH ( = 241.548041 GHz) and CS(J:5-4) ( = 243.728532 GHz). A fourth SPW was used in ‘continuum’ mode to best detect any nuclear continuum emission. The SPWs were thus centered on 229.415 GHz, 227.060 GHz, 241.554 GHz and 243.735 GHz, with bandwidths of 1.875 GHz, 2.0 GHz, 1.875 GHz and 1.875 GHz, respectively, and spectral channel spacing of 1.27 km s-1, 20.53 km s-1, 1.22 km s-1, and 1.21 km s-1, respectively. At these frequencies, the full-width half maximum of the 12 m primary beam is about 26′. Antenna baselines ranged from 17 m to 650 m, resulting in a typical synthesized beam of 06 05 with a position angle (PA) of 25.3°.
Observations were carried out in two continuous observation blocks, totalling 124 min. The nearby radiogalaxy J0519-4546 (PICTOR A) was used as a phase, bandpass and flux-calibrator. Data were calibrated and imaged using CASA 4.2.1 (McMullin et al., 2007). The CO J:2-1 emission line was strongly detected over a velocity range of km s-1, and we were able to map the CO line at the observed channel spacing of 1.3 km s-1. Thus, our effective spectral resolution (2.6 km s-1) is higher than the internal dispersion of a typical GMC. At this spectral resolution, our highest spatial resolution maps (made with Brigg’s weighting with the robust parameter set to 2) have a synthesized beam of 052 035 (beam PA= 13°). The r.m.s. noise per channel in line free channels is 1 mJy/beam, and rises by up to a factor 2 in channels with significant line emission. Equivalent ‘natural weighted’ maps (Brigg’s weighting with robust=2) have a resolution of 06 05 (beam PA= 15.6°) and an r.m.s. noise per channel of 1.2 mJy/beam in line free channels, rising by up to a factor of 4 in channels with significant line emission. The task immoment of CASA was used to create moment (integrated flux, velocity, and dispersion and skewness) maps from the above data cubes.
Gemini-GMOS observations of NGC 1566 were obtained on the night of 27th of September 2011 with GMOS in IFU mode and using the R400_G5325 grating in combination with the r_G0326 filter (program ID: GS-2011B-Q-23; P.I. Nagar). This grating yielded an intrinsic spectral resolution (FWHM) of 123 km s-1, which was sampled on the CCD at 30 km s-1 per pixel near the [NII] line. The total spectral coverage was from 5620Å to 6970Å. The observations consisted of two adjacent IFU fields covering 7″ 5″ each, resulting in a total spatial coverage of 7 10 arcsec. Six exposures of 350 seconds were obtained for each field, each slightly shifted in wavelength and position in order to correct for detector defects and fill in CCD chip gaps. The data was processed using specific tasks developed for GMOS data in the gemini.gmos IRAF444http://iraf.noao.edu package.
We use four software packages for obtaining velocities, velocity fields, and related parameters from the datacubes or moment images. Ionized gas kinematics were obtained by fitting Gauss-Hermite polynomials and double Gaussians to the [N II] 6583Å emission line using a modified version of the profit555http://w3.ufsm.br/rogemar/software.html routine (Riffel, 2010). The Gauss-Hermite polynomial fits were used to obtain total flux (moment 0), velocity (moment 1), and velocity dispersion (moment 2) maps over the full FOV. The nuclear stellar velocity and velocity dispersion was determined by using the Penalized Pixel Fitting (pPXF)666http://www-astro.physics.ox.ac.uk/ mxc/software/ code (Cappellari & Emsellem, 2004), on the integrated (over our full FOV) spectrum of the galaxy, and using templates based on simple stellar populations (SSPs) from Bruzual & Charlot (2003).
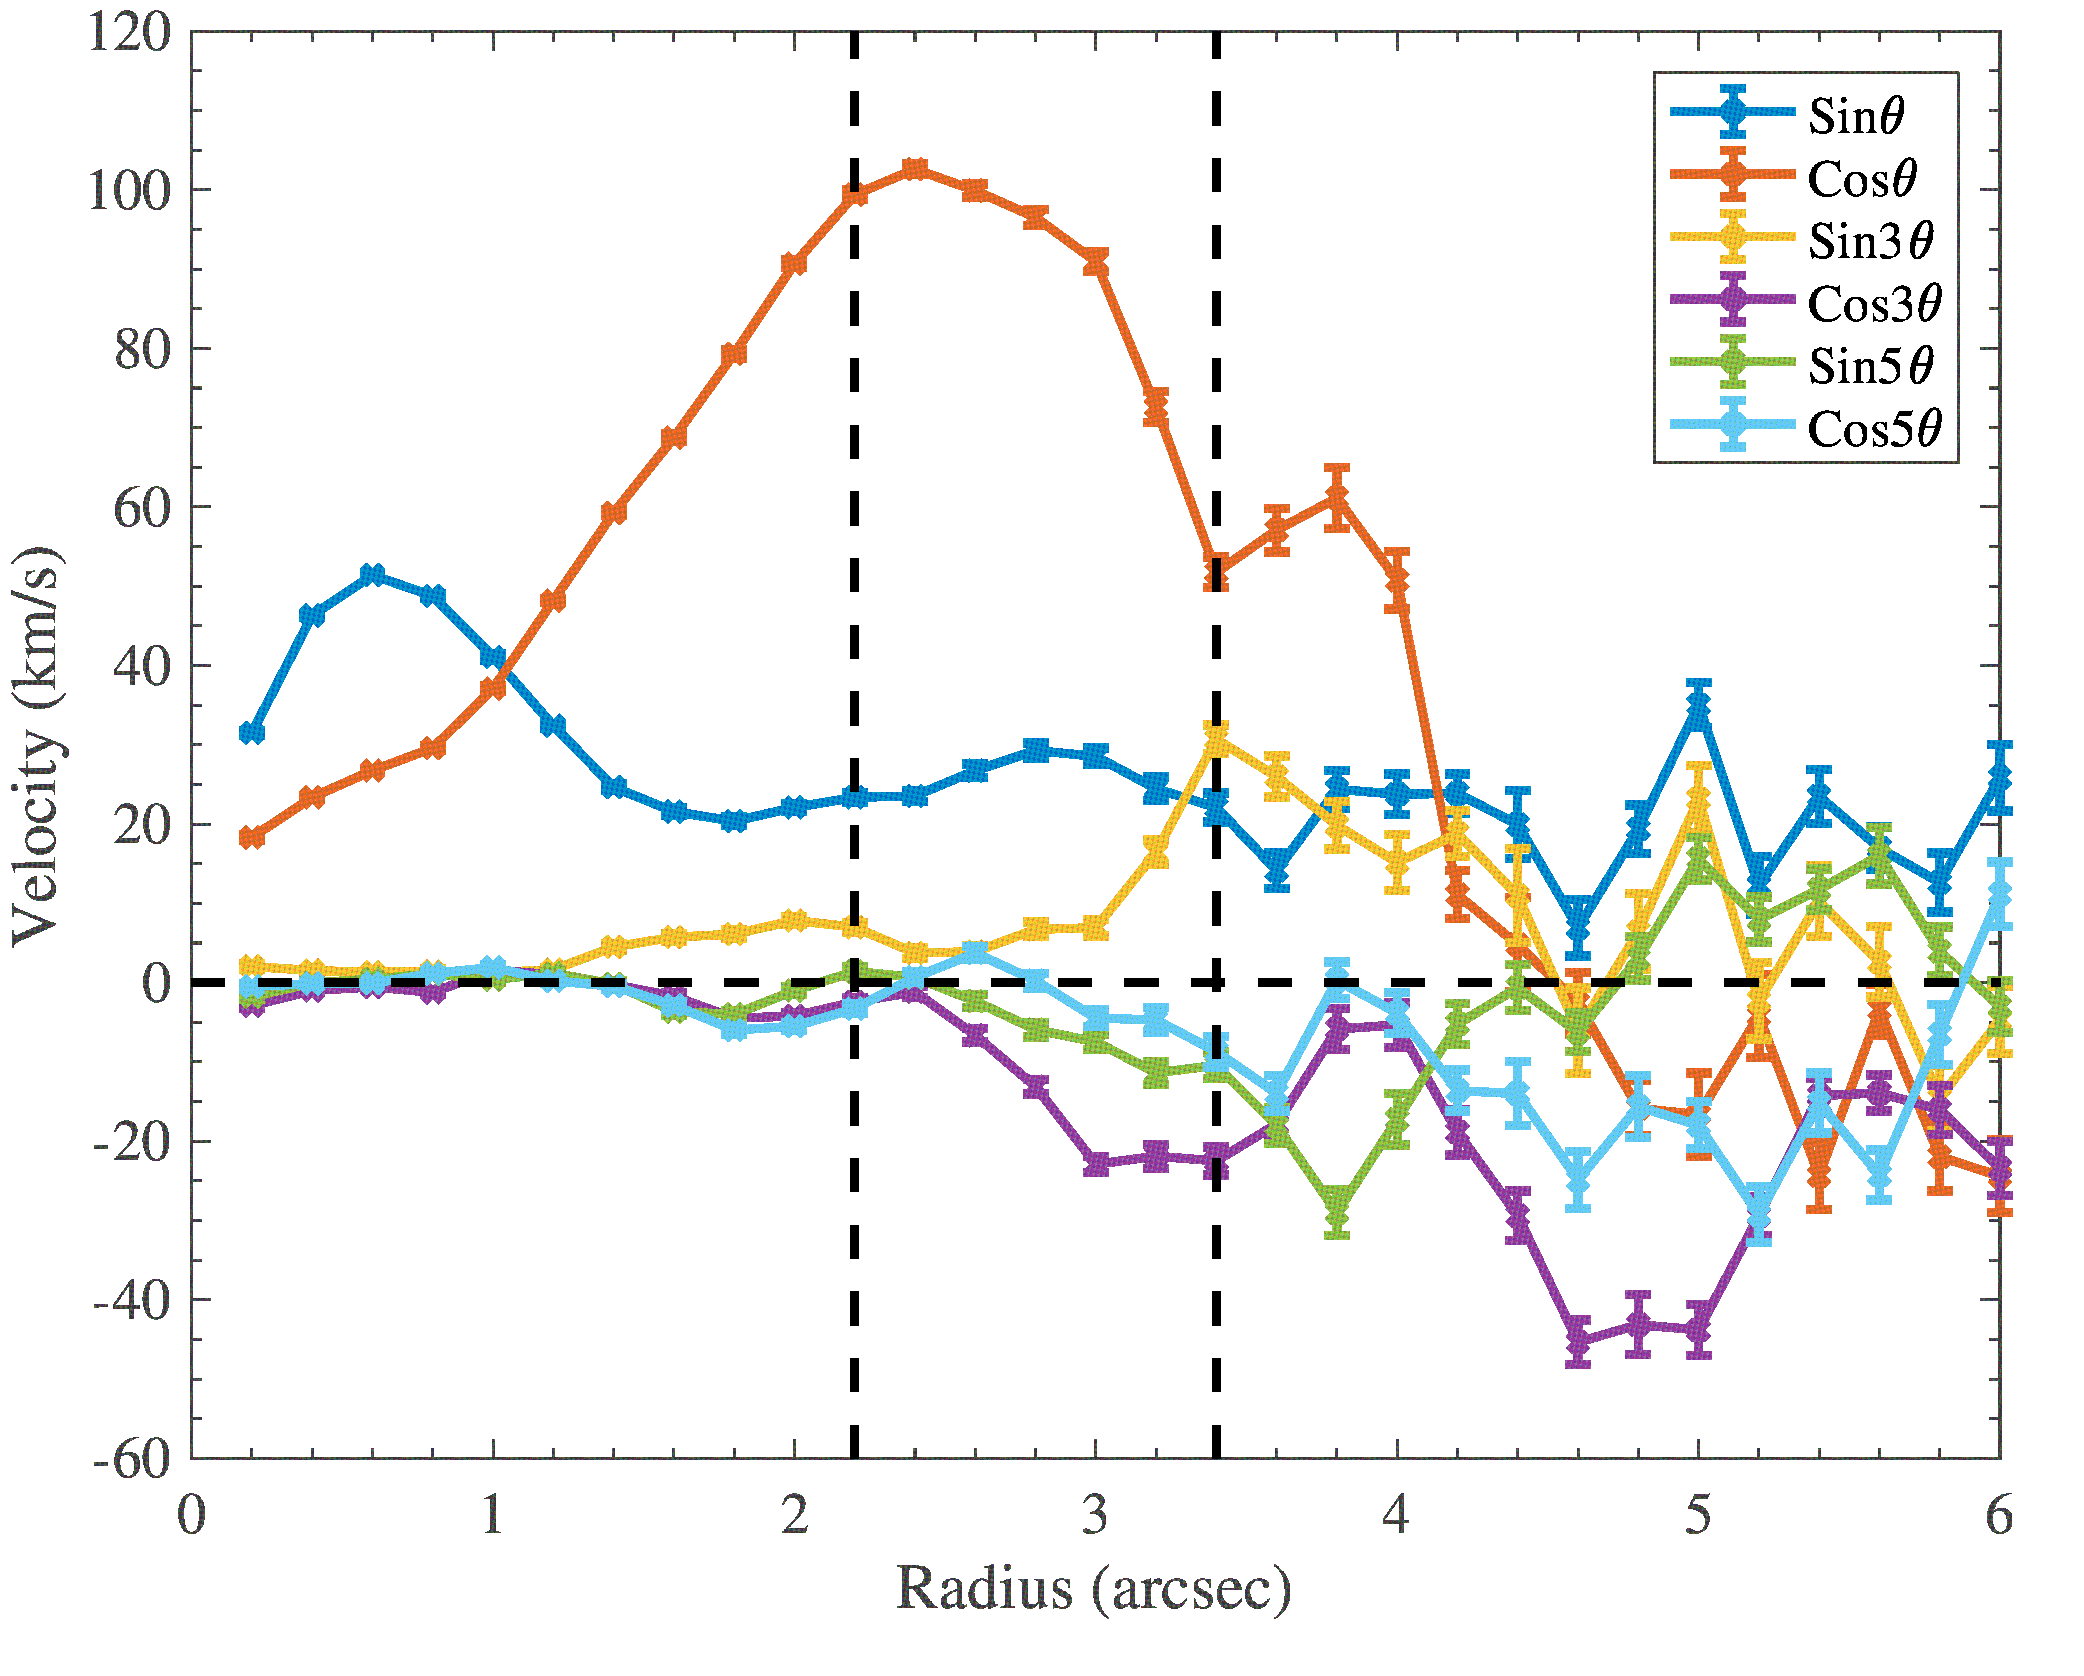
We used a modified version of the Kinemetry777http://davor.krajnovic.org/idl/ package (Krajnović et al., 2006) to constrain the major axis and inclination of NGC 1566 via fits to the CO J:2-1 velocity field, and to determine the best fit circular velocity field via fits to the moment 1 (velocity) maps of both CO J:2-1 and [N II]. This modified version uses an improved global optimization thereby yielding results that are less affected by the starting values and are more robust to missing pixels in the map (discussed in detail in Ramakrishnan et al., in prep.). Some parameters such as the position angle and inclination of the galaxy can either be fixed or obtained on the fly (see Krajnović et al., 2006, for a more detailed description of the software and its features). On the first Kinemetry run we allowed both PA and inclination to vary with radius. The PA and inclination were then fixed to their median values and a second run of Kinemetry was used to obtain the circular rotation map and the coefficients of each circular velocity and perturbation term. Briefly, Kinemetry fits concentric elliptical rings to the velocity fields under the assumption that it is possible to define the latter such that data extracted along each ellipse can be described by a simple cosine law. Therefore, along each ellipse fitted to our velocity map, the program constructs a Fourier series as a function of azimuthal angle. When using Kinemetry we used six odd terms, i.e. ) and ) with n=1, 3, 5.
3 Results
The molecular (CO; ALMA) and ionized gas emission lines (Gemini-GMOS/IFU) are detected at high signal to noise out to the edge of the observed FOV. The [N II] emission line is detected in every pixel of the GMOS FOV at signal to noise ratios of 3 to 250 in the moment 0 maps. The CO line is detected in well defined structures which cover a fraction of the FOV: here the signal to noise ratio in moment 0 maps ranges between 8 and 35.
3.1 Observed Moment Maps: ALMA and Gemini-GMOS/IFU
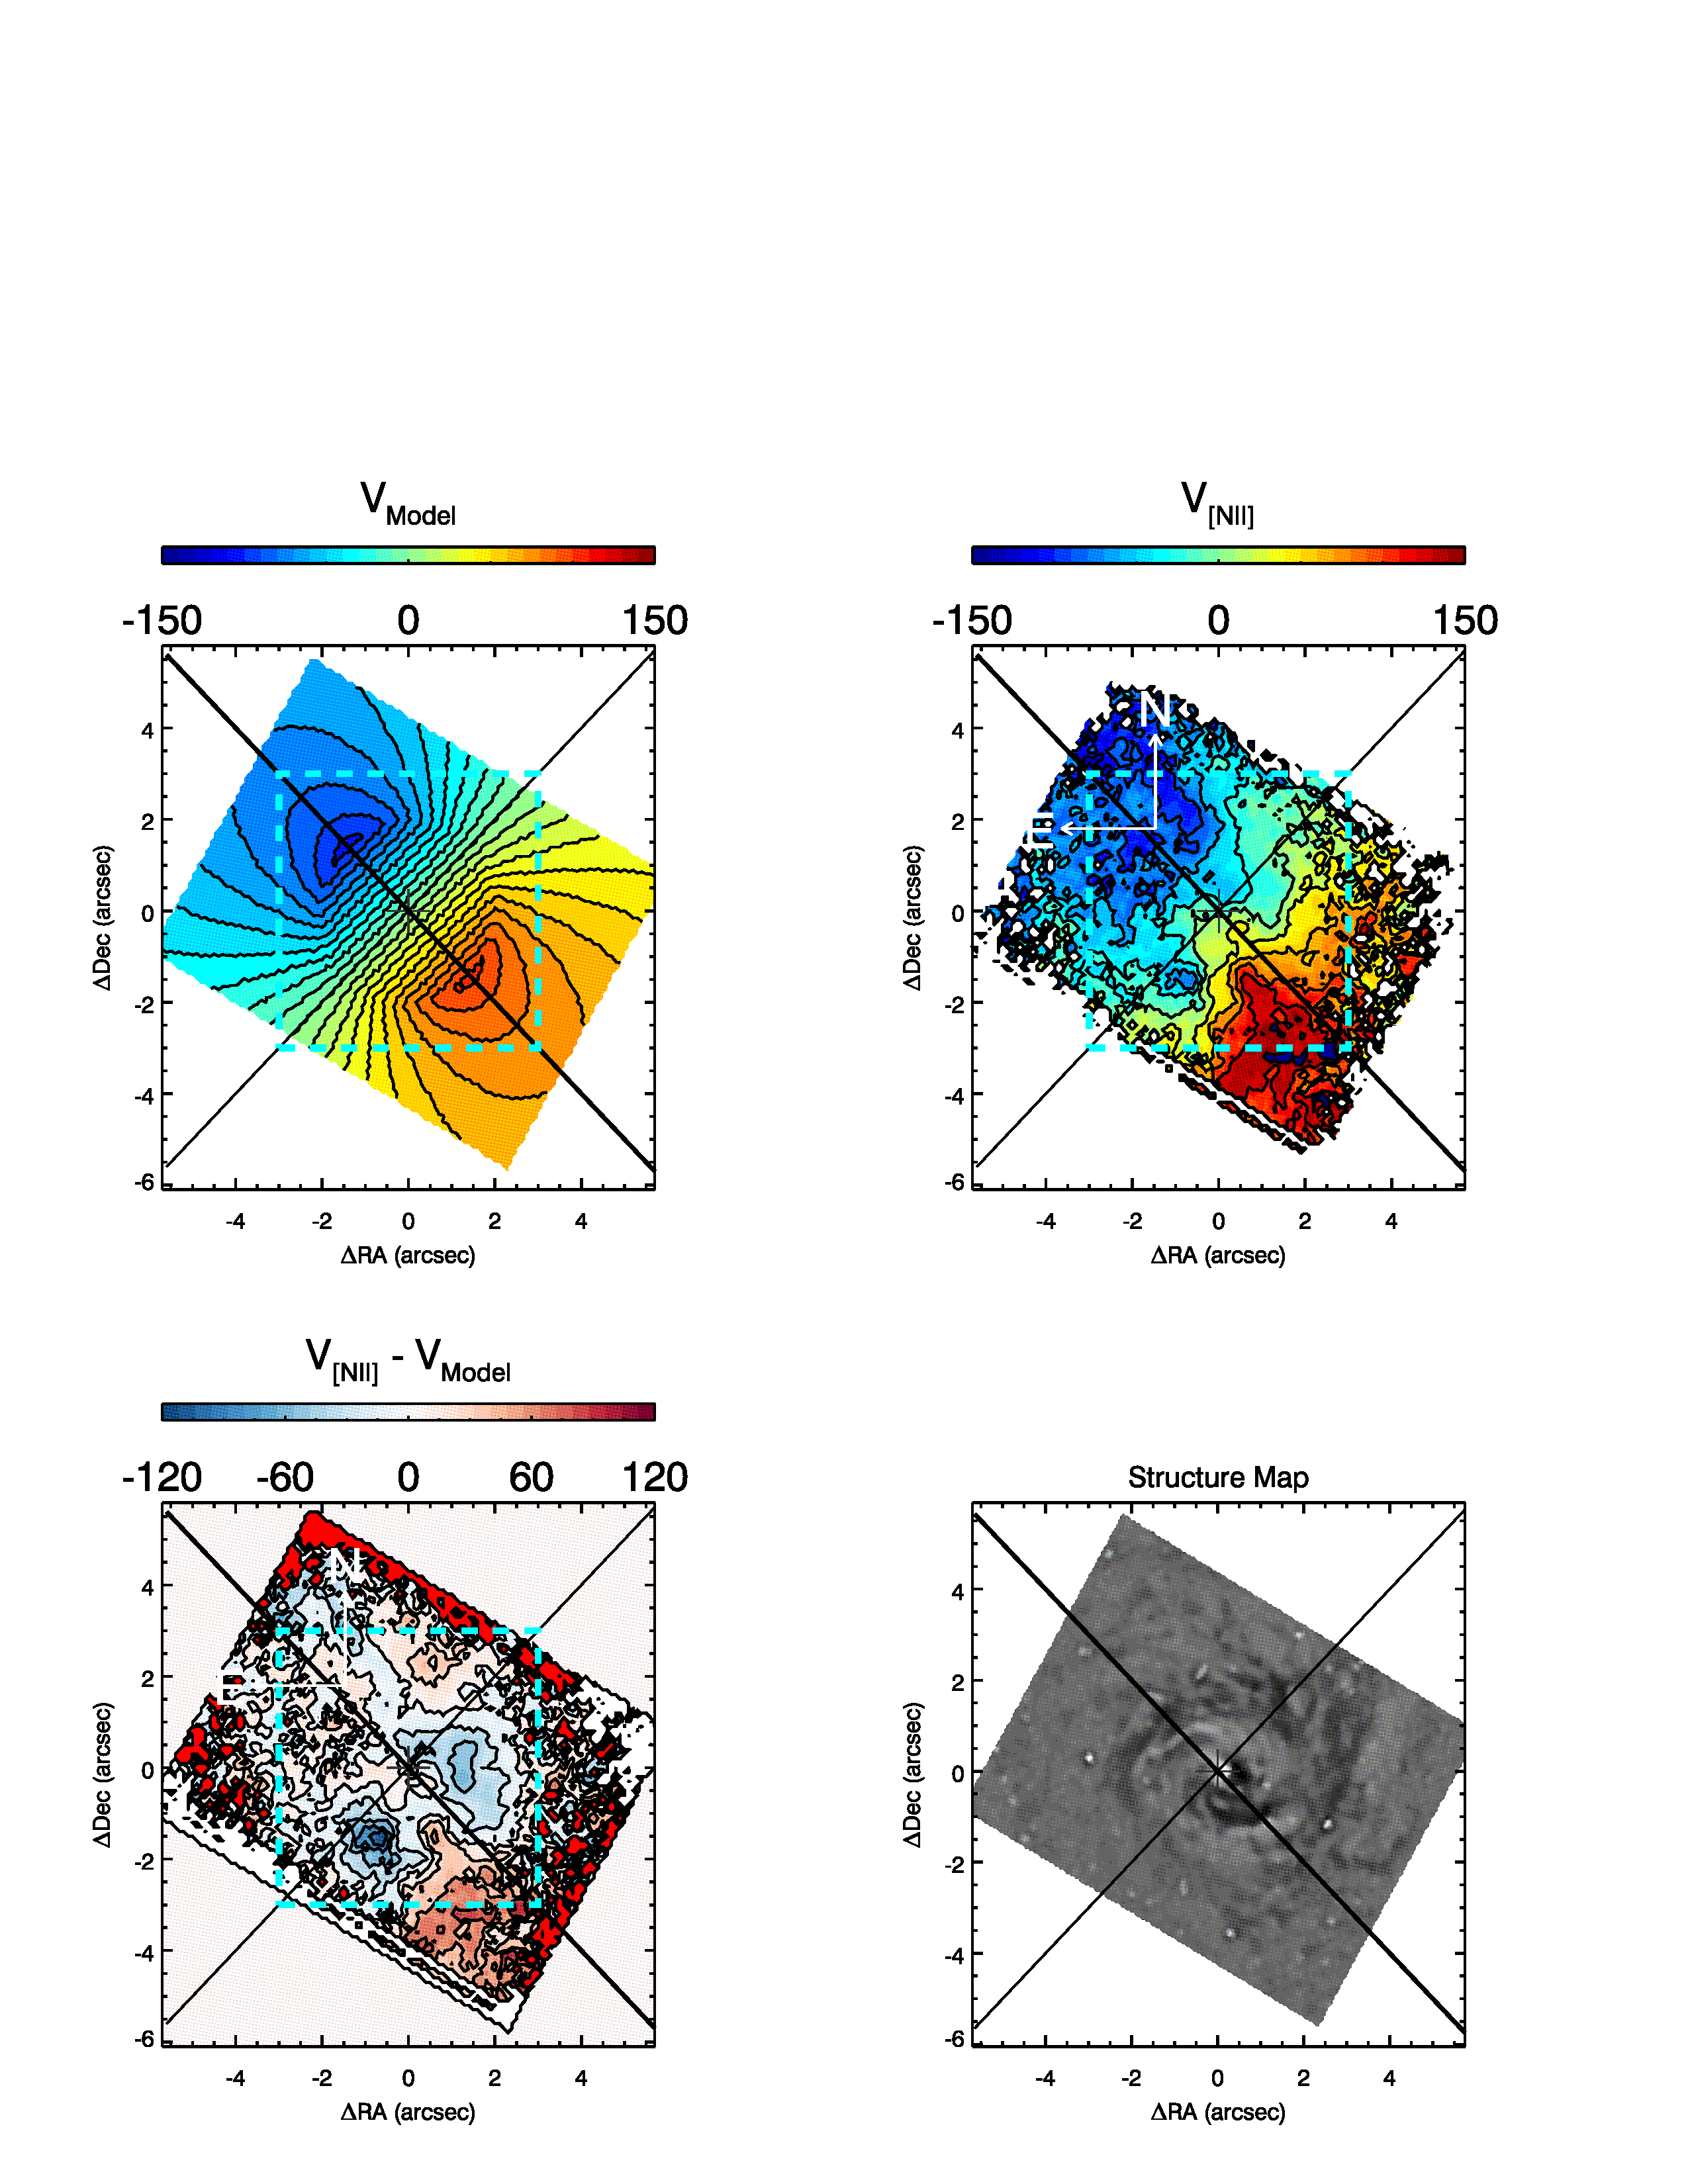
Our ALMA 230 GHz continuum map shows only an unresolved nucleus and a few other weakly detected components. We do not present or discuss these 230 GHz continuum maps further since the sub-mm continuum morphology of the nuclear region can be better appreciated in the 345 GHz continuum maps of C14 due to the dust emission being brighter at this frequency. The principal use of our 230 GHz continuum map is thus to set the position of the nucleus in the CO maps. The extensive dust lanes in the nuclear region of NGC 1566 could cause a small systematic offset between the nucleus and the location of the optical continuum emission peak. Since this systematic offset is most likely to be significantly less than 05 (see the structure map in the bottom panels of Fig. 3) we here assume that the nucleus is coincident with the stellar continuum peak in the Gemini-GMOS datacube.
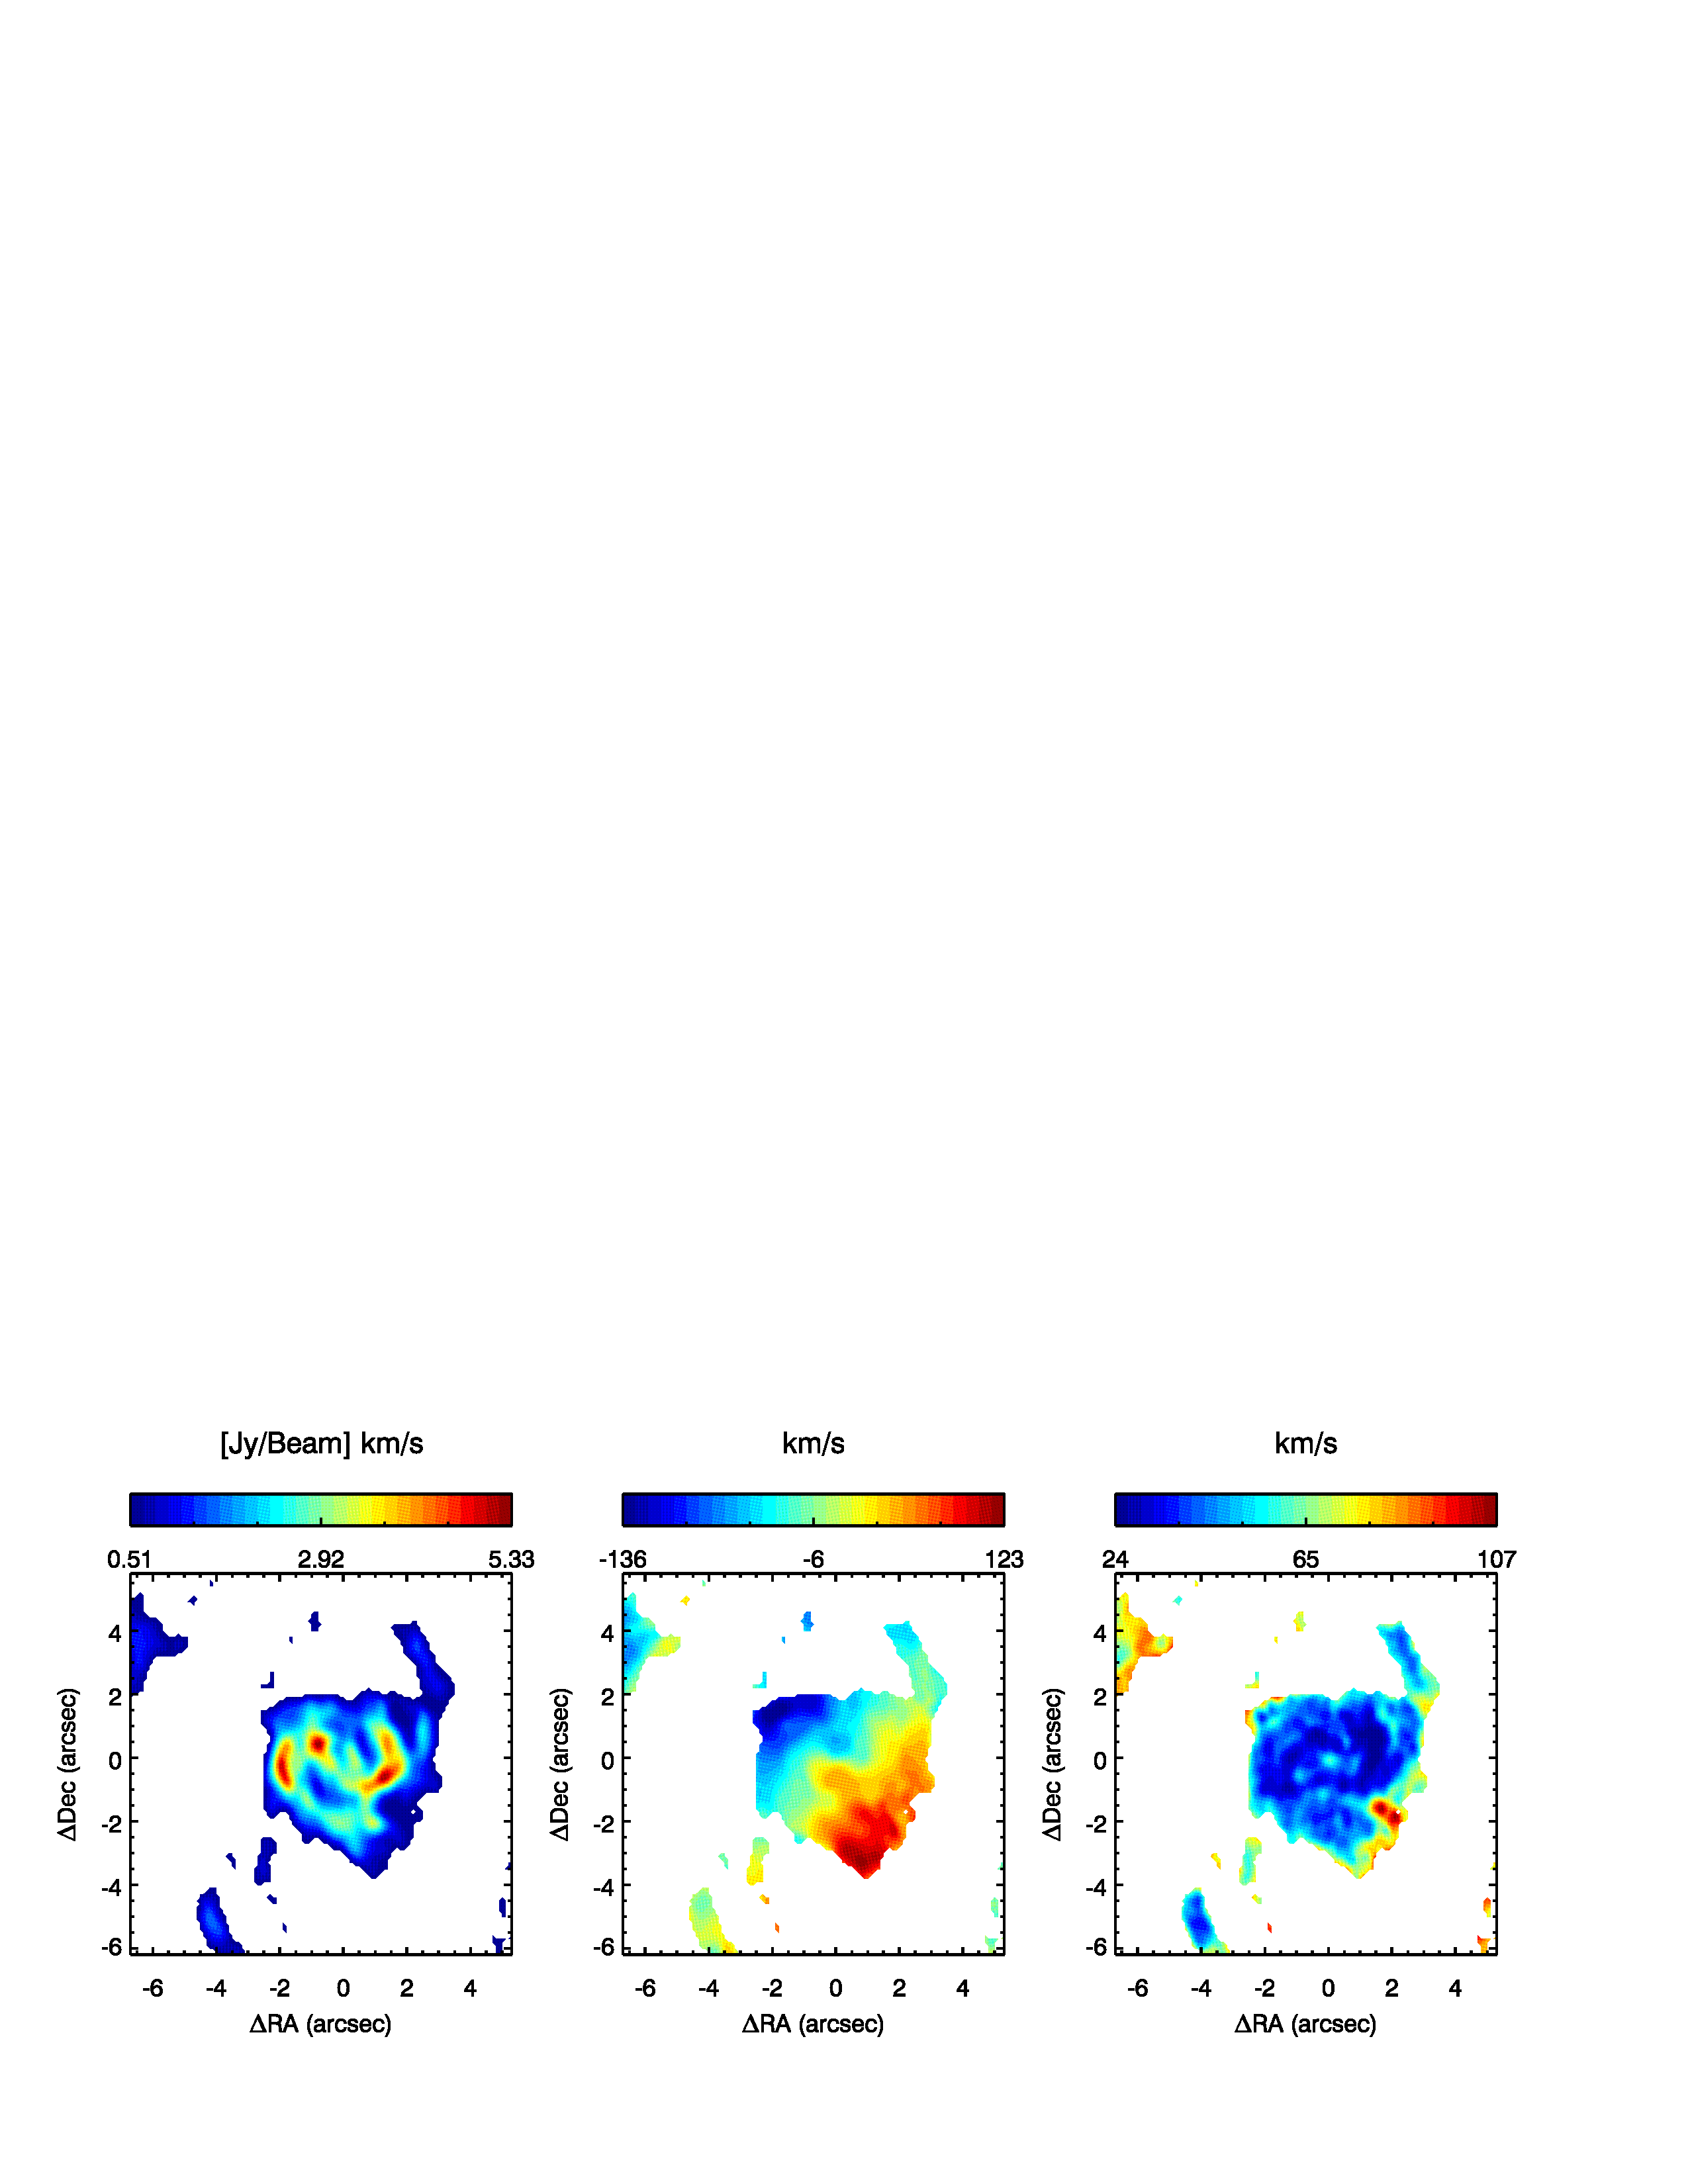
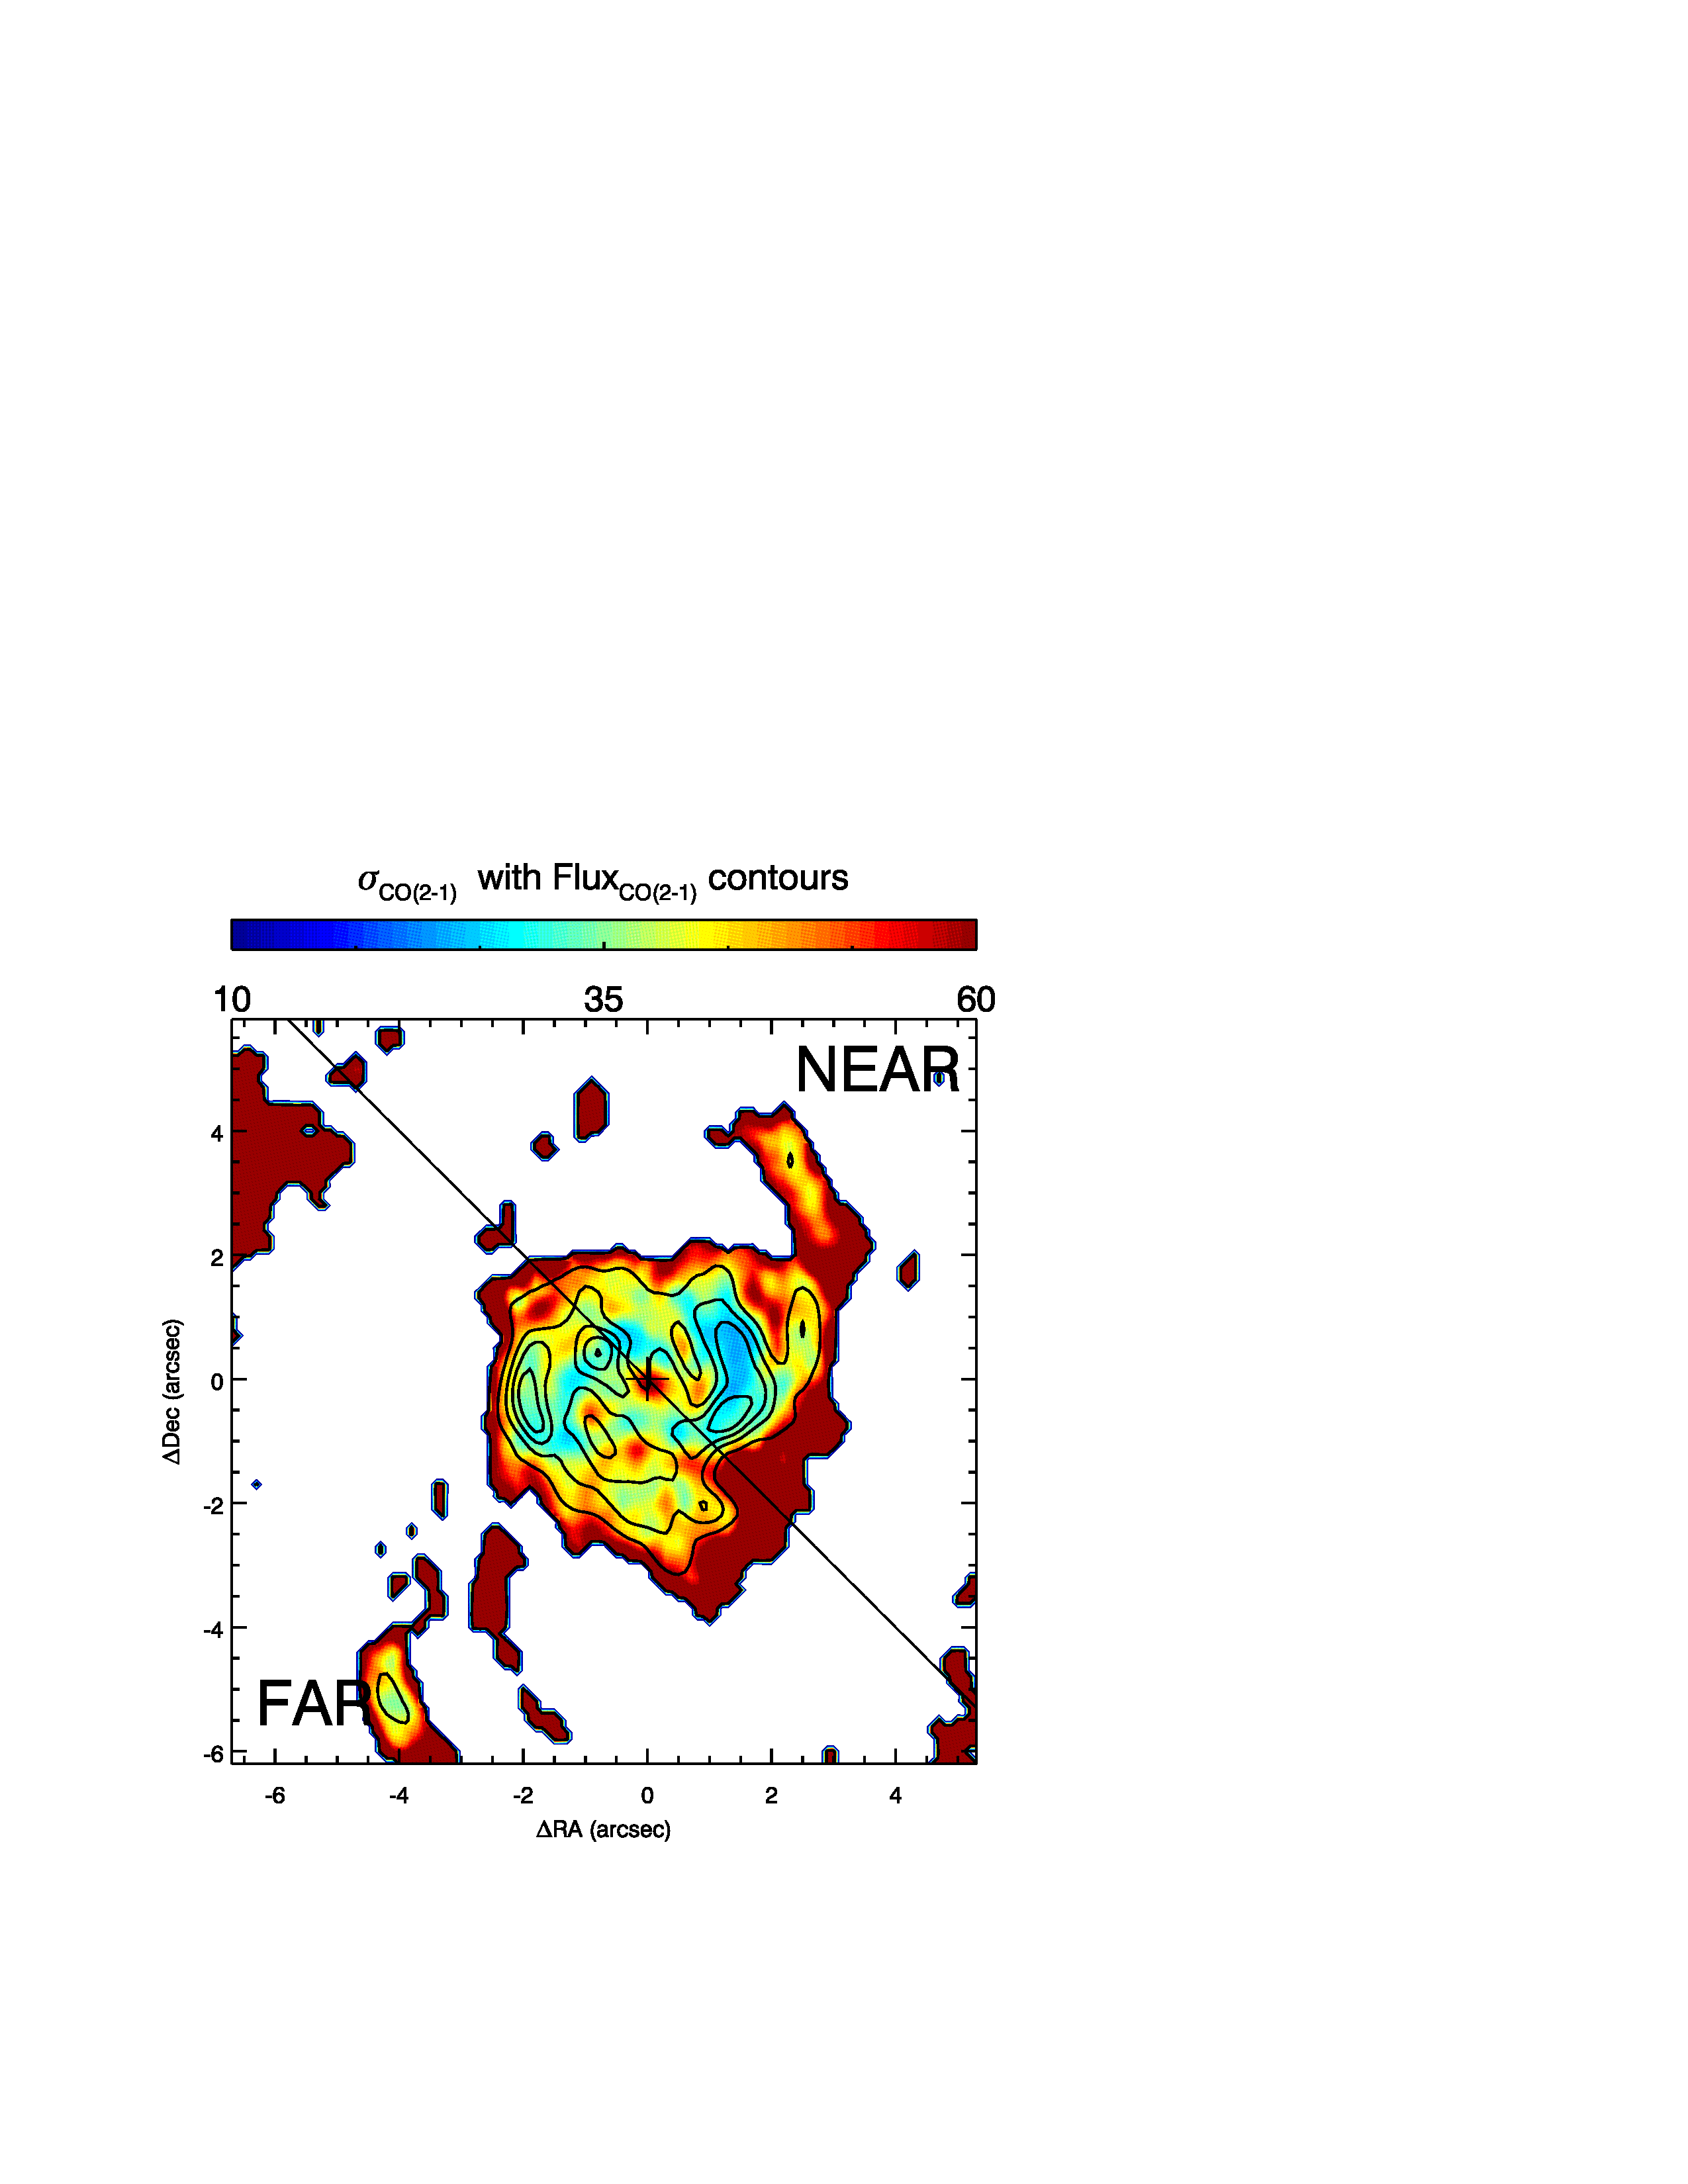
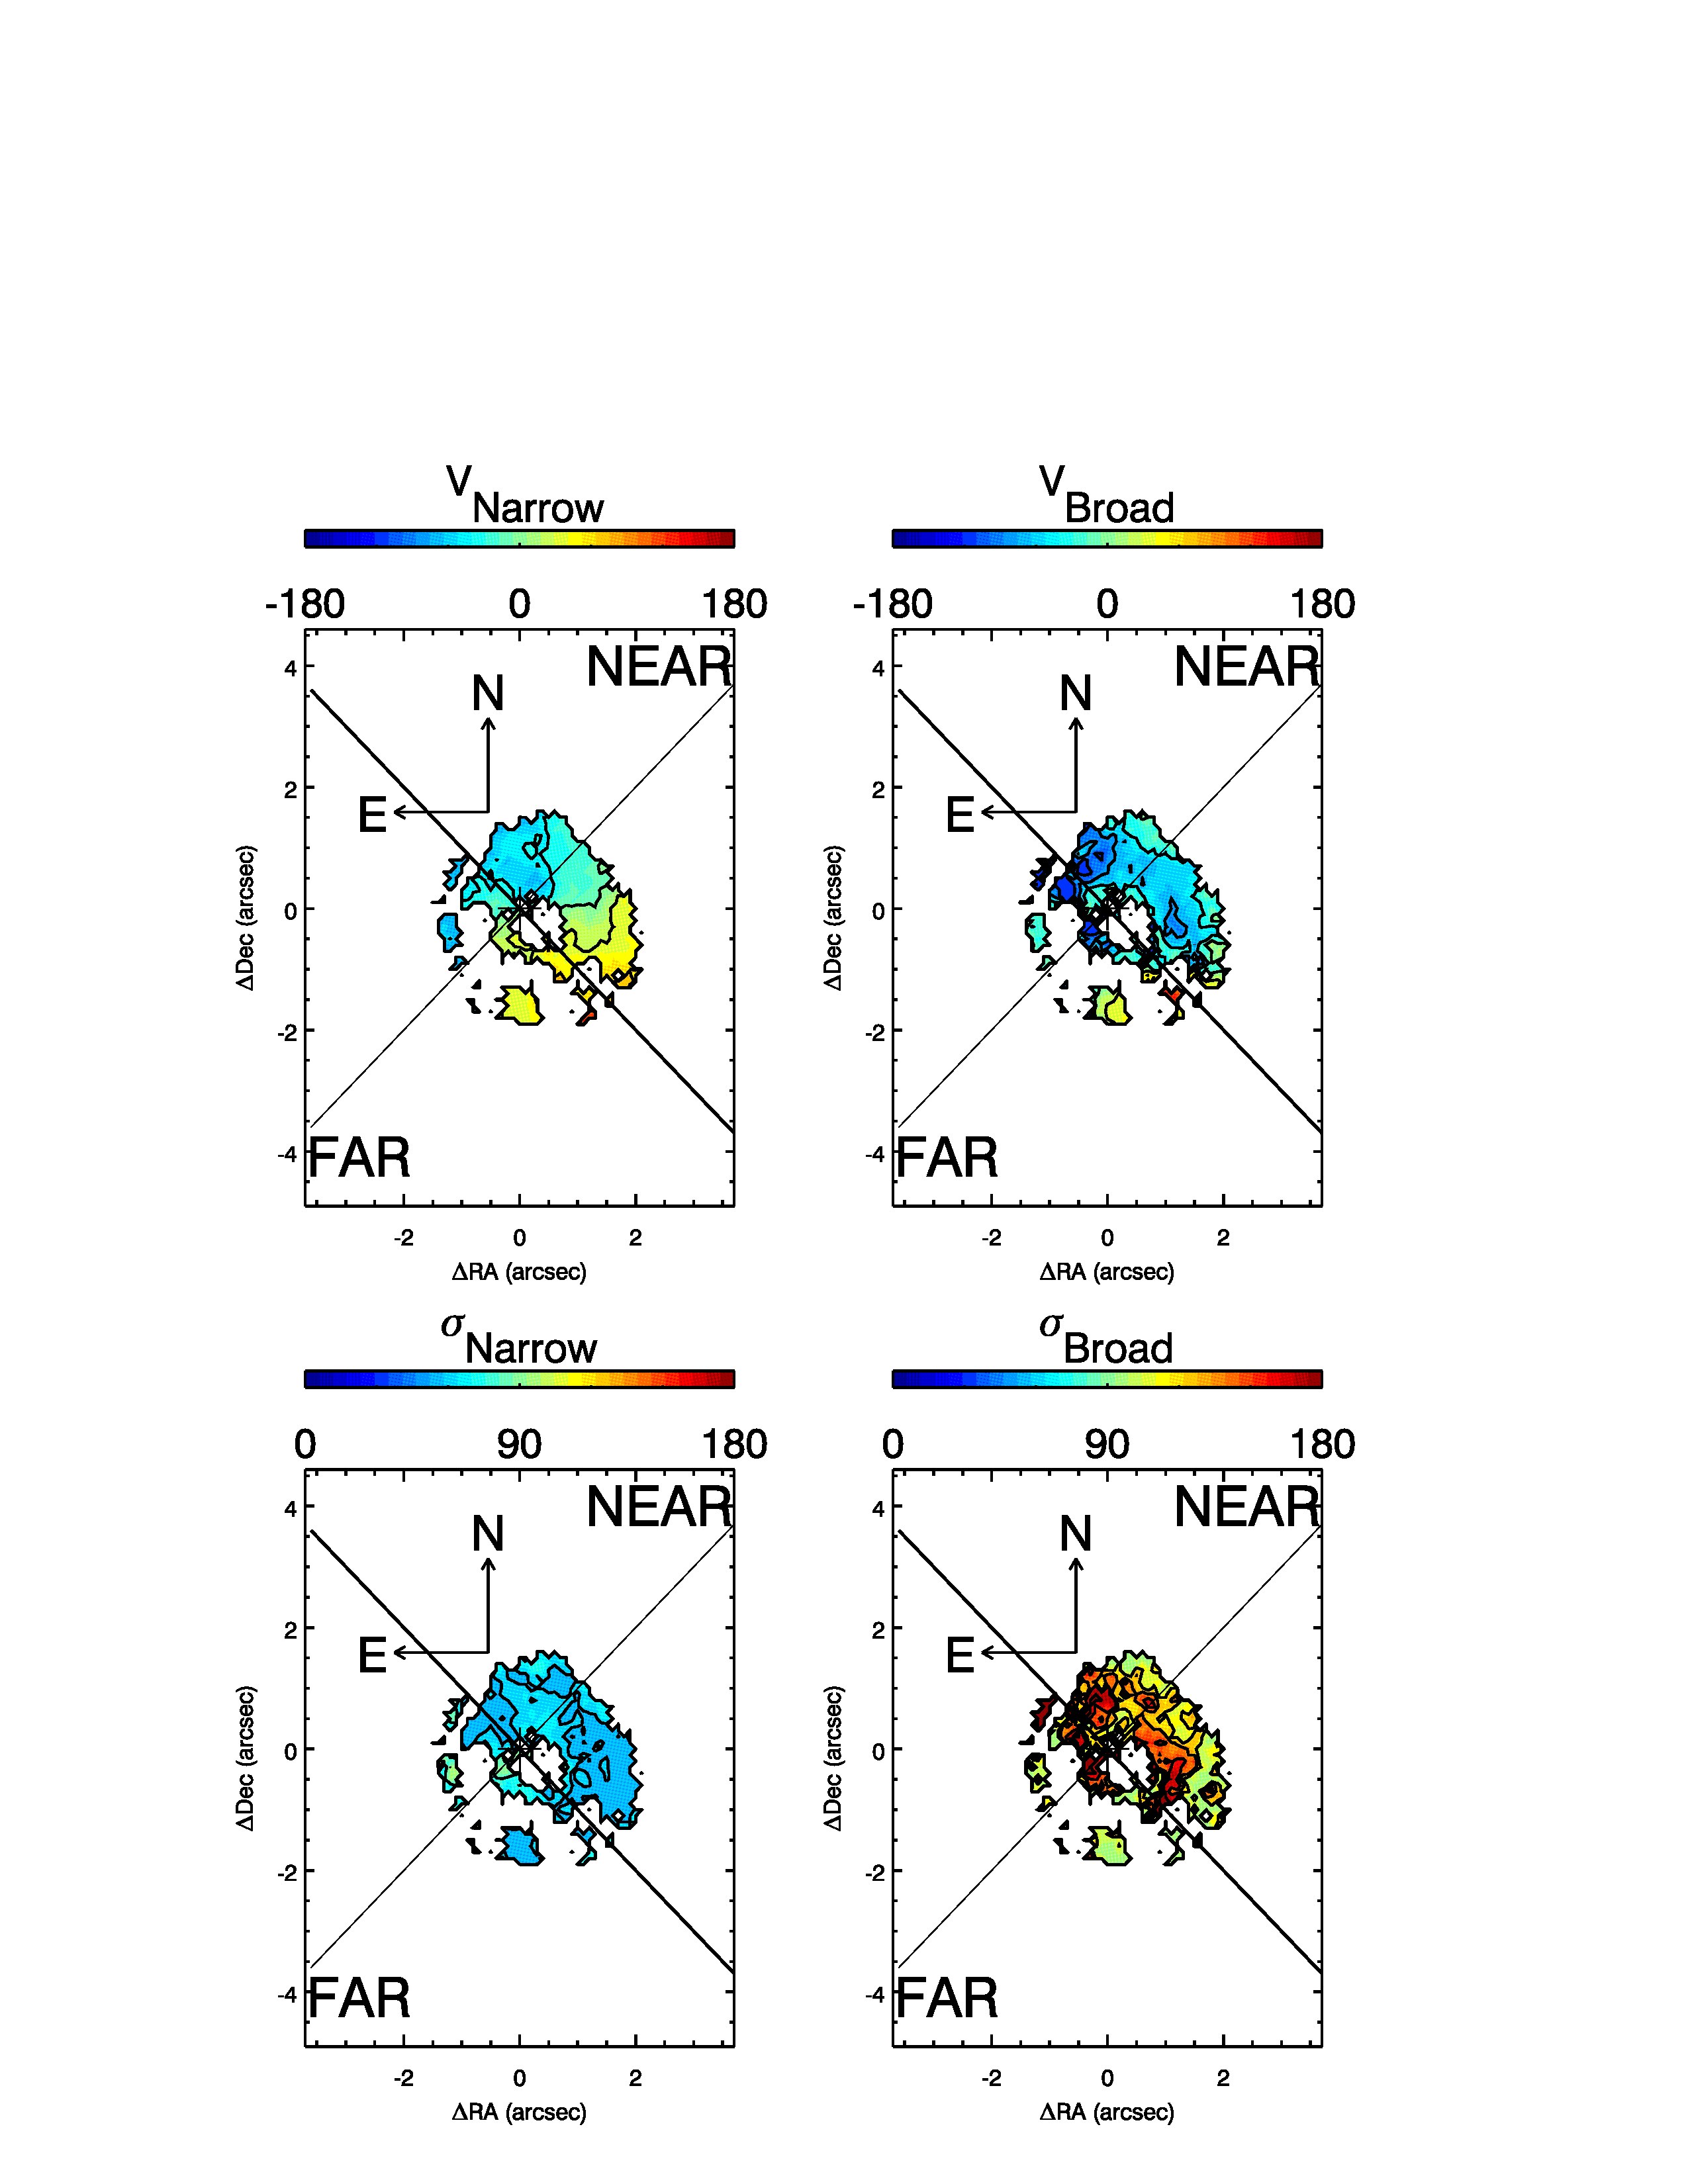
The moment 0 (integrated flux), moment 1 (velocity) and moment 2 (velocity dispersion) maps of the CO J:2-1 line in NGC 1566 are shown in Fig. 2. The molecular gas in the nucleus of NGC 1566 has a clearly defined disk-like structure in the inner 3″ (144 pc), even though this region is deficient in both atomic gas and H II regions (Pence et al., 1990; Agüero et al., 2004; Smajić et al., 2015). Within this nuclear disk, the CO J:2-1 traces a two-arm spiral structure in the inner 17 (82 pc); this spiral structure is also seen in near-infrared and optical images (Smajić et al., 2015) and in previous CO J:3-2 maps (C14). This inner molecular spiral (in which the arms almost close into a ring) sprouts two more extended but fainter CO J:2-1 spiral arms which extend out of the inner disk until roughly 134 pc (28). These more extended spiral arms coincide with the dust lanes seen in HST images (Fig. 3; see also C14). The CO velocity map shows velocities ranging over 140 km s-1. While the disk in its inner 3″ shows a predominantly rotational ‘spider’ velocity diagram, the velocities are asymmetrical, pointing to a warped inner disk or the presence of non-circular velocities. Despite the common association of outer H I disks to warped disks, there exists some evidence for the latter at parsec scales (Greenhill et al., 2003). Warp scenarios at nuclear scales for molecular gas has been explored as, e.g. in Schinnerer et al. (2000) reporting that molecular gas could be warped or bar perturbed in the nuclear region, although without analyzing deeply the origins of thereof. . The trailing pattern of spiral arms in the CO velocity maps agrees with that at larger scales in the right panel of Fig. 1, allowing us to assume that the near and far sides of the galaxy disk is to the NW and SE, respectively. The velocity dispersion map reveals a typical dispersion of 30 km s-1 in the inner spiral arms (see also Fig. 6), with a high (100 km s-1) velocity dispersion region 3″ to the SW of the nucleus along the major axis. Note that this region does not correspond to the star-forming region which is clearly detected in the optical observations of Smajić et al. (2015). The nucleus of NGC 1566 shows a velocity dispersion of km s-1 (see also Fig. 6).
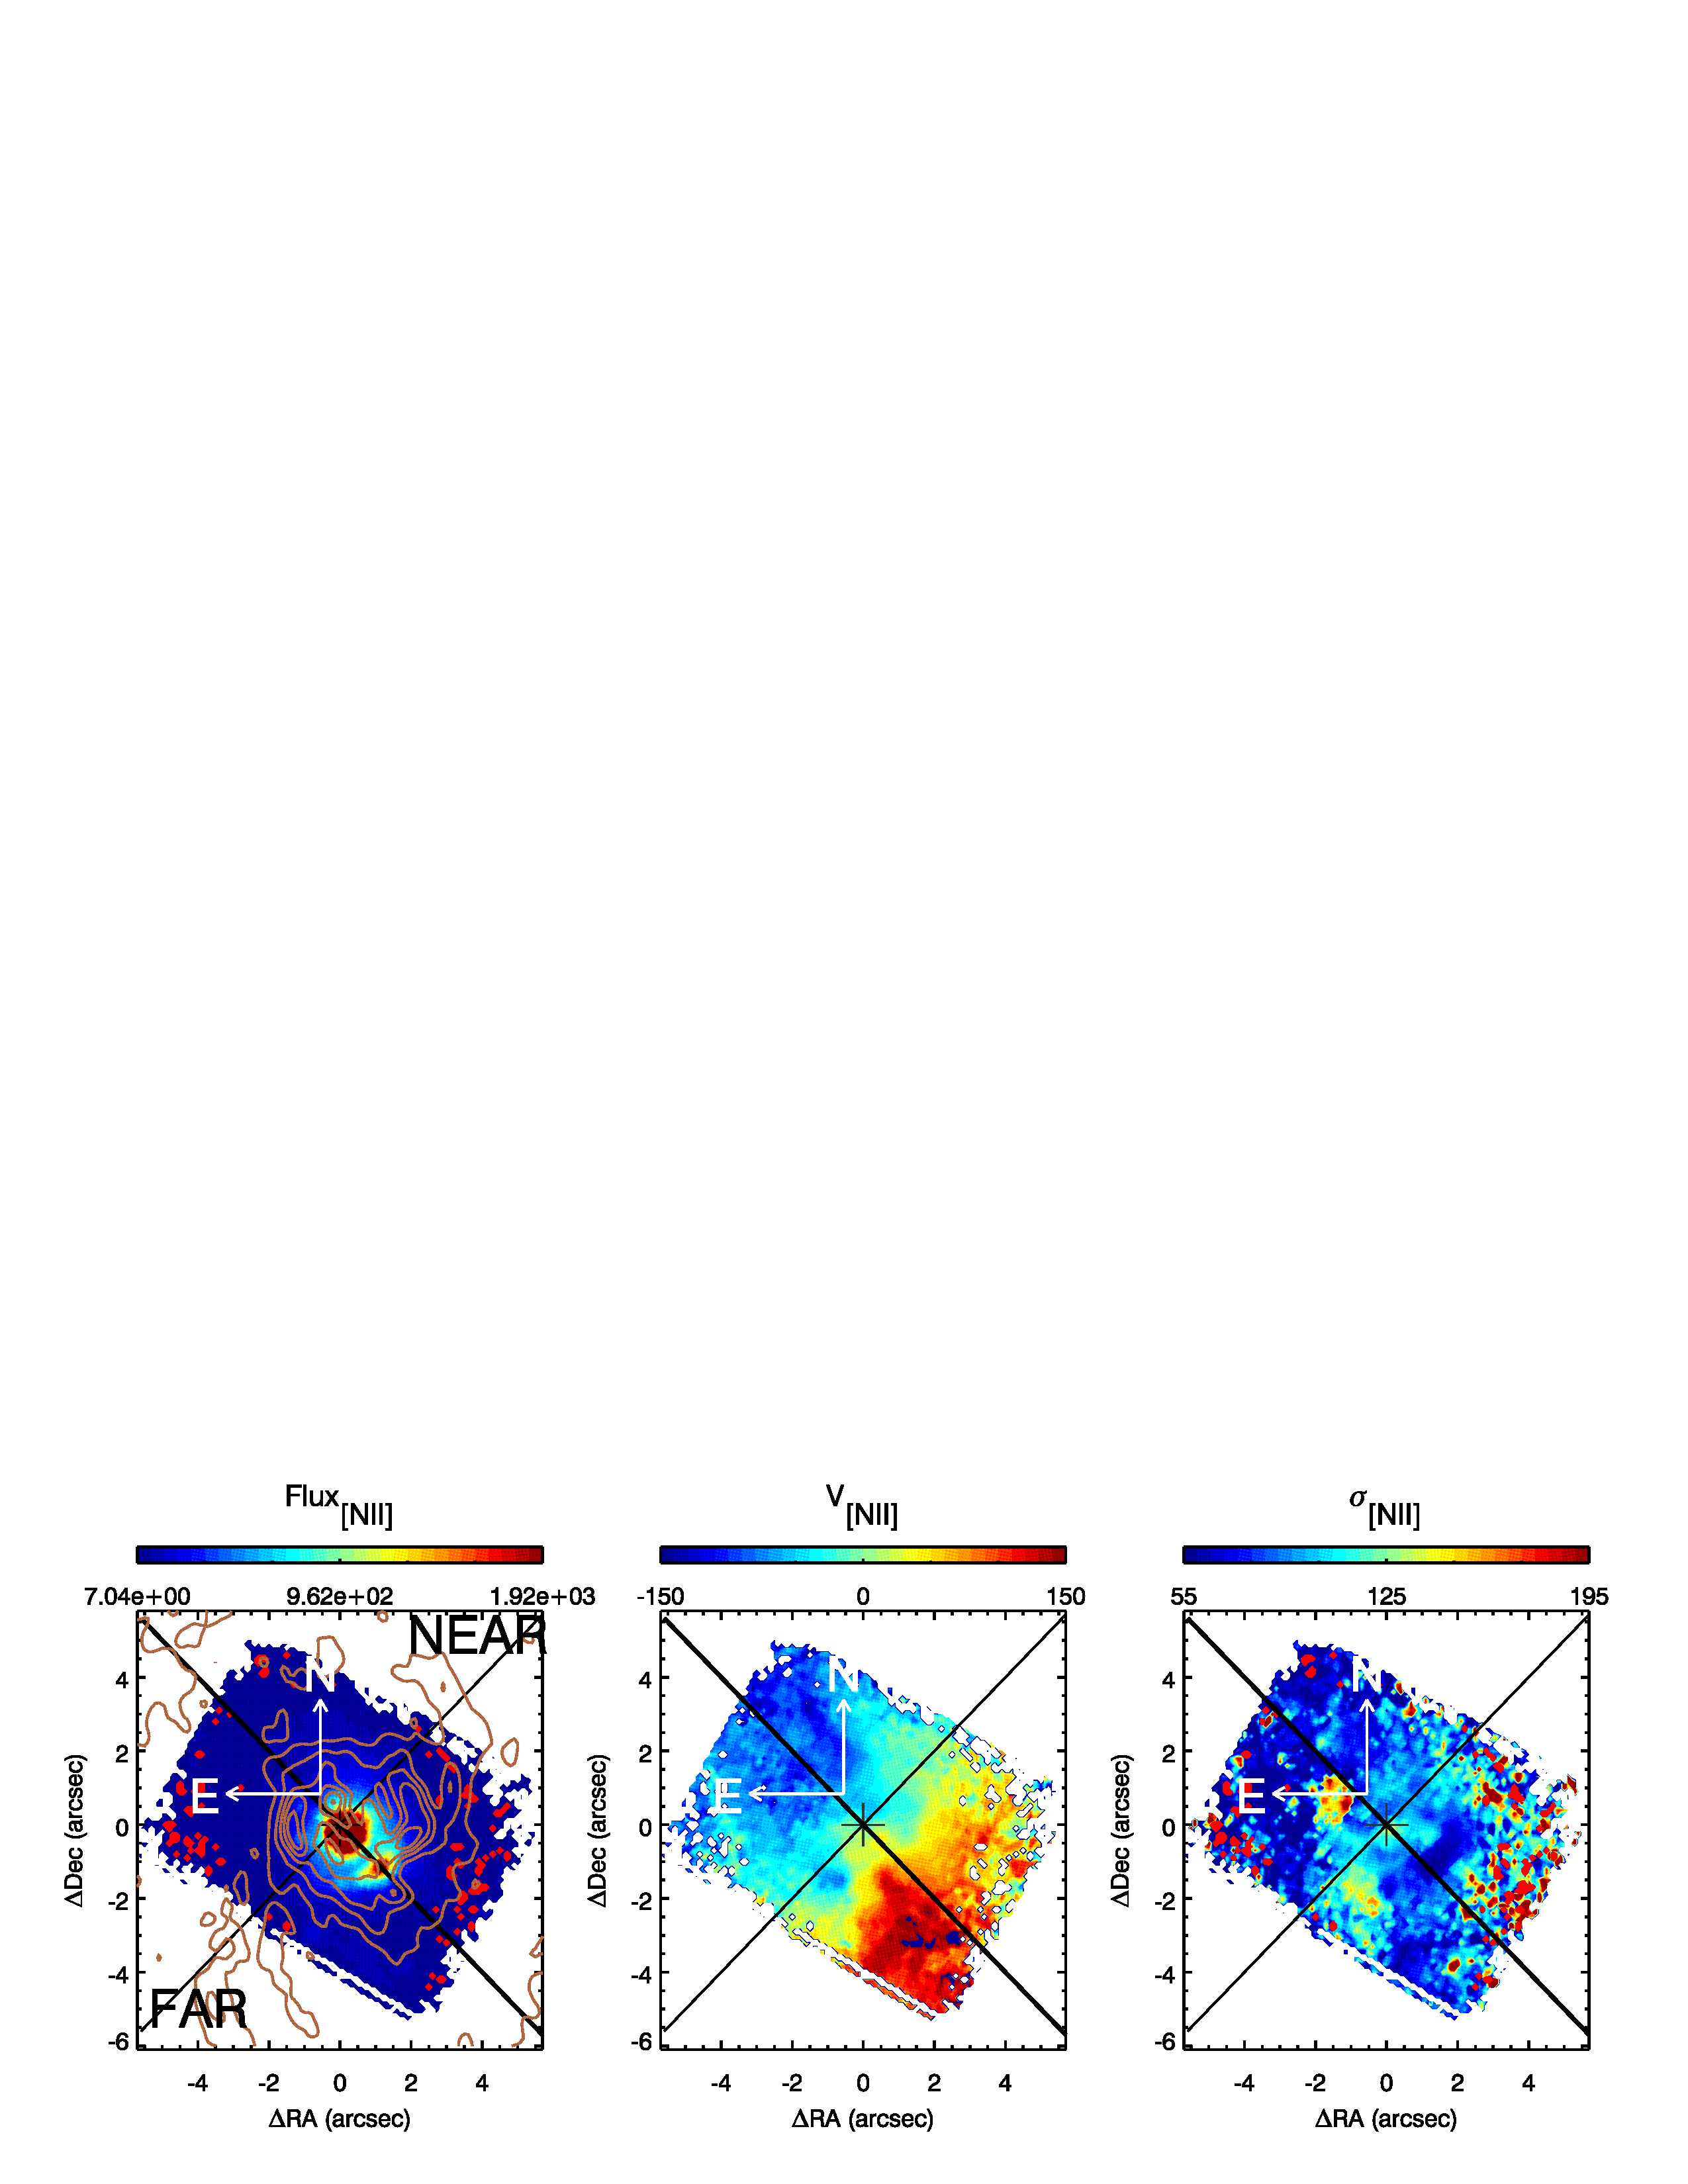
The moment maps of the [N II] line in NGC 1566, obtained from the GEMINI-GMOS/IFU data, are shown in the top row of Fig. 3. Overall, these are roughly similar to those of the CO line. The [N II] moment 0 image clearly shows the bright [N II] region to the SW, corresponding to the optically-emitting star-forming region seen in Smajić et al. (2015) and in agreement with a blue region seen to the SW of the nucleus in the CO velocity residual map. The velocity map shows kinematics consistent with rotation with velocities similar to those seen in the CO maps. Once more there are non-symmetrical velocity patterns closest to the nucleus: note especially the excess of blueshifts seen on the far side of the galaxy disk 2″ from the nucleus. The map of the [N II] velocity dispersion is more difficult to interpret. The [N II] dispersion is in general higher than that seen for CO, and the inner spiral structure is not as clearly discernible as a higher dispersion region. The star-forming region to the SW has a dispersion of 50 km s-1 in [N II] (less than that in CO). The nucleus shows a velocity dispersion (120 km s-1) significantly higher than that seen in CO and two regions 2″ from the nucleus in the NE and S directions also show relatively high (150–180 km s-1) velocity dispersions. These will be interpreted below in conjunction with the results of the two component fits to the [N II] emission line.
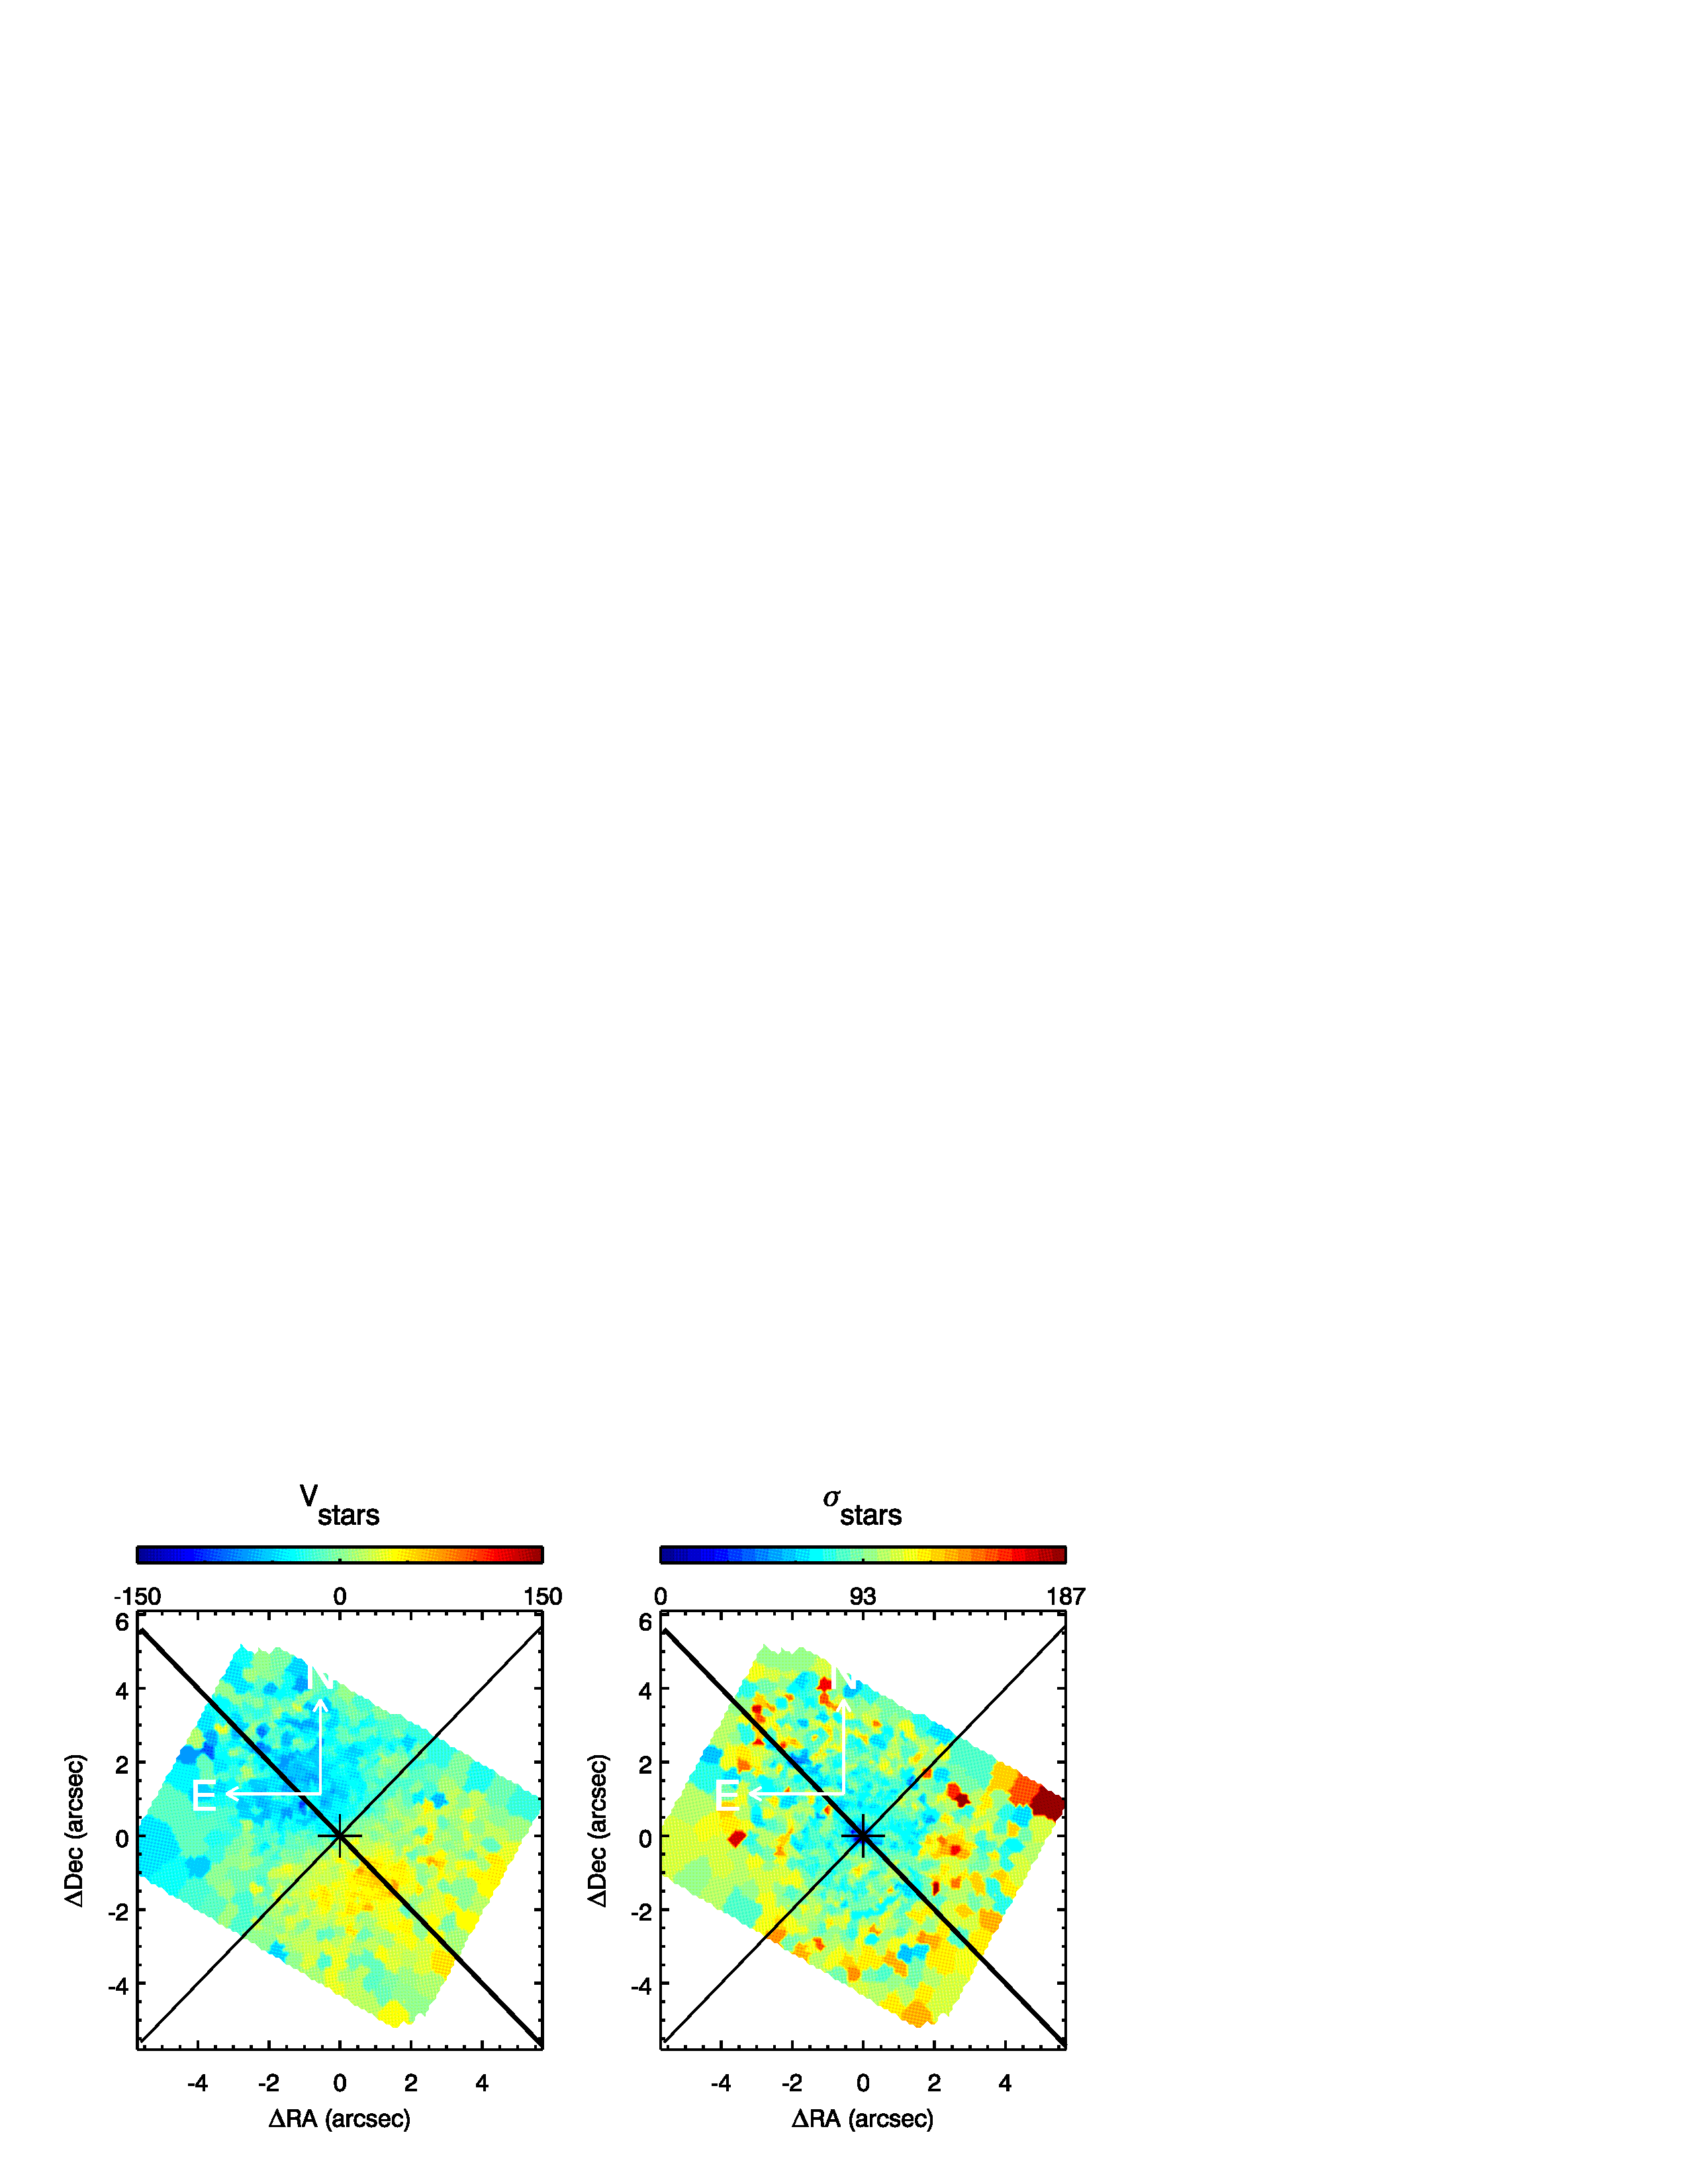
The bottom row of Fig. 3 shows a structure map and the first two moments of the stellar velocity field. The structure map was created by running the IDL routine ‘unsharp_mask.pro’ on a HST image taken through the F606W filter, in order to emphasize sharp changes in the image. While the highest contrast dust arc is seen on the far side of the galaxy as expected, several strong dust features are also visible on the near side of the galaxy. The stellar velocity map, derived from running pPXF on a Voronoi binned datacube (to achieve a minimum signal to noise of 25 in the continuum near the [O III] line in each spectrum), shows a clear rotation pattern. The stellar rotation velocities are significantly lower than those seen in the molecular gas. Since the map is relatively noisy even after Voronoi binning we did not attempt to fit a PA and inclination to this velocity field using Kinemetry. Visually, the PA appears consistent with the values we derive from our CO J:2-1 map; this is corroborated by our best fit rotation model to the stellar velocity field (see next section).
3.2 Modeling the Observed Velocities: Rotation
We used Kinemetry to analyze the CO J:2-1 velocity field (see Sect. 2), both to constrain the PA and inclination of the CO disk, and to constrain the relative contributions of circular rotation and perturbations. We assumed m=2 modes and thus use six (odd) Fourier decomposition terms. In the first run both the PA and inclination were allowed to vary with radius, and in the second run we fixed both to their median values from the first run. The Fourier decomposition coefficients of the best fit Kinemetry model are shown in Fig. 5. Here the term represents the pure circular (rotation) velocity and the other terms are perturbations. In the innermost 1″, the (radial) term is positive and dominates the pure rotation term (below we argue that this is best explained by a nuclear outflow) while the (circular rotation) term dominates between 1 and 4″. Beyond 3.4″, the CO velocity field is sparse and the results of Kinemetry are thus less reliable. Nevertheless we note that the coefficient of remains stable at 20 km s-1at radii beyond 1.4″, and the coefficient is significantly negative between 4″and 5″ which could signify an asymmetry about the minor axis. The other terms show relatively small amplitudes, and given that we sample a very small range of radii (significantly less than the bar co-rotation radius) we are unable to reliably interpret their variations. To emphasize the changing reliability of these results with radius we plot two dashed vertical lines. To the left of these is the region with a 100% of data coverage in the ellipse fitting (between 0 and 2.2″); between these there is a linear decrease from 100% to a 50% and to the right of these the data coverage of the ellipse fitting is lower than 50%, decreasing to 30% at 3.4″and beyond. It is thus clear that beyond 3 to 4″ the values of the coefficients are relatively unreliable due to the sparseness of the velocity field, and we thus do not attempt to interpret, e.g., the fact that the s1 term remains positive and almost constant.
We fit the observed stellar velocity field with a ‘Bertola’ model rotation curve (Eq. 2; Bertola et al., 1991). This model uses six parameters: the maximum amplitude of the rotation curve A; the radius at which this maximum amplitude is achieved c; a p factor which drives the slope of the rotation curve at larger radii (p=1 gives a flat rotation curve at large radii and p1 gives a decreasing rotation curve at large radii, emulating a finite total mass in the disk), the position angle of the major axis; the inclination of the galaxy, and the systemic velocity. Of the six parameters of the model we fixed the c parameter (by visual inspection of the radius at which the rotation amplitude reached its maximum) and the inclination (the same value obtained running Kinemetry on the CO velocity field). The best fit parameters obtained were A=200 km s-1, p=1.5, PA=45° (same as derived by Kinemetry on the CO velocity field), and a systemic velocity offset of 5 km s-1 with respect to that used in this work (1485 km s-1). This rotation model is shown with a dash-dotted line in Fig. 4, and is later (Sect. 3.6) used in the bar perturbation analysis.
The asymmetries in the observed CO and [N II] velocity fields are best appreciated once ordered rotational motions are subtracted out. We use three rotation models for our analysis of the observed gas velocity maps: all models use a major axis P.A. of 45° and an inclination of i=33°, derived from running Kinemetry on our CO J:2-1 velocity field. These three models differ in the parametric form of the circular rotation velocity with radius: (a) solid body rotation with parameters:
| (1) |
where is equal to 1.9 [ km s-1pc-1], r and are the polar coordinates in the velocity map, and i is the galaxy inclination; (b) An empirical axisymmetric rotation model (hereafter, ModC2014) based on the nuclear rotation curve derived by C14, but with a gradual decrease in circular velocity beyond 2″, roughly following the results from the Kinemetry fit to the CO J:2-1 velocity field. Recall that C14 derived the nuclear rotation curve by using their observed CO J:3-2 velocity field - specifically by minimizing the residual (observed model) velocities - at small radii, and literature H velocities at larger radii (the black line in their Fig. 9). Since the nuclear CO kinematics are highly perturbed and the velocity field is relatively sparse (especially beyond 25), it is not clear that a Kinemetry fit or a minimization of residuals will produce a reliable circular rotation model. In fact the circular velocity model obtained by applying Kinemetry to our CO velocity field, and that from fitting a Bertola model to the stellar velocity field, are both significantly different from the C14 rotation model (Fig. 4): the most significant difference is a decrease in the rotation velocities beyond 2″. Since a major function of the rotation model in the following sections is to emphasize asymmetries in the observed velocity field, we create a smooth rotation model which follows C14 (and the solid body model above) in the inner 2″ and decreases (to reflect the Kinemetry-derived and Bertola models) at larger distances (dashed lines in Fig. 4). This ModC2014 model is used to produce residual (observed model) velocity maps which better emphasize deviations from circular rotation as compared to using the C14 rotation model; and (c) the gas circular rotation model (specifically the variable ‘gascirc’) obtained by running Kinemetry on the CO J:2-1 velocity map.
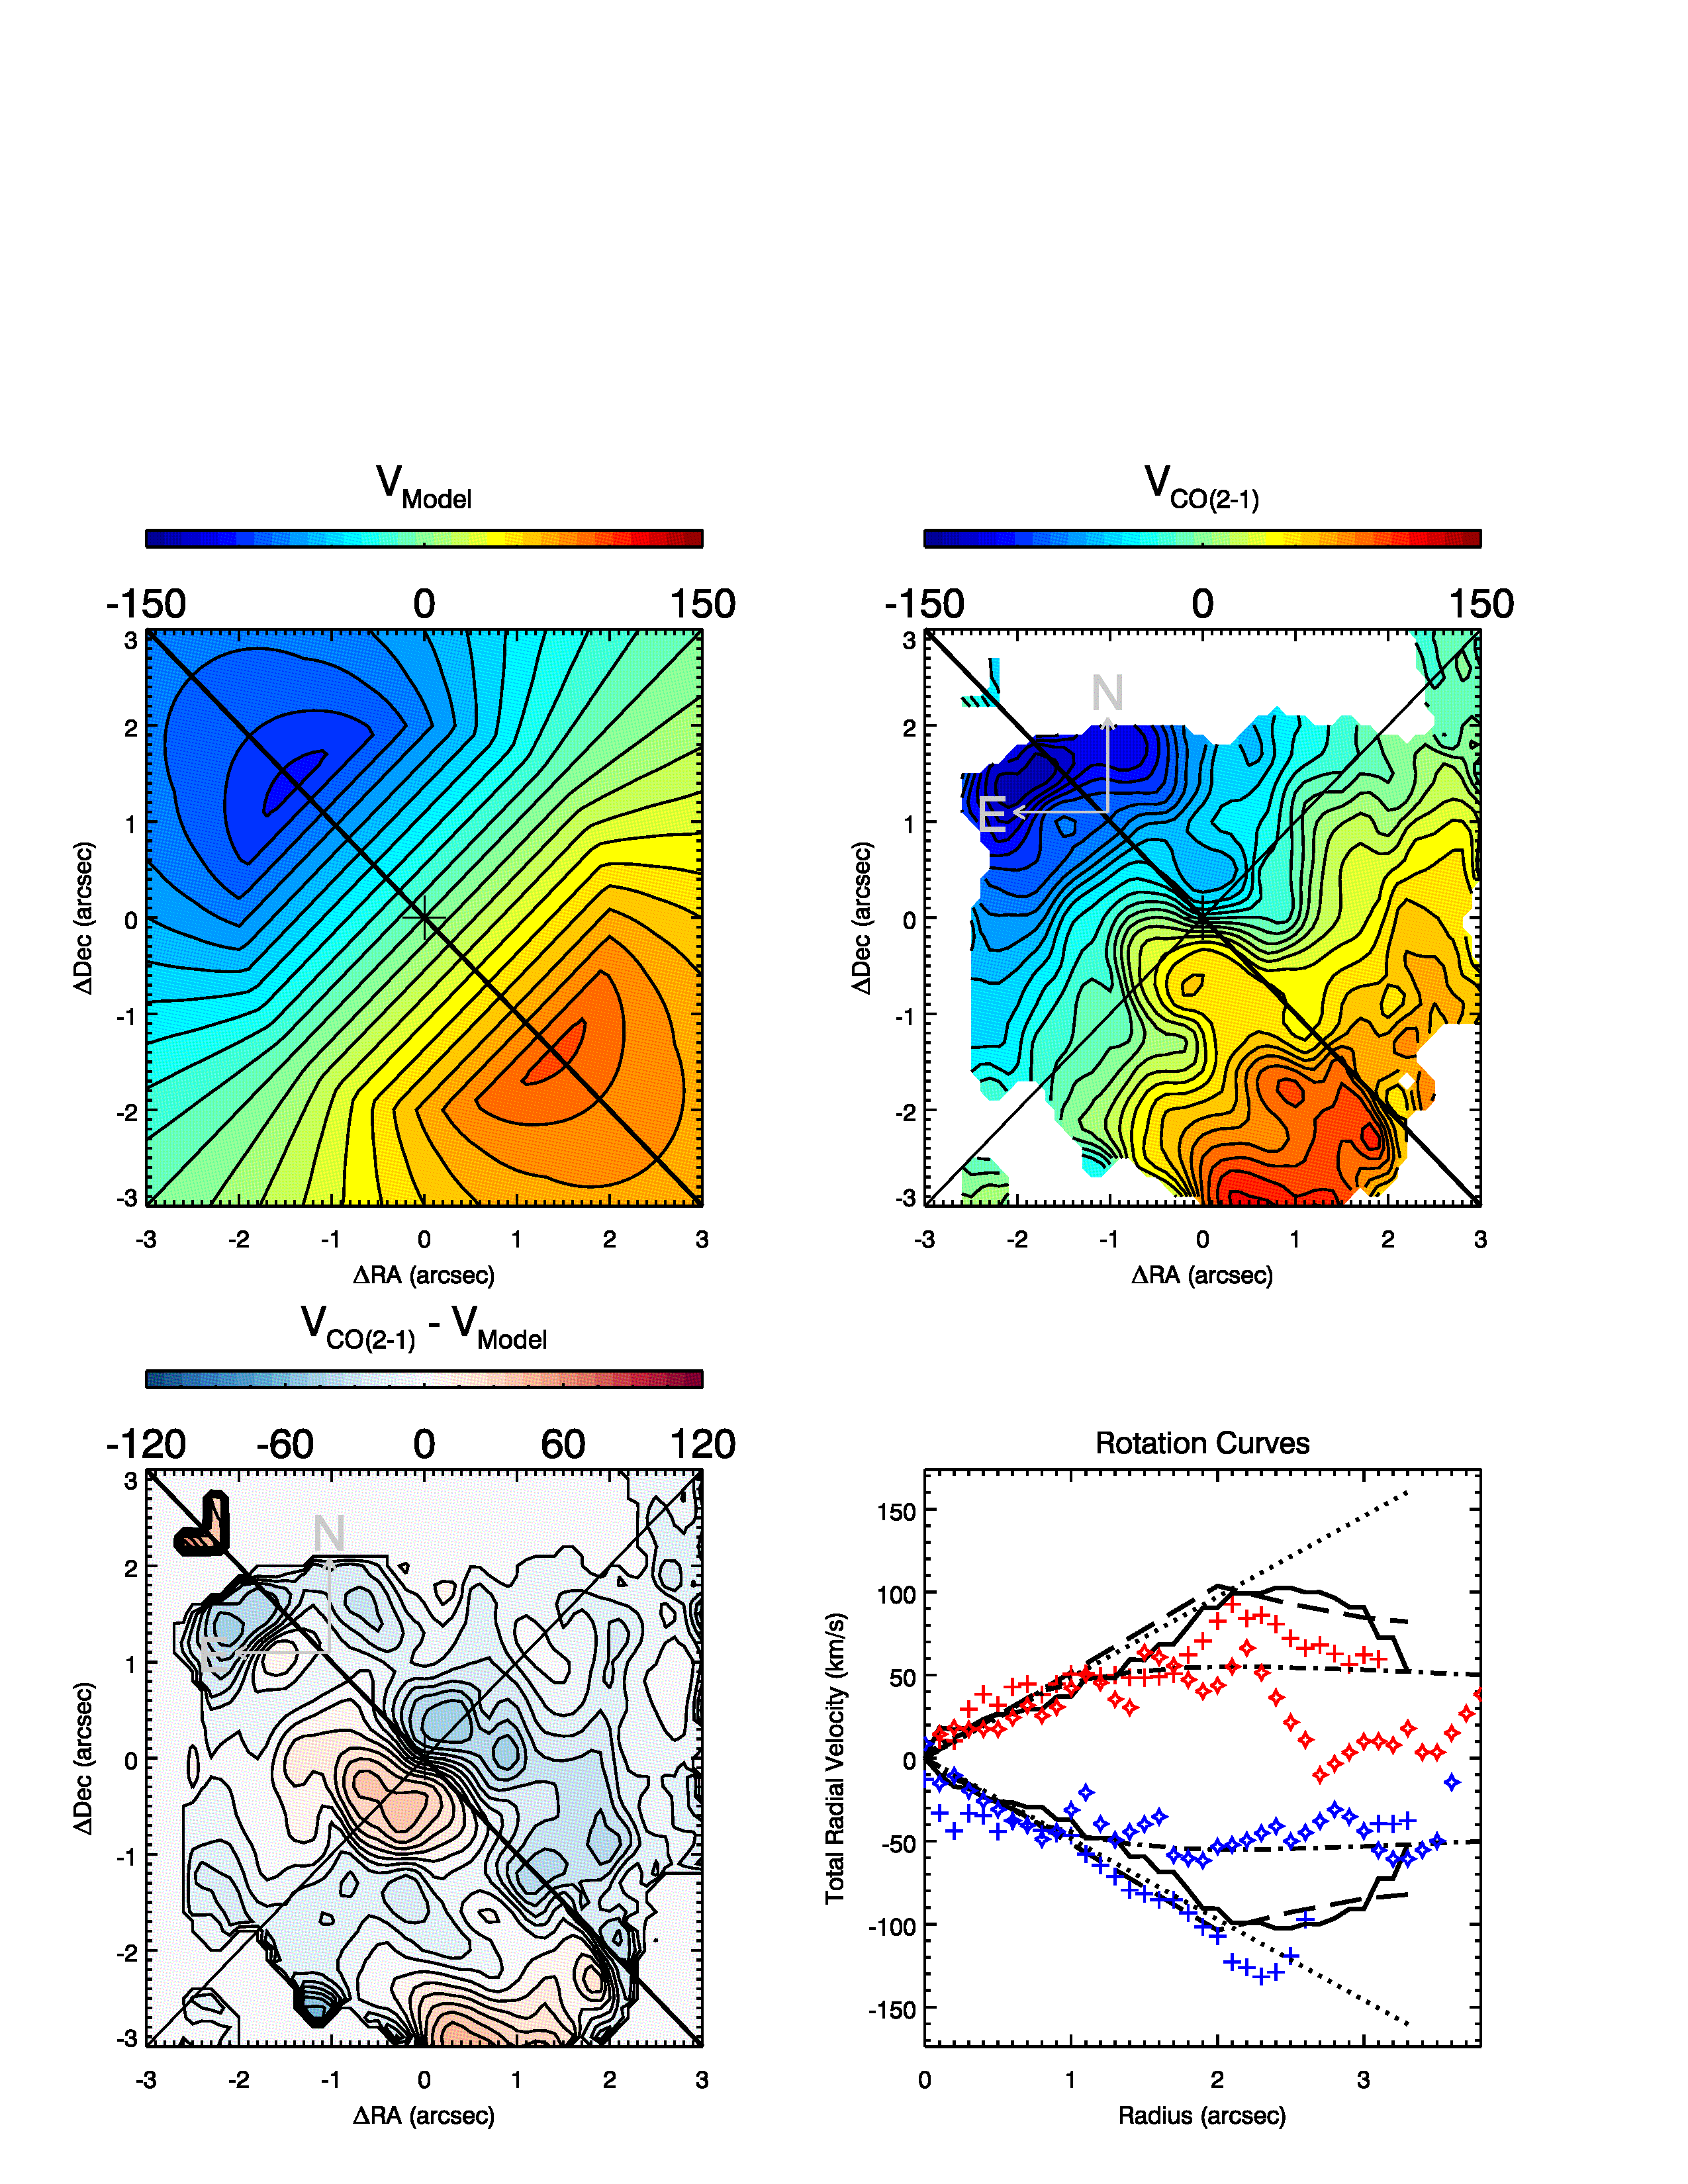
A direct comparison of the rotation models considered by us in the inner kpc of NGC 1566 is shown in Fig. 4. The CO J:2-1 velocities extracted along the major axis (crosses) show several differences from the solid body and ModC2014 models. First, the velocities are not axisymmetric with the blue-shifted velocities (to the NE) larger than the red-shifted ones (SW) between 1–2.5 arcsec from the nucleus. Second, both blue and red shifted sides show wiggles with larger velocities in the inner 05 and relatively small velocities at distances 25 arcsec from the nucleus. The circular gas velocity fit of Kinemetry to the CO J:2-1 velocity field (solid line) is by definition an axisymmetric fit; it well follows the solid body rotation model until 24 (except for an excess of velocities in the inner 05 (below we argue that this is due to a nuclear outflow) after which it shows rotation velocities slightly lower than ModC2014.
On the other hand, the stellar velocities along the major axis (stars in Fig. 4) presents two stages: the blue and red shifted sides are quite similar until 2″: in the inner arcsec it is completely consistent with our ModC2014 model. Beyond 2″, on the NE (blueshifted) side the stellar velocities flatten at 60 km s-1 while on the SW (redshifted) side the stellar velocities reach a similar peak but then decrease to almost zero velocity at 2.8″, after which they gradually increase again to 40 km s-1.
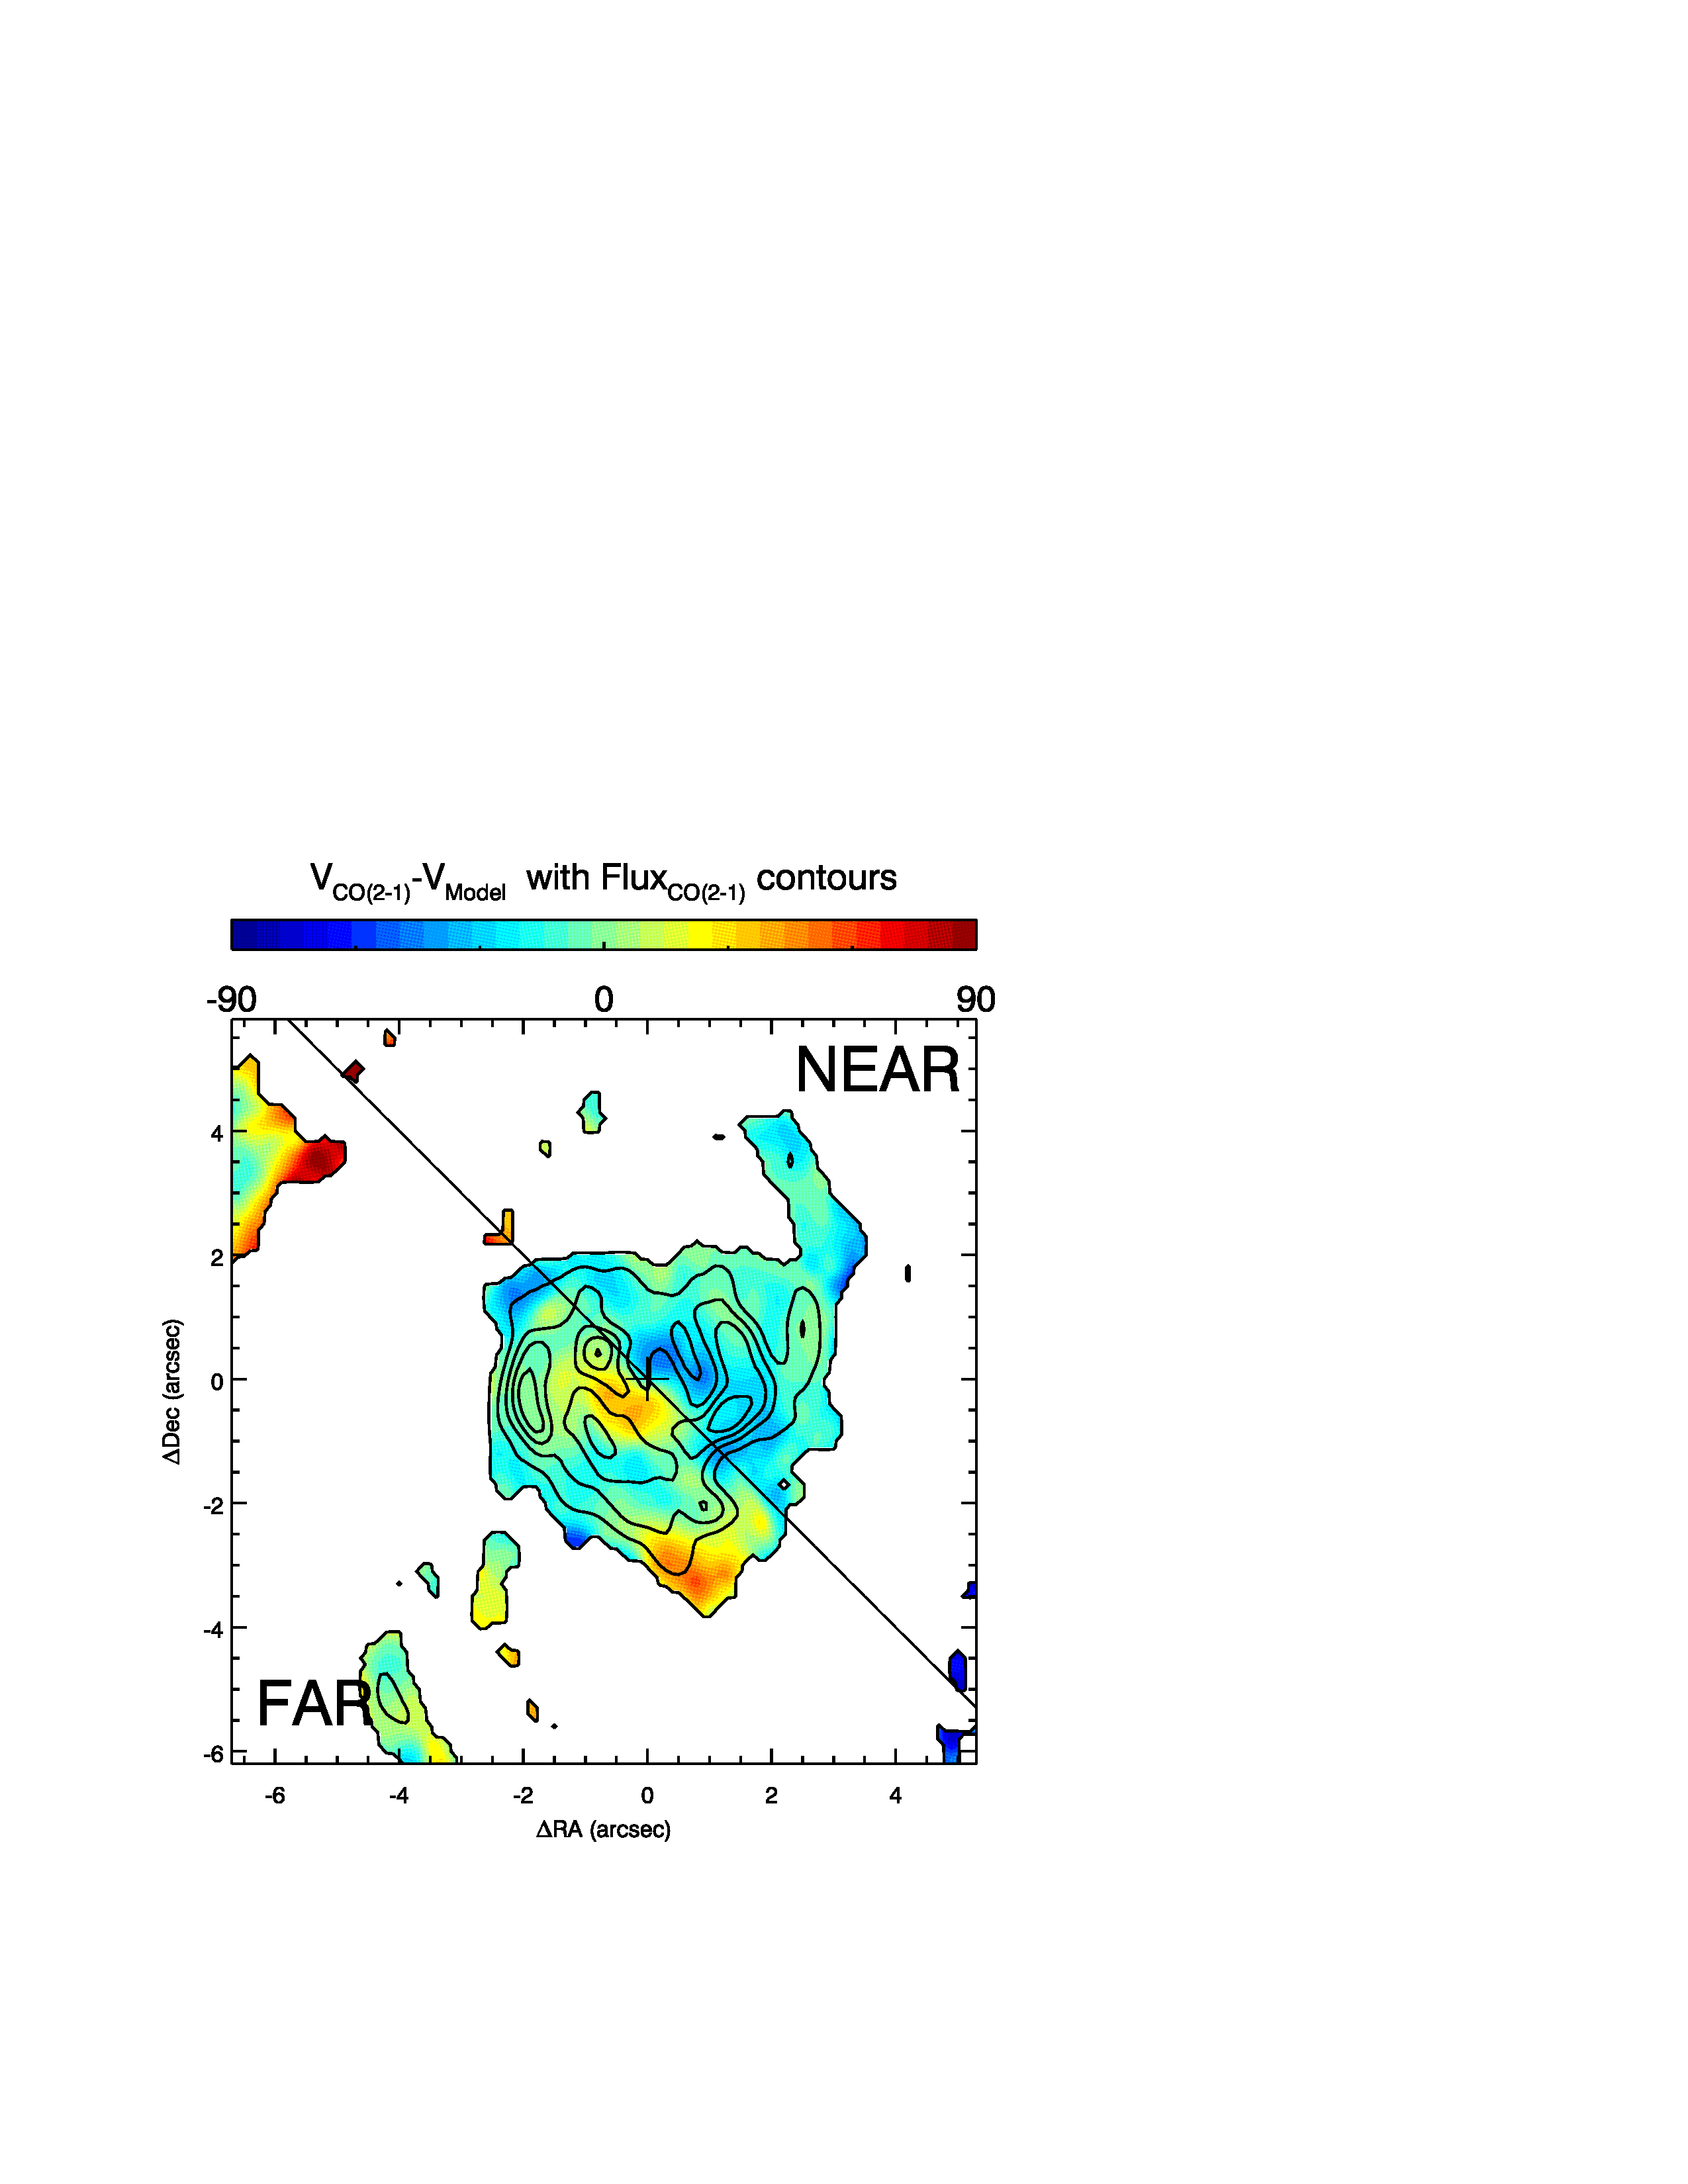
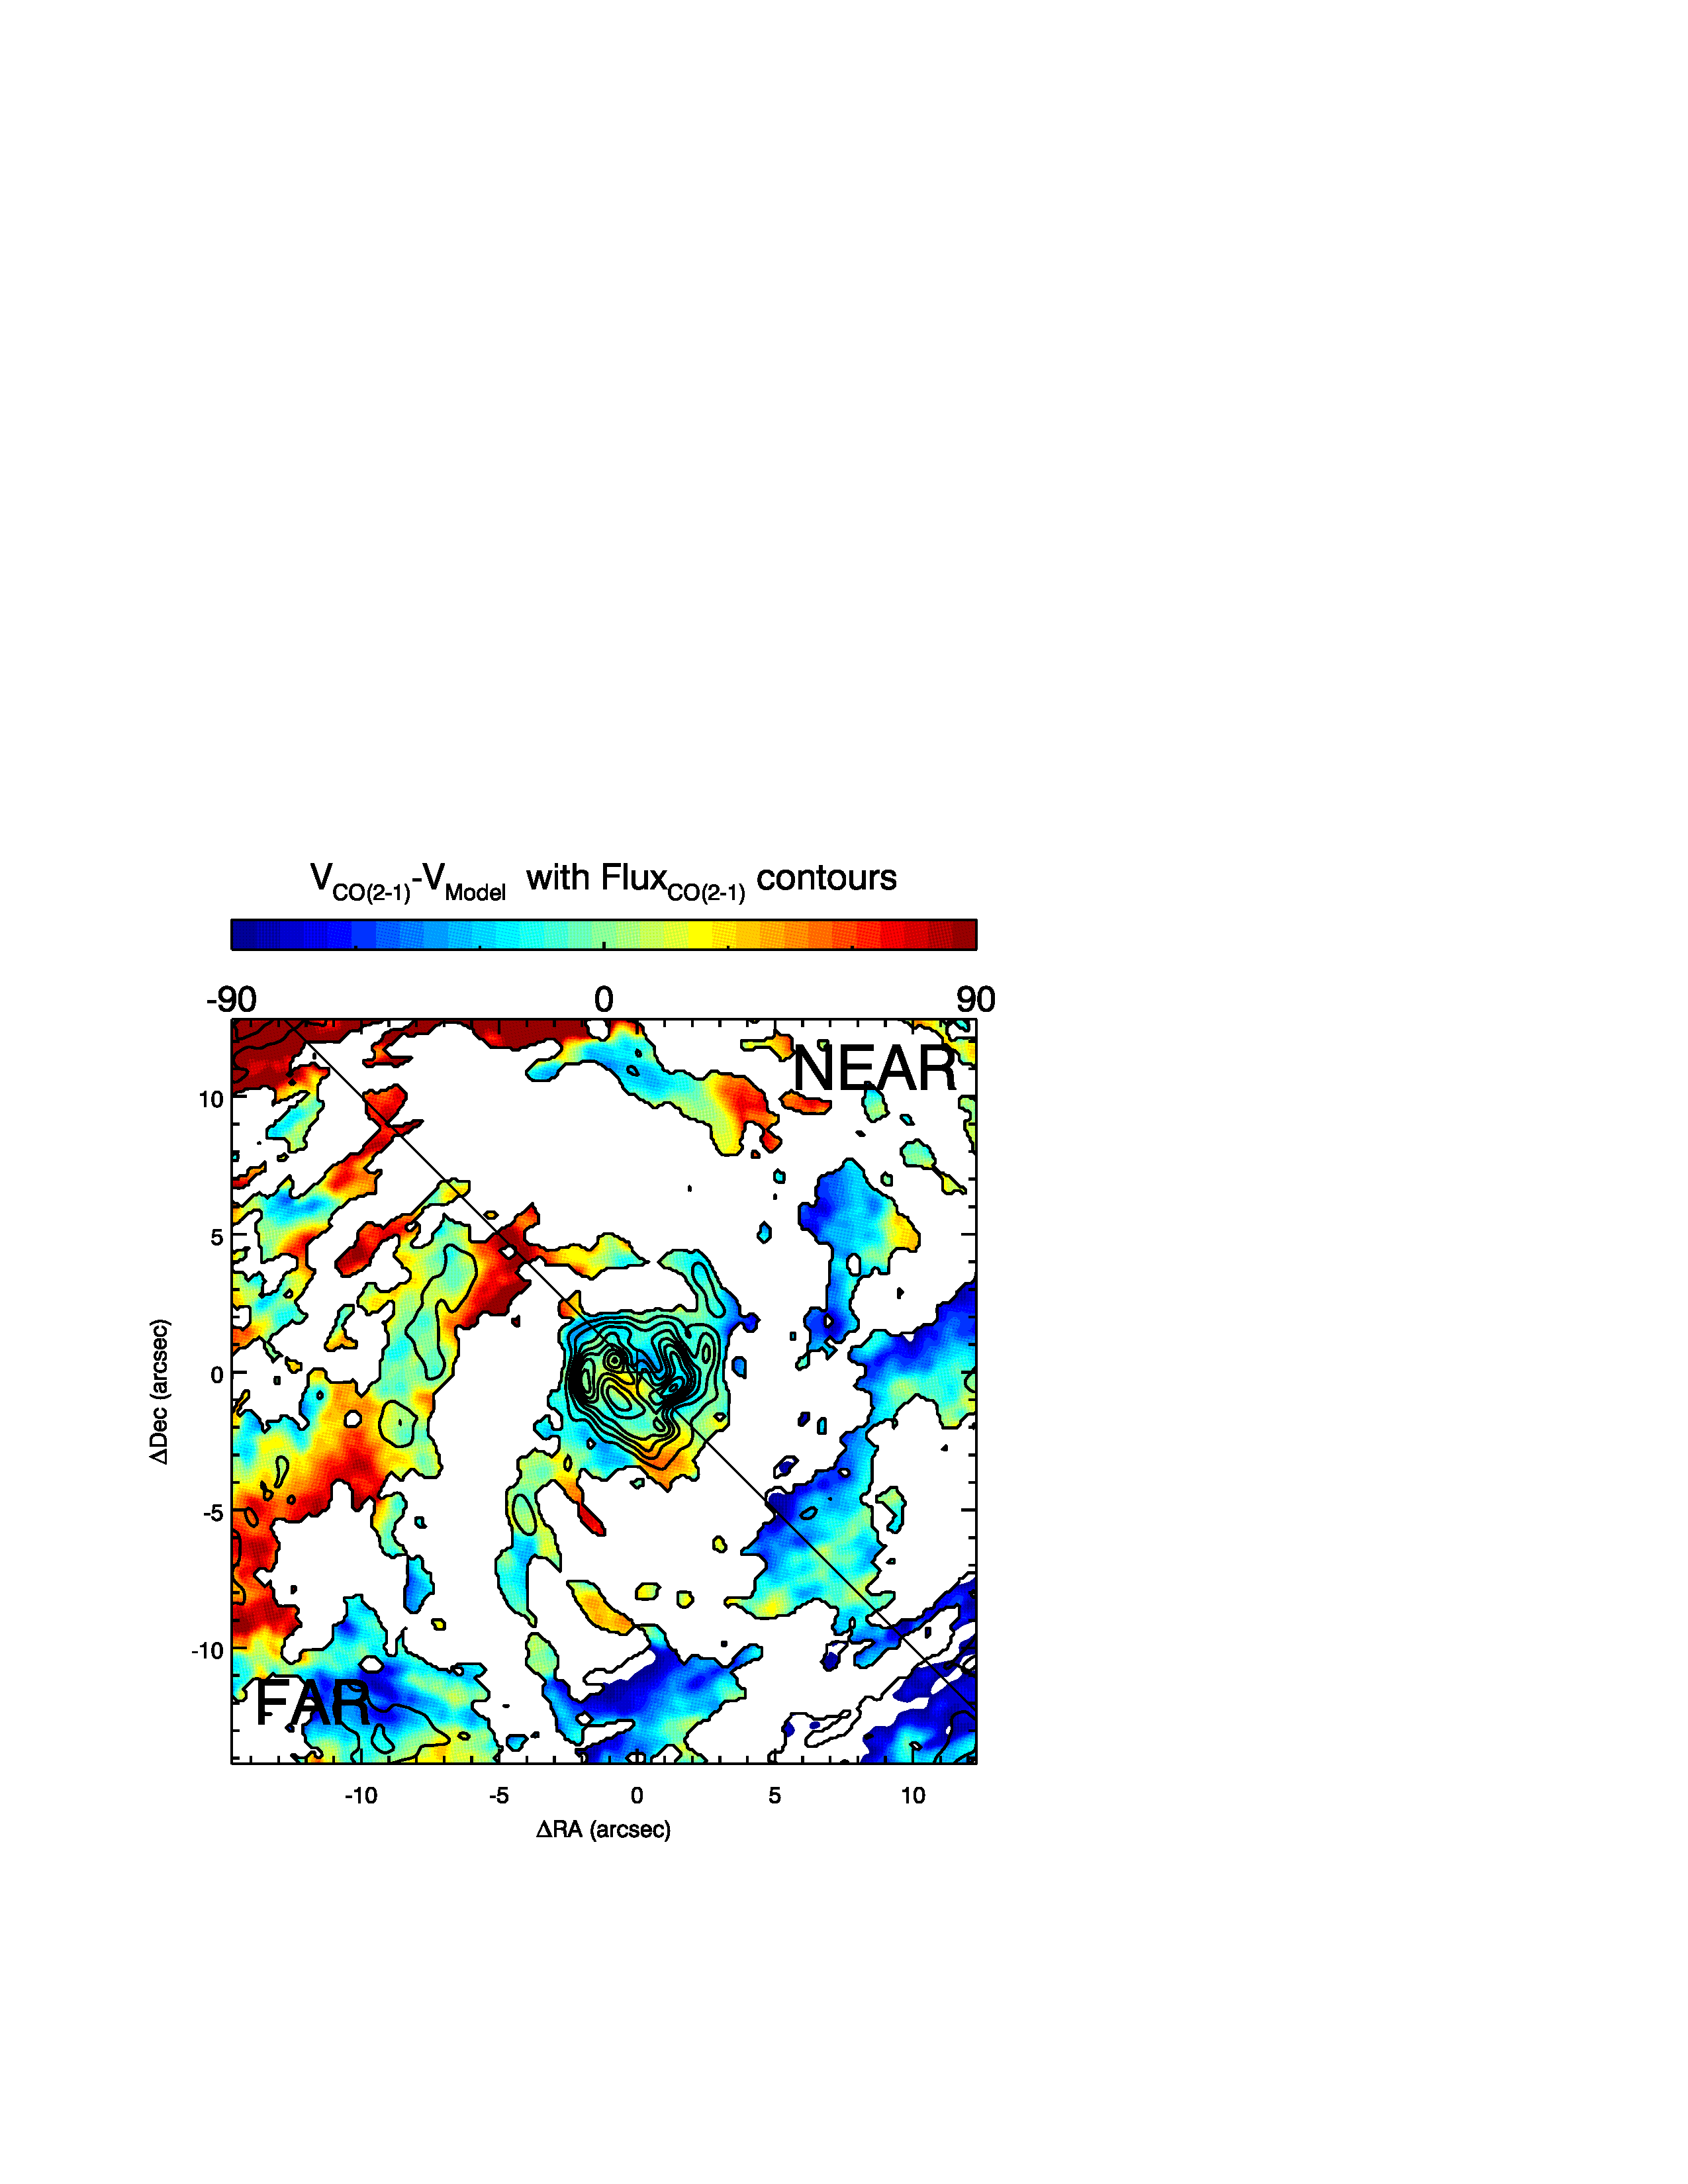
For the three models - solid body rotation, ModC2014, and Kinemetry-derived - the residual (observed minus model) CO J:2-1 velocity maps reveal similar asymmetries in the inner 2.6″. The differences in the residual maps are seen at greater radii: the Kinemetry model undersubtracts the observed velocities while the ModC2014 and solid body rotation models oversubtract the observed velocities. The Kinemetry model results in the best and most symmetrical residual velocity map for CO J:2-1, but does not work well for the GMOS/IFU data. For GMOS-derived ionized gas velocity fields, the inner region is well subtracted but a radii greater than 2″ the velocities are not well subtracted as a consequence of the very low model velocities; i.e., rotation velocities in ionized and stellar lines do not decrease at radii greater 2.6″ as in the case of CO J:2-1. Given that we are interested primarily in identifying deviations from axis-symmetric rotation in the innermost region, rather than accurately predicting the true rotation curve, unless otherwise stated, we consistently use the ModC2014 model for all (ALMA and GMOS) kinematical analysis in this work.
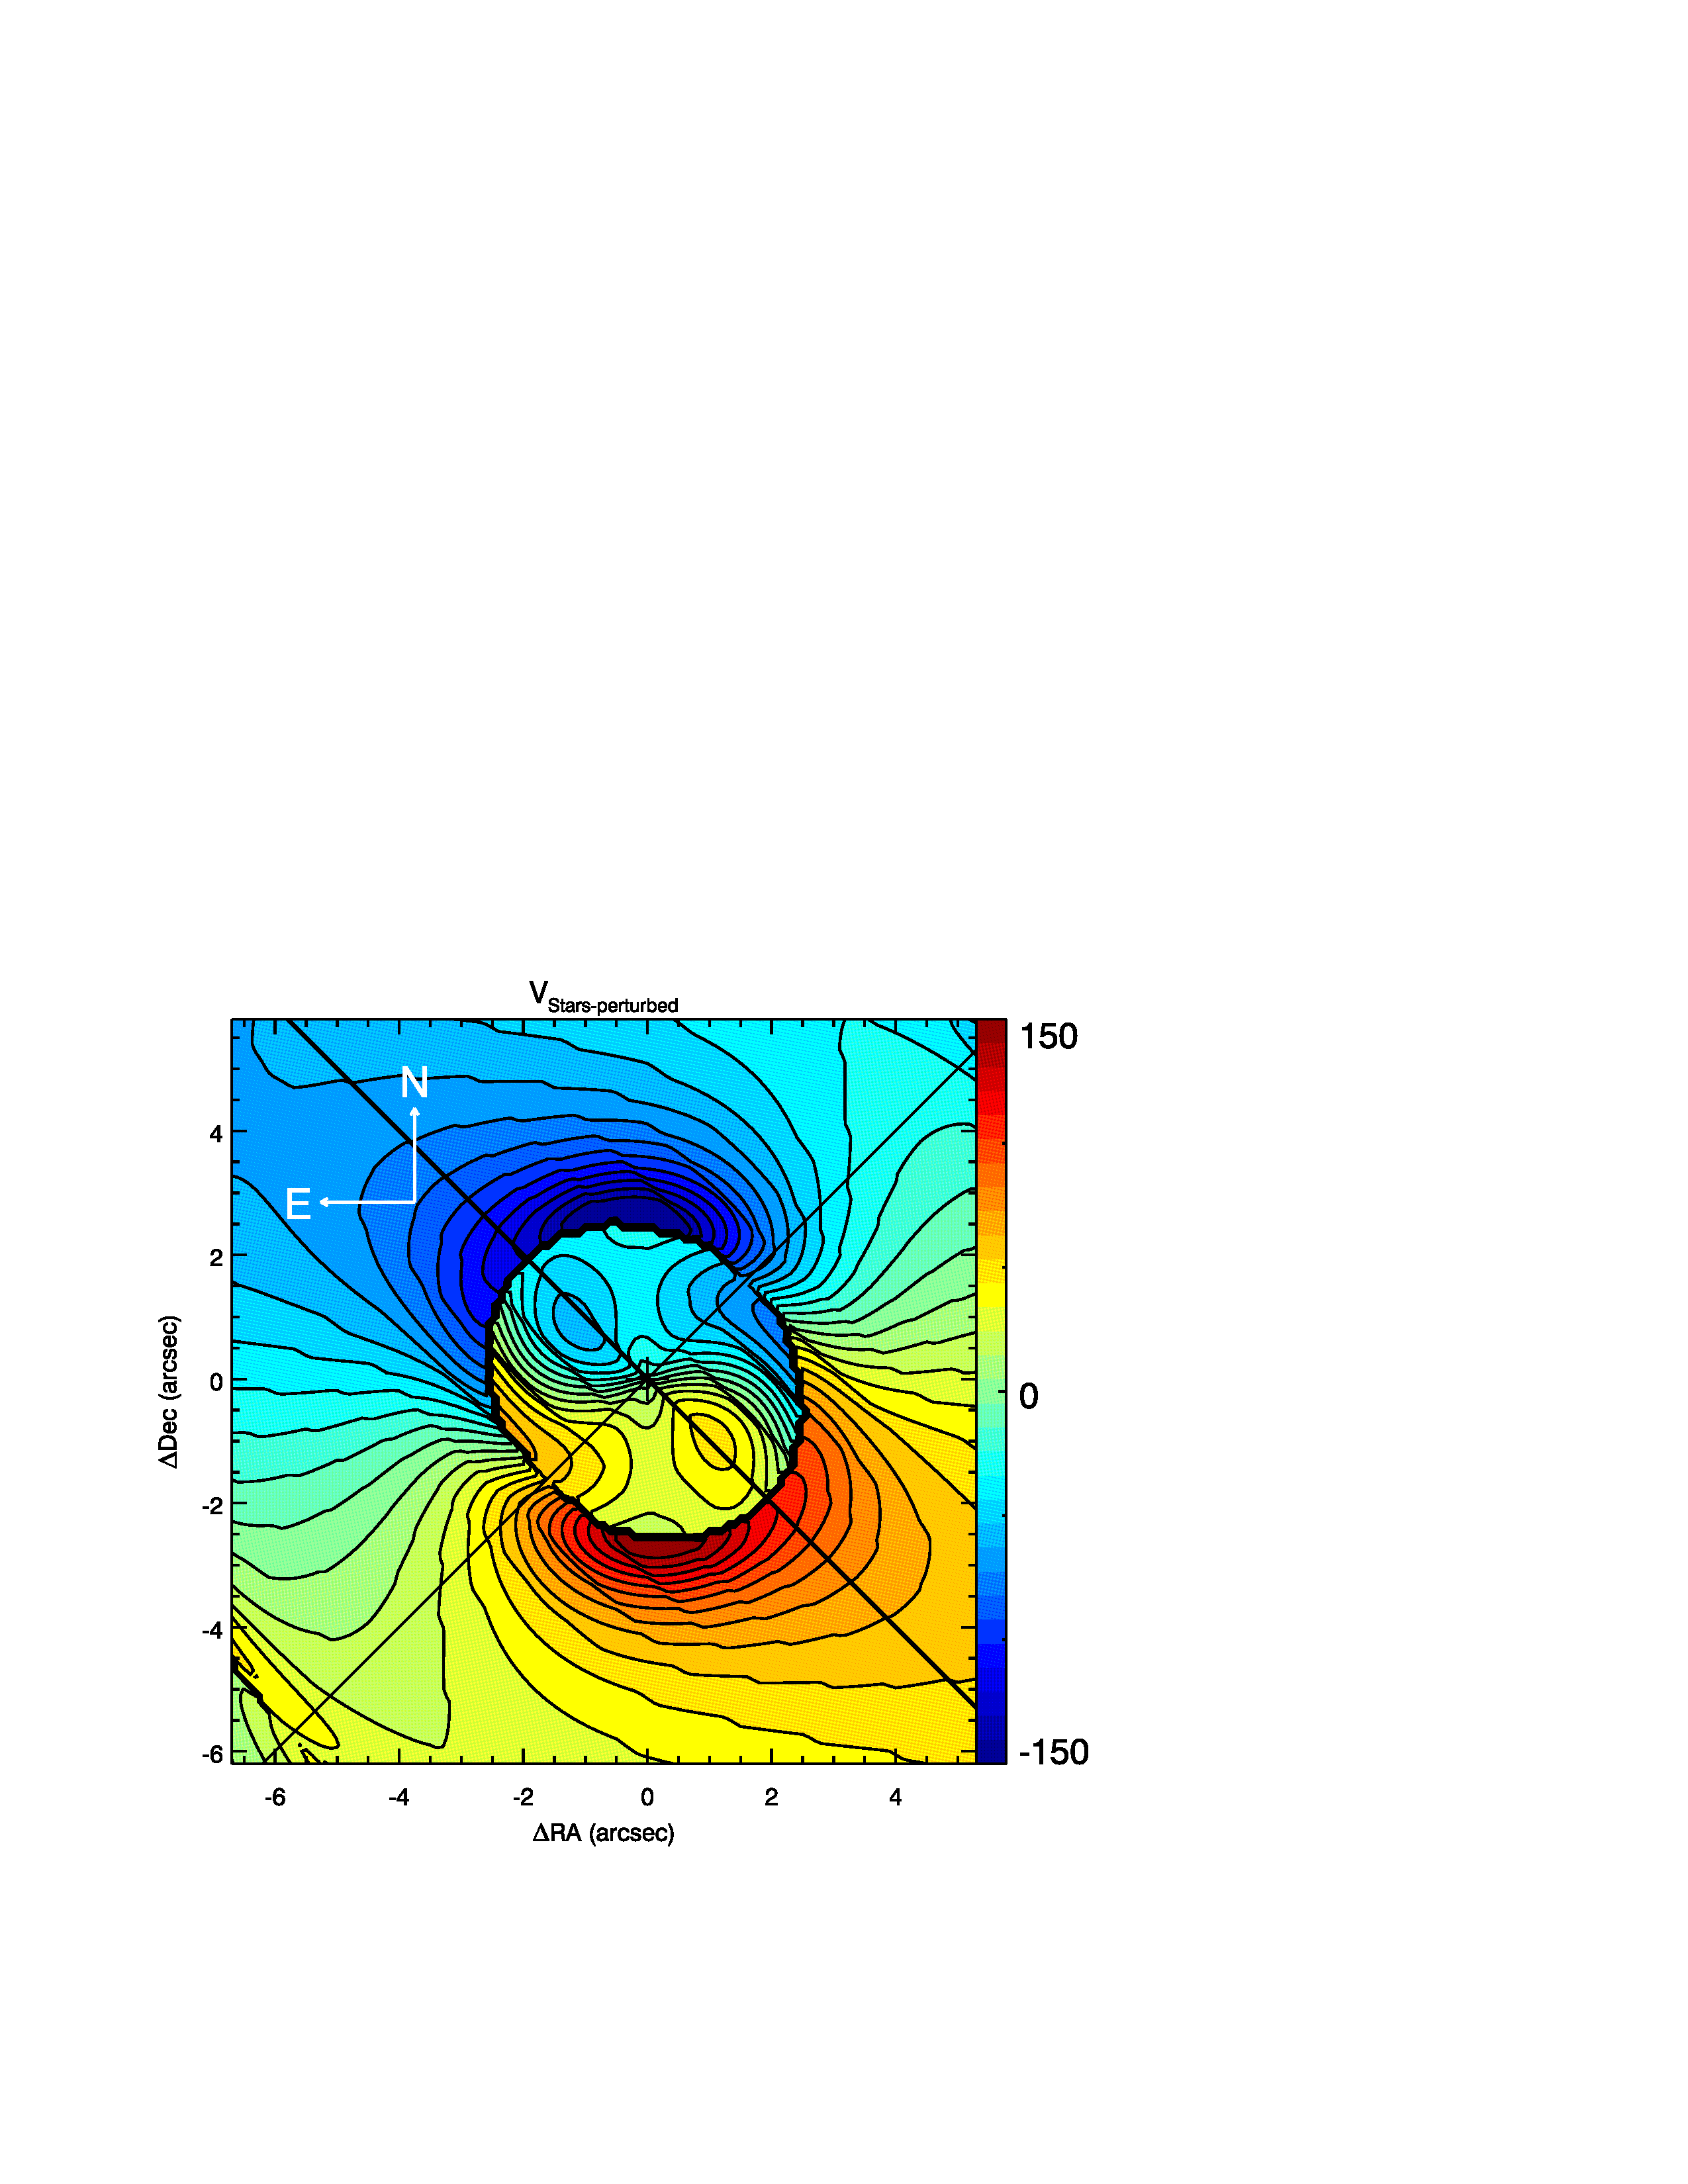
The residual (after subtraction of the rotation model) velocity field of the CO J:2-1 emission line is shown in Figs. 6 and 7. The departures from pure rotation are now clearer, especially in the inner 3″. The largest deviations are (a) blue and red shifted clumps 1″ to the NW and SE of the nucleus; (b) red spiral arms 4″ to the N and SE with the latter less redshifted, and (c) a diffuse clump some redshifted 3″ to the SW of the nucleus. The blue (residual velocity 50 km s-1) clump 15 to the SW of the nucleus along the major axis in our CO residual velocity map (Fig 7) marks the location of the star-forming region noted by Smajić et al. (2015): recall that this region is discernible in our [N II] moment maps, both as a a high flux region in the [N II] moment 0 map, and a relatively low velocity dispersion region in the [N II] moment 2 map. Further, this is also the region found to have a velocity gradient in its [O III] emission line da Silva et al. (2017). Disturbances produced by the star forming region could explain why the CO velocity here does not agree with the expectation from pure rotational.
3.3 Modeling Observed Velocities: Molecular Outflows?
The CO J:2-1 residual velocity map in Fig. 7 shows excess blueshifts to the NW (near side) and redshifts to the SE (far side) of the galaxy, around 1″ from the nucleus along the minor axis. This is the expected signature of outflows within the plane of the galaxy disk. This feature (but at lower spatial resolution, and at significantly lower spectral resolution and image fidelity) was noted by C14 and Smajić et al. (2015), but they argued that the small velocities seen in their CO J:3-2 maps made an outflow scenario unlikely. Smajić et al. (2015) have shown that residuals in the nuclear kinematics of the are consistent with outflows along the minor axis, but that these residuals are also easily explained by deviations introduced by the density waves of the nuclear spiral; non-circular orbits, e.g. a closed elliptical orbit with axes not parallel to one of the symmetry axes (minor or major) can produce residual velocities (Smajić et al., 2015).
We nevertheless argue for the presence of a nuclear outflow (which may of course co-exist with other bar-, warp, or spiral-related perturbations) based on the following reasons: (a) the presence of a nuclear outflow in NGC 1566 is not unexpected as previous studies have claimed kinematic and morphological evidence for the presence of outflows in the NLR (Schmitt & Kinney, 1996; Davies et al., 2016; da Silva et al., 2017), which are most likely to intersect the disk given the observed geometries, and in the larger scale disk (Pence et al., 1990). Note also the evidence of a blueshifted velocity in [O III]5007Å near the star-forming region 15 SW of the nucleus discussed above which da Silva et al. (2017, see their Fig. 20) interpreted as a consequence of contamination from an AGN outflow; we also detect this blue residual in our CO residual (observed rotation model) velocity map (Fig. 7); (b) the unresolved nuclear aperture shows a double peaked profile with Full Width at Zero Intensity (FWZI) 200 km s-1 (Figs. 13 and 15), higher than that seen in the lower fidelity maps of C14. If these velocities are attributed to an outflow, the fact that opposite velocities are observed on each side of the nucleus implies that the outflow axis is not aligned with our line of sight. Large angles to the line of sight are unlikely as this would imply extremely high true outflow velocities. An outflow in the plane of the disk would imply an outflow with velocities up to 180 km s-1. Conversely, attributing these observed velocities along the minor axis to other perturbations in the plane of the disk, requires radial velocity perturbations of 80–100 km s-1 in a nuclear region where the intrinsic (undisturbed) rotation velocities are expected to be 40 km s-1. As we will show in Sect. 3.6, our modelling of the bar-related perturbations does not reliably produce both the morphology and the large perturbations seen in the observed velocity field; (c) the pv diagram along the minor axis (bottom right panel of Fig. 9) not only shows the high-velocity components (60–90 km s-1) in the nuclear aperture but also lower brightness emission which connects these high-velocity components to the zero velocity components seen at r1.8″ on both sides of the nucleus. To the N (negative offsets in the bottom right panel of Fig. 9) the decrease in velocity in the inner arcsec is clearly seen, and to the S (positive offsets) the decrease is more clearly seen in the r1-2″ range. (d) the pv diagrams show velocity deviations which are consistent with radial outflows in the plane of the disk over several PAs (and not just the minor axis) and over apertures at distances of several synthesized beams from the nucleus (see Sect. 3.5); (e) as discussed in the next section, the kinematics of the emission line gas in the optical (from GMOS-IFU) are consistent with a nuclear spherical (or bipolar) outflow, which makes the interpretation of a related molecular outflow less surprising. In summary, we support the presence of a nuclear outflow, without ruling out the presence of additional bar- or spiral-related perturbations (Sect. 3.6). Other scenarios, e.g., a warped disk or non-coplanar disks (e.g., Wong et al., 2004; García-Burillo et al., 2014) cannot be constrained by us due to the limited resolution, the sparse velocity field, and the lack of a reliable circular rotation model for the galaxy.
This posited molecular outflow is most likely primarily in the disk of the galaxy for the following reasons: (a) outflows outside the disk are often related to nuclear jets (e.g.: Morganti et al., 2013; Sakamoto et al., 2014), but there is no clear evidence for radio-traced jets and outflows in the nucleus of NGC 1566. The potential radio extension in PA 10° (Sect. 1) is not aligned with our posited outflow axis. Further, apart from the Seyfert 1 classification there are no data (e.g., maser disks) to constrain the orientation of the central engine; (b) outflows are also often seen perpendicular to the plane of the disk, especially in the case of starburst driven winds (eg., Veilleux & Rupke, 2002; Veilleux et al., 2005; Leroy et al., 2015). However, for such a polar outflow the blueshifted (redshifted) emission would be seen towards the far (near) side of the galaxy disk, the opposite of that seen in NGC 1566; (c) a large (e.g. ¿30°) opening angle for the outflow, often the case in radiation-pressure-, jet-, and starburst-driven outflows will produce a large observed velocity dispersion due to the varying projection angles of the outflowing gas to the line of sight. In NGC 1566 we see a relatively low CO J:2-1 velocity dispersion (FWHM of 30 km s-1) in the posited nuclear outflow components (see Figs. 6 and 15). A spherical outflow scenario can be rejected as this would produce a large velocity dispersion centered on zero velocity, under the assumption of optically-thin emission in CO J:2-1. Note that in Sect. 3.4, we argue for the presence of spherical outflow in the ionized gas, which does not contradict our claim that the molecular outflow is in the disk; (d) the posited nuclear outflow has a limited extension, and an apparently decreasing velocity, both of which argue for deceleration of the molecular gas in the high-density medium of the disk; (e) the higher molecular gas density in the disk of the galaxy will make this component more easily detectable in short integrations, as compared to more diffuse molecular gas outside the galaxy disk. In summary, while the molecular outflow could have a larger opening angle (and indeed be isotropic) we appear to be preferentially detecting this component within the galaxy disk.
Is the posited outflow AGN or starburst-driven? As mentioned above, there is no clear evidence of a radio jet, and so any AGN-driven outflow would most likely be due to radiation-pressure. We note that the highest velocities in the outflow are detected at the position of the nucleus and not towards the star-forming knot 15 to the SW. Several authors have presented photometric and kinematic data which argue against the likelihood of a starburst-driven outflow in NGC 1566: Davies et al. (2016) used diagnostic diagrams of [O III]/H to demonstrate that there is no significant contribution from star-forming regions in the nucleus and it is the radiation pressure from the AGN which dominates in the inner scales. Smajić et al. (2015) present similar diagnostic diagrams using Molecular Hydrogen () and report an AGN domination for the nuclear region inside 1″ and a relatively modest SFR ( [M⊙yr-1]) in the inner 3″, implying a relatively low star-forming efficiency given the observed gas reservoir. Both the galaxy-wide SFR (4.32 ; Gruppioni et al., 2016) and the SFR surface density (0.033 ; Hollyhead et al., 2016) are relatively low, and thus star formation is not expected to drive a nuclear outflow (e.g., Cicone et al., 2014).
As seen in the pv diagrams of Fig. 9, a model which sums the ModC2014 model and our empirically derived outflow model (black solid lines in the pv diagrams; see Sect. 3.5) provides a much better fit (as compared to a pure rotational model) to the inner 2″ in the pv diagrams at all PAs. Note that our synthesized beam of 0.5 arcsec well resolves the central 4 arcsec of the galaxy (e.g. Fig 7). Nevertheless there are several specific features which cannot be fit only with the model of radial outflows (in the galaxy disk) plus rotation, e.g. the apparent morphological double structure of each outflow lobe (Fig. 7) and the pv diagram in PA=75° (middle right panel of Fig. 9) where observed velocities 1.5–2 arcsec from the nucleus to the E are not well fit by the model. These are discussed in Sect. 3.5.
In the residual velocity map of CO (top right panel of Fig. 7) the blue- and red-shifted lobes 1″ from the nucleus have a double-peaked morphology. The largest velocity deviations are along PAs of 100° and 140°, i.e. straddling the minor axis. How can this be explained? Do streaming motions into the nucleus along PA 120° create the valley between the two peaks? Further, why is it that almost the entire near side of the galaxy (NE) has a blue residual, while almost the entire far side of the galaxy (SW) has a red residual in the top right panel of Fig. 7? This is not due to the use of an incorrect major axis PA (varying the major axis PA does not change these features). Effectively, the NE and SW sides of the galaxy are not axisymmetric in their rotation (see, e.g., Fig. 4).
3.4 Modeling Observed Velocities: Ionized Gas Outflows?
The [N II] line velocity map was (obtained from the Gauss-Hermite fit version of profit.pro after subtracting the broad H line emission). The [N II] velocity residual map constructed using the same rotation model used for the CO J:2-1 line at first glance appears morphologically similar to its CO J:2-1 counterpart (bottom panels in Fig. 7). However the P.A. of the major axis for the [N II] rotation (especially to the SW) appears to be 15 smaller than that used in our model. Further, the [N II] residual velocity map clearly shows blue residual velocities at 1–2″ on both sides of the nucleus (with the largest velocity deviation to the SE), in contrast to the CO J:2-1 residual velocity map which clearly shows opposite colors on each side of the nucleus (interpreted above as the sign of a nuclear molecular outflow in the disk).
In the [N II] velocity residual map, the blue region on the near side of the galaxy (NW of the nucleus) is in rough agreement with the equivalent blue region in the CO J:2-1 residual map, and thus would be consistent with the outflow scenario posited for the CO J:2-1 data. On the other hand, the blue region in the [N II] velocity residual map on the far side of the galaxy (SE of the nucleus) is located along the minor axis at 18 from the nucleus: this does not match the feature seen in the CO J:2-1 residual map which is closer to the nucleus (1″) and redshifted. Note that this blue SE feature in the [N II] residual velocity map is roughly cospatial with a region of high dust extinction (structure map in Fig. 3). A red region closer to the nucleus matches with the red region to the SE seen in the CO residual map, however, this consists in redshifted radial velocities around 10 km s-1 which is too low to be considered significant as a part of an outflowing gas. There is another small region to the SW at 2″ which is redshifted and around 50 km s-1 but in spite of having a similar dynamic range, it does not match with the redshifted outflow region to the SE in the ALMA residual map (15), being placed too close to the star-forming region.
The [N II] emission in the inner 2″ is double-peaked, and thus cannot be well fit with a single Gauss-Hermite polynomial. We, therefore, used the two Gaussian fit version of profit.pro to search for potential independent velocity components in the [N II] emission line. Meaningful two-component fits were obtained in part of the inner 3″ radii nuclear region and the resulting velocity maps are shown in Fig. 8. These maps include only pixels for which a double component fit produced a meaningful result. For regions where the two-component fit was not possible, the single component fit remains valid. Note that in the latter case the single component fit shows primarily the equivalent of the narrow component but in a few regions the velocity dispersion of the single component fit is similar to that of the broad component of the two-component fit. The two-component fit is mainly obtained near the nucleus and on the near side of the galaxy. On the far side (and a small nuclear region to the W on the near side), the regions in which a two component fit is not possible coincide well with the regions of high dust extinction. The ‘narrow component’ shows velocity dispersions ranging between 60 and 90 km s-1 (bottom left panel of the figure) and the velocity field of this component mainly follows that expected from our rotation model. The second component, which we refer to as the ‘broad component’, shows velocity dispersions of 140–160 km s-1 (bottom right panel of the figure) and does not appear to participate in regular rotation.
The strong blue residual region to the SE in the single component [N II] residual velocity map is not fit with a double component. The weaker blue residual region to the NW in the single component [N II] residual velocity map is now seen to be blue in its broad component only; in its narrow component this region follows regular rotation. Note that both blue knots do not correspond to regions of high dust columns in the structure map.
Based on the velocity field of the broad component of the two component fit to [N II], the velocity field of the high dispersion (120 km s-1) areas in the single component fit to [N II] and the distribution of the nuclear dust, we postulate the presence of an expanding sphere of ionized gas, i.e. a spherical ionized outflow, for the reasons given below. With the presence of dust (dominantly in the plane of the galaxy disk) we would preferably see emission from the hemisphere in front of the galaxy and moving towards us, i.e. blueshifted radial velocities. In the absence of dust one would expect a large dispersion and a median velocity close to systemic. Note that given the relatively low inclination of NGC 1566 (33°), dust in the inner 2″ (100 pc) of the disk produce an almost equal extinction of light from the bulge for both the ‘near’ and ‘far’ side of the galaxy disk. This is clear in the structure map where dark dust lanes are seen on both the near and far sides in the inner 2″. Only at larger radii are the structures of the dust lanes more prominent on the near side of the galaxy disk. In the case of NGC 1566 we do not obtain a two-component fit in areas where the structure map implies marked dust lanes (non-intuitively these are on the far side of the galaxy disk in the innermost arcsec) and find large blue shifts in the broad component of the two-component fit on the near side of the galaxy disk in areas where the structure map shows less marked dust lanes. Further, the maps derived from the single component fit to the [N II] line (Fig. 3) show two regions of high dispersion, about 2″ from the nucleus to the SE (the blue knot referred to above) and to the NE. These two regions effectively correspond to the broad component, and are also blue in their velocity. Thus we effectively see blue velocities in the broad component in almost every compass direction implying a spherical outflow in the inner 2″ which is visible to us primarily in areas of lower dust extinction. Similar kinematic signatures, and thus interpretations, were observed and used in previous IFU studies, e.g. in the nearby Seyfert galaxy NGC 2110 (Schnorr-Müller et al., 2014b), and in some radio-quiet quasars (Liu et al., 2013). Nevertheless, despite all these signs, we are not neglecting a potential presence of a bipolar outflow. Namely, it might be reasonable to think that what we see as a spherical outflow might be instead ionized gas ejected from the nucleus in opposite directions but we notice just a part of them as a consequence of a poor resolution in the GMOS data (0.5–0.6″).
We note that our postulation of this spherical outflow of ionized gas does not contradict our postulation of cold molecular gas outflows in the galaxy disk. The cold molecular gas outflows are expected to be preferentially detected in the plane of the disk for two reasons: a low density CO outflow would be optically thin and its profile would thus be centered on zero velocity and the significantly larger abundance of molecular gas in the disk as opposed to above the disk, makes the disk molecular gas much easier to detect.
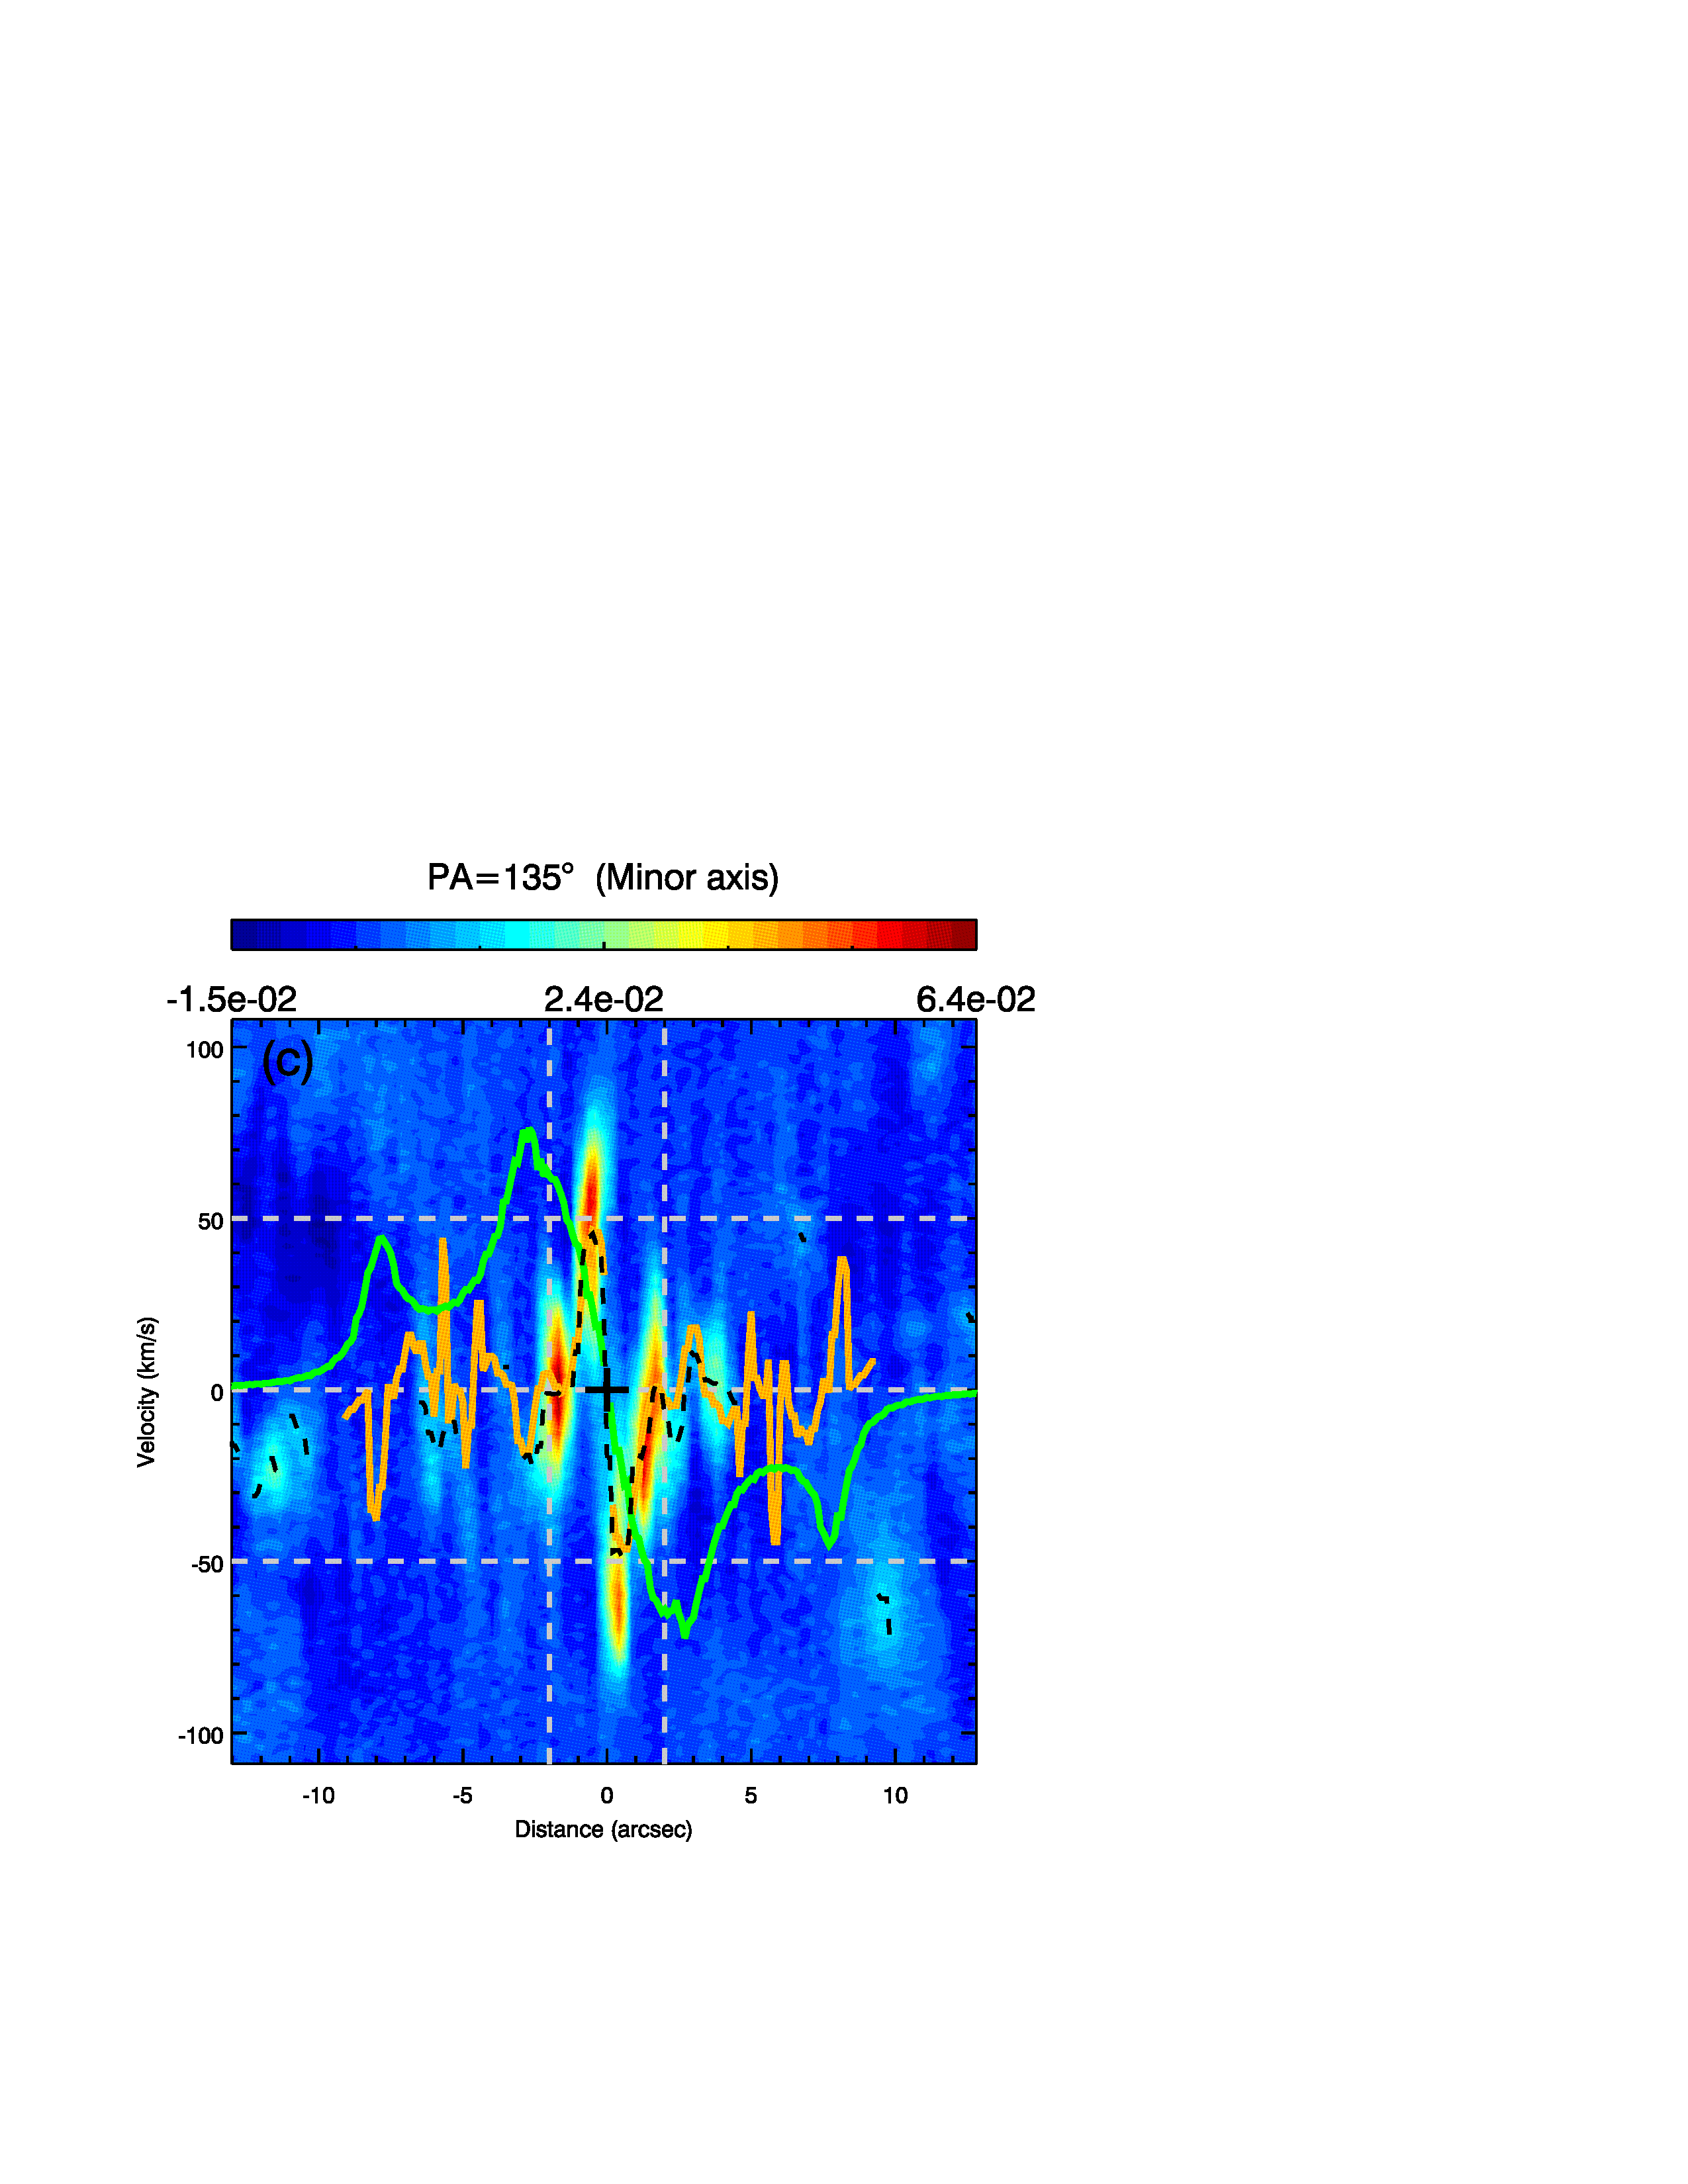
3.5 Observed Position-Velocity (pv) Diagrams: ALMA
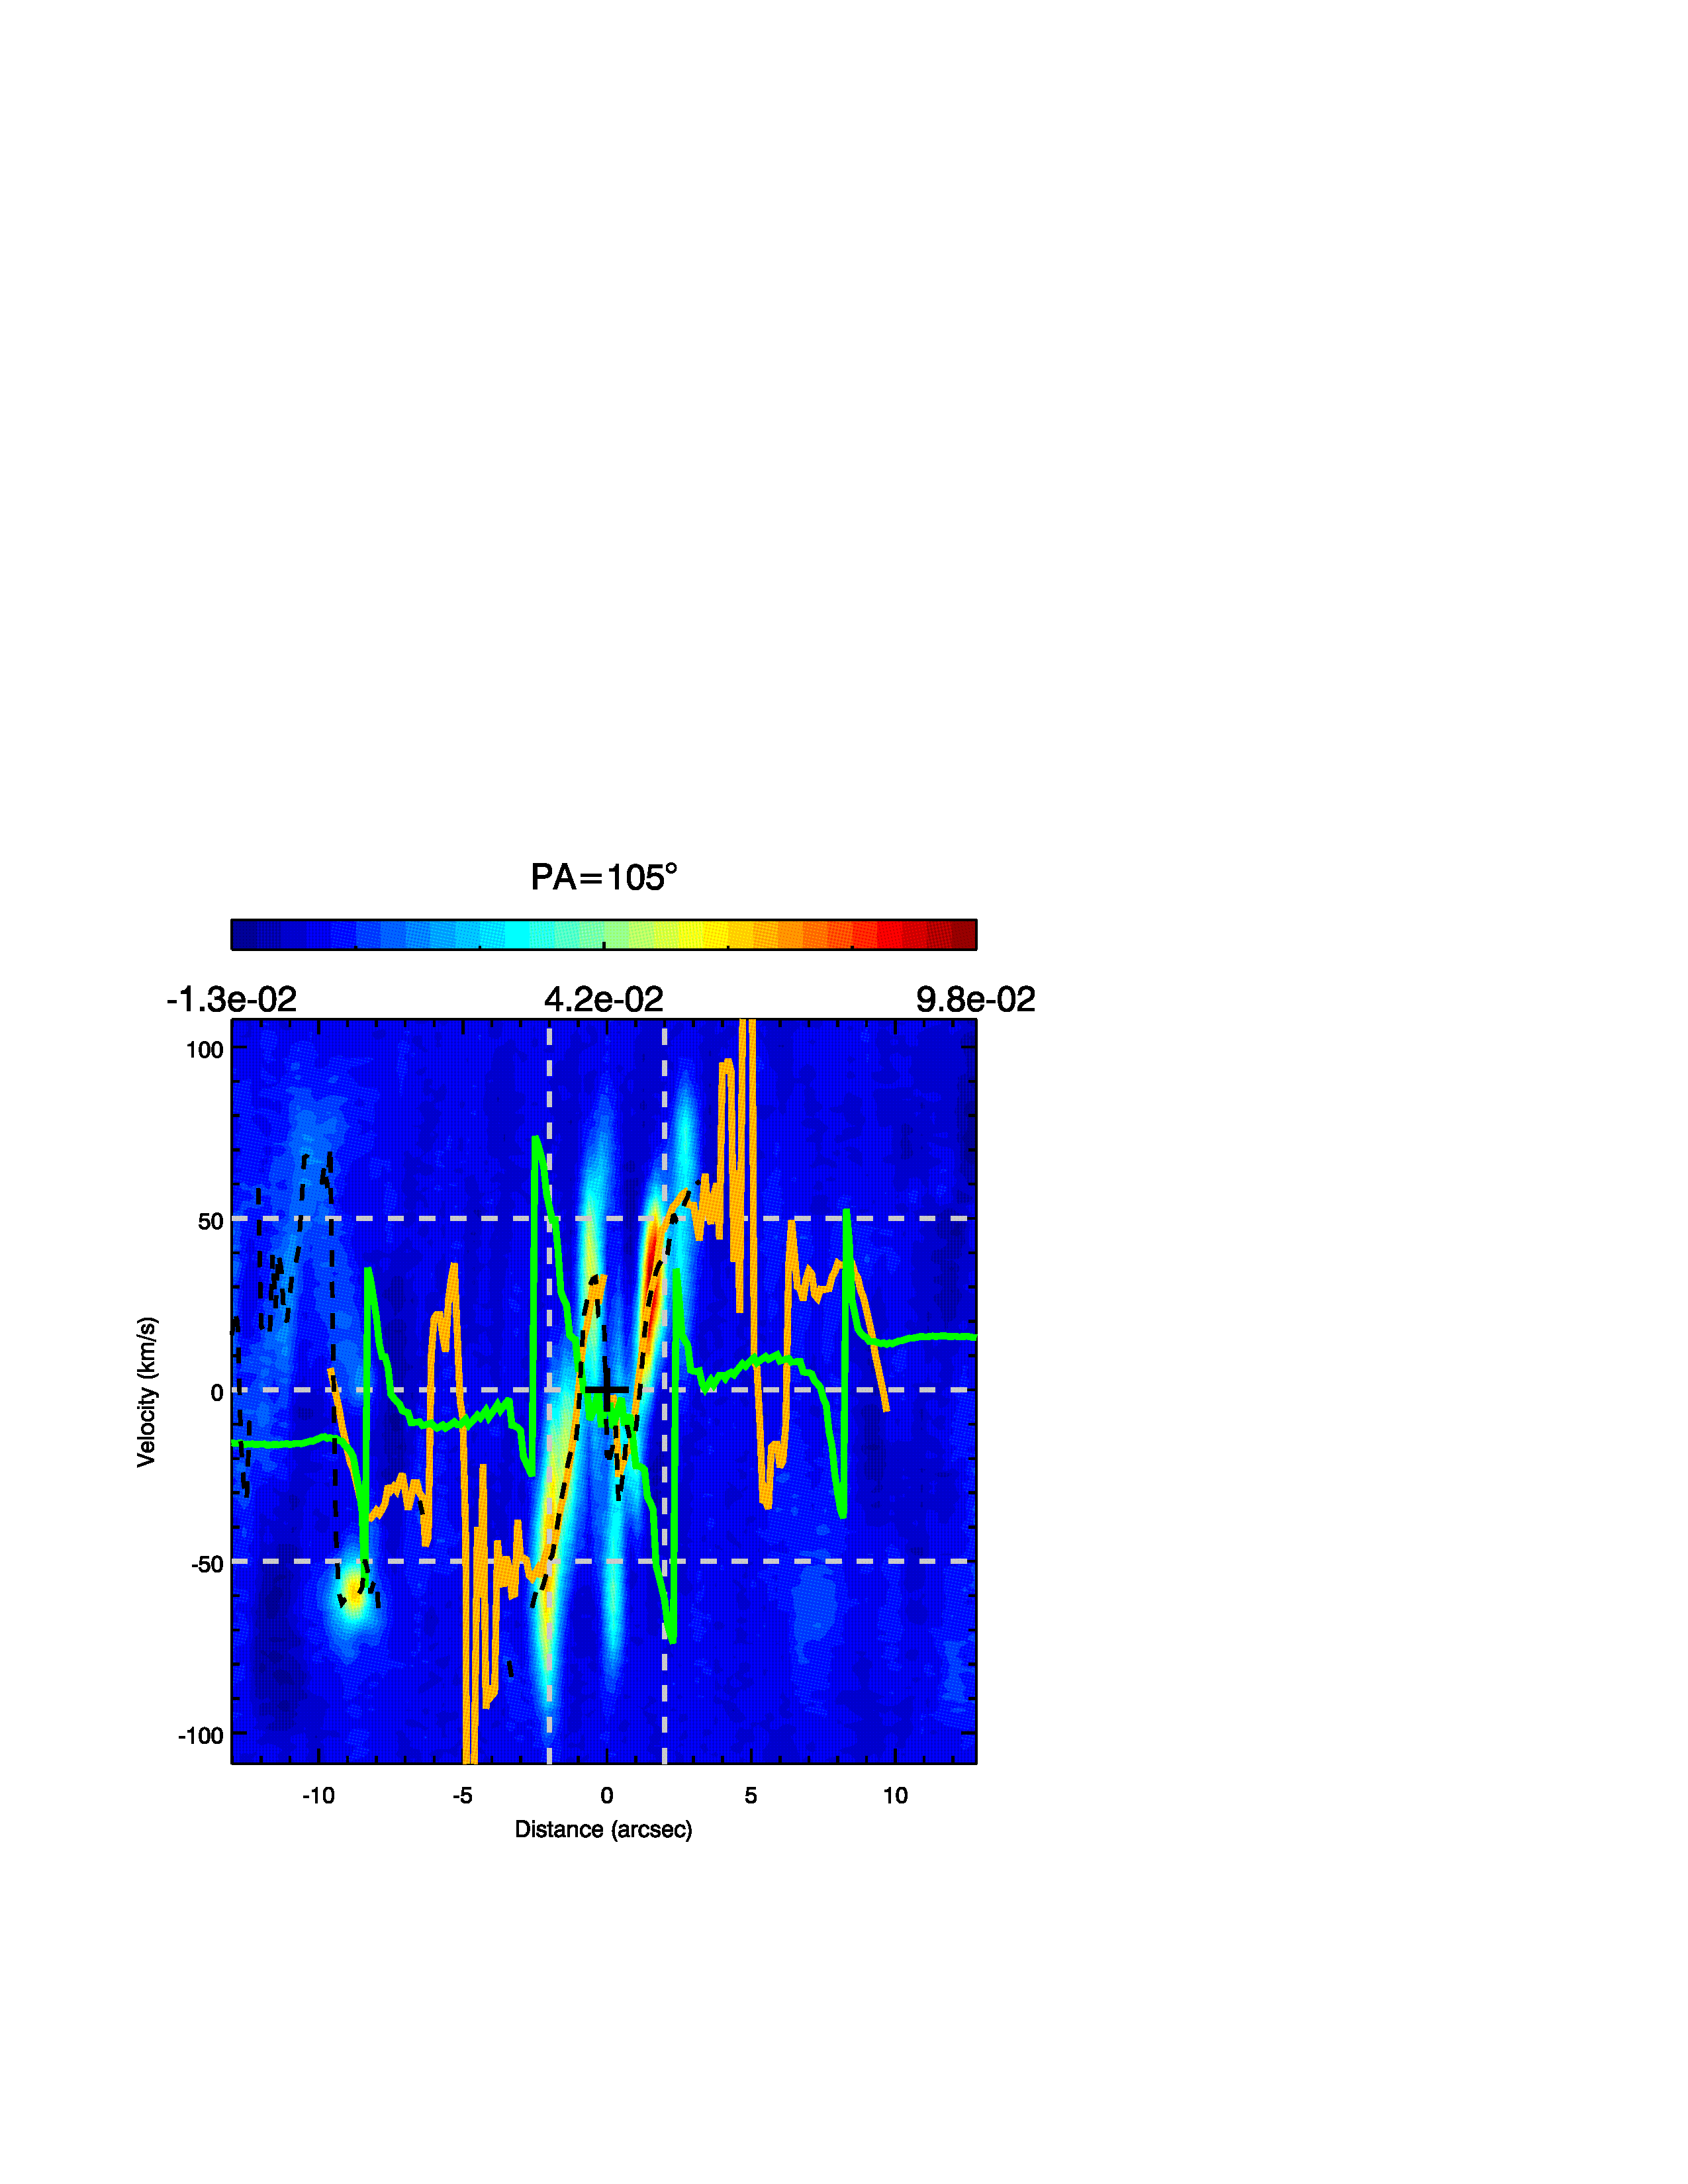
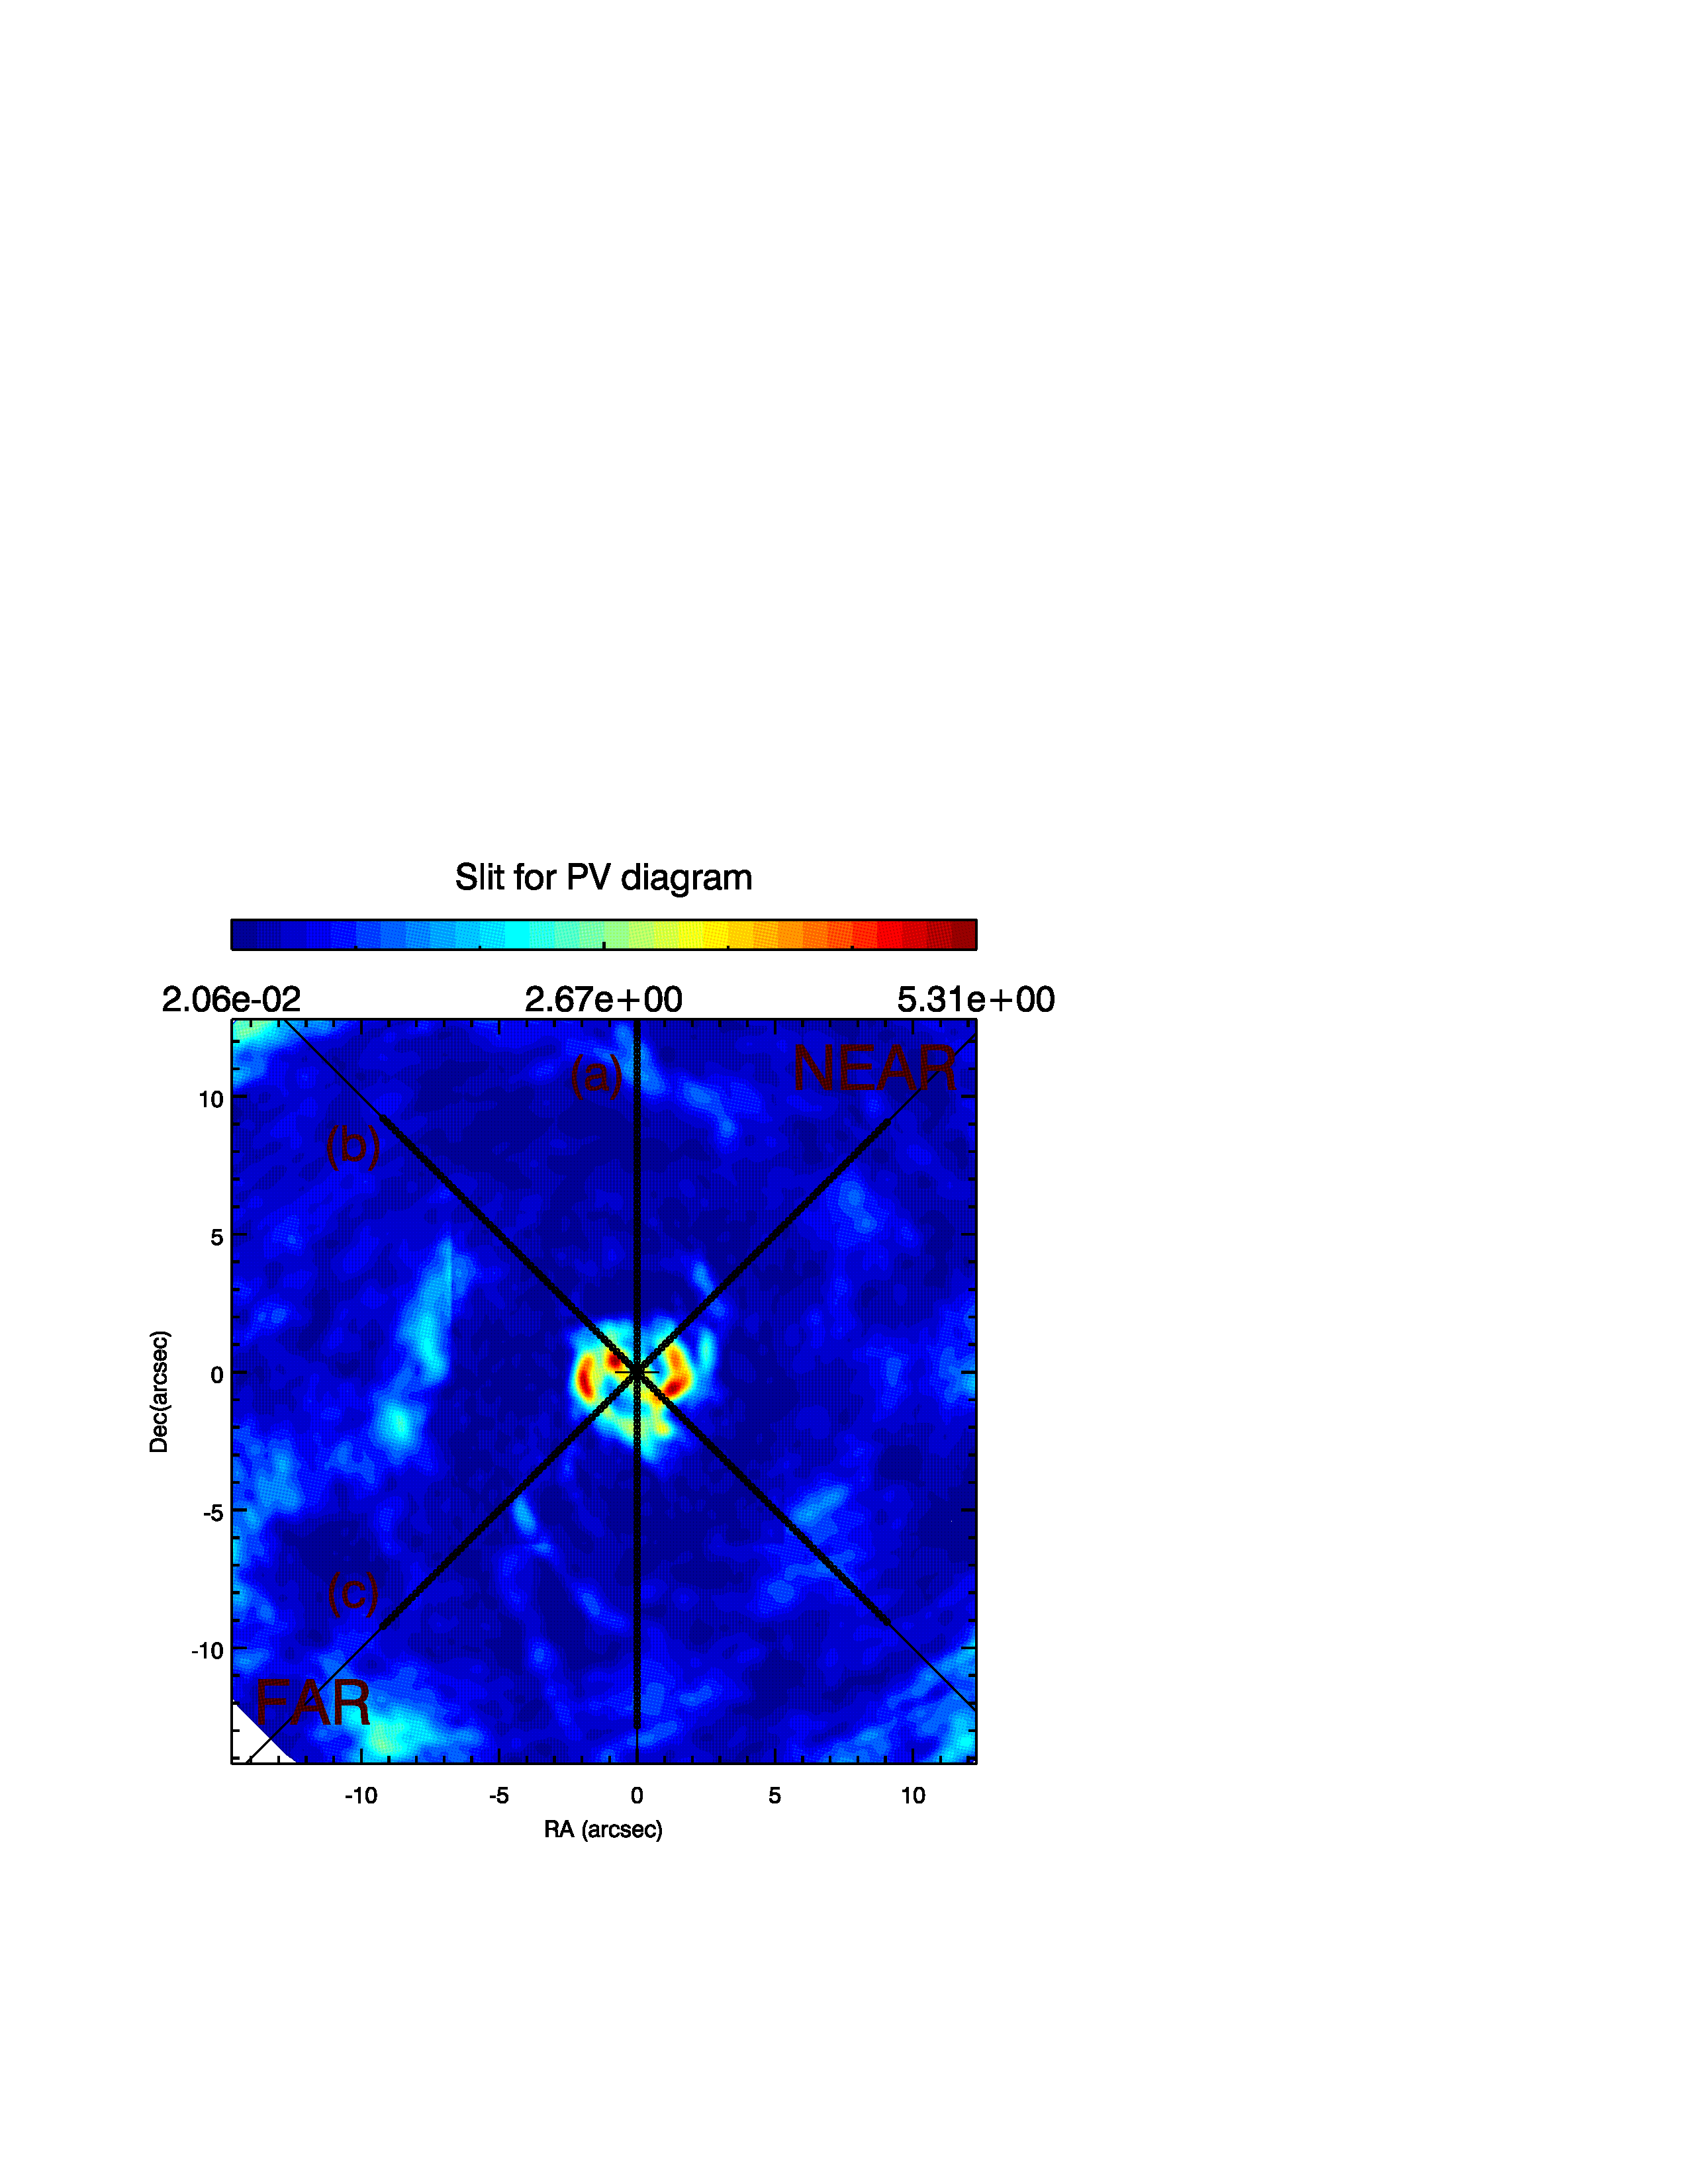
In this section we present position-velocity (pv) diagrams for the CO J:2-1 line. These pv diagrams were extracted from the ALMA datacubes using a slitwidth of 0.2″; they are thus limited in spatial resolution by the intrinsic resolution of the images (04). Fig. 9 shows the pv diagrams along the major axis, minor axis, the large scale bar, and other relevant PAs including PA=115° (20° from the minor axis) for a direct comparison with the pv diagram of CO and H in Fig. 3 of Agüero et al. (2004). In their figure, the ‘Blueshifted Knot’ which they interpret as inflow motion is clearly seen in our CO J:2-1 pv diagram.
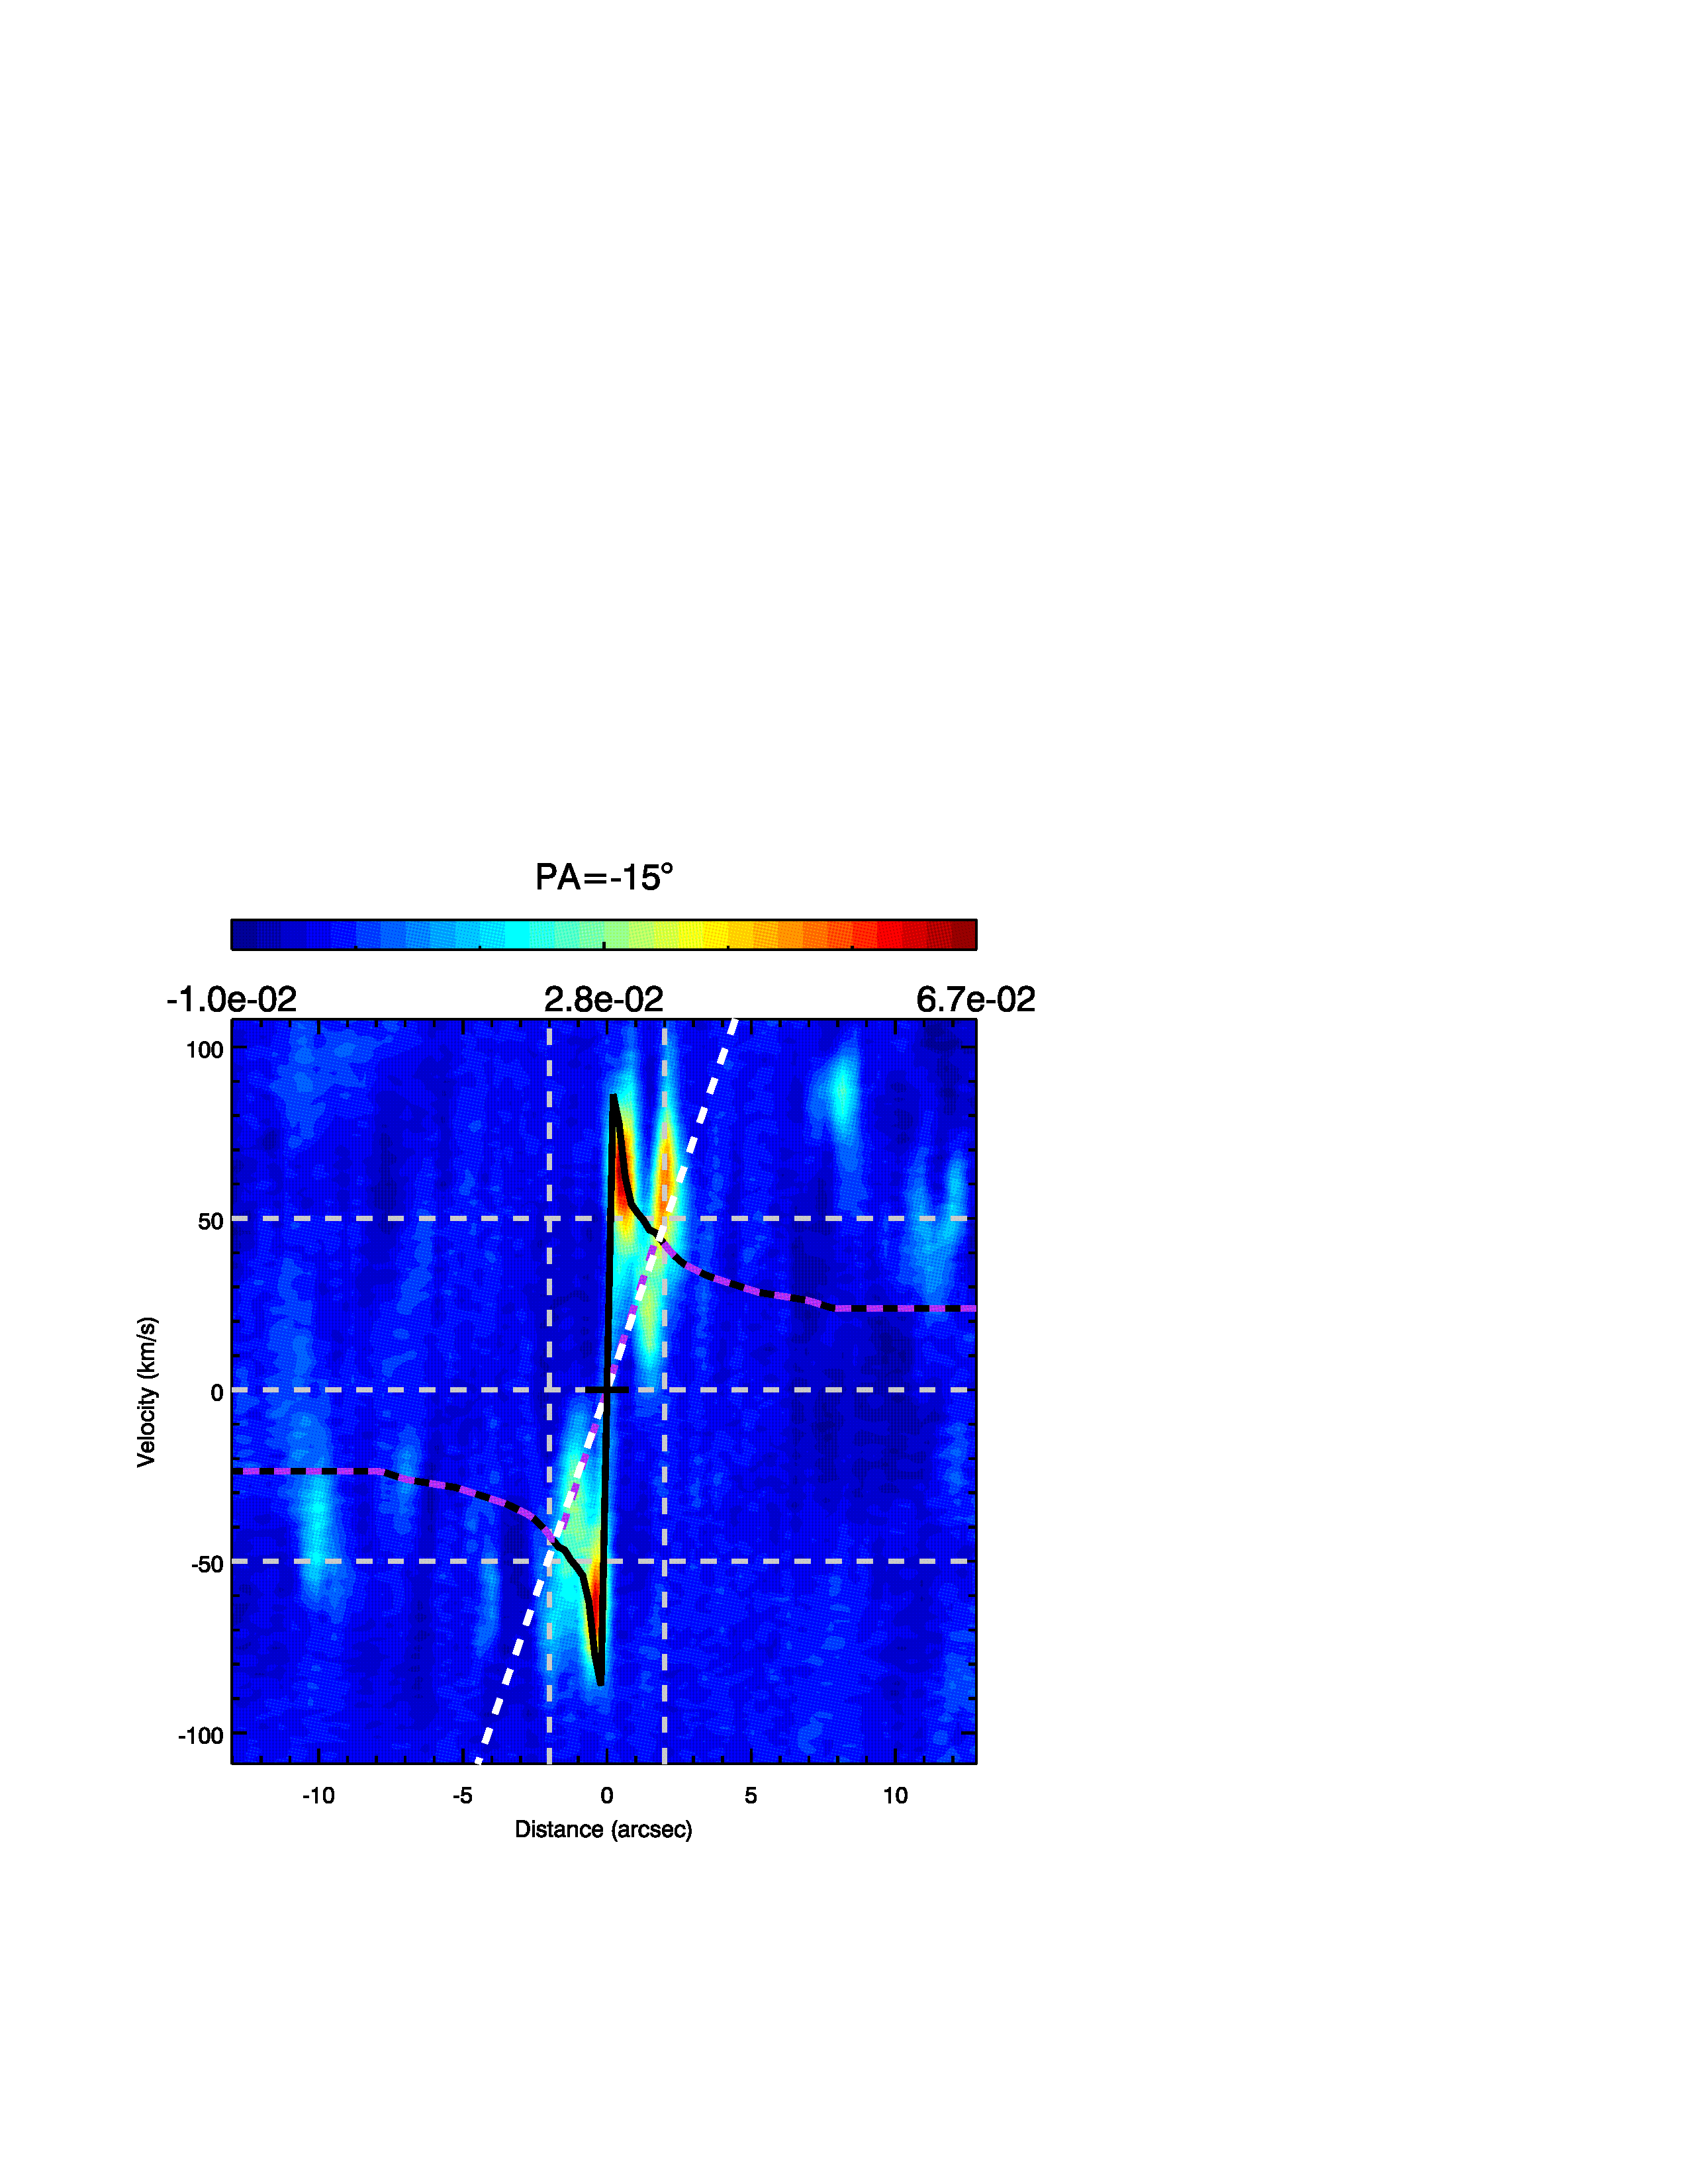
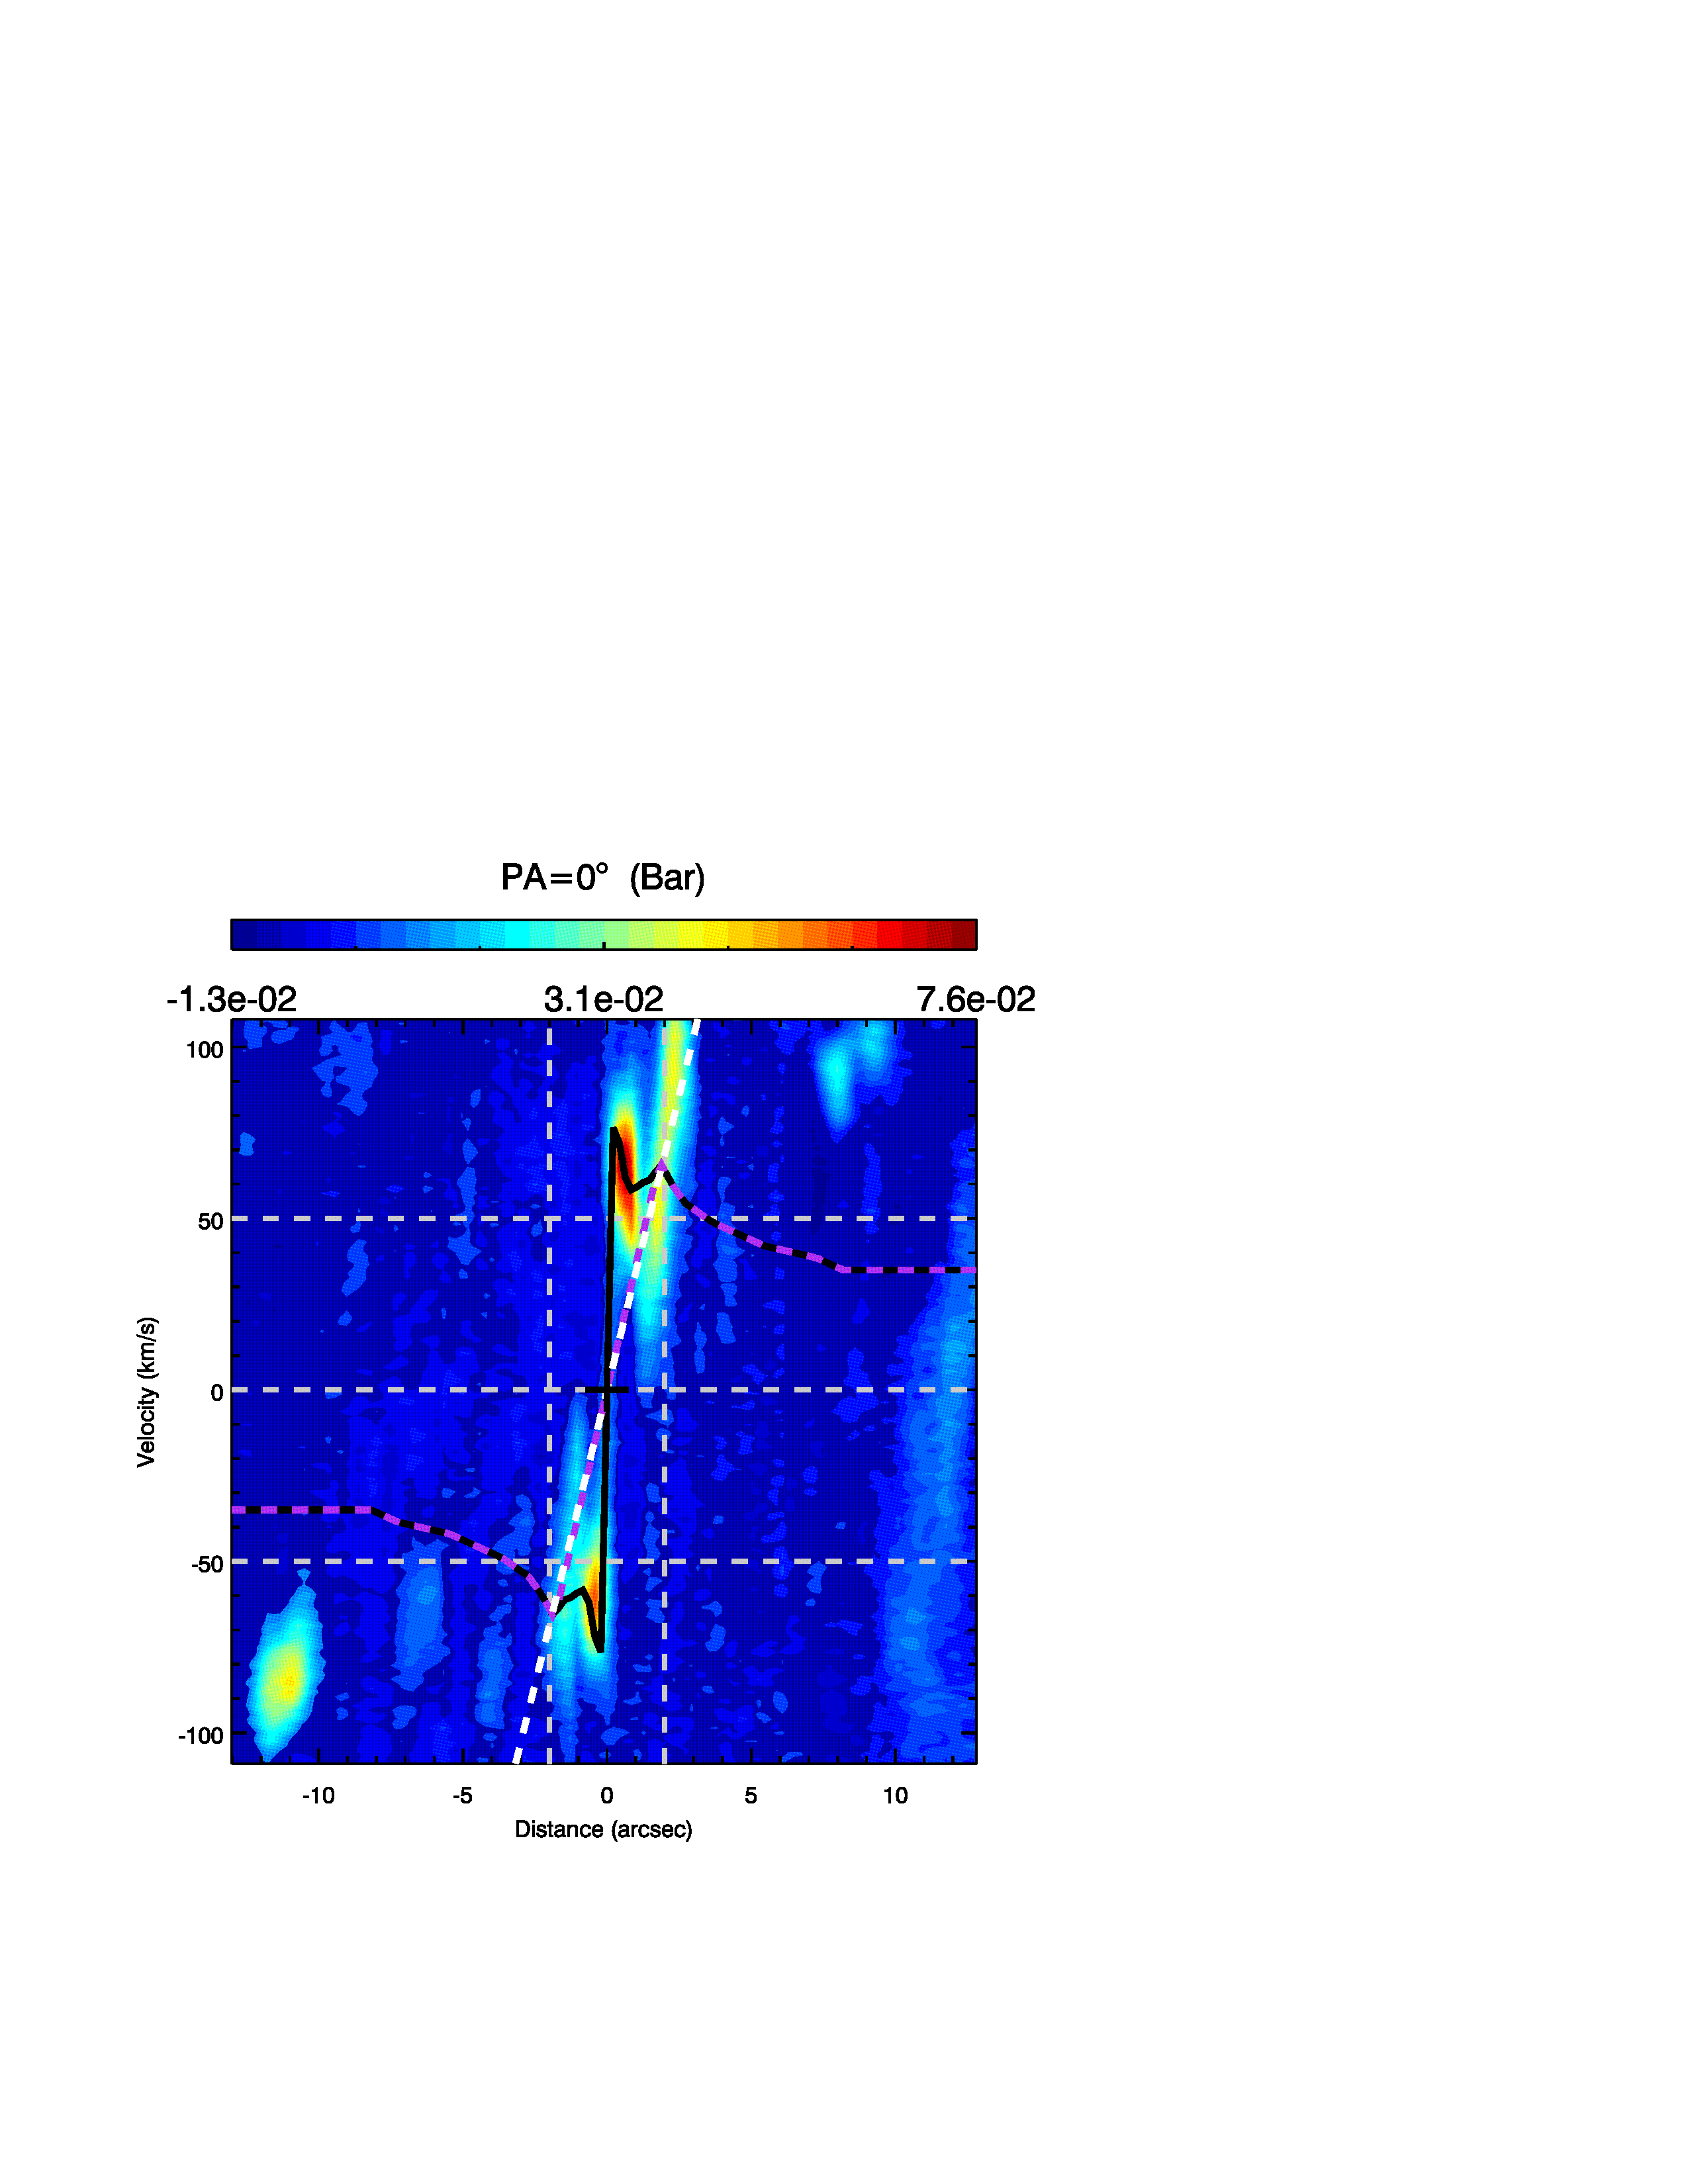
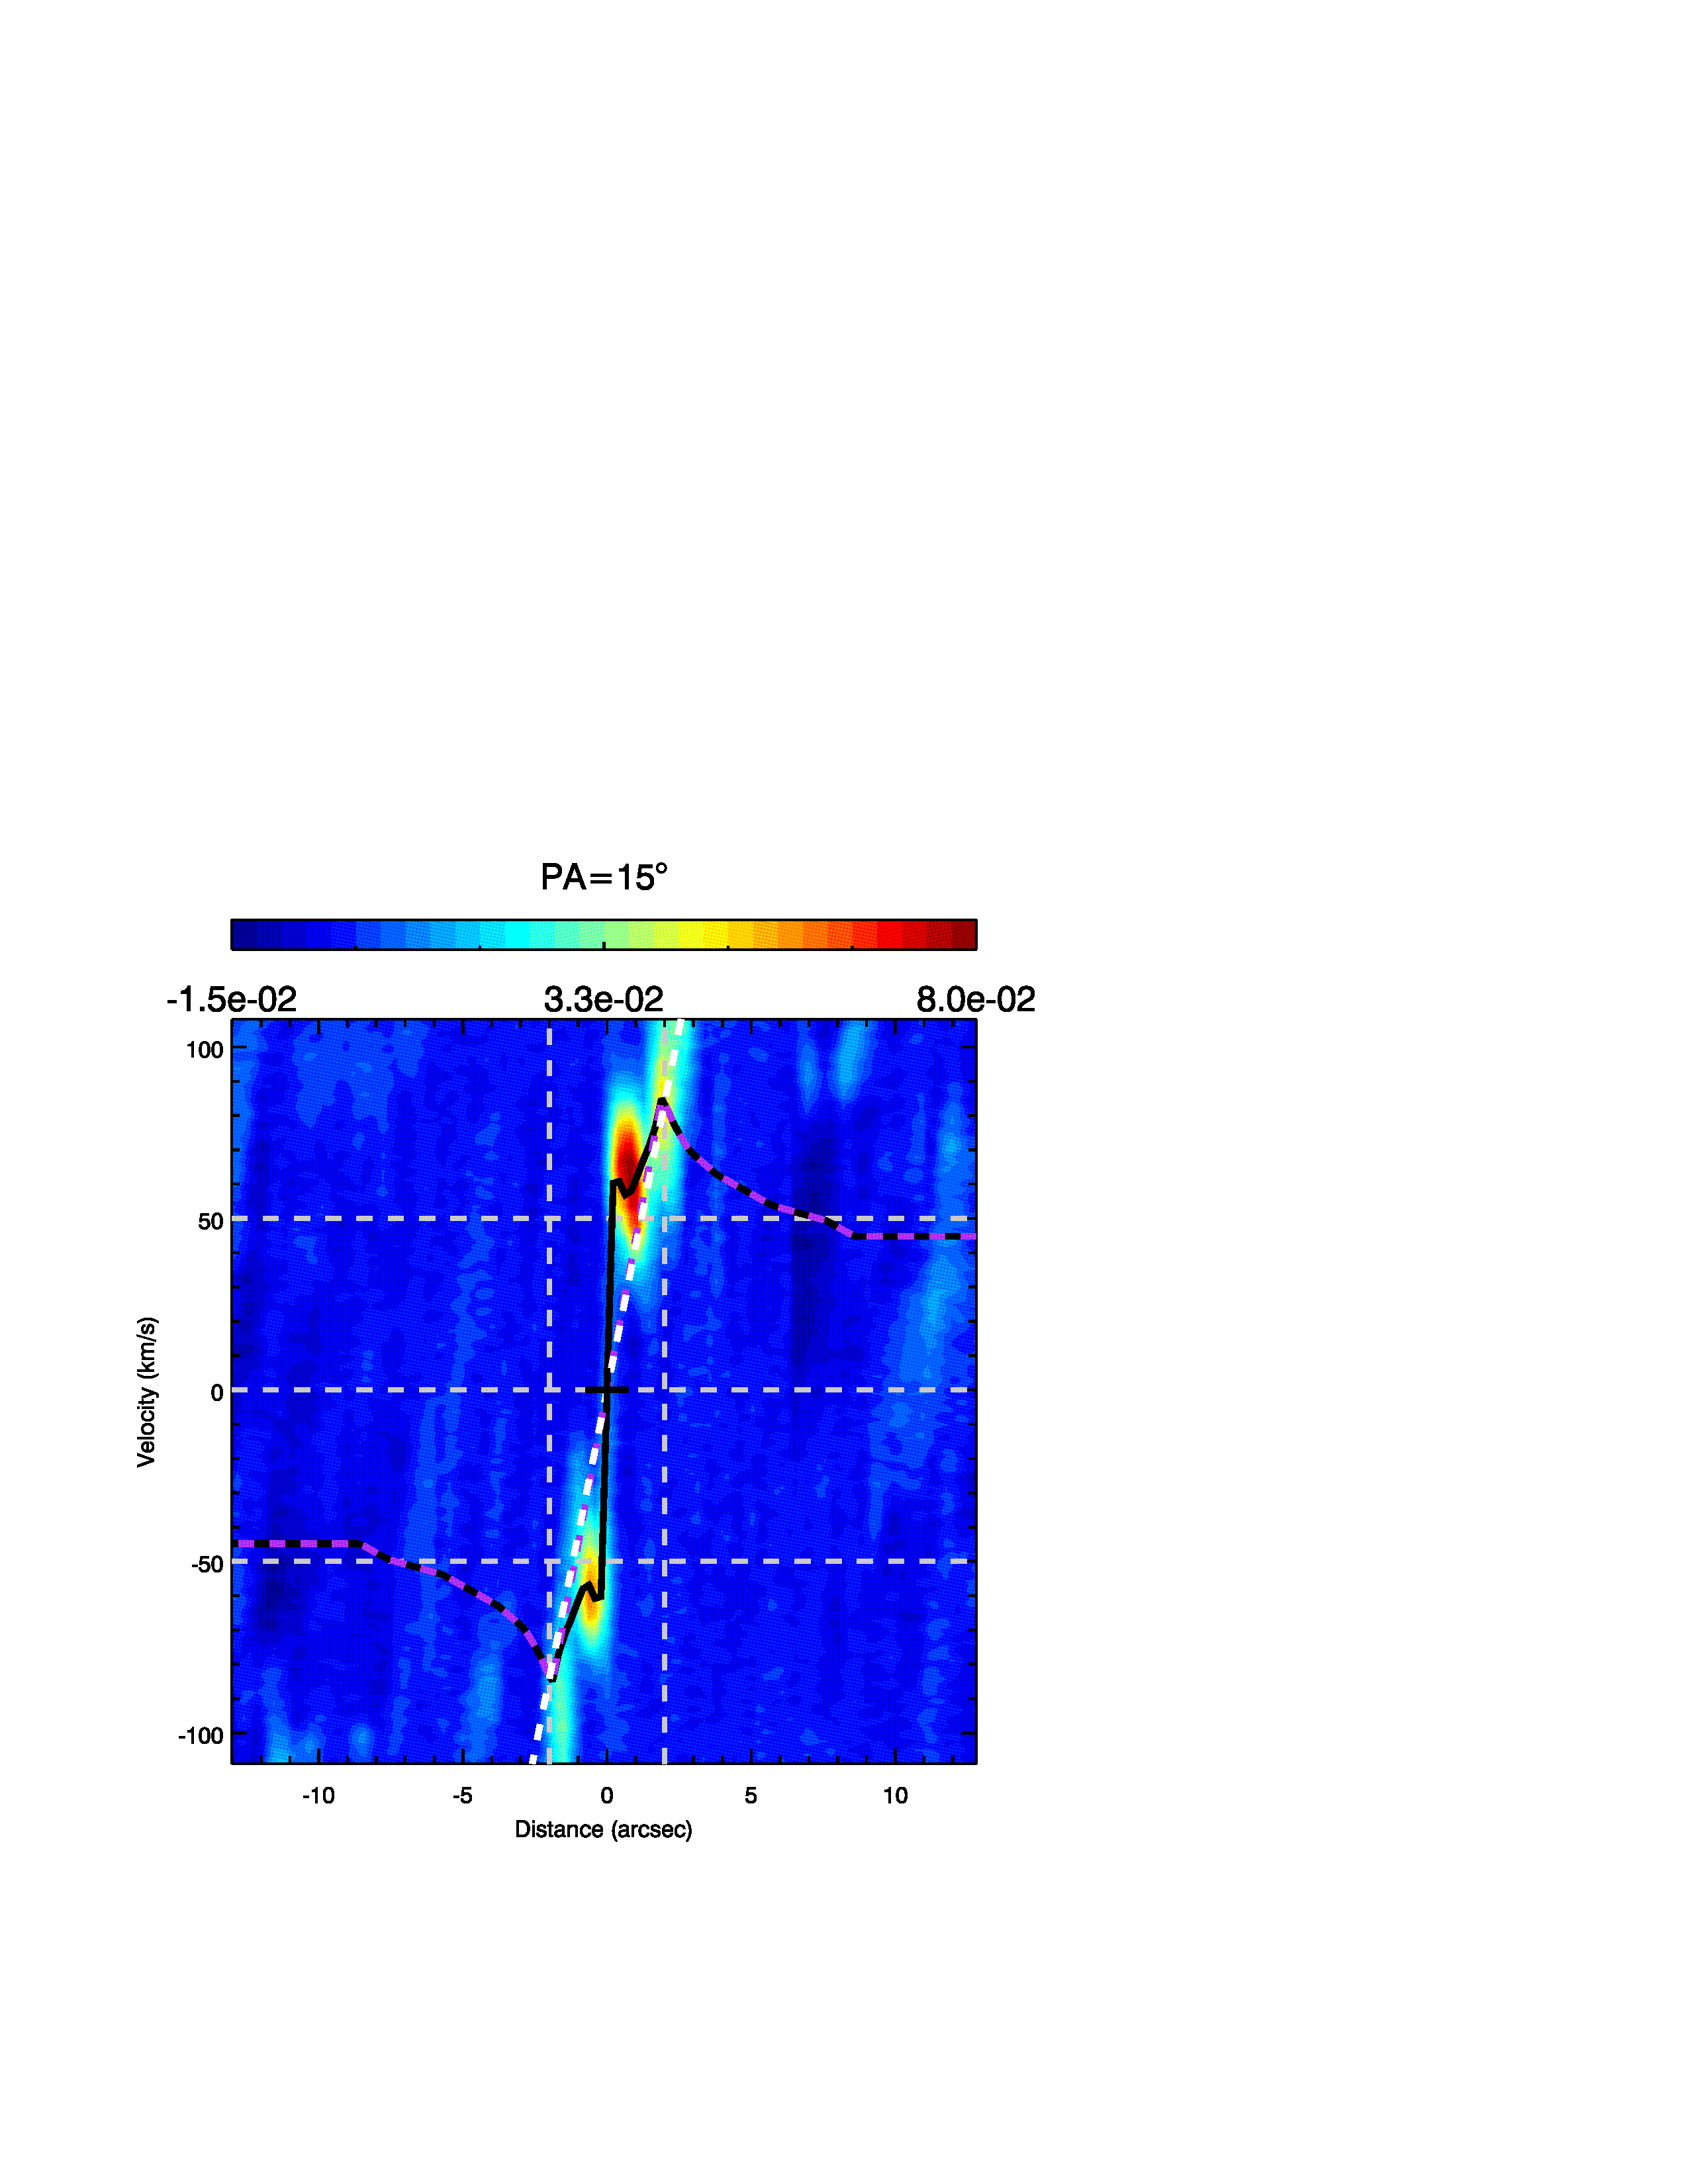
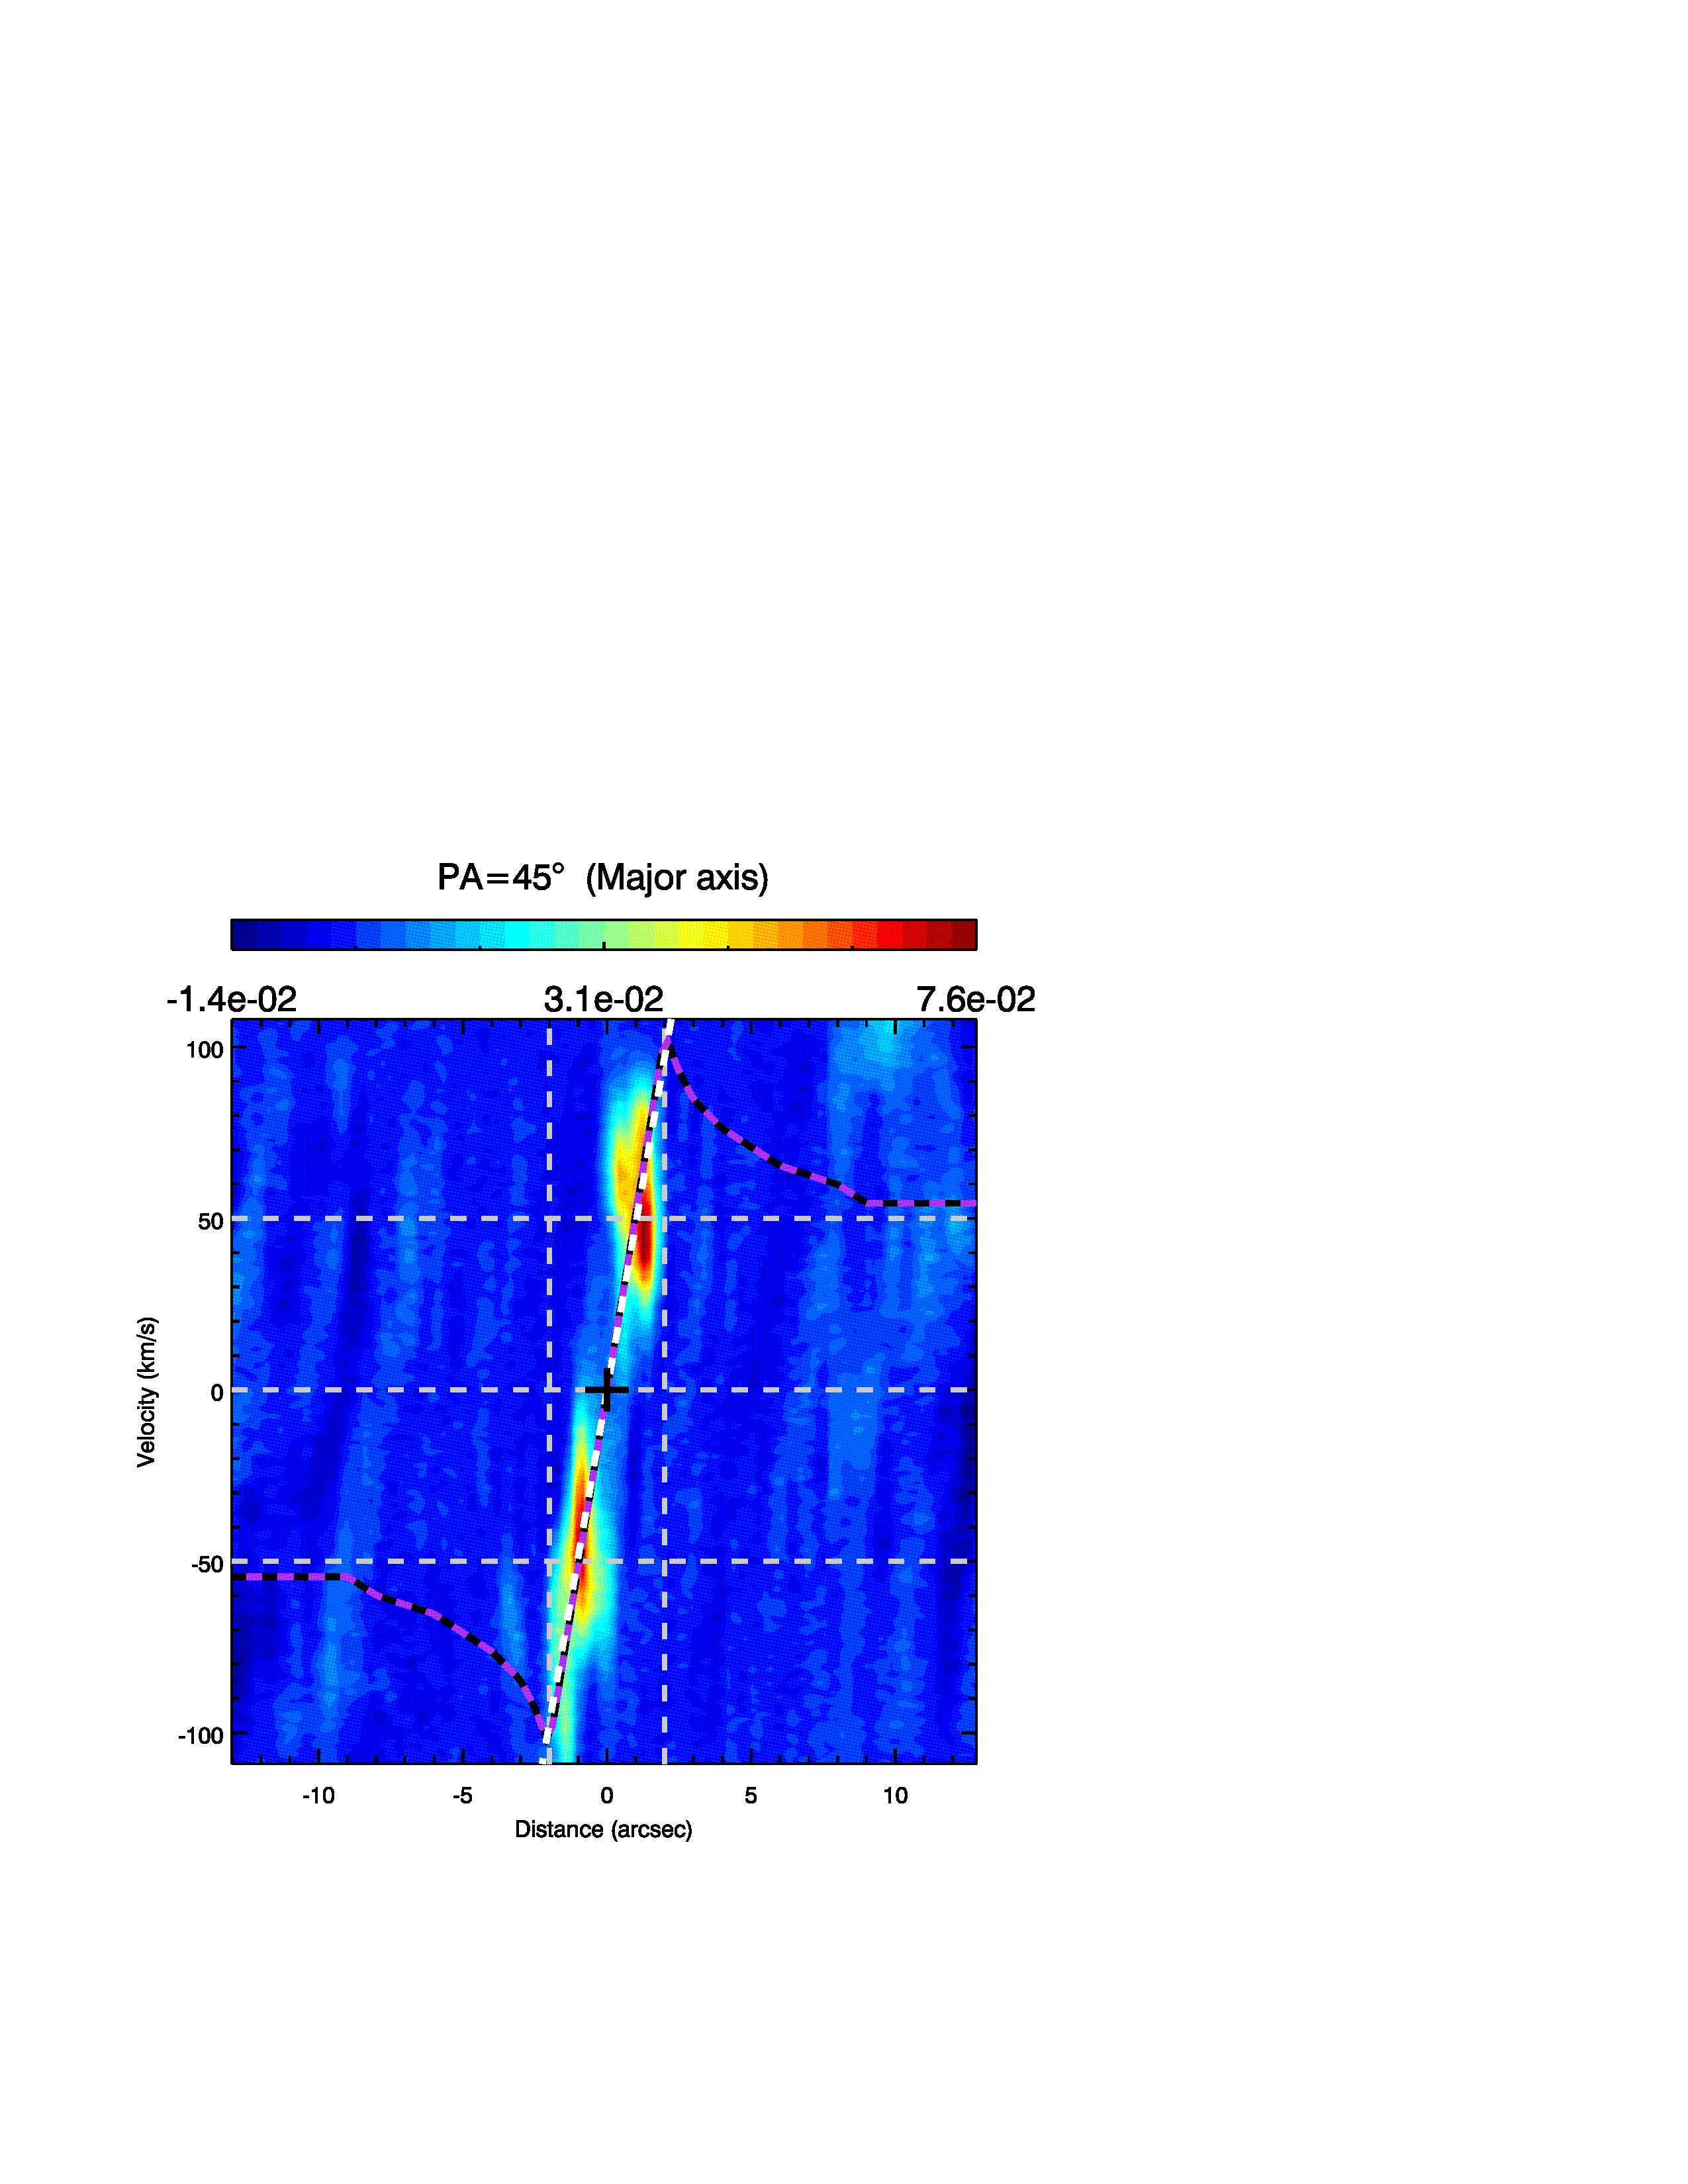
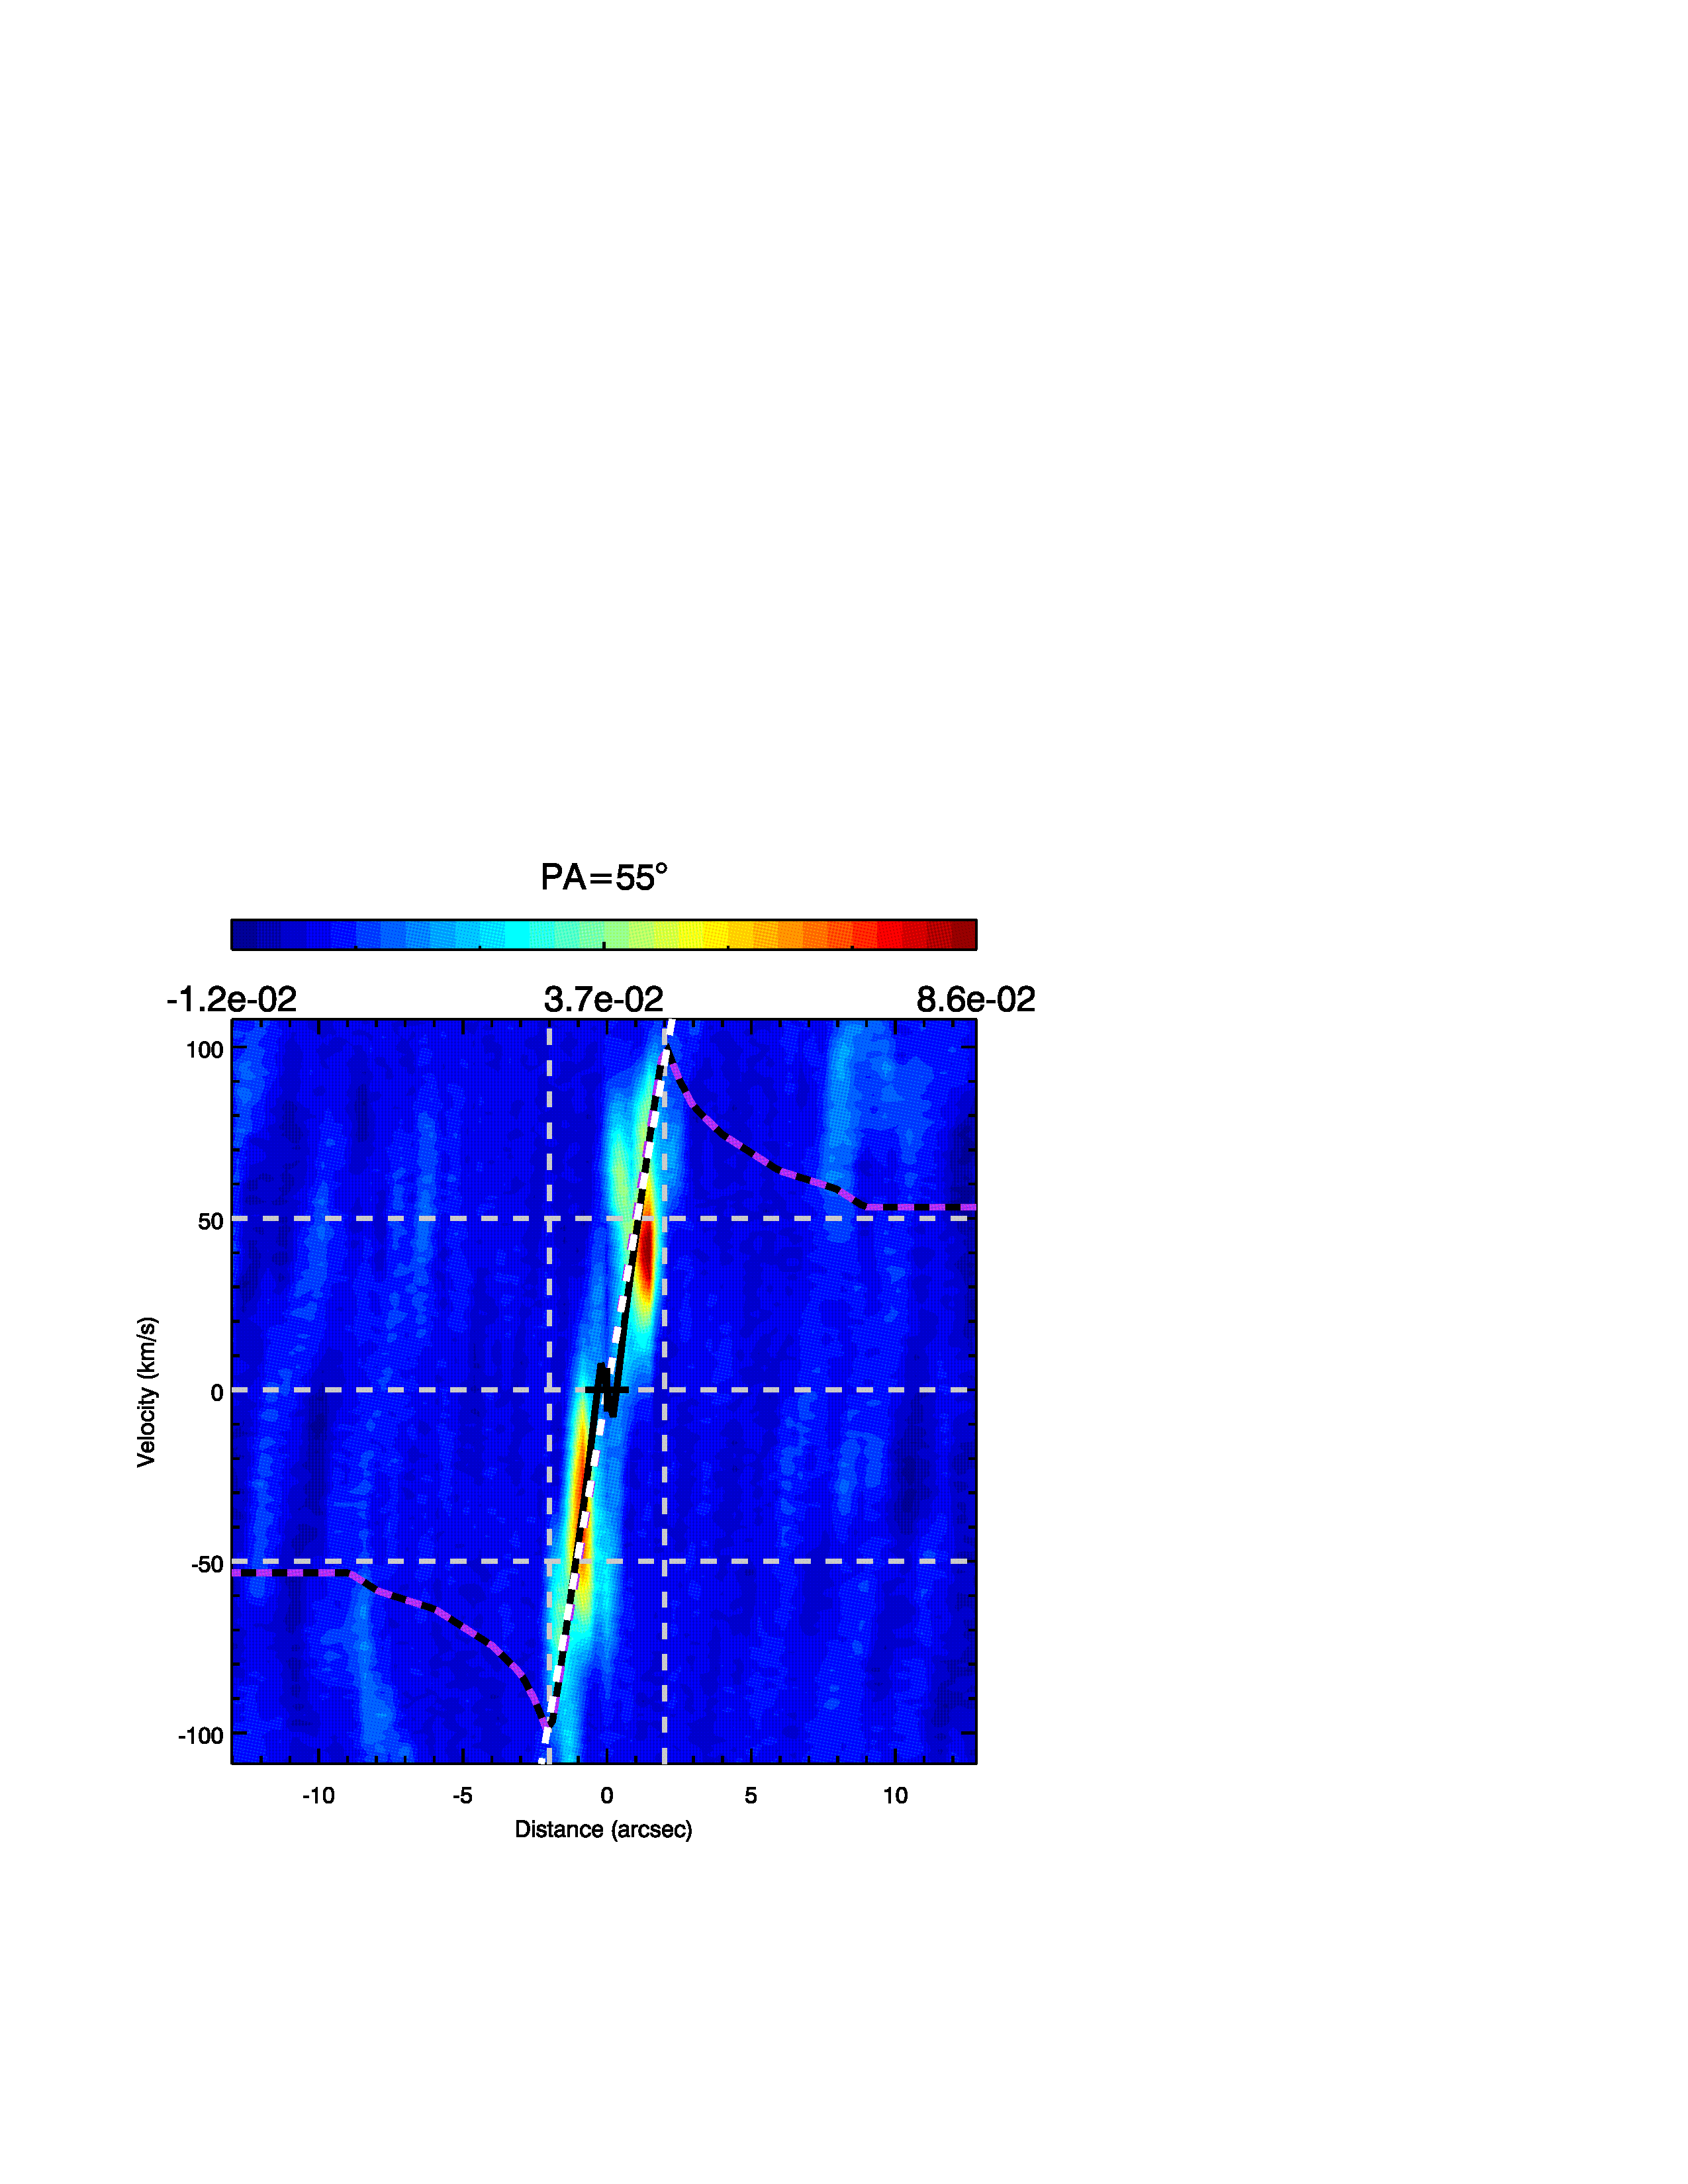
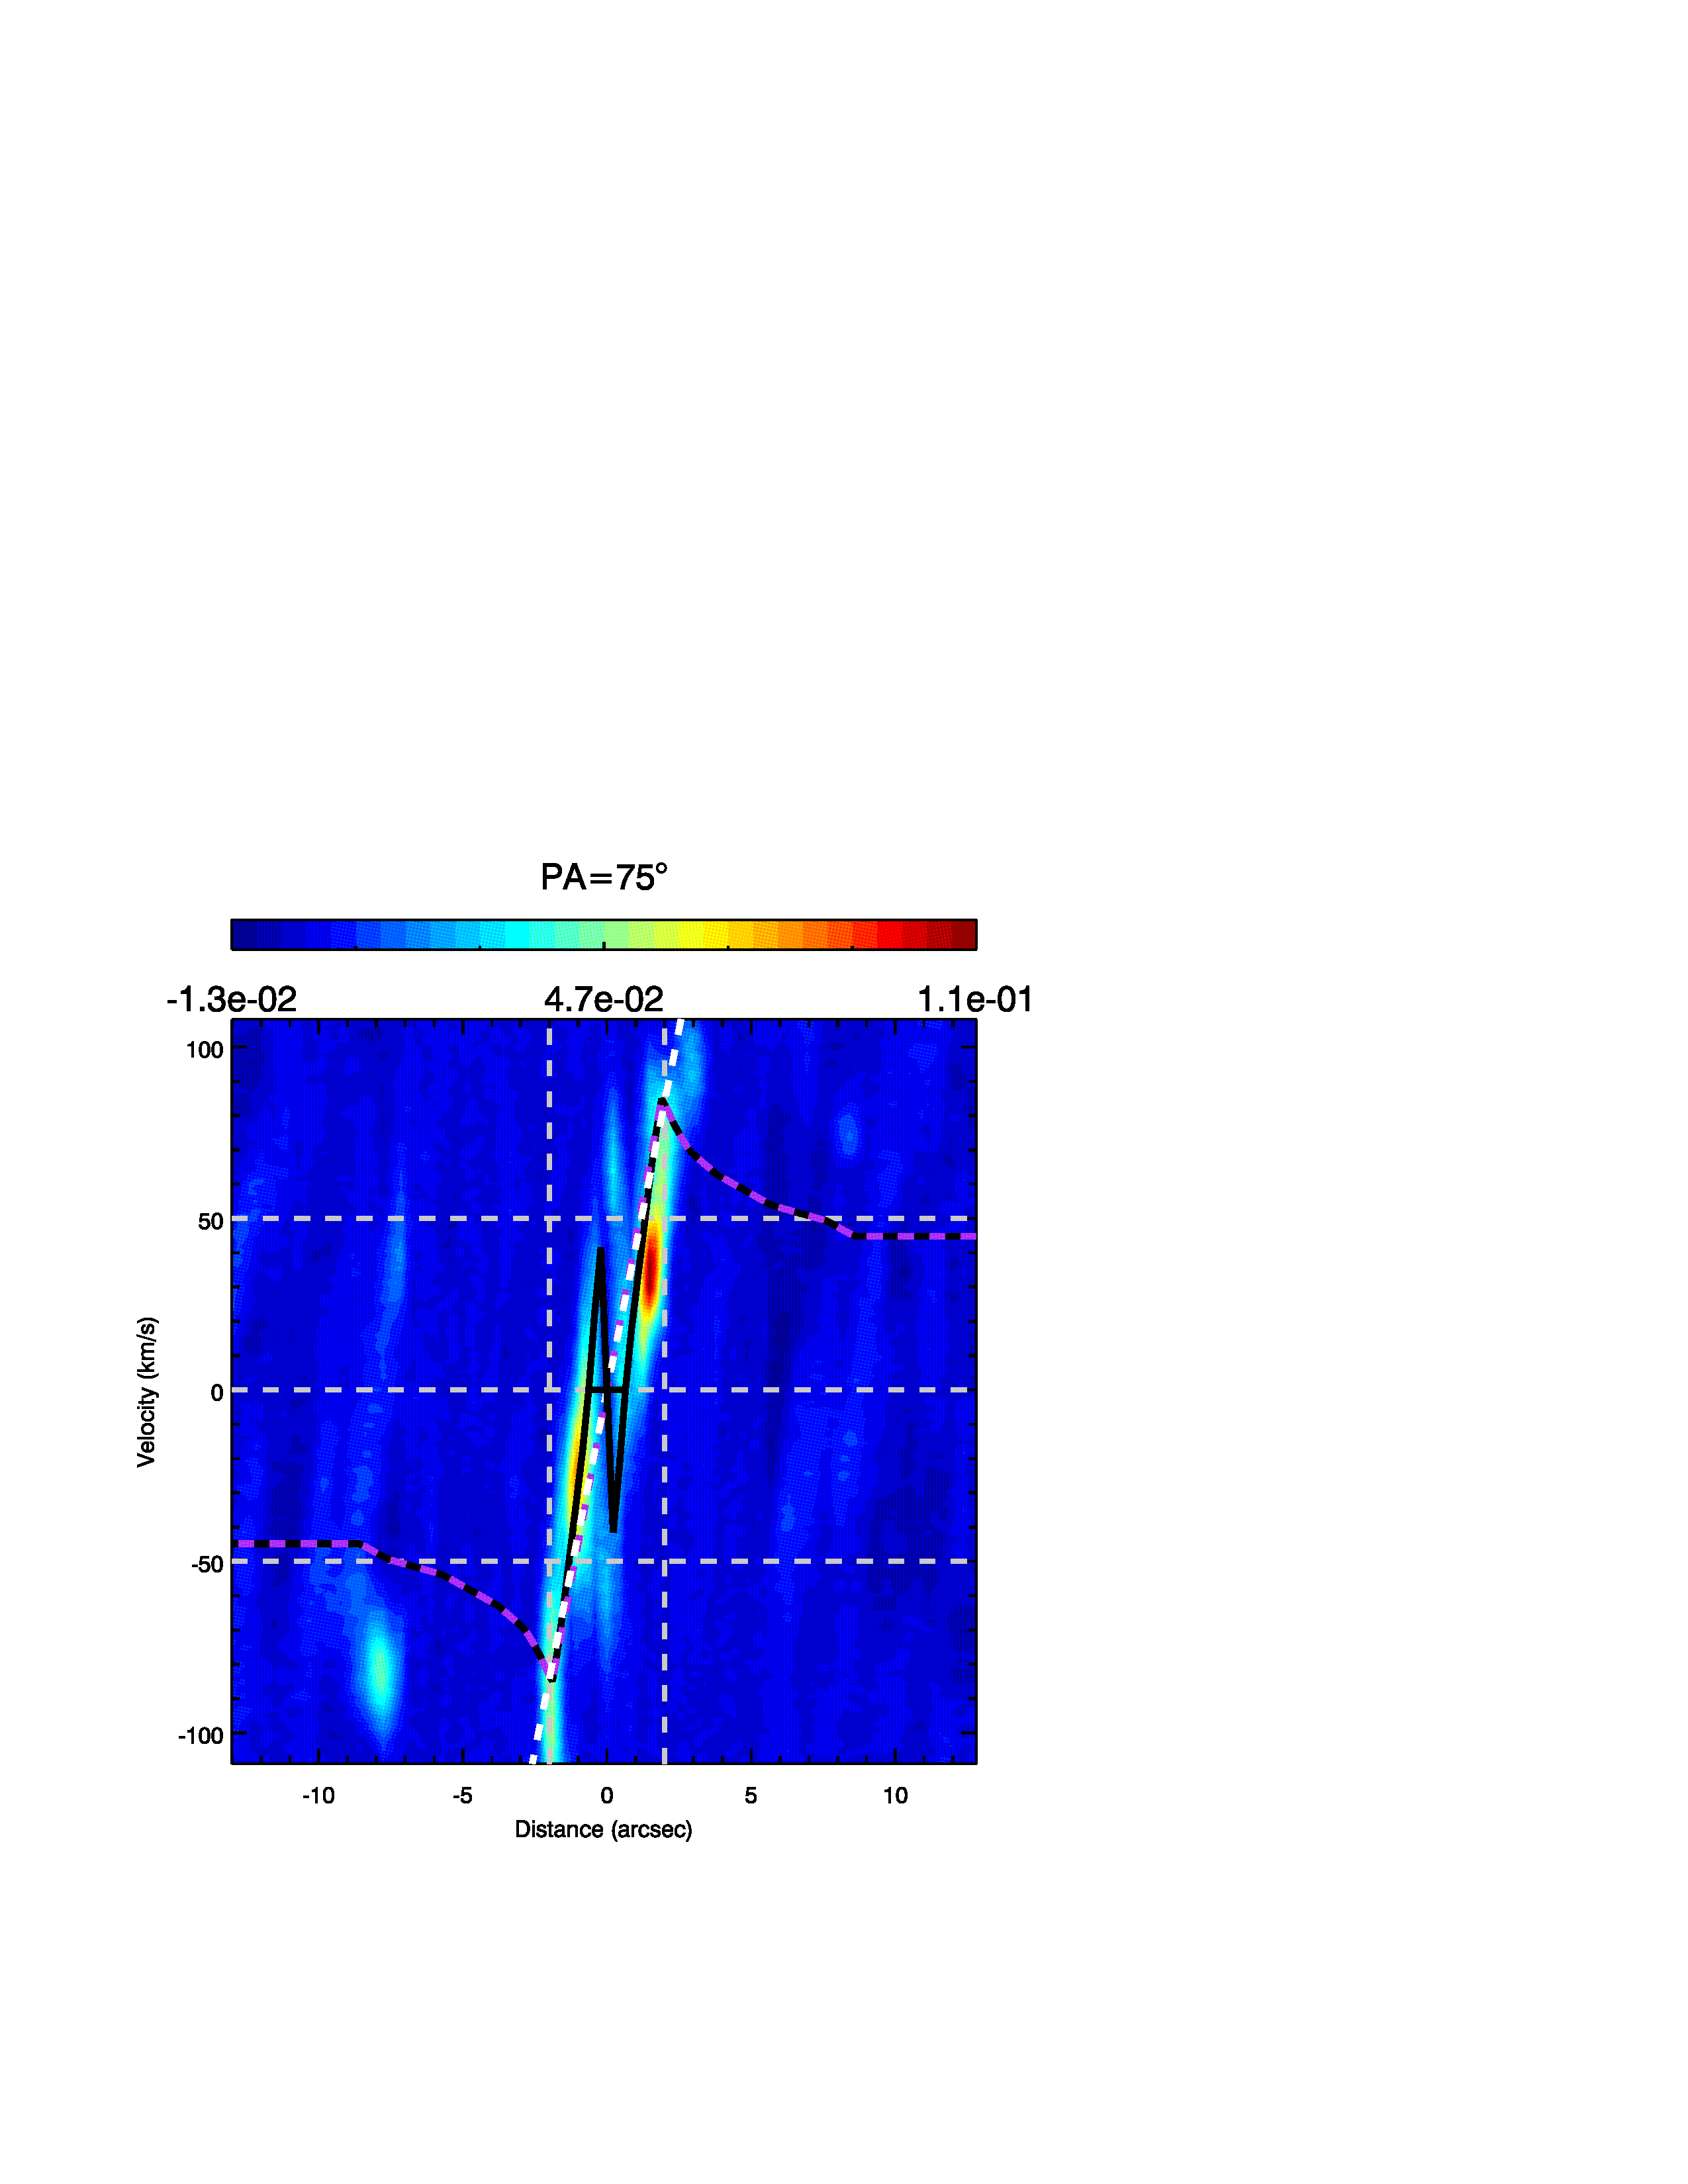

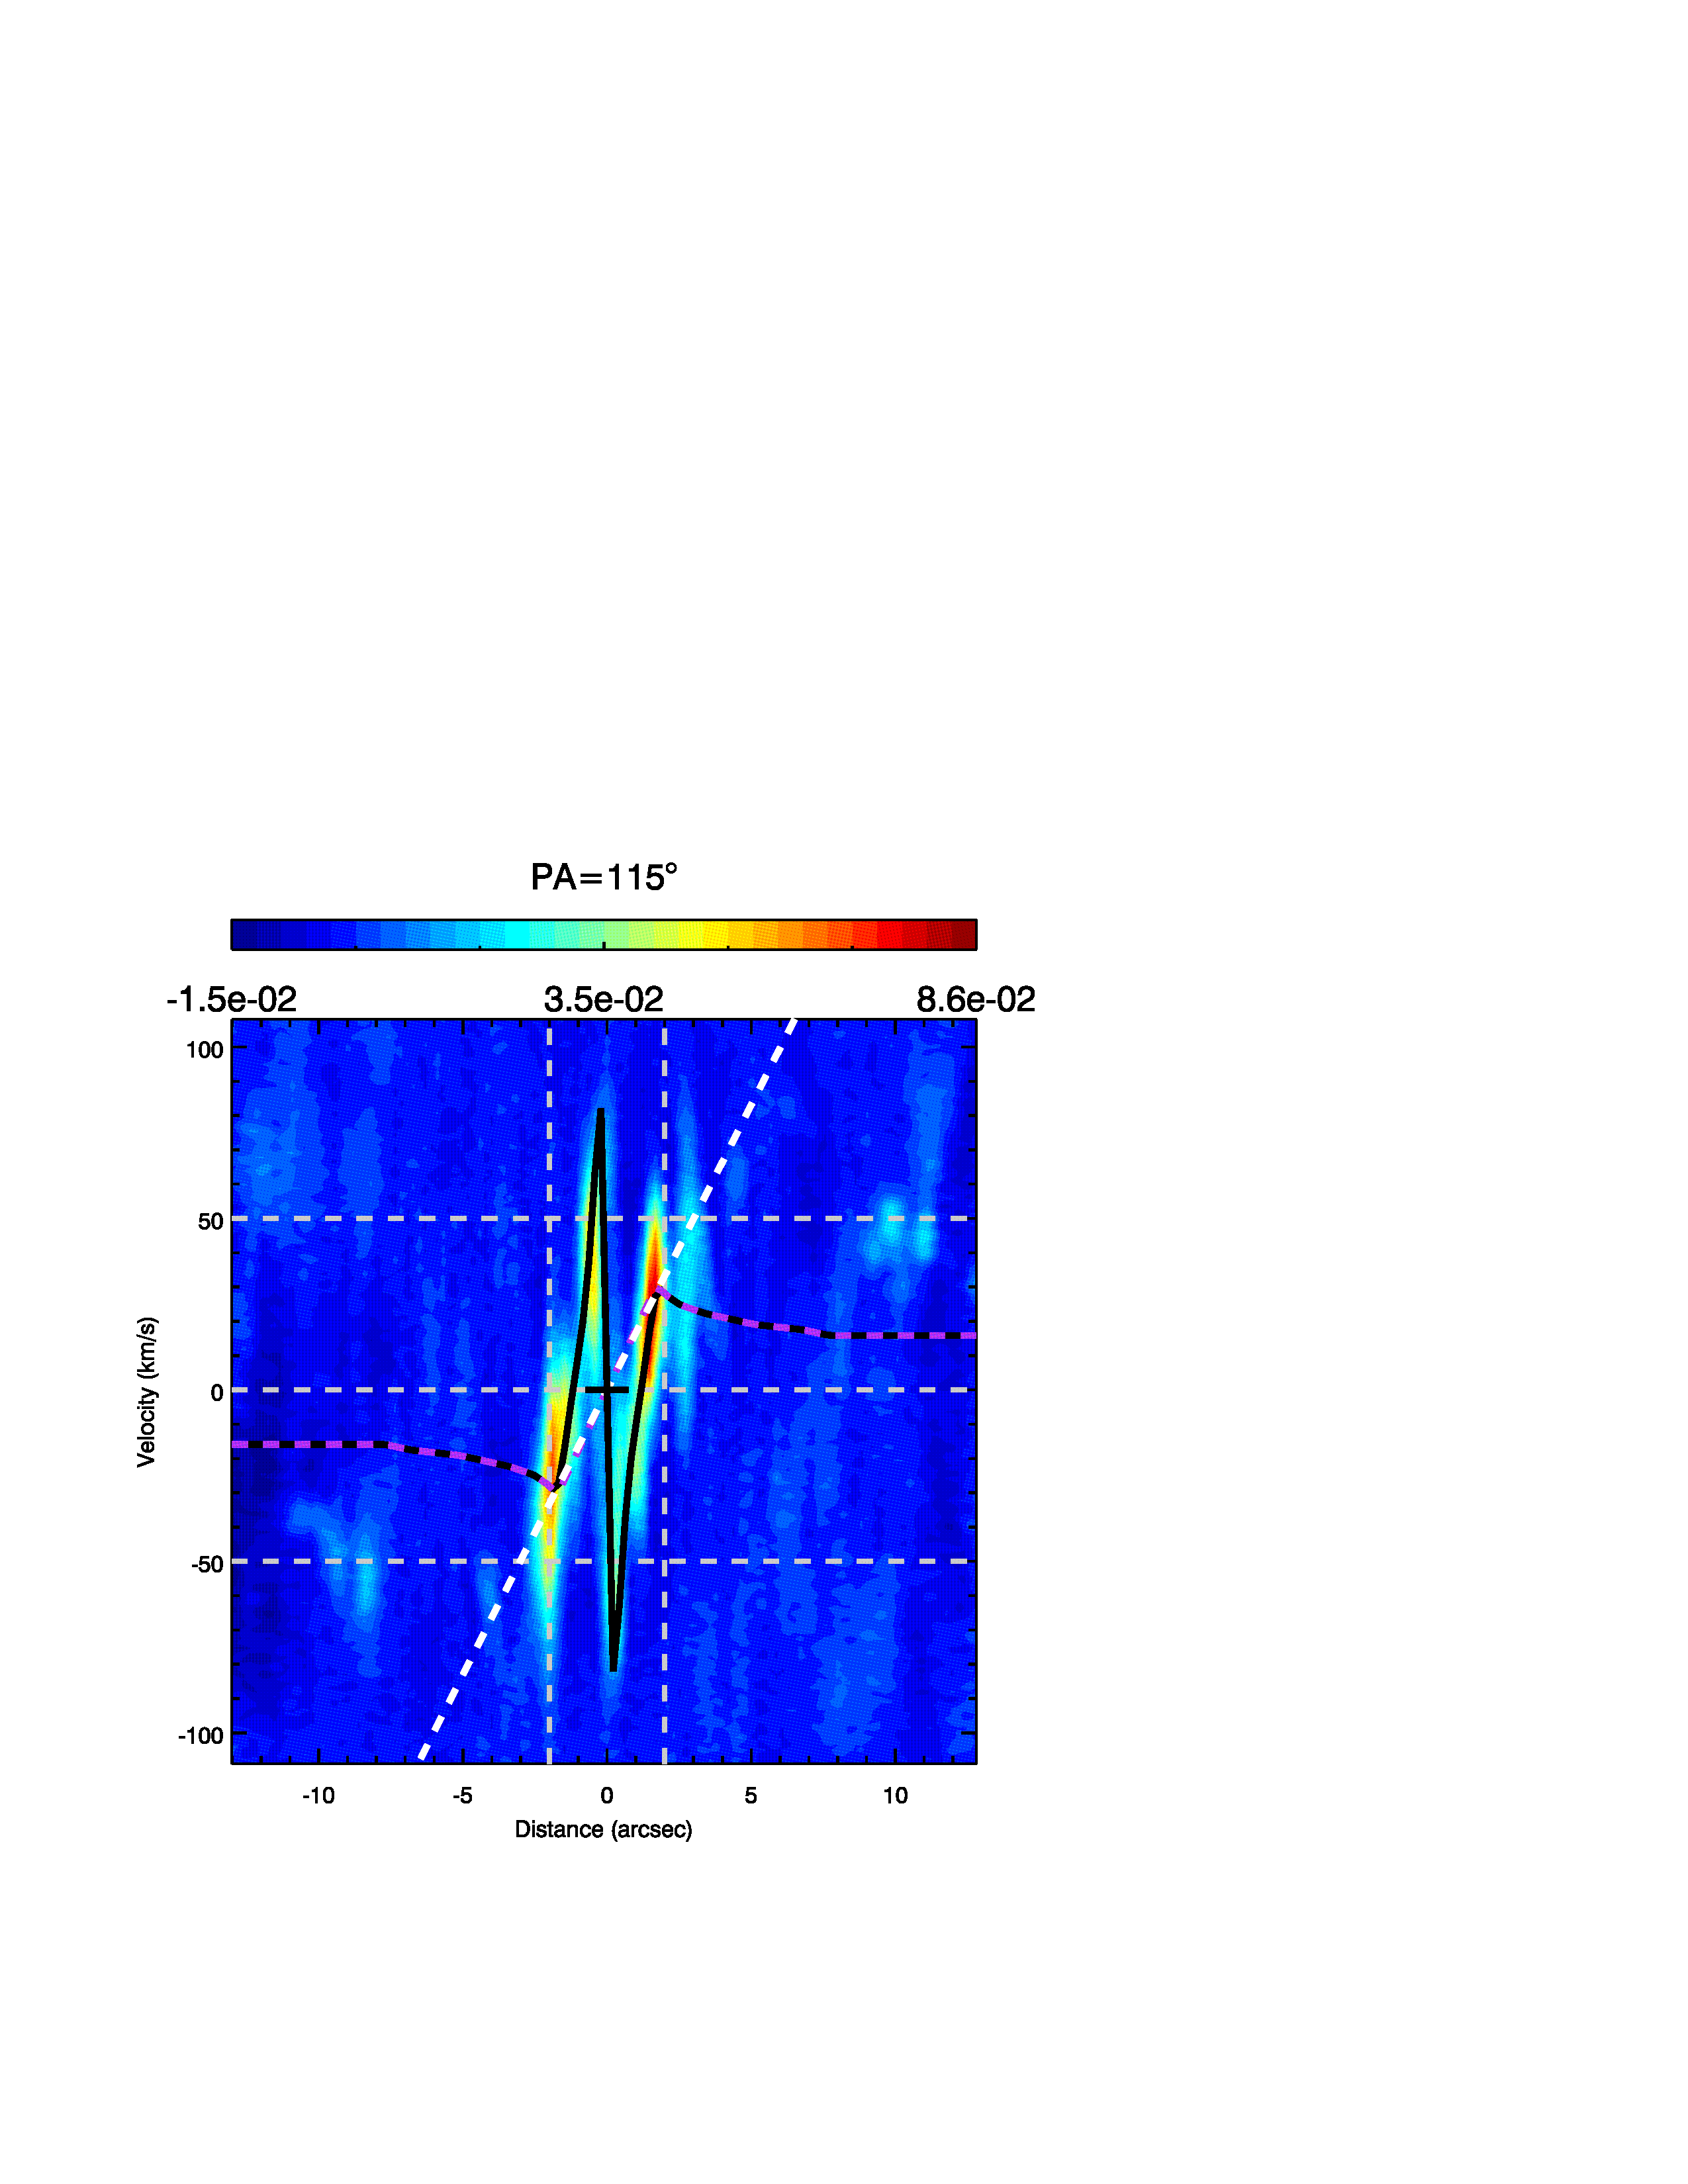
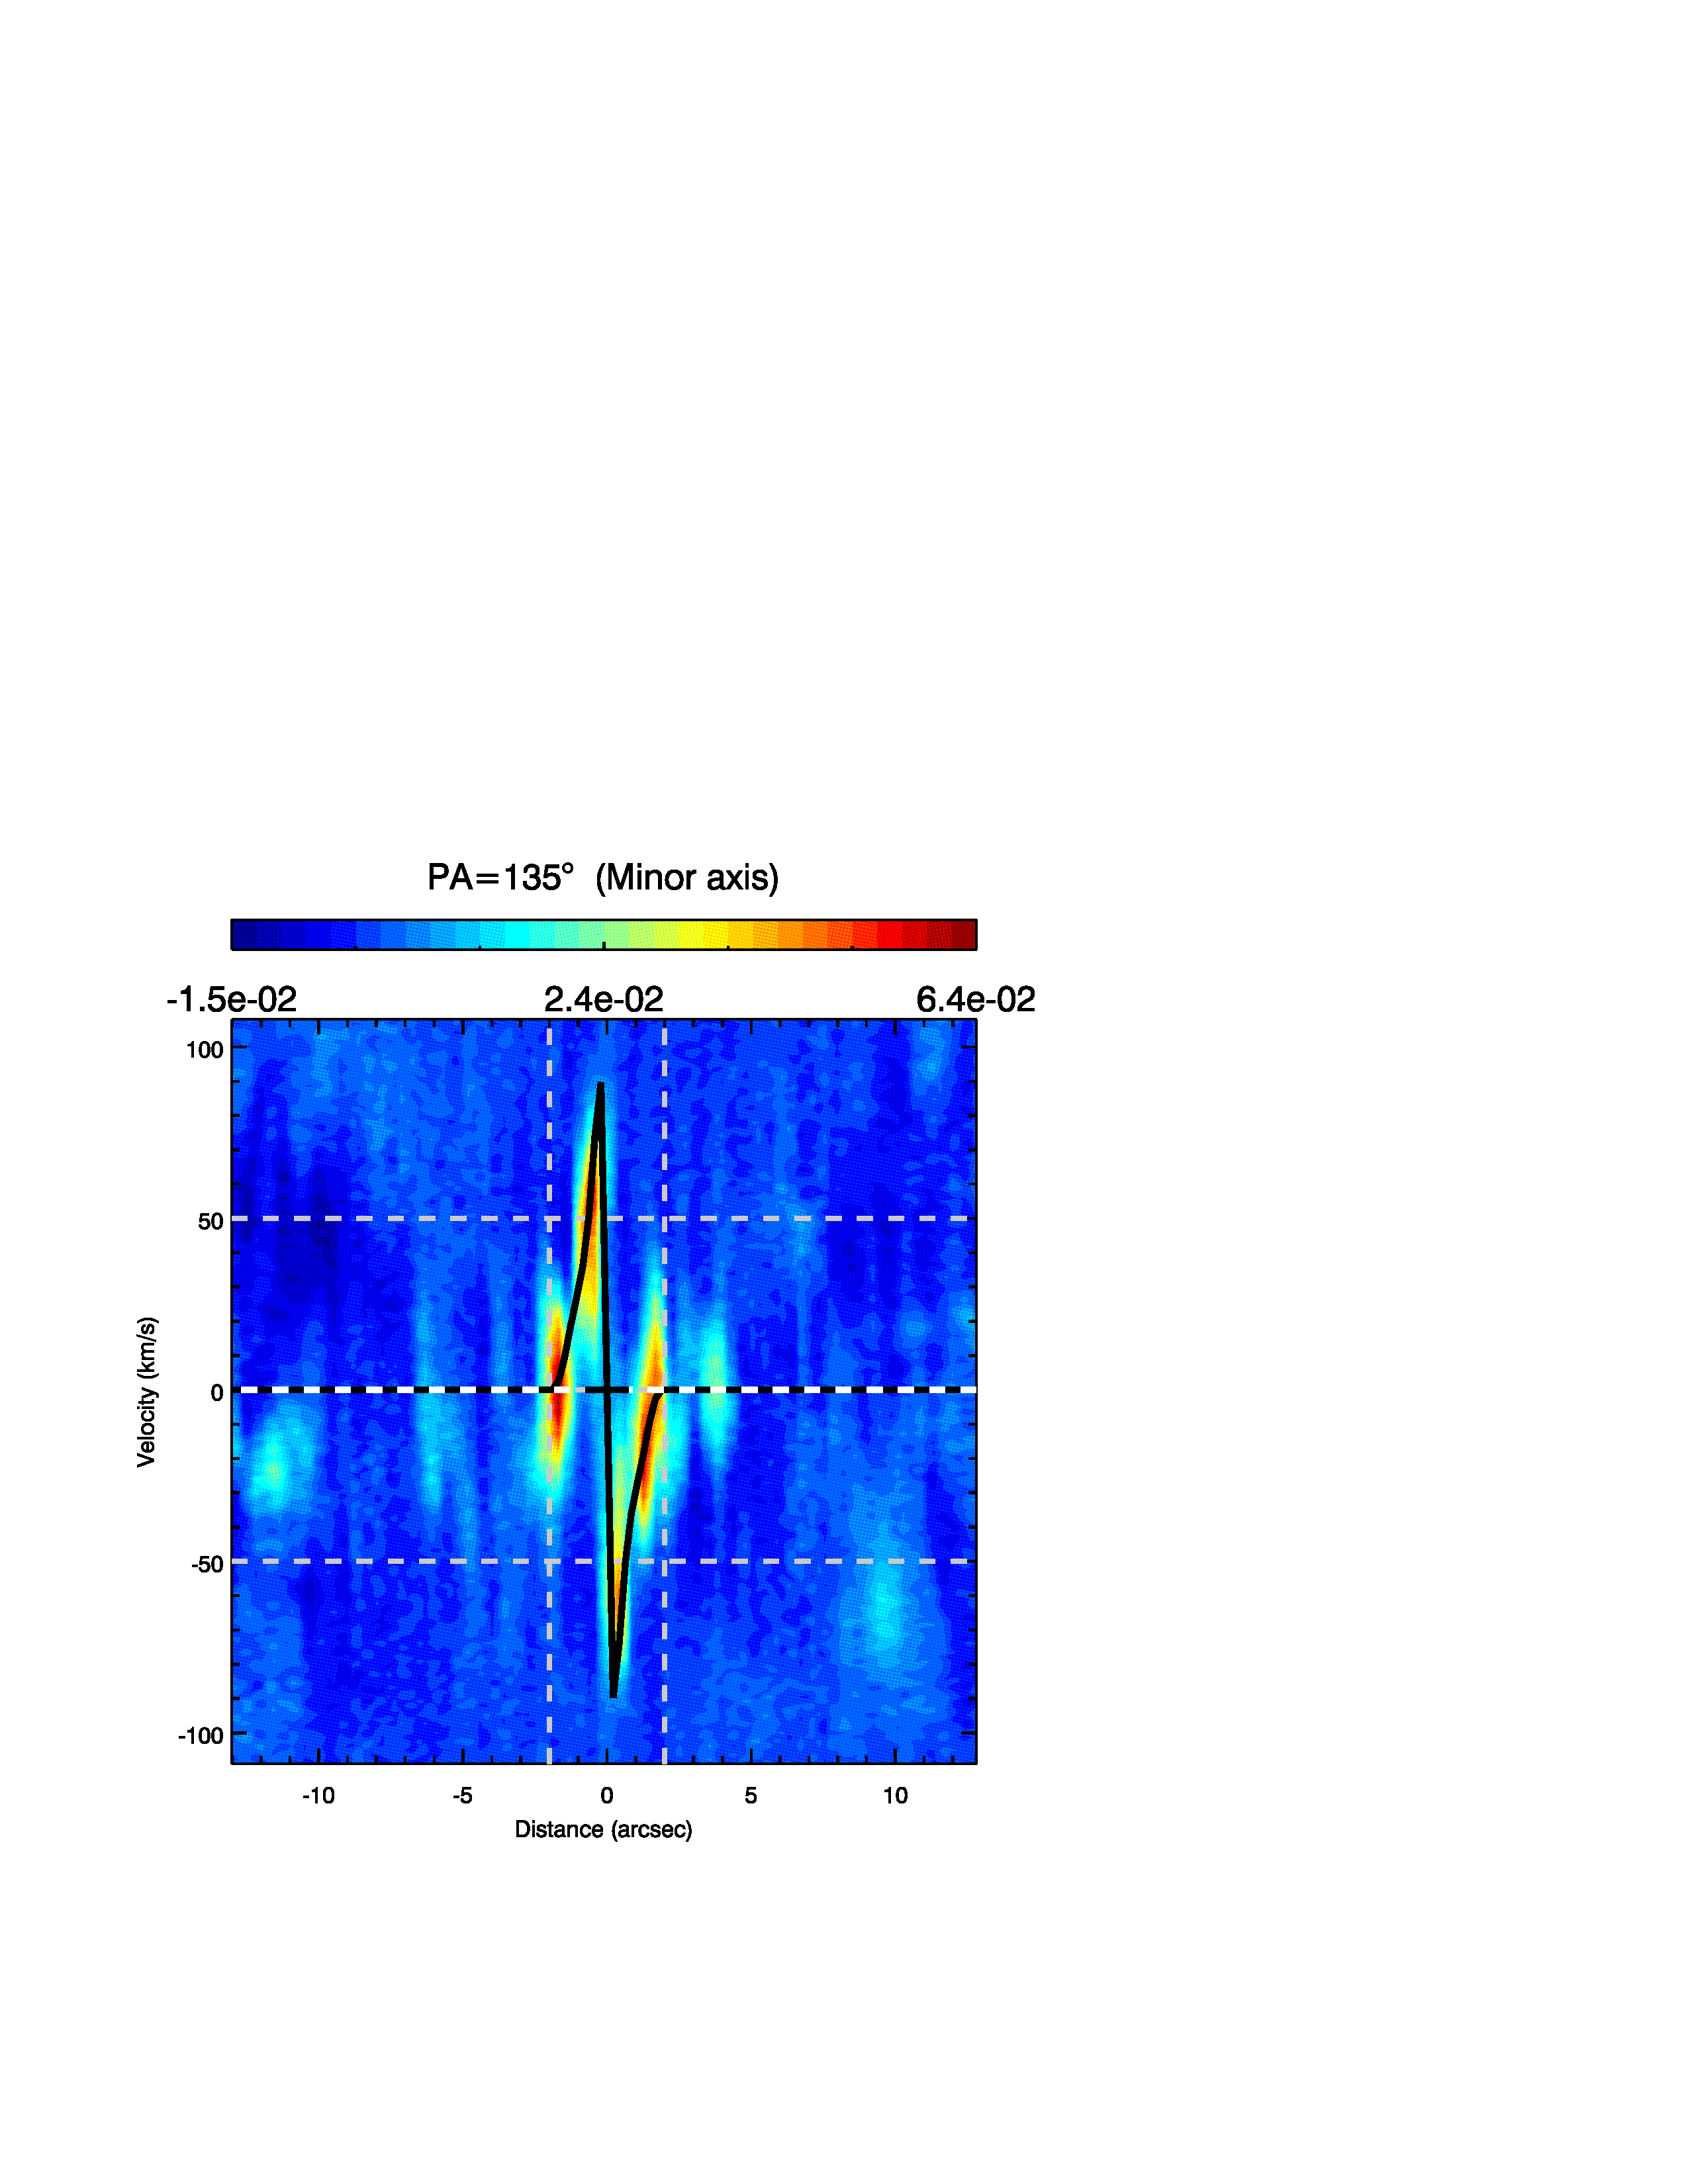
In each pv diagram we have overlaid the predictions of solid body rotation (white dashed line), the ModC2014 model (purple dashed line), and the sum of the ModC2014 model with our outflow model (solid black line). The solid body rotation and ModC2014 are essentially the same over the inner 3 arcsec, after which the latter flattens in velocity. Our outflow model was derived as follows: we used the pv diagram along the minor axis (bottom right panel of Fig. 9) to measure the radial velocity of the brightest CO emission at a given distance from the nucleus on both the NW (positive offsets in the pv diagram) and SE sides. The absolute values of these velocities as a function of distance from the nucleus were then interpolated and deprojected (assuming that the outflow is in the disk) to construct a function of outflow velocity vs. position. As seen in the bottom right panel of Fig. 9 the redshifted ‘outflow’ velocities provided more constraints closest to the nucleus and the blueshifted velocities provided better constraints at slightly larger distances. The final outflow model starts with outflow velocities in the disk of 157 km s-1 at the (unresolved) nucleus and decreases monotonically to zero velocity 2″ from the nucleus.
First concentrating on the pv diagram along the minor axis in Fig. 9, we see that the NW side of the minor axis shows a clear deceleration in velocities when going from 1″ to 2″ from the nucleus, while the SE side the bright emission at 1.5–2″ (the inner spiral arm) shows a larger velocity dispersion which does not clearly vary with distance. However, this SE side shows a clearer decrease in velocities between 0 and 1″. A similar scenario has been reported in NGC 1068 for both hot and cold molecular gas (Barbosa et al., 2014; García-Burillo et al., 2014, respectively); outflowing nuclear molecular gas, with outflow velocity decelerating from 200 km s-1 to 0, accumulates in an off-centered ring 100 pc from the nucleus (Barbosa et al., 2014).
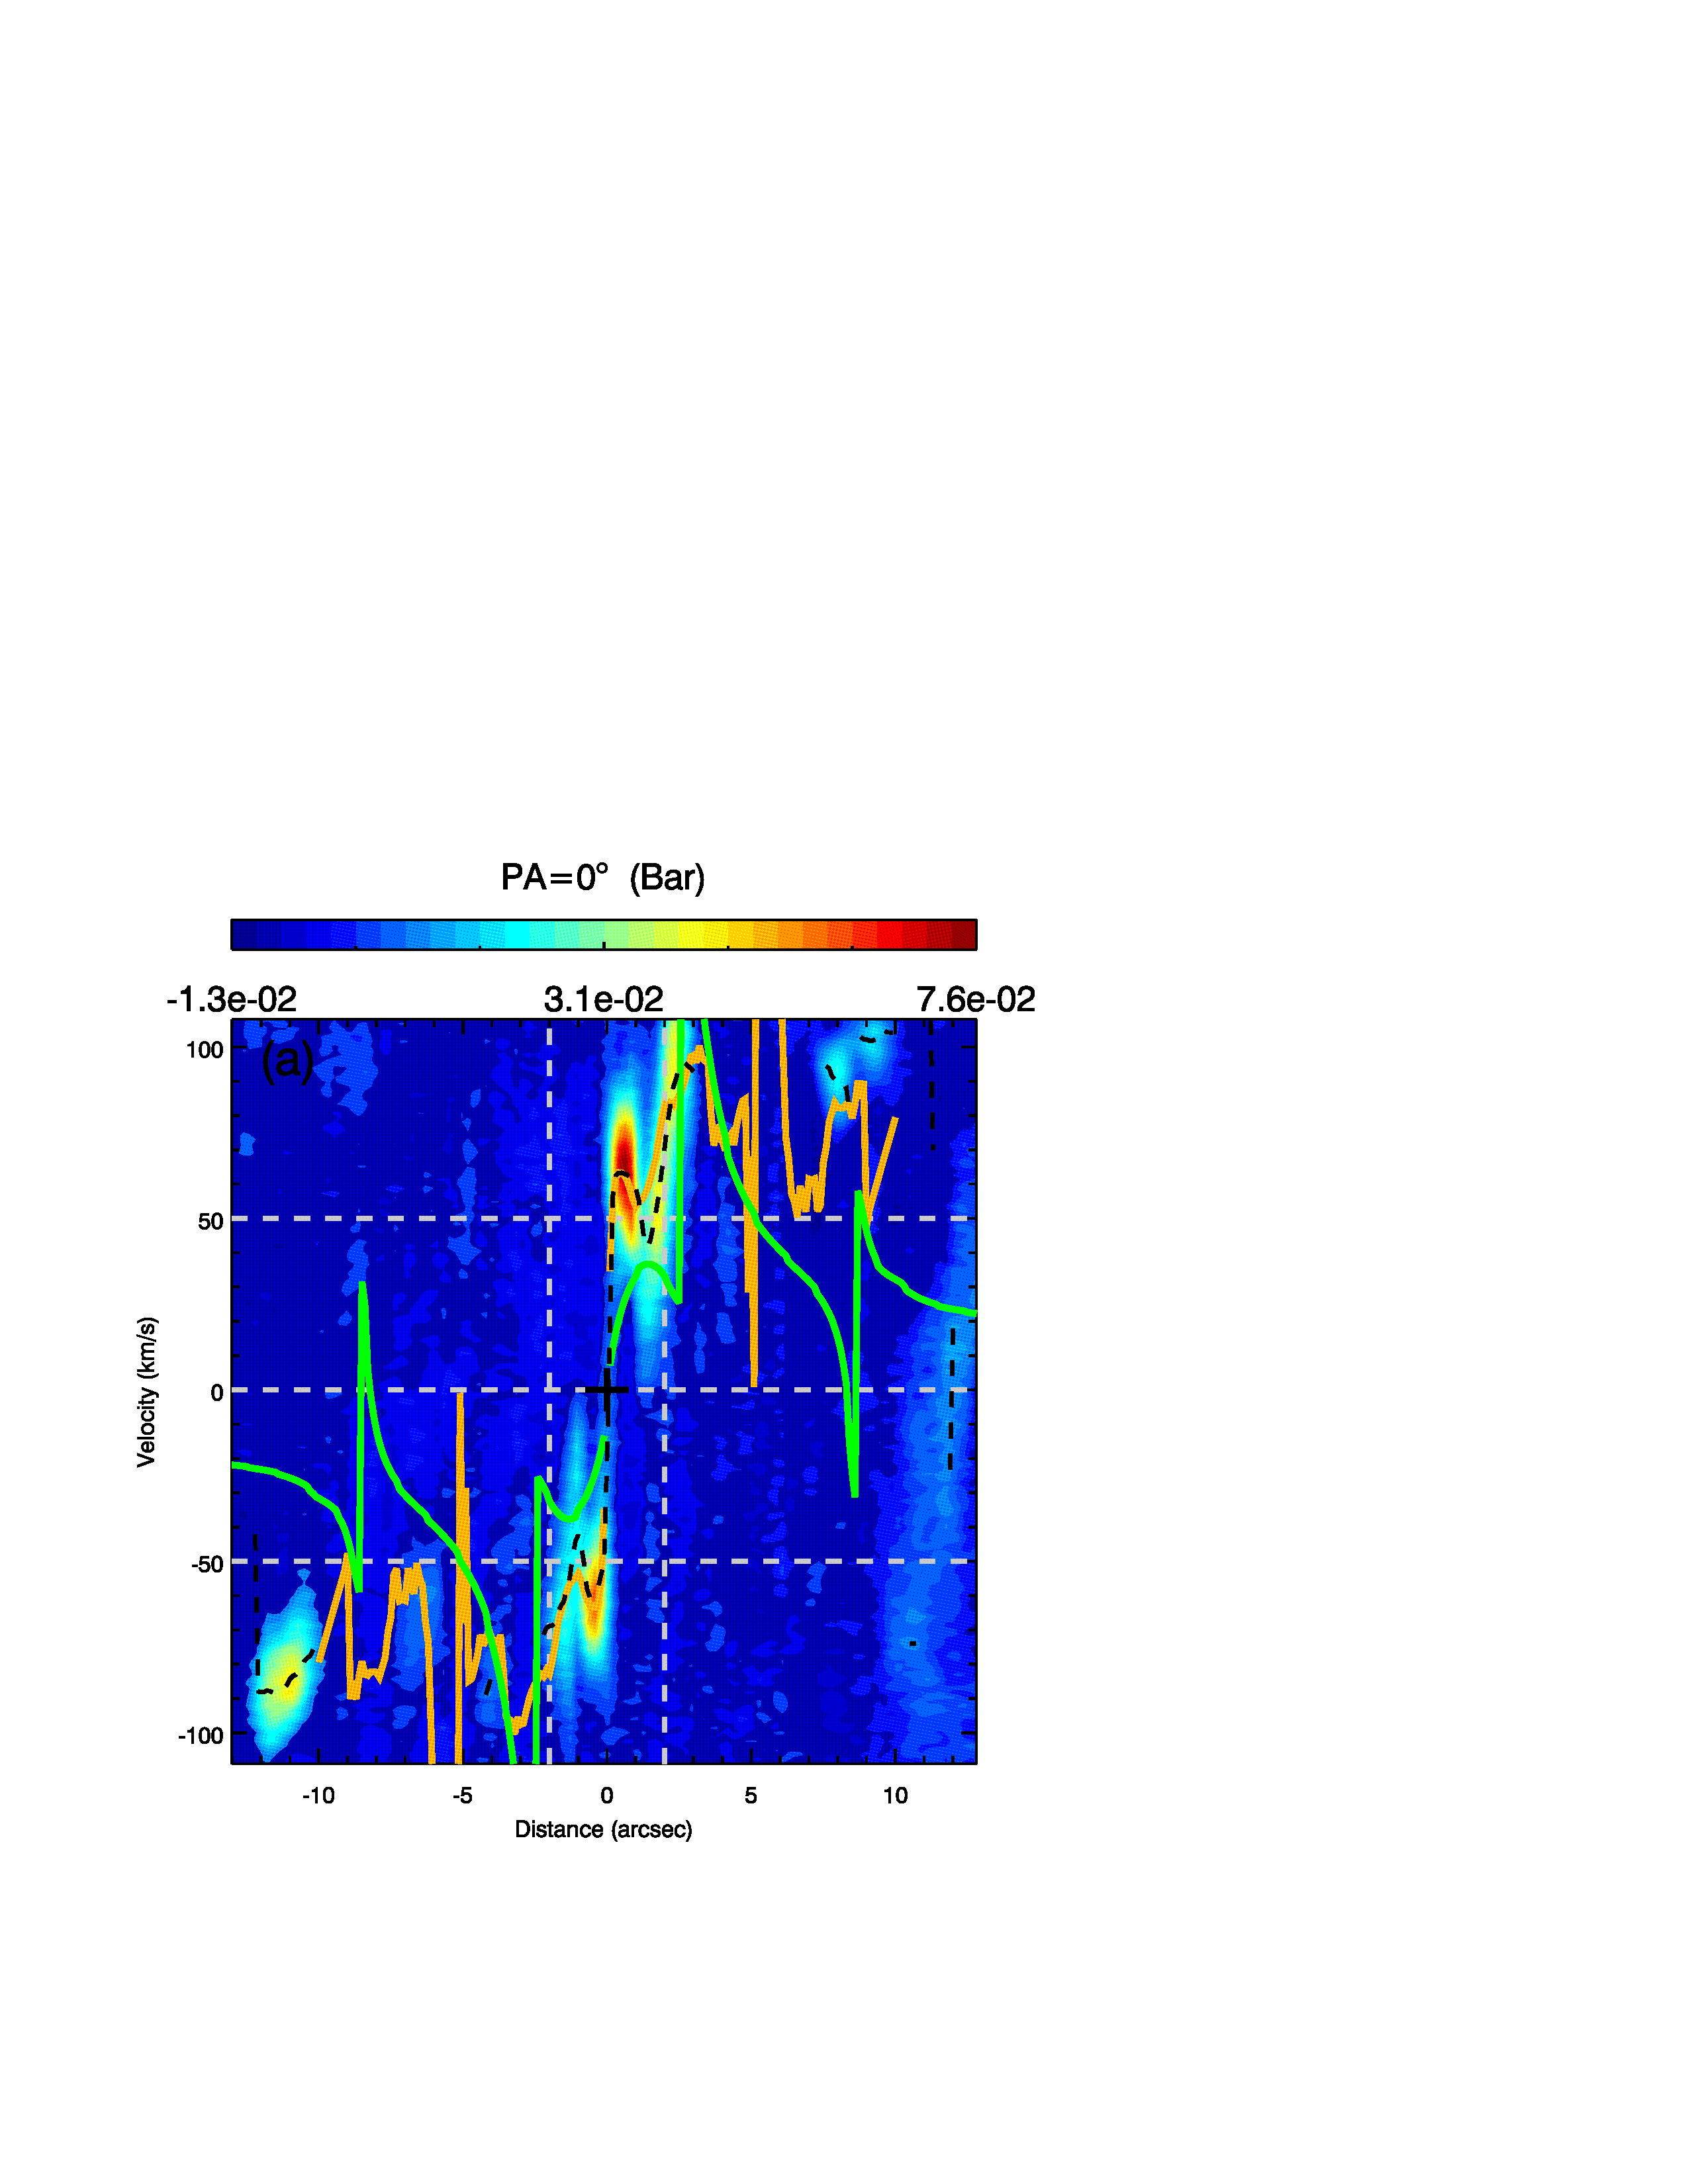
For the pv diagram along PA=0, which is aligned with the large scale bar in NGC 1566, we see (1) gas consistent with outflows, which is well fit by our outflow model; (2) gas which is almost in rotation 1–2″from the nucleus on either side, but showing a steeper rotation curve which reaches zero velocity at a position offset from the center.
For the pv diagram along the major axis (PA 45°), several velocity components can be seen. These include gas in rotation, and some contamination from the disk outflow component, since at the nucleus, the ‘slit’ (limited by the spatial resolution of our ALMA observations) expectedly picks up the gas outflowing along the minor axis and other angles. Moreover, gas in the inner spiral to the NE is preferentially redshifted and gas in the inner spiral to the SW is preferentially blueshifted, i.e. both spirals show 40 km s-1 (in projection) deviations towards values of zero velocity: the most obvious interpretation of this is that gas originally in circular rotation is slowed down on hitting the ends of the nuclear molecular gas ‘bar’. This loss of momentum could potentially result in inflows. Similar velocity offsets are also seen at slit PAs offset 10° from the major axis (e.g. PA=55°; Fig. 9), and is very dramatic on the SW side in the pv diagram with slit PA=75°, at the point where an outer spiral pattern breaks off from the inner spiral pattern.
Molecular gas in the inner spirals always show a large velocity dispersion (around 80 km s-1). The inner spiral to the NW (about 1 arcsec from the nucleus) always show velocities which are bluer than that expected from rotation or rotation+outflow. This is clearly seen in all pv diagrams which intersect this arm (e.g. PAs 45°, 55°, 75°). The opposite inner spiral (that to the SE) shows the opposite, i.e. velocities redder than expected from rotation and rotation+outflow (e.g. most obvious in the PA 105° and 115° pv diagrams) but this velocity offset is not as well defined as in the case of the NW arm. Given that the NW arm is mainly on the near side of the galaxy disk and the E arm is on the far side, this is what would be expected from a streaming outflows along the spiral rather than streaming inflows! We speculate that these structures are absorbing the momentum of the nuclear outflow and thus heating up and expanding.
Another region which consistently shows large differences from the rotation+outflow model is the double cavity (between the nuclear bar-like structure and the inner spiral arms) to the NW and SE, for offsets of 1 to 2 arcsec from the nucleus. When the slit passes through these cavities the pv diagrams (especially those at PA=0, and PA=15°) show a characteristic pattern which can be explained by slower than rotation velocity between 1 and 2 arcsec (but increasing in the correct sense), and a large dispersion of velocities (all larger than those expected from rotation) at 2 arcsec.
While the predictions of our rotation plus outflow model are in general consistent with the position velocity data at different PAs especially in the inner 2″, at PAs close to 0° (see the pv diagrams at PA=0°,15° and 15°) one can see significant differences between the data and models in the inner 15. Here we clearly see a component of gas which follows a steep velocity gradient decreasing to zero velocity at a distance of 15 from the nucleus on both sides. One potential explanation for this anomalous rotation is an inner counter rotating gas disk with major axis in PA0, fed by gas inflowing along the large scale bar. This possibility is motivated by observational evidence that bars are an efficient pathway for transporting gas from galactic scales to nuclear scales in both active and inactive barred galaxies (Sakamoto et al., 1999; Crenshaw et al., 2003; Regan & Teuben, 2004; Sheth et al., 2005). Alternatively, these features are a consequence of perturbations due to the bar, as discussed in the next section.
3.6 Modelling Observed Velocities: Bar perturbations
Velocity perturbations due to bar(s) are believed to play an important role in fueling the SMBH and in triggering nuclear star formation. It is well known that NGC 1566 hosts an intermediate strength nuclear bar with radius 1.7 kpc in PA0 (Hackwell & Schweizer, 1983; Pence et al., 1990; Mulchaey et al., 1997; Agüero et al., 2004; Dicaire et al., 2008; Comerón et al., 2010; Kendall et al., 2011, C14), which could be largely responsible for the velocity perturbations seen in the molecular gas. C14 used torque maps to show that the asymmetries in the velocity field of the nuclear molecular gas are predominantly produced by the bar. They also briefly explore estimates for the bar pattern speed. However, they did not make a detailed kinematic analysis of the bar-produced perturbations.
To analyze the effect of bar-produced perturbations we use both Diskfit (Spekkens & Sellwood, 2007) and our own Fourier component decomposition software (Finlez et al., in prep.) based on the the linear perturbation analysis described in Wong et al. (2004); Fathi (2004).
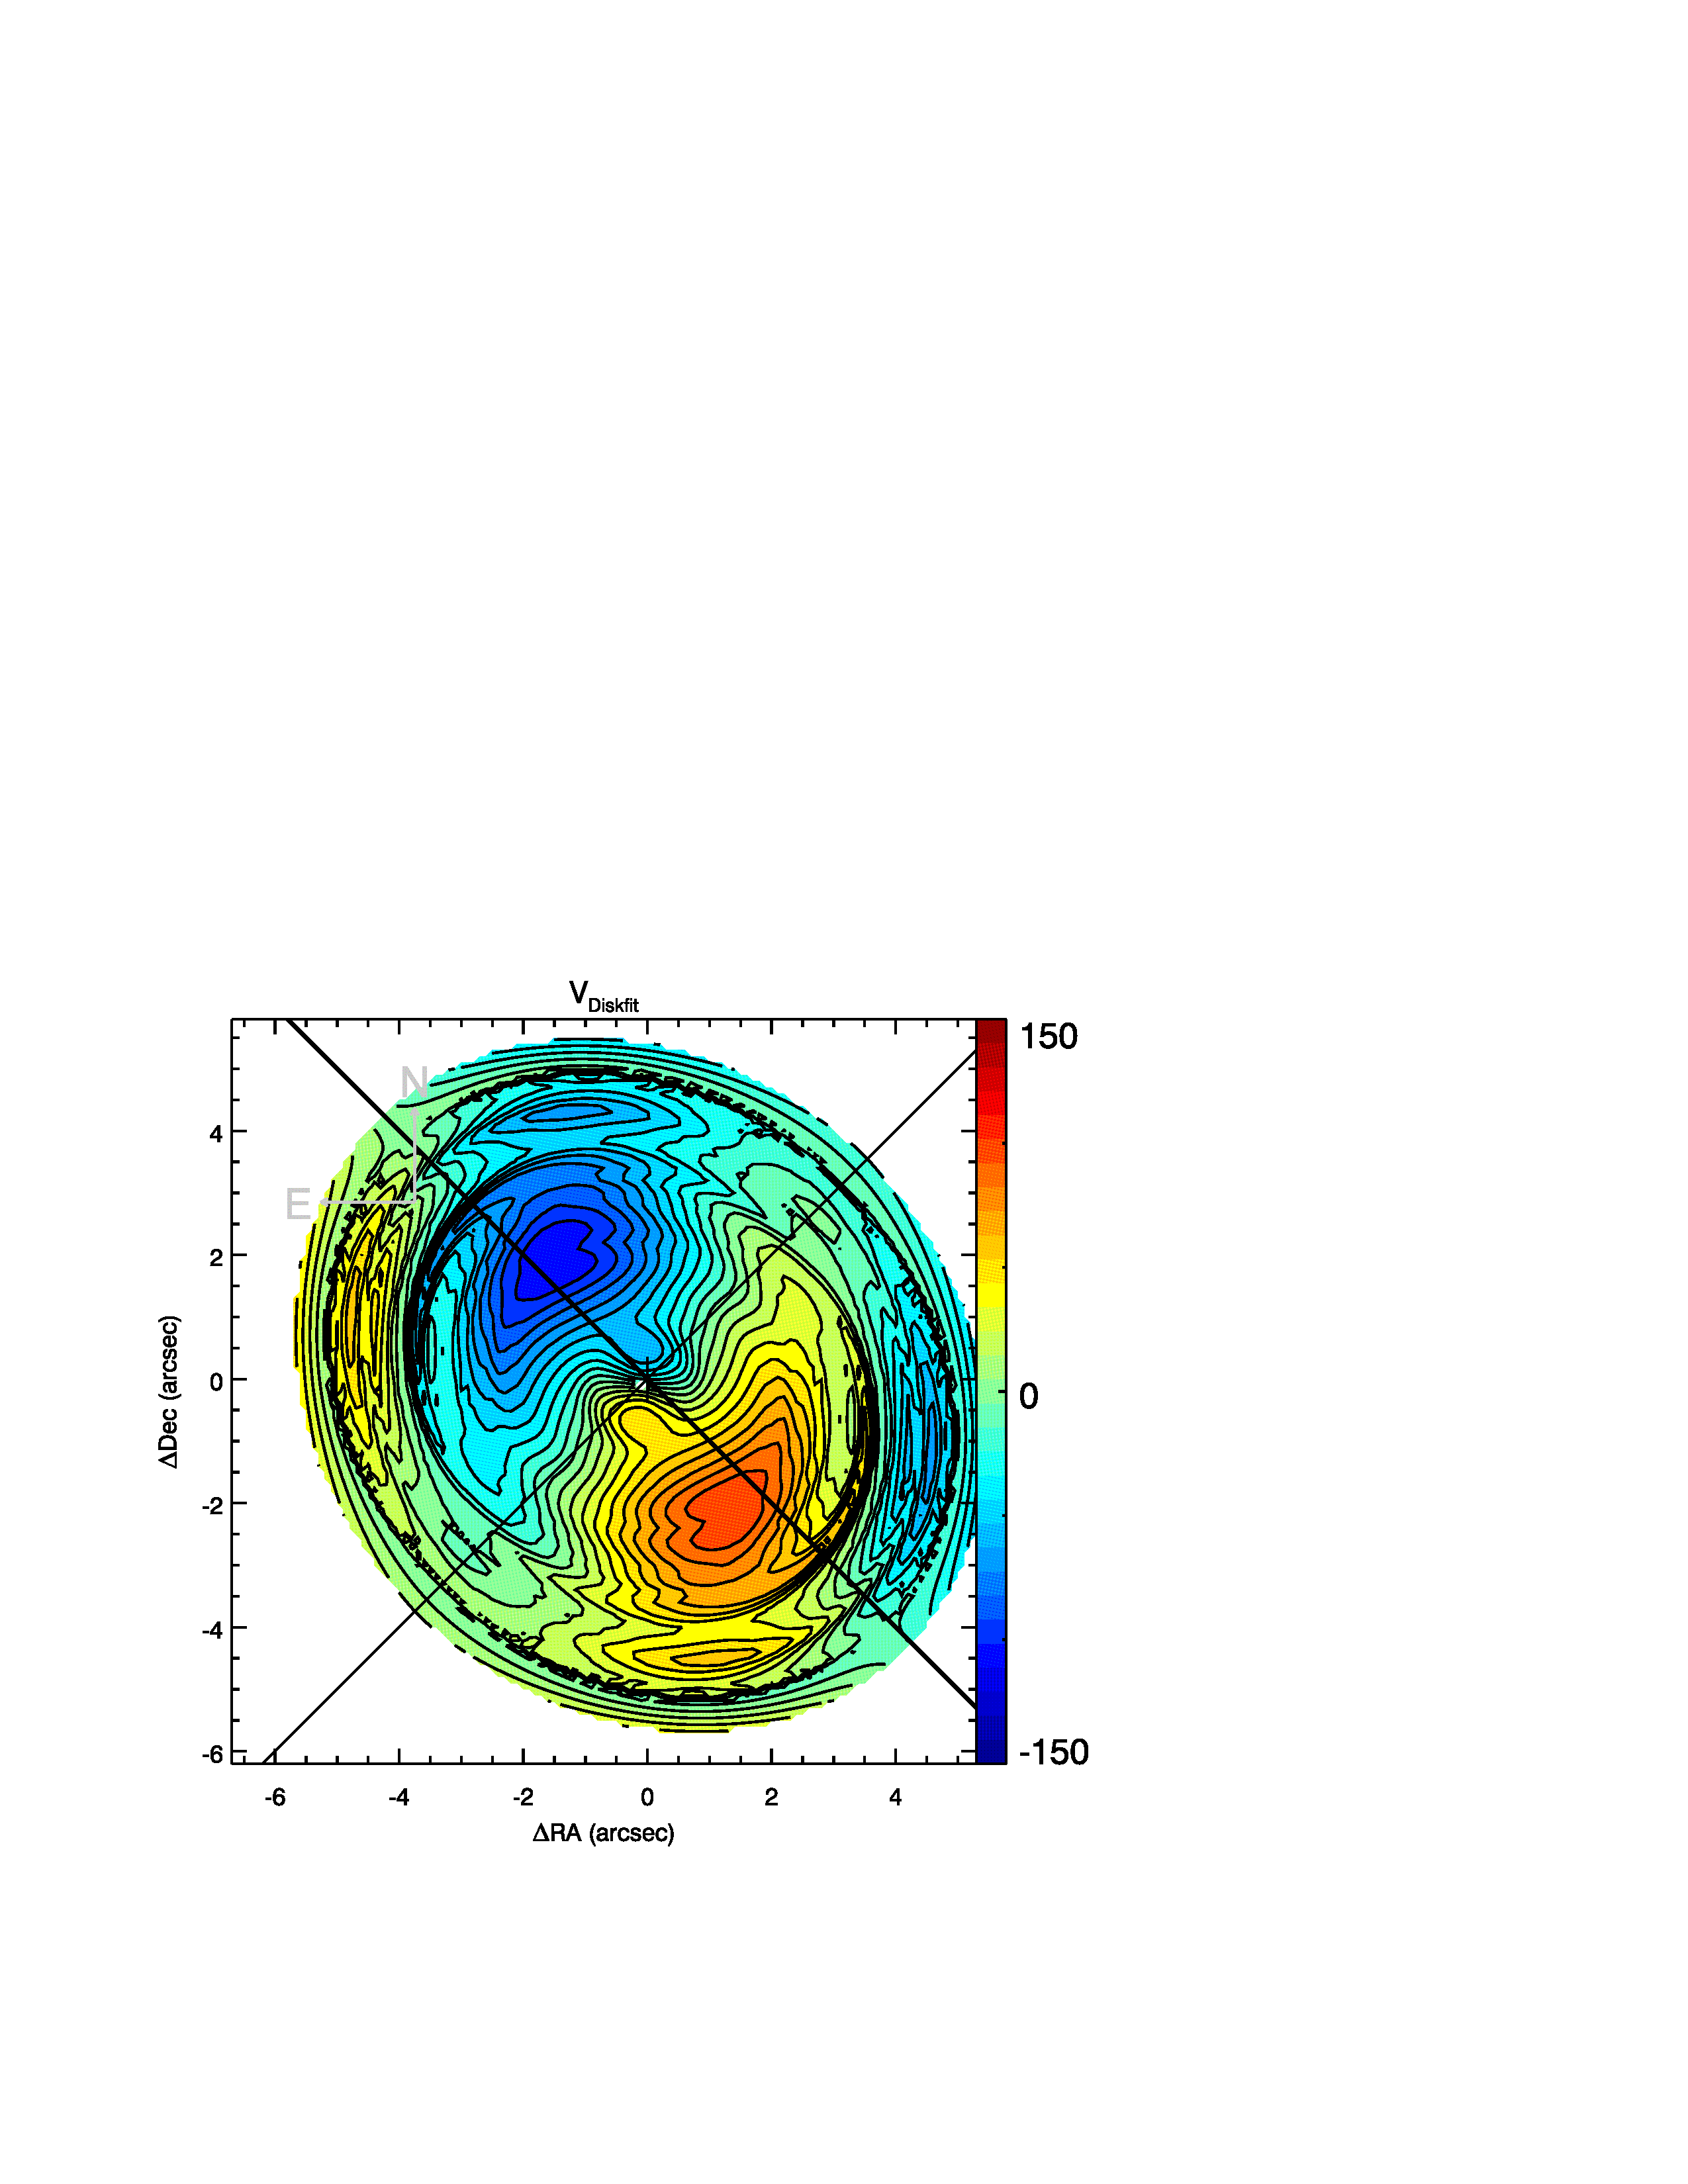
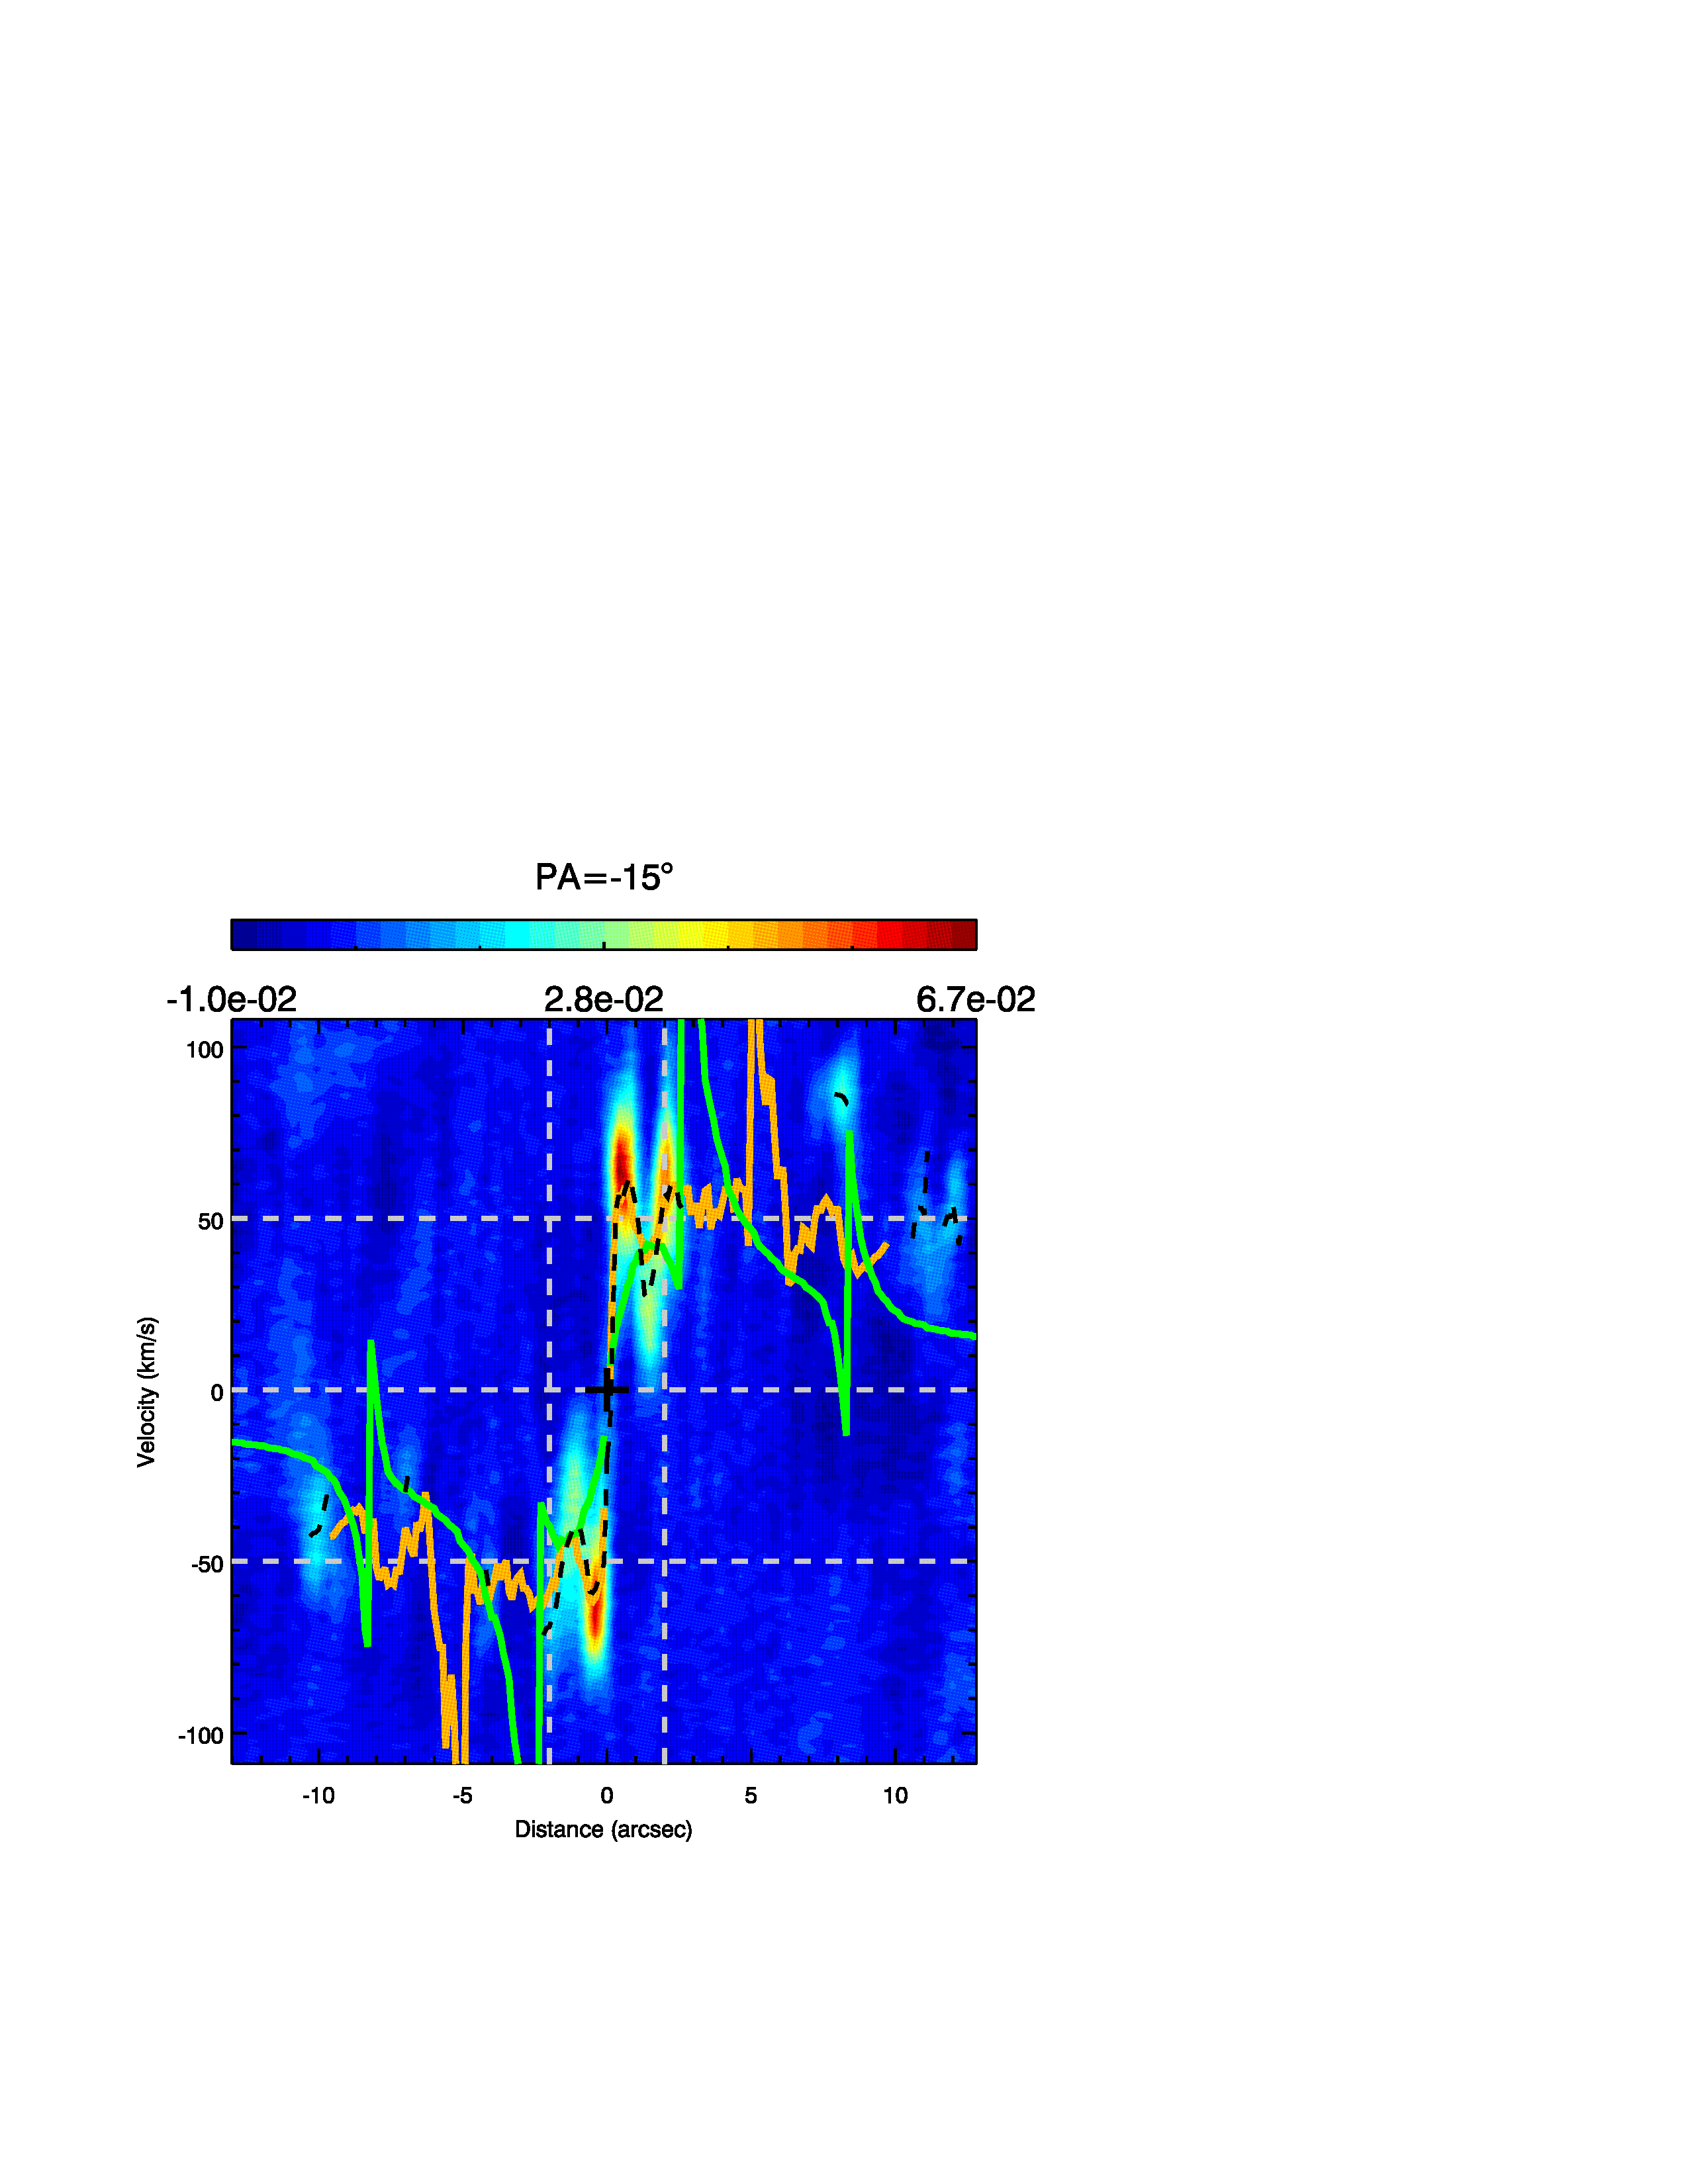
The Diskfit888http://3w.physics.queensu.ca/Astro/people/Kristine_Spekkens/diskfit/ package can be used to fit both the image and the velocity field of a galaxy. In imaging mode, an input image is fit with one or more of a bulge, disk, and bar, resulting in estimates of the relative flux and morphology (ellipticity, brightness profile, and PA) of each component. In velocity mode, Diskfit models asymmetric rotation-dominated velocity fields using a combination of tangential and radial perturbations to a fitted circular velocity model. We fit our CO J:2-1 velocity field using Diskfit considering only m=2 potential perturbation (i.e. bars) modes and using the galaxy nuclear position, galaxy PA, galaxy inclination and bar PA as fixed values (mm continuum peak position, 45°,33°, and 0°, respectively). The best fit model obtained by Diskfit, and the velocity residuals (observed Diskfit model) are shown in the top panels of Fig. 10. The best fit model from Diskfit differs from our toy rotation model (Fig. 7, top left and Sect. 3.2) in that the apparent rotation axis moves to a slightly smaller PA in the inner 4″, the inner 1″ shows twisted isophotes, and there is a resonance at 4″, which mainly falls in a region where we do not have observed velocities due to low signal to noise.
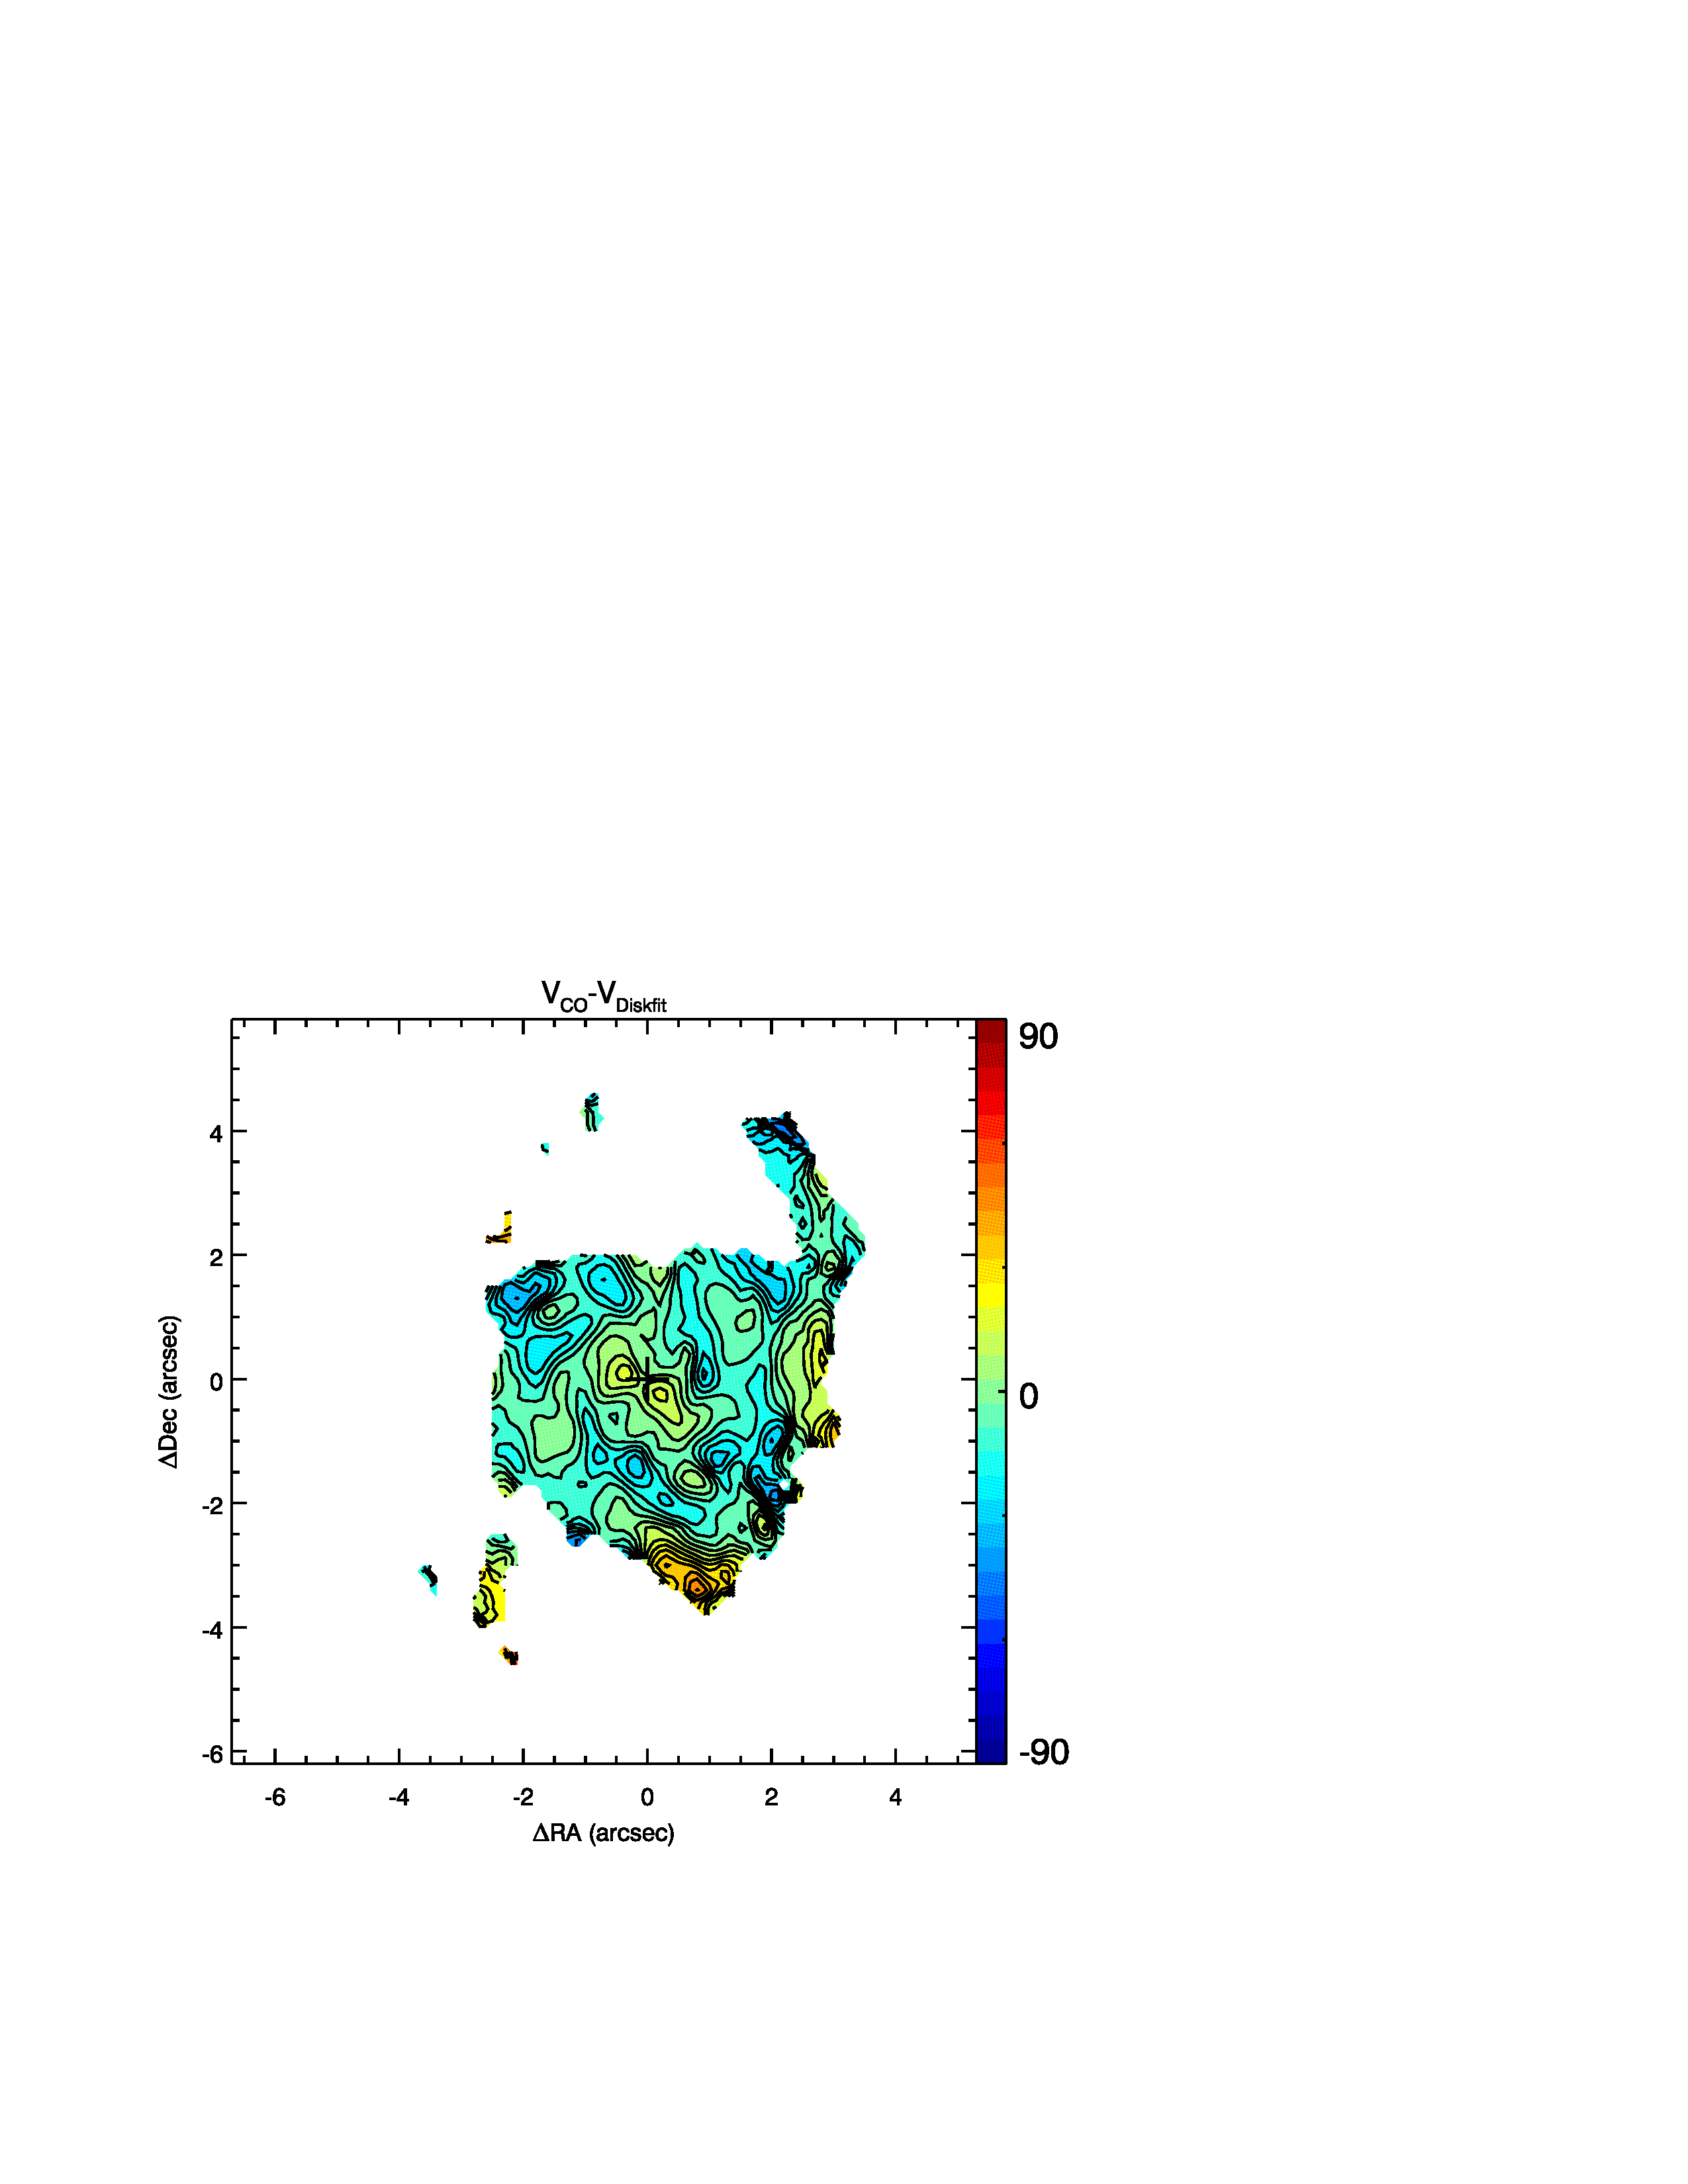
The residual velocity map obtained after subtracting the Diskfit (Fig. 10 top right panel) shows smaller deviations from systemic as compared to the velocity residual made from our rotation-only model (top right panel of Fig. 7), especially to the SE of the nucleus, and in general in the inner arcsecs. However, the Diskfit model still does not attain the highest velocities seen in the inner arcsecs. We note that Diskfit only allows us to change basic photometric parameters of the galaxy, e.g., disk PA and inclination and bar PA, and the input observed velocity field. Since all these are relatively well defined for NGC 1566, we are unable to further fine-tune the results of Diskfit.
To better illustrate the differences between the Diskfit model and the observed velocity field, we plot the Diskfit model (orange lines) on the observed pv diagrams at several relevant PAs (Fig. 12). We immediately note that the best-fit Diskfit model was derived from the velocity field (intensity weighted average velocity at each spatial pixel) rather than the full datacube, so that comparing the model directly to the pv diagram is not really fair. Instead it is more correct to compare the model (orange lines) with the velocities from the moment 1 map (intensity weighted velocity; black dashed lines in the figure). While the Diskfit model slightly overpredicts the velocities seen along the major axis (top right panel), and the pattern of the velocities seen along the minor axis (bottom middle panel), it fails to predict (by a factor 2) the large peak velocities seen along the minor axis (PA=135°), or along PAs 0° and 15°. That is, the bar perturbations are unable to explain the 90 km s-1 radial velocities seen in the inner 1″ to the NW and SE of the nucleus.
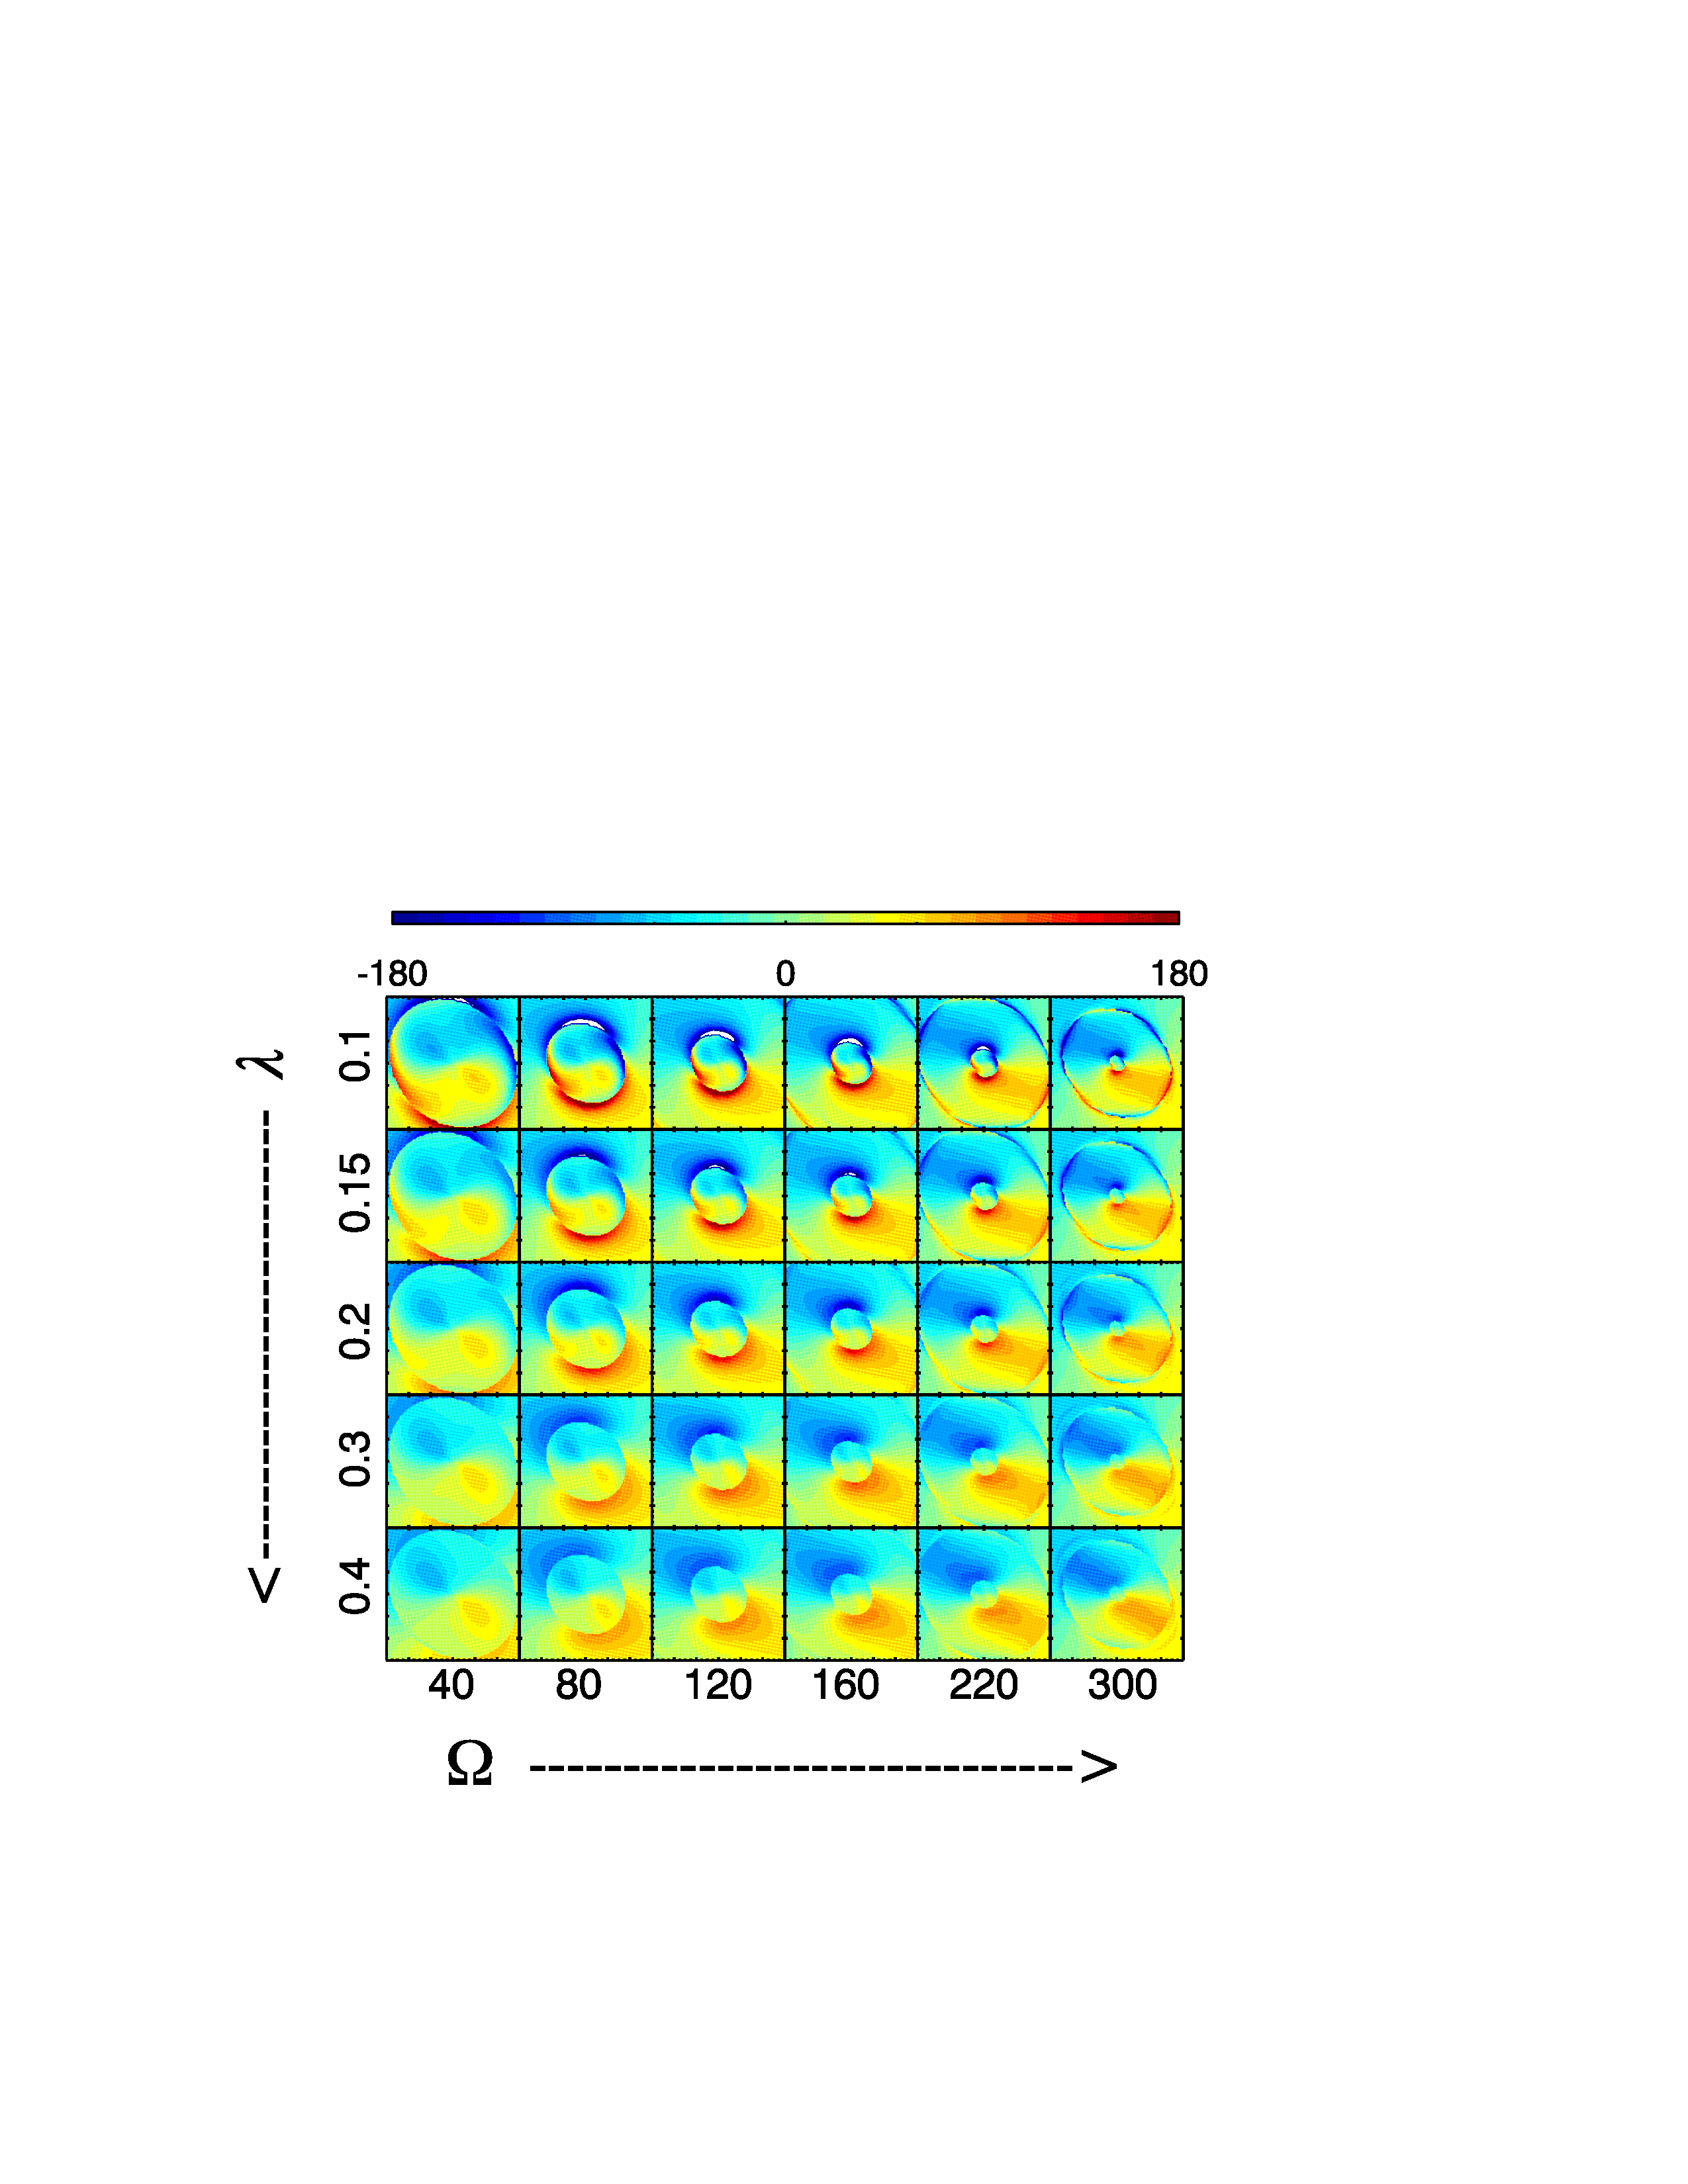
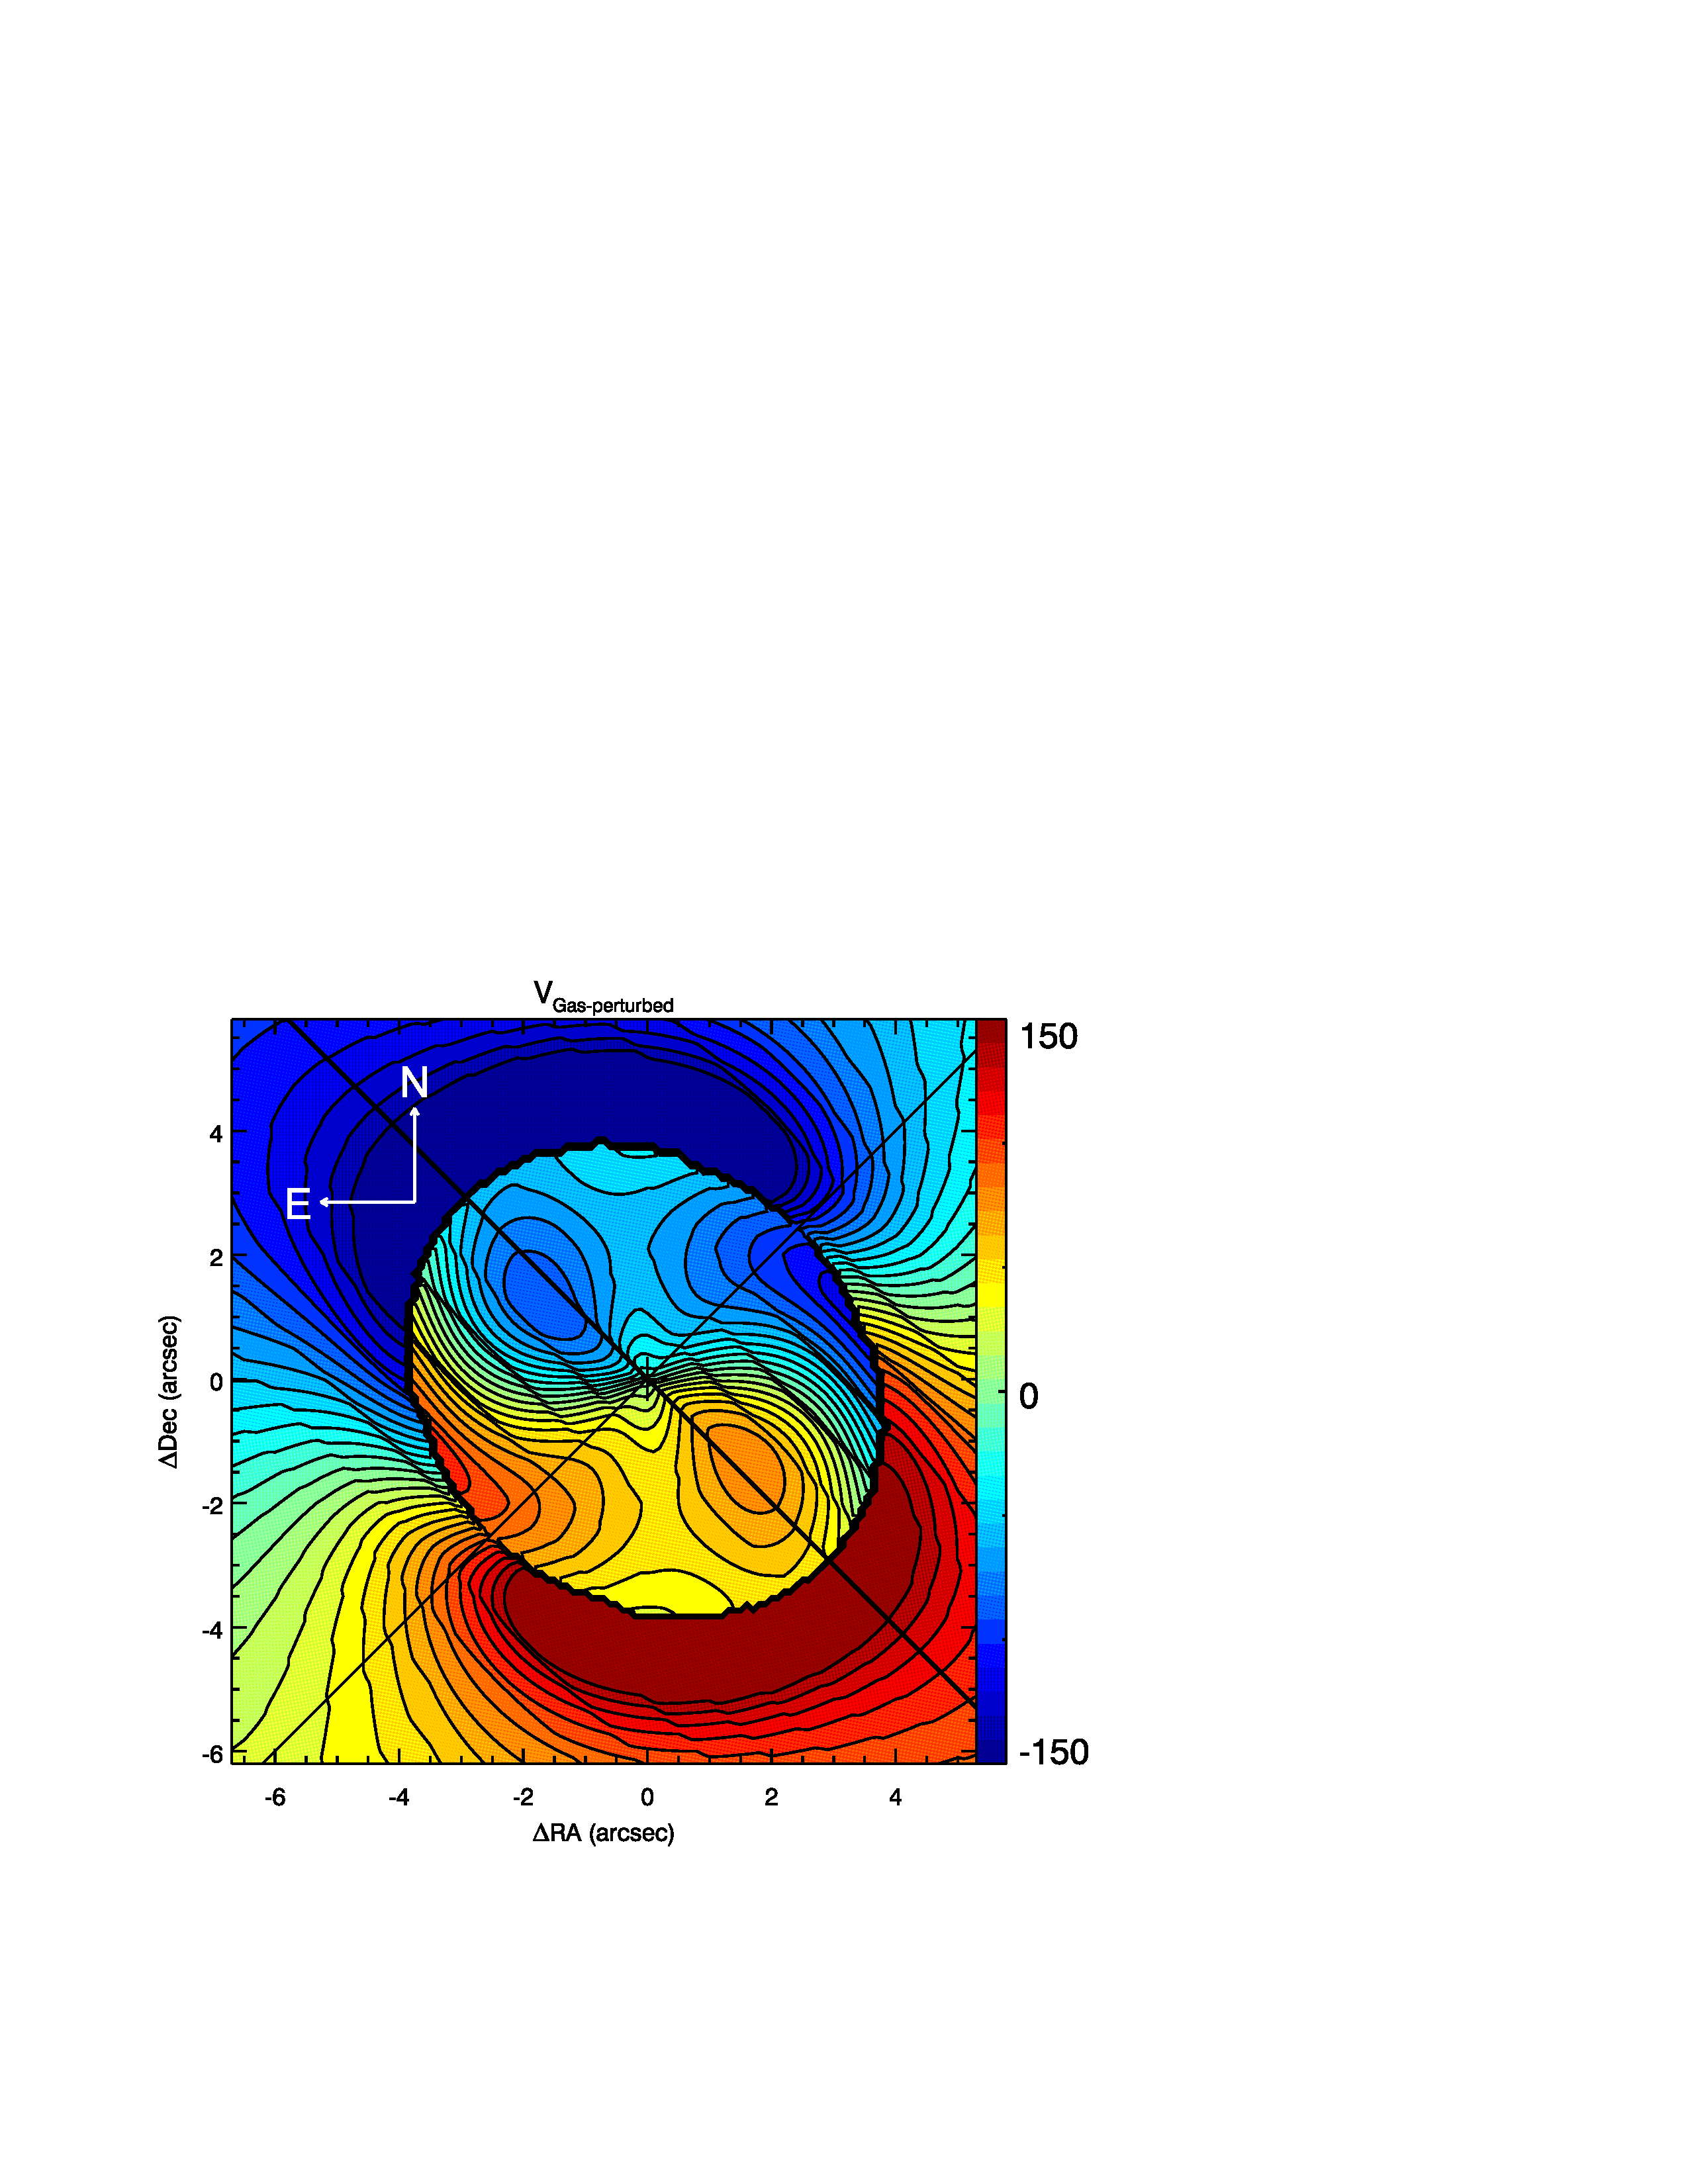
While Diskfit models the observed velocity field with a base rotation model plus perturbations in radial and tangential velocities (one component each in the case of m=2 modes), it does not use (or at least does not provide details to the user) a physically-based model with, e.g., a mass-based rotation curve or a fixed bar pattern speed. We thus additionally model the observed CO velocity field with linearized epicyclic perturbations produced by a bar (for details see, e.g., Wong et al., 2004; Fathi, 2004) applied to a physically derived rotation curve (an exponential disk whose mass is constrained by near-IR photometry) for a given bar pattern speed (), damping factor (associated to a frictional force; ), and bar PA and ellipticity (Finlez et al., in prep.). Our code is based on the algorithms proposed in Franx et al. (1994), Wong et al. (2004) and Fathi (2004). Note that we specifically use the ‘m=2’ potential (relevant for bars) which introduces changes in the 1st and 3rd harmonic coefficients (Schoenmakers et al., 1997), and that this perturbation analysis is valid only for ‘weak’ bars, i.e. when the bar potential does not dominate the disk potential).

We used Diskfit to decompose an IRAC 3.6 image of NGC 1566, obtained from NED, into bulge, disk, and bar components. The galaxy and bar PAs were fixed and other parameters allowed to vary. We further assume a constant mass to light (M/L) ratio for all three components. We find that the disk contains 58% of the total mass (light) of NGC 1566 with a bar to disk mass ratio of 0.7. Given the total mass of NGC 1566 derived by Sheth et al. (2010), the disk mass is . Alternatively, the disk luminosity with a ratio of 0.47 (McGaugh & Schombert, 2014) implies a disk mass of . An exponential disk with these total masses was then used to derive a first-guess intrinsic (i.e. before bar perturbations) axisymmetric rotation curve (details in Finlez et al., in prep.). The disk mass was then slightly adjusted (to ) in order to better fit (by eye) the model rotation curve of the CO in the inner disk (i.e. ModC2014) or to agree with our best-fit Bertola model Bertola et al. (1991, Eq. 2) to the stellar velocity field. Note that these masses are an order of magnitude lower than that predicted by Korchagin et al. (2000) ().
We then ran our linear perturbation code, in m=2 mode, using as inputs the intrinsic axisymmetric rotation curve(s) derived above, the PAs of the galaxy disk and bar, and the bar ellipticity (), the latter derived from our Diskfit decomposition. The bar pattern speed () and the damping factor () were allowed to vary. The resultant model velocity fields for a range of values of and , when using the best-fit Bertola model of the stellar velocity field, are shown in Fig. 11. The most notable effect of varying is the change in the radii of the resonances. Gas orbits change abruptly when crossing these resonances; the effect of increasing damping (increasing ) is to smooth out these large swings in the orbits. Most of the panels in Fig. 11 show the characteristic ‘butterfly’ pattern expected from bar perturbations. However, for this butterfly pattern to fall within the central 2″ as observed, i.e. to explain the innermost high velocity features, one requires extremely high (300 km s-1 kpc-1) bar pattern speeds. Alternatively, the intrinsic rotation curve requires to rise slower or flatten at lower velocities. We must note that the uncertainty in the distance to NGC 1566 (see Sect. 1) plays a significant role in the bar pattern speeds used here. If a distance of 20 Mpc is used for NGC 1566 then the bar pattern speeds we list here would halve, so that less extreme bar pattern speeds could replicate the observed resonances. In any case, even if the resonance radii are matched, the pattern of the model velocities are significantly different from the observed CO velocity field (and the larger scale H velocity field from Pence et al. (1990): specifically at higher pattern speeds the strongest perturbations inside the inner resonance are in PA 100°, offset from the PA of our posited outflow, and beyond the inner resonance the kinematic axis of is highly curved, starting at PA 0 and then curving to the observed PA of the galaxy.
For illustration, we compare the predictions of the perturbation model which uses the Bertola best fit model to the stellar velocity field as the intrinsic rotation curve, and parameters = 120 [ km s-1kpc-1] and = 0.2 (the model shown in the third row, third column of Fig. 11) with our observed pv diagrams in Fig 12. While this model does not well fit the observed velocity field, it uses a pattern speed argued for in C14 (based on corotation placed at the bar end) and a damping parameter within the range of values typically invoked for other well studied galaxies (between 0–0.5 Wada, 1994; Fathi et al., 2005), and is thus a good reference point.
As a further illustration, the bar-perturbed velocity fields for = 120 , = 0.2, and for both options of the intrinsic rotation curve (gas- and stellar-rotation curve models) are shown in bottom panels of Fig. 10. The model which uses an intrinsic rotation curve similar to that of the gas (bottom left) exhibits a resonance at 4″, similar to that obtained by Diskfit (left top), but presents less pronounced nuclear distortions as compared to the Diskfit model. Using the slower rising Bertola (stellar velocity) model as the intrinsic rotation model (bottom right) changes the position of the resonance to (2.6″), but also gives lower velocity distortions along the minor axis, or rather the higher velocities seen in the observed velocity field (1″) are further out in the model (3″): therefore, to spatially matching these velocity distortions requires higher bar pattern speeds or a slower rise in the intrinsic axisymmetric rotation curve. Apart from the mismatch in resonance radii, these two panels also clearly illustrate the mismatch between the observed and modelled velocity fields noted above; specifically, the misalignment of kinematic axes inside the resonance (related to the posited outflow), and the large curvature in the kinematic axis beyond the inner resonance.
Overall, we are unable to convincingly fit the observed CO kinematics with perturbations produced by the large scale bar. Our linearized epicyclical bar perturbation models, which use realistic values for the intrinsic rotation curves and the bar pattern speed (with the caveat of the uncertainty in the distance to NGC 1566), are able to reproduce the amplitudes of the inner perturbations. However, the resonances are produced further out than observed, and the velocity changes are not as sharp as observed. Higher bar pattern speeds, perturbations by an inner bar in a different PA, or different intrinsic rotation curves, would be required. Diskfit reproduces reasonably many of the observed features in the velocity map, and at first glance provides a reasonable explanation for the perturbations observed, even if the amplitude of these perturbations is not as high as observed. However, we are wary of the results of Diskfit for two main reasons. First, Diskfit does not provide feedback on the underlying physical parameters of the resultant model, and thus, e.g., we are unable to evaluate whether the bar pattern speed used is physical and second, we have applied Diskfit to about a dozen galaxies for which we have disturbed optical emission line kinematics over the inner 5” of the galaxy and almost always found relatively good fits (Schnorr-Muller, priv. communication), even though our detailed multi-component analysis either found the perturbations to be due to bars (Schnorr-Müller et al., 2017a) or outflows and/or streaming inflows (most other cases, eg., Schnorr-Müller et al., 2017b). In fact, Spekkens & Sellwood (2007) obtained a good fit to the velocity field in NGC2976, but to conclude that the perturbations were due to the bar, they confirm their existence at the PA predicted by the model, according previous photometry. This consistently good performance of Diskfit makes it more difficult to believe that the fits are truly consistent and physically motivated rather than empirical best fits to distorted velocity fields. We emphasize that we are not stating that bar-related perturbations do not exist in the velocity field, rather we argue that bar-related perturbations are not the unique and dominant driver of the observed nuclear perturbations in the CO velocity maps, and it is most likely that the nuclear perturbations are produced by an AGN-driven outflow.
3.7 Modeling Observed Velocities: CO J:2-1 Streaming?
The presence of putative outflows and/or bar related perturbations (previous sections) makes it difficult to search for signatures of streaming motions in the inner few arcsec in velocity maps or even residual velocity maps (e.g. Fig. 7). That is, since the velocity maps show the intensity weighted average velocity of the spectrum corresponding to each spatial pixel, they are likely dominated by the ’outflow’ signature in the inner 3″. Further, when the intensity of the gas in rotation dominates that of the gas in inflow, velocity residual maps will not show strong indications of the inflow. It is thus important to examine the velocity profile of each pixel or aperture in order to separate outflows, rotation, and streaming inflows. Ideally, one requires a complete velocity field to analyze the azimuthal average of radial gas velocities at each radius. While this is often possible in the case of ionized gas, molecular gas is often detected only over a limited range of azimuths at each radius. In the case of NGC 1566, our CO velocity maps are ’complete’ out to a radius of 3″, beyond which the velocity filling factor is 5–40%. Under the assumption that these detected CO regions dominate the CO flux at their respective radii, the detected clumps or arms can still be used to constrain the presence of streaming flows. Given the above, we model streaming inflows with a very simple toy model in which the inflow is assumed to have a constant radial inflow velocity (which we fix to 50 km s-1 after initial inspection of the results). This velocity is then projected and added to the projected radial velocity expected from our rotational model. We first examine the spectral profiles in apertures along the inner spiral arms (left panel of Fig. 13). The CO J:2-1 spectra extracted from these apertures are shown in the right panel of Fig. 13, together with the average radial velocities expected from our models of rotation, outflows, and streaming (and combinations thereof).
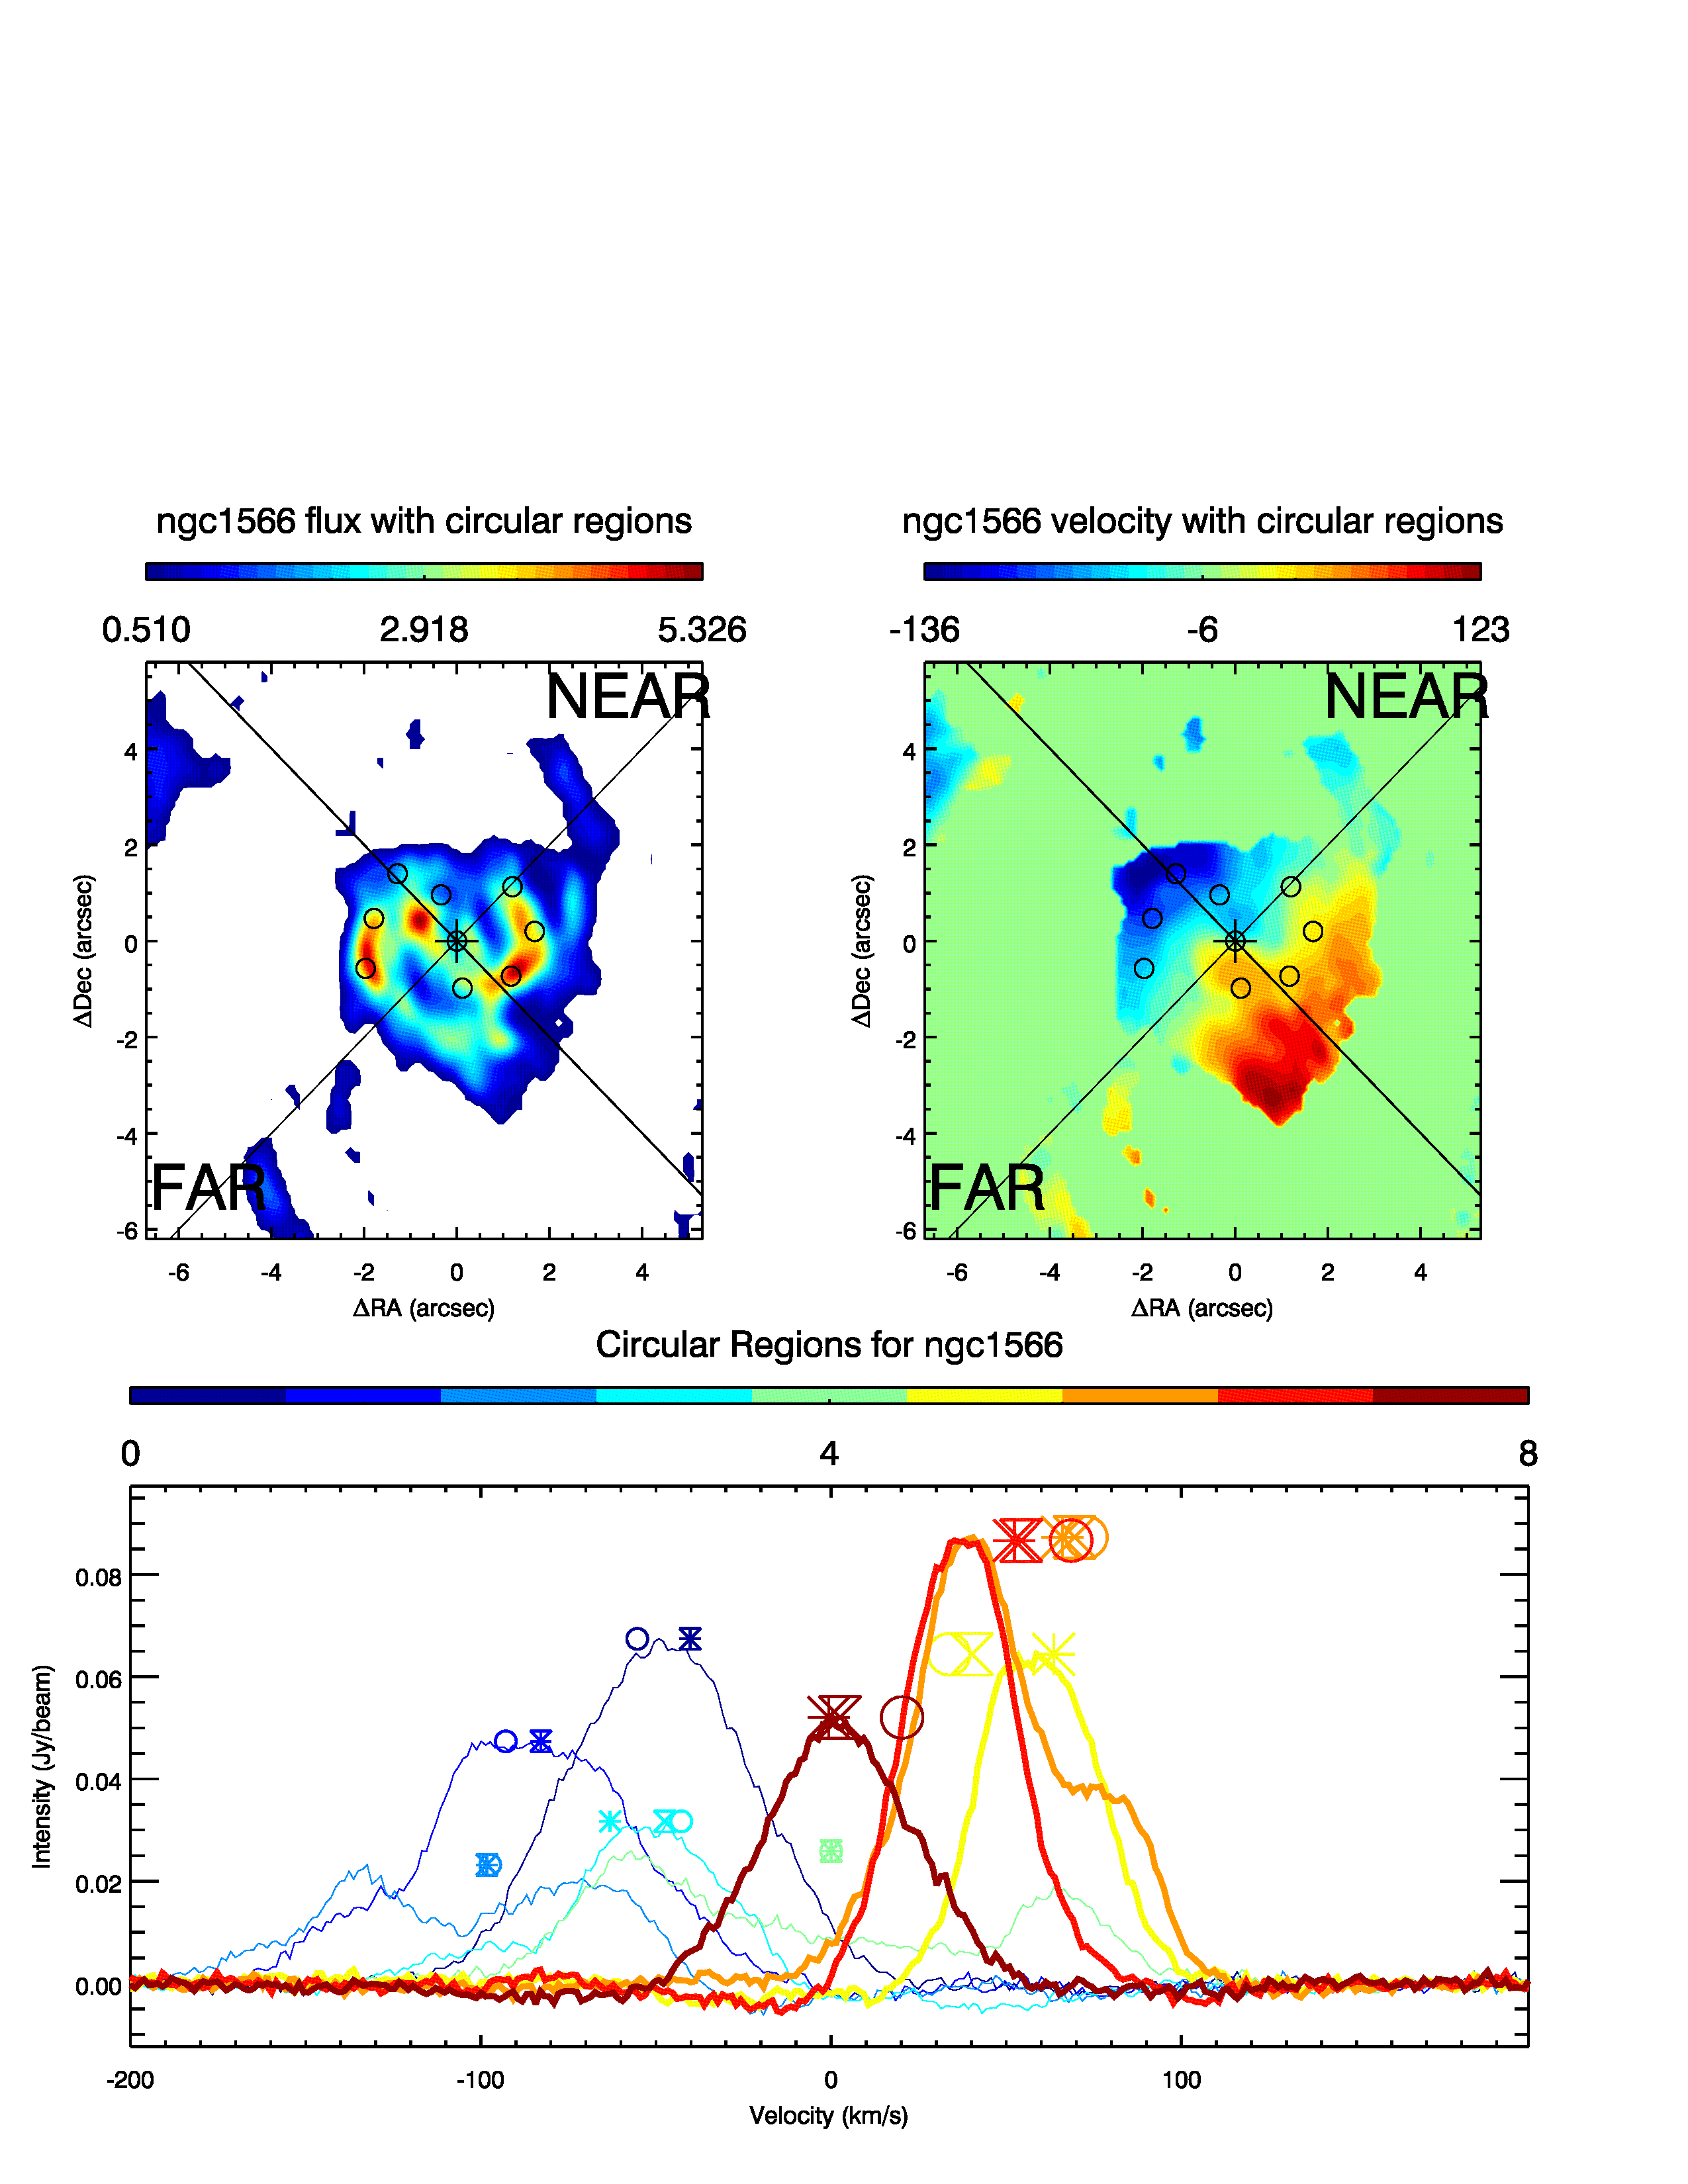
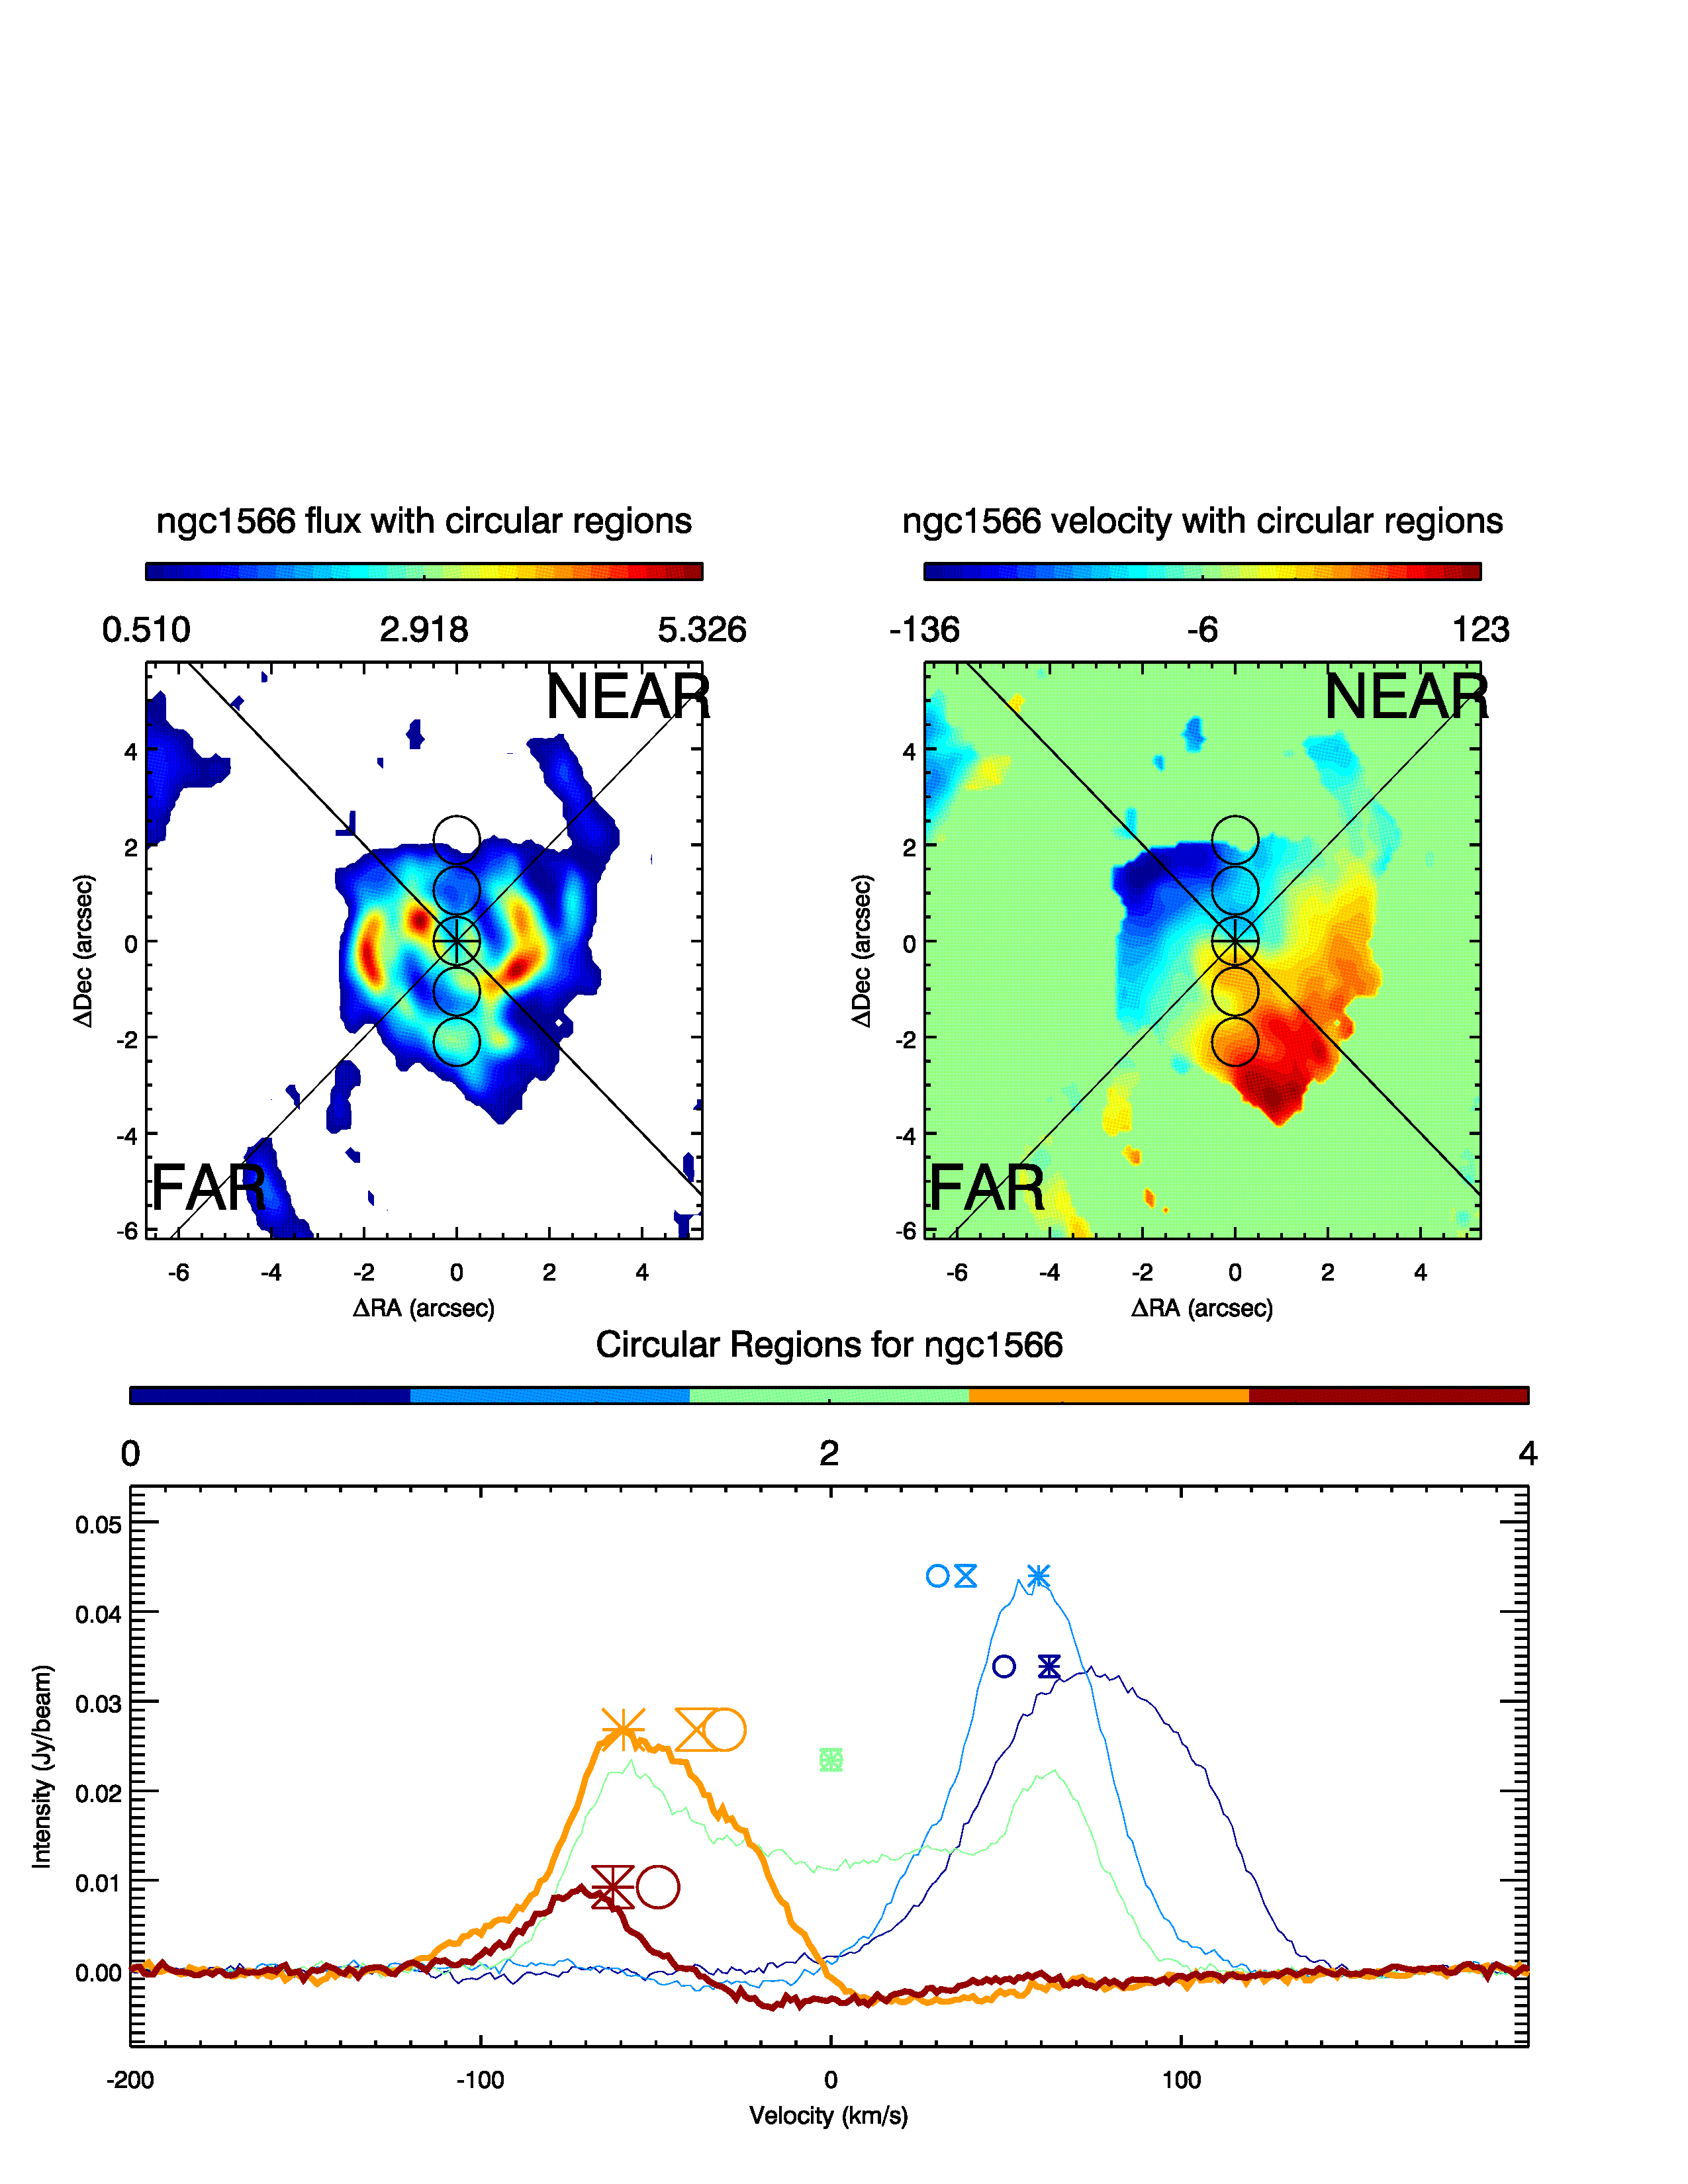
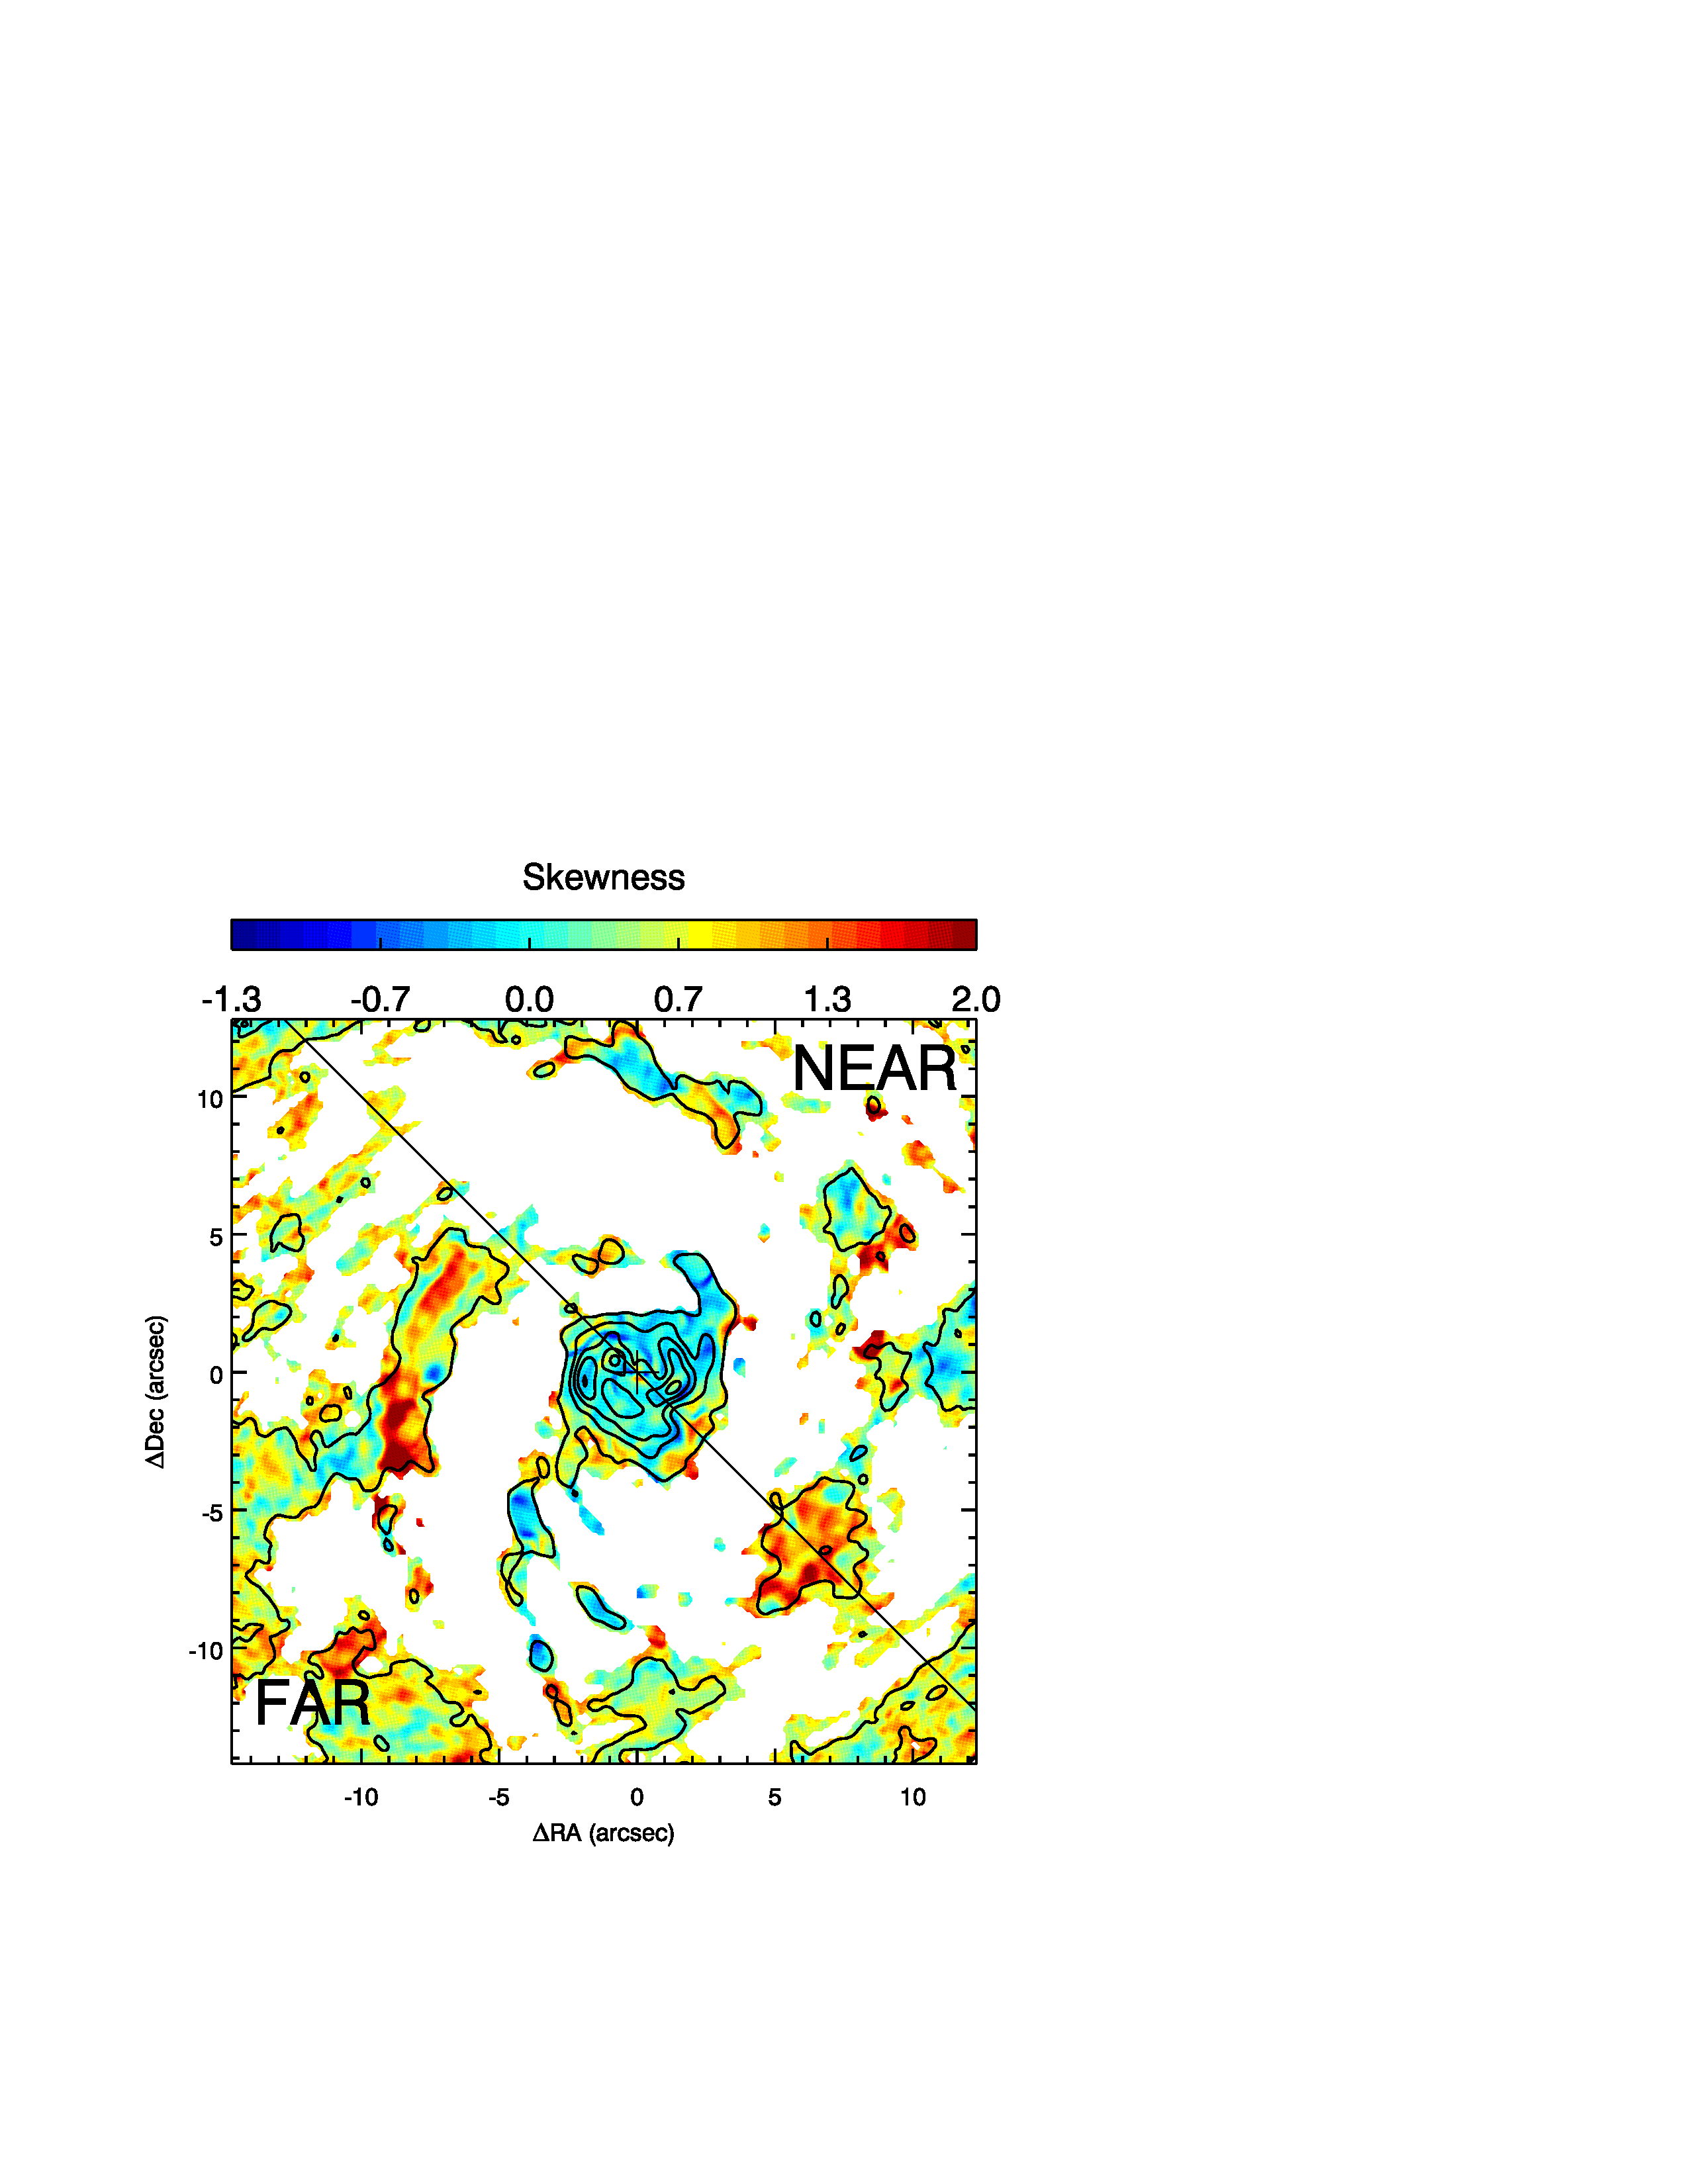
Analyzing the CO J:2-1 spectra in the right panel of Fig. 13 we see the following: (a) The nuclear spectrum (light green) is clearly double peaked: the peaks at 65 km s-1 are attributed to putative nuclear outflows (previous sub-sections), and the highest velocities seen are 100 km s-1. Note that there is a plateau of CO J:2-1 emission at lower velocities, potentially from gas rotating in the disk (recall that our rotation models predict velocities of 0–50 km s-1within this aperture). (b) The off-nuclear apertures show profiles with varied shapes and widths, and the off-nuclear apertures which intersect the galaxy major axis clearly show multiple velocity components. (c) For the W spiral arm (spectra plotted in thick lines) there is a large mismatch between the spectral profiles and the expectations from our rotation model only (hourglass symbols in Fig. 13). In order of increasing distance from the nucleus along the W spiral arm, gas in the first aperture rotates faster than predicted; the gas profile in the second aperture has a strong red shoulder at a velocity consistent with rotation, while the profile peak is offset 30 km s-1 to the blue; gas in the third aperture rotates slower than predicted; and gas in the farthest aperture is centered at zero velocity since the aperture lies on the minor axis of the galaxy. (d) For the E spiral arm (spectra plotted in thin lines) the profiles are more centered on the predictions of our rotation only model. In order of increasing distance from the nucleus along the E spiral arm, gas in the first aperture (which includes the edge of the strong CO knot 1″ from the nucleus to to NE) lies close to the prediction of the rotation model but a clear blue shoulder is seen; gas in the second aperture shows a clear double-peaked profile with the expected rotation velocity lying in the middle of the two peaks; gas in the third aperture also shows a broad blue shoulder. (e) Including our decelerating outflow model (i.e. using the predictions of rotation plus outflows; asterisks in the figure) the model predictions change significantly only for the two off-nuclear apertures closest to the nucleus. Here the aperture to the S (solid yellow spectrum in the figure) fits the prediction satisfactorily, i.e. as if almost all gas is in outflows, but to the N (cyan spectrum), while the aperture profile shows an extra blue wing in the correct velocity direction for outflows the magnitude of the offset does not fit well with our model, and the gas seems to be dominantly in rotation rather than outflows. (f) Using a model which sums our streaming toy model to pure rotation (open circles in the figure), we see that the apertures in the W arm are inconsistent with the predictions of streaming inflows: the mismatch between the spectrum peak and the prediction increases when changing from rotation only to rotation plus radial inflow. In the E arm, however, the profiles are in general as consistent with the streaming inflow+rotation model as with the rotation only model, i.e. while the profile peaks are consistent with rotation, the prominent shoulders on these profiles are roughly consistent with streaming inflows. This is also clearly seen in the skewness map (Fig. 6 where almost the full inner spiral arm structure shows a blue ’skewness’, independent of being on the near- or far-side of the galaxy disk.
We also show the spectra in apertures along the PA of the large scale bar in Fig. 14; here we use larger apertures (05 radius) to obtain a higher signal to noise. Here the peak of the spectral profiles are consistent with the predictions of rotation+outflow and a shoulder is seen roughly at the predicted velocity of rotation plus radial streaming inflows.
To test for streaming inflows along spiral patterns further from the nucleus, we also examined the spectra from apertures along the spiral patterns SE to S of the nucleus which connect to the inner spiral arm discussed above, and spectra in apertures tracing spiral structure to the N and NW of the nucleus, which connect to the W inner spiral. We do not show these spectra as the essential results can be seen in the skewness map of the CO J:2-1 line (Fig. 6, left panel): here blue (red) colors represent pixels where the CO spectral profile is skewed in the sense of having excess emission towards the blue (red) of the weighted mean velocity at that pixel. To avoid contamination by noise the skewness was calculated using the spectral profile down to 10% of the peak flux. If most of the gas follows regular rotation and a smaller fraction of gas participates in a radial streaming inflow then we expect blue (red) skewness on the far (near) side of the galaxy. The inner 2″ shows profiles skewed consistently to the blue. show that the gas is mainly consistent with rotation. Two spiral arm sections at 10″ from the nucleus (roughly at the putative location of the Inner Lindblad Resonance (ILR) of the large-scale bar (Comerón et al., 2010, C14)) to the SSE and to the N show a skewness consistent with inflows. All spectra in these arms show non symmetric profiles which are likely from multiple velocity components. In fact velocity differences between the peak of the profile and the shoulders to the red match well the predictions of the offset (from rotation) velocity expected from streaming inflows.
3.8 Molecular mass in the inner kiloparsec
Molecular gas mass is typically estimated from the CO luminosity (Solomon & Vanden Bout, 2005) using M where:
| (2) |
Here, has units of , is the integrated flux density of the CO J:1-0 line in , is the luminosity distance in Mpc, z is the redshift, and is the observed frequency in GHz. There remains significant debate on the value of , and we use the value as suggested by Bolatto et al. (2013) for the Galaxy and other nearby spiral galaxies which are not extreme starbursts. Note that is directly proportional to the surface brightness in K units, and therefore the ratio of two CO J transitions gives the ratio of their surface brightness temperatures. Furthermore, is constant for all J levels if the molecular gas emission comes from thermalized optically-thick regions, i.e., the brightness temperature and line luminosity are independent of J and rest frequency for a given molecule (Solomon & Vanden Bout, 2005).
Since we observed the CO J:2-1 line, we require to convert to , a conversion which depends on the physical conditions of the gas. Bajaja et al. (1995) have observed the CO J:1-0 and CO J:2-1 lines in NGC 1566 at low resolution using the SEST telescope, and C14 have presented ALMA CO J:3-2 observations of NGC 1566. The nuclear CO J:2-1 / CO J:1-0 intensity ratio found by Bajaja et al. (1995) is 1 in temperature units: as expected from thermalized optically-thick gas. C14 compared the Bajaja et al. (1995) CO J:2-1 integrated flux densities with their ALMA-derived CO J:3-2 integrated flux densities and inferred that the latter was missing some flux; they thus also assumed that the gas is thermalized and optically-thick in their calculation of molecular gas masses.
To further constrain the observed flux ratios, we downloaded the CO J:3-2 data of C14 from the ALMA Science Archive999https://almascience.nrao.edu/aq/ and created a Moment 0 map. For thermalized optically-thick gas one expects that the integrated flux density (in units of Jy km s-1) of each CO J transition varies as . We find that in the inner 3″ radius (the inner disk), the integrated CO J:2-1 flux density () is 1/2.3 times that of CO J:3-2. Over a larger field, in size, the total flux density of the CO(J:2-1) line () is half that of CO J:3-2. We thus, as in C14, assume thermalized optically-thick gas, i.e. / = 1. Under this assumption, using a value of listed above, and = 10 Mpc, the molecular gas mass in the inner spiral arms is , and the total molecular gas mass in the central region is .
Estimating the molecular gas mass in the nuclear outflows of NGC 1566 is more difficult. Recall that outflowing molecular gas is clearly detected out to 2″ (Sect. 3.3), and perhaps out to 5″ (Sect. 3.7). To estimate the mass and momentum of the outflowing gas in the unresolved nucleus we extract the nuclear CO J:2-1 emission spectrum in a circular aperture of 02 in radius (similar to our synthesized beam area; Fig. 15). This spectrum appears to be made of three distinct components: a strong blue Gaussian representing emission from the blue outflow (), a weaker red Gaussian representing emission from the red outflow () (Sect. 3.3) and an intermediate velocity region (green line in the figure; radial velocities between 40 km s-1; ). This intermediate velocity region could originate in (a) gas in a spherical outflow in the nucleus since variation in the projection angles to the line of sight will give emission at all velocities; (b) unresolved emission from gas in solid body rotation-only; (c) emission from dispersion-dominated gas in the nucleus. With the masses calculated above, and using the (deprojected) mean flux-weighted velocity of each of the above components under the assumption that the outflows are in the plane of the disk we can estimate the outflow momentum in the unresolved nucleus, obtaining km s-1] and km s-1] for the blue and red outflows in the inner (unresolved; 19.2 pc) nucleus, respectively.
Since the outflows extend beyond the inner (unresolved) nucleus we can extend this outflow mass analysis to larger scales. From the bottom right panel of Fig. 9, we can distinguish that the putative outflows along the minor axis show two stages: (1) an initial stage between radii of 0 to 1″ which show velocities close to the peak velocity, and (2) a final stage with monotonically decreasing velocities (down to 0) between 1″ and 15 from the nucleus. For these two stages (but excluding the innermost 02 considerated as the nuclear outflows above) we obtain total outflow mass values of and , respectively.
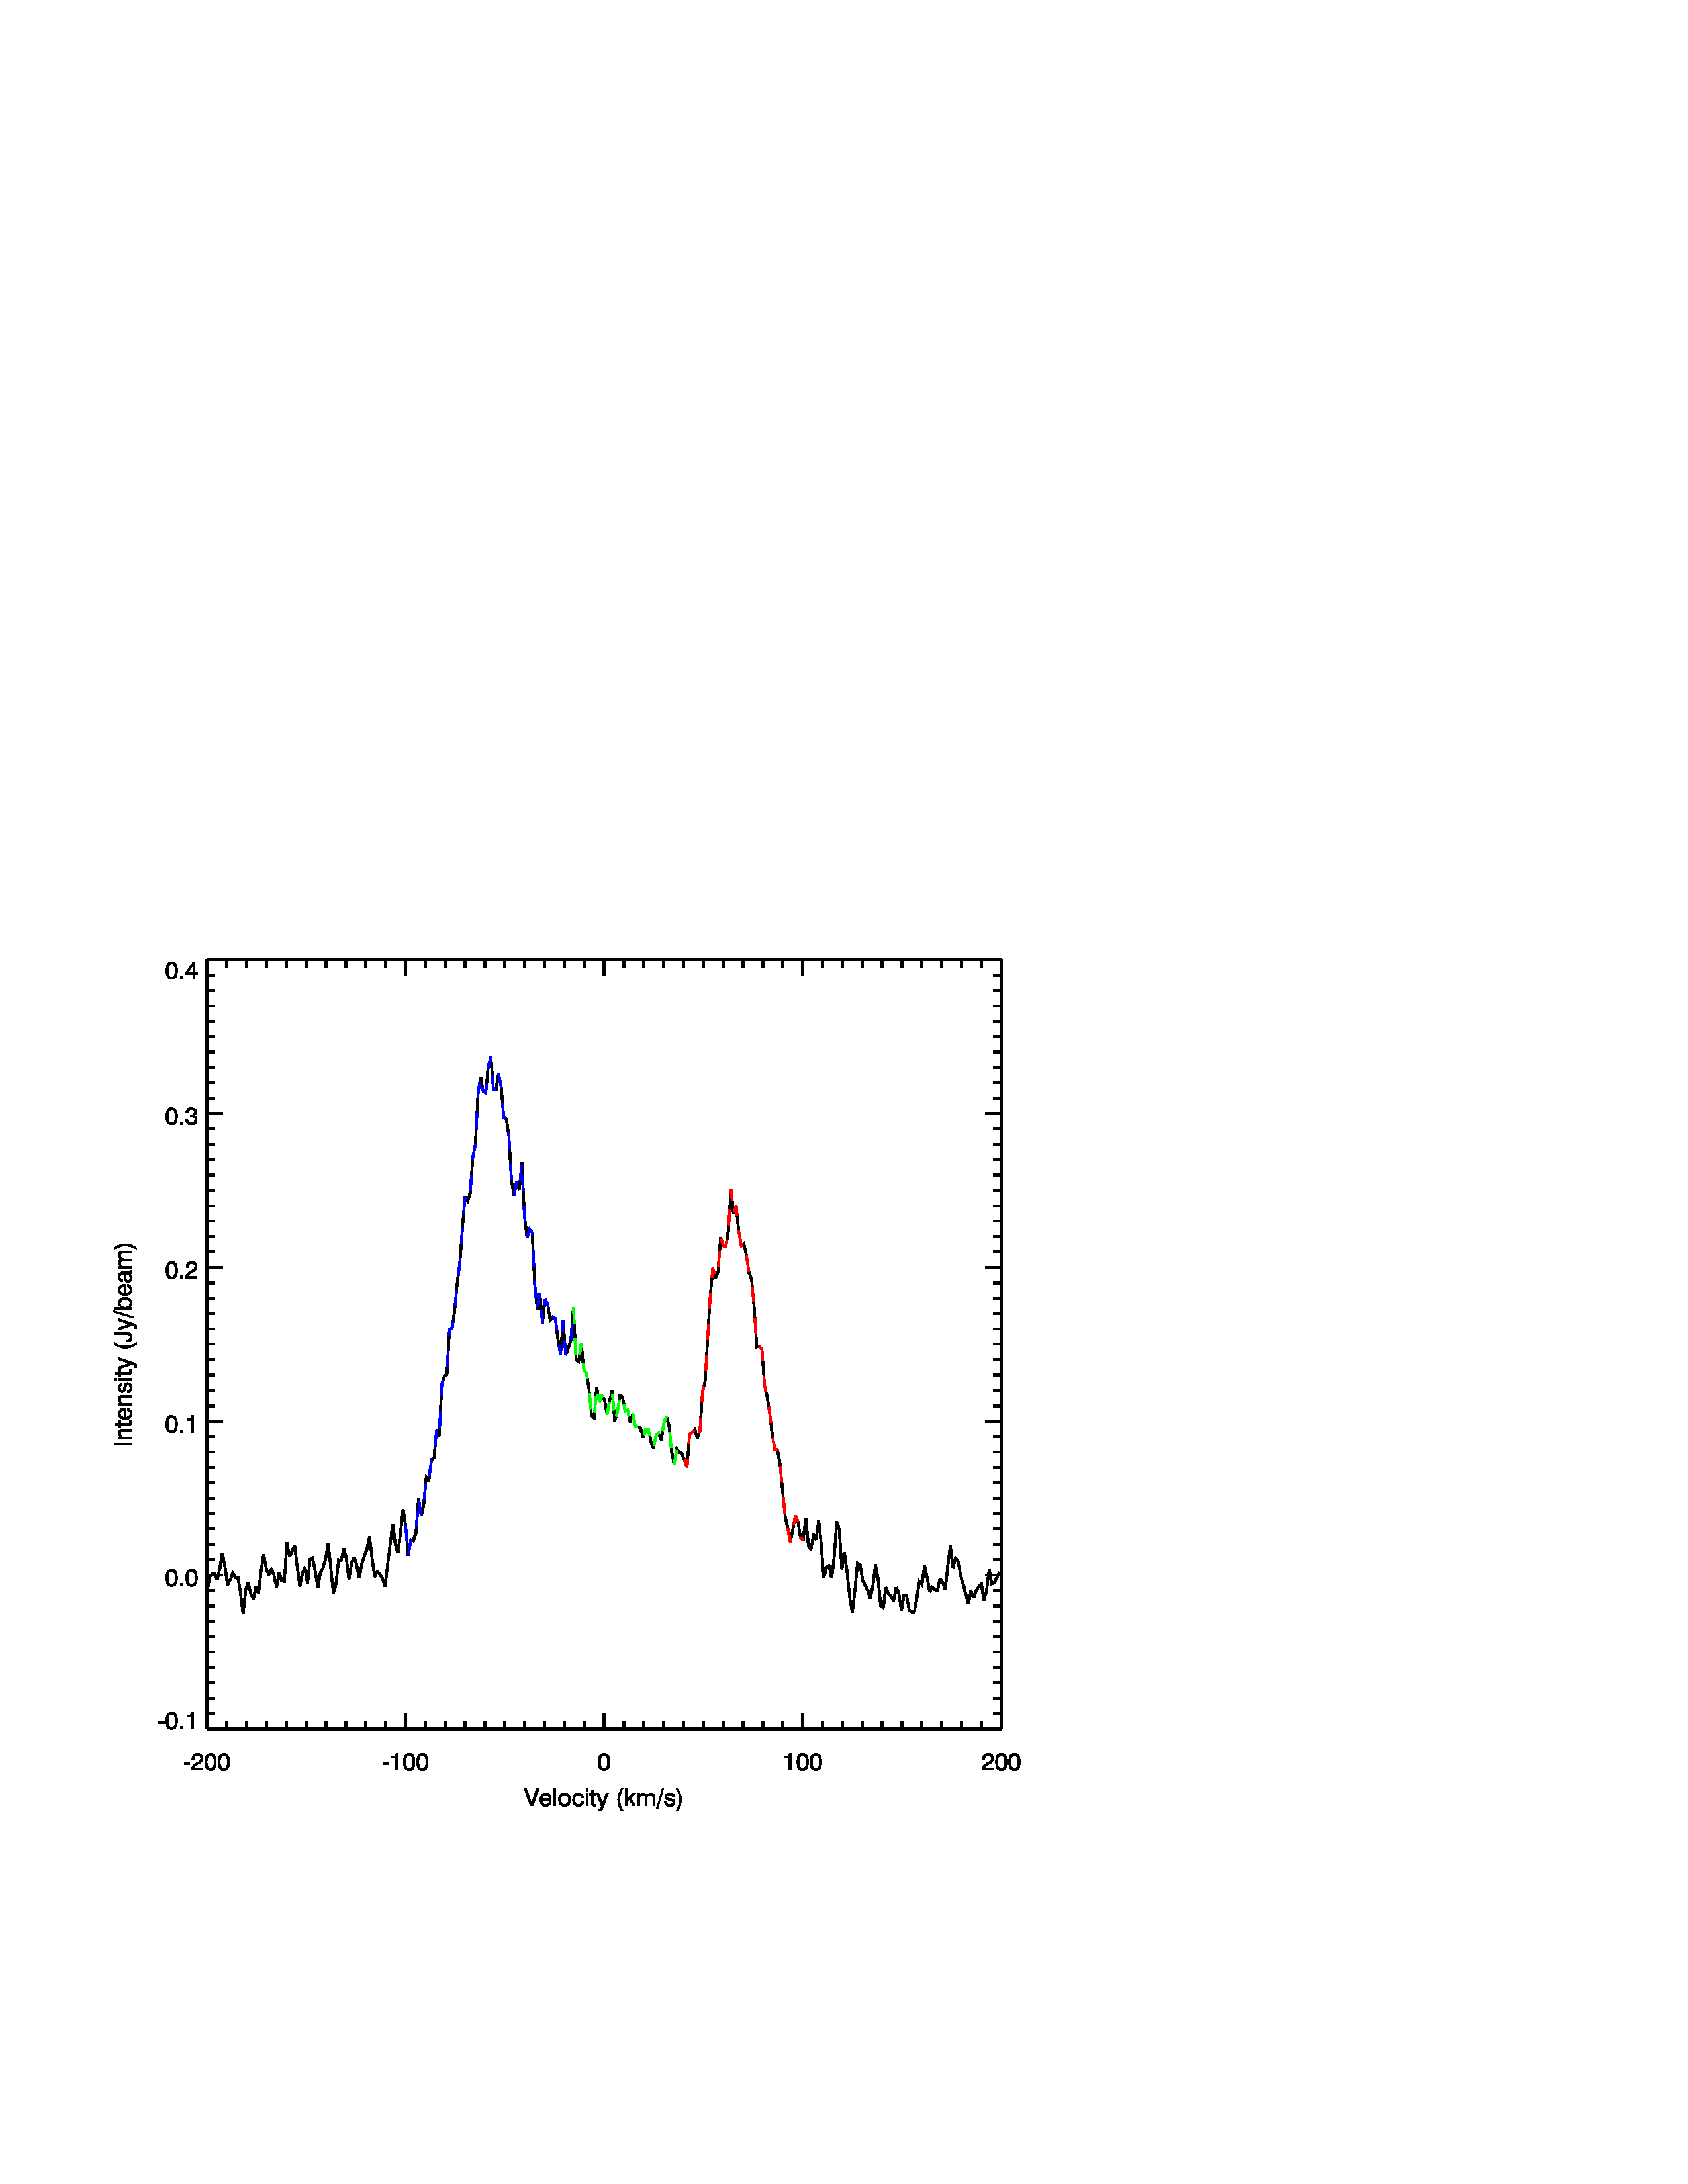
In the absence of clear signatures of inflowing gas we do not attempt to estimate an exhaustive streaming inflow rate. Instead we show two examples of spectra in apertures for which we found the strongest signatures of non circular motions which could be explained by our toy streaming model (see Sect. 3.7) and use these to roughly estimate the mass involved in the inflow. In the E inner spiral we use the spectra of apertures 1 and 2 of Fig. 13. These spectra are shown in Fig. 16, with the red overlay denoting the velocities over which the emission is from gas potentially participating in the streaming inflows. For each of these apertures we find masses of potentially participating in a streaming inflow. We performed the same exercise with four apertures in the outer extension of the E spiral arm (not shown) and find a median mass of potentially participating in a streaming inflow.
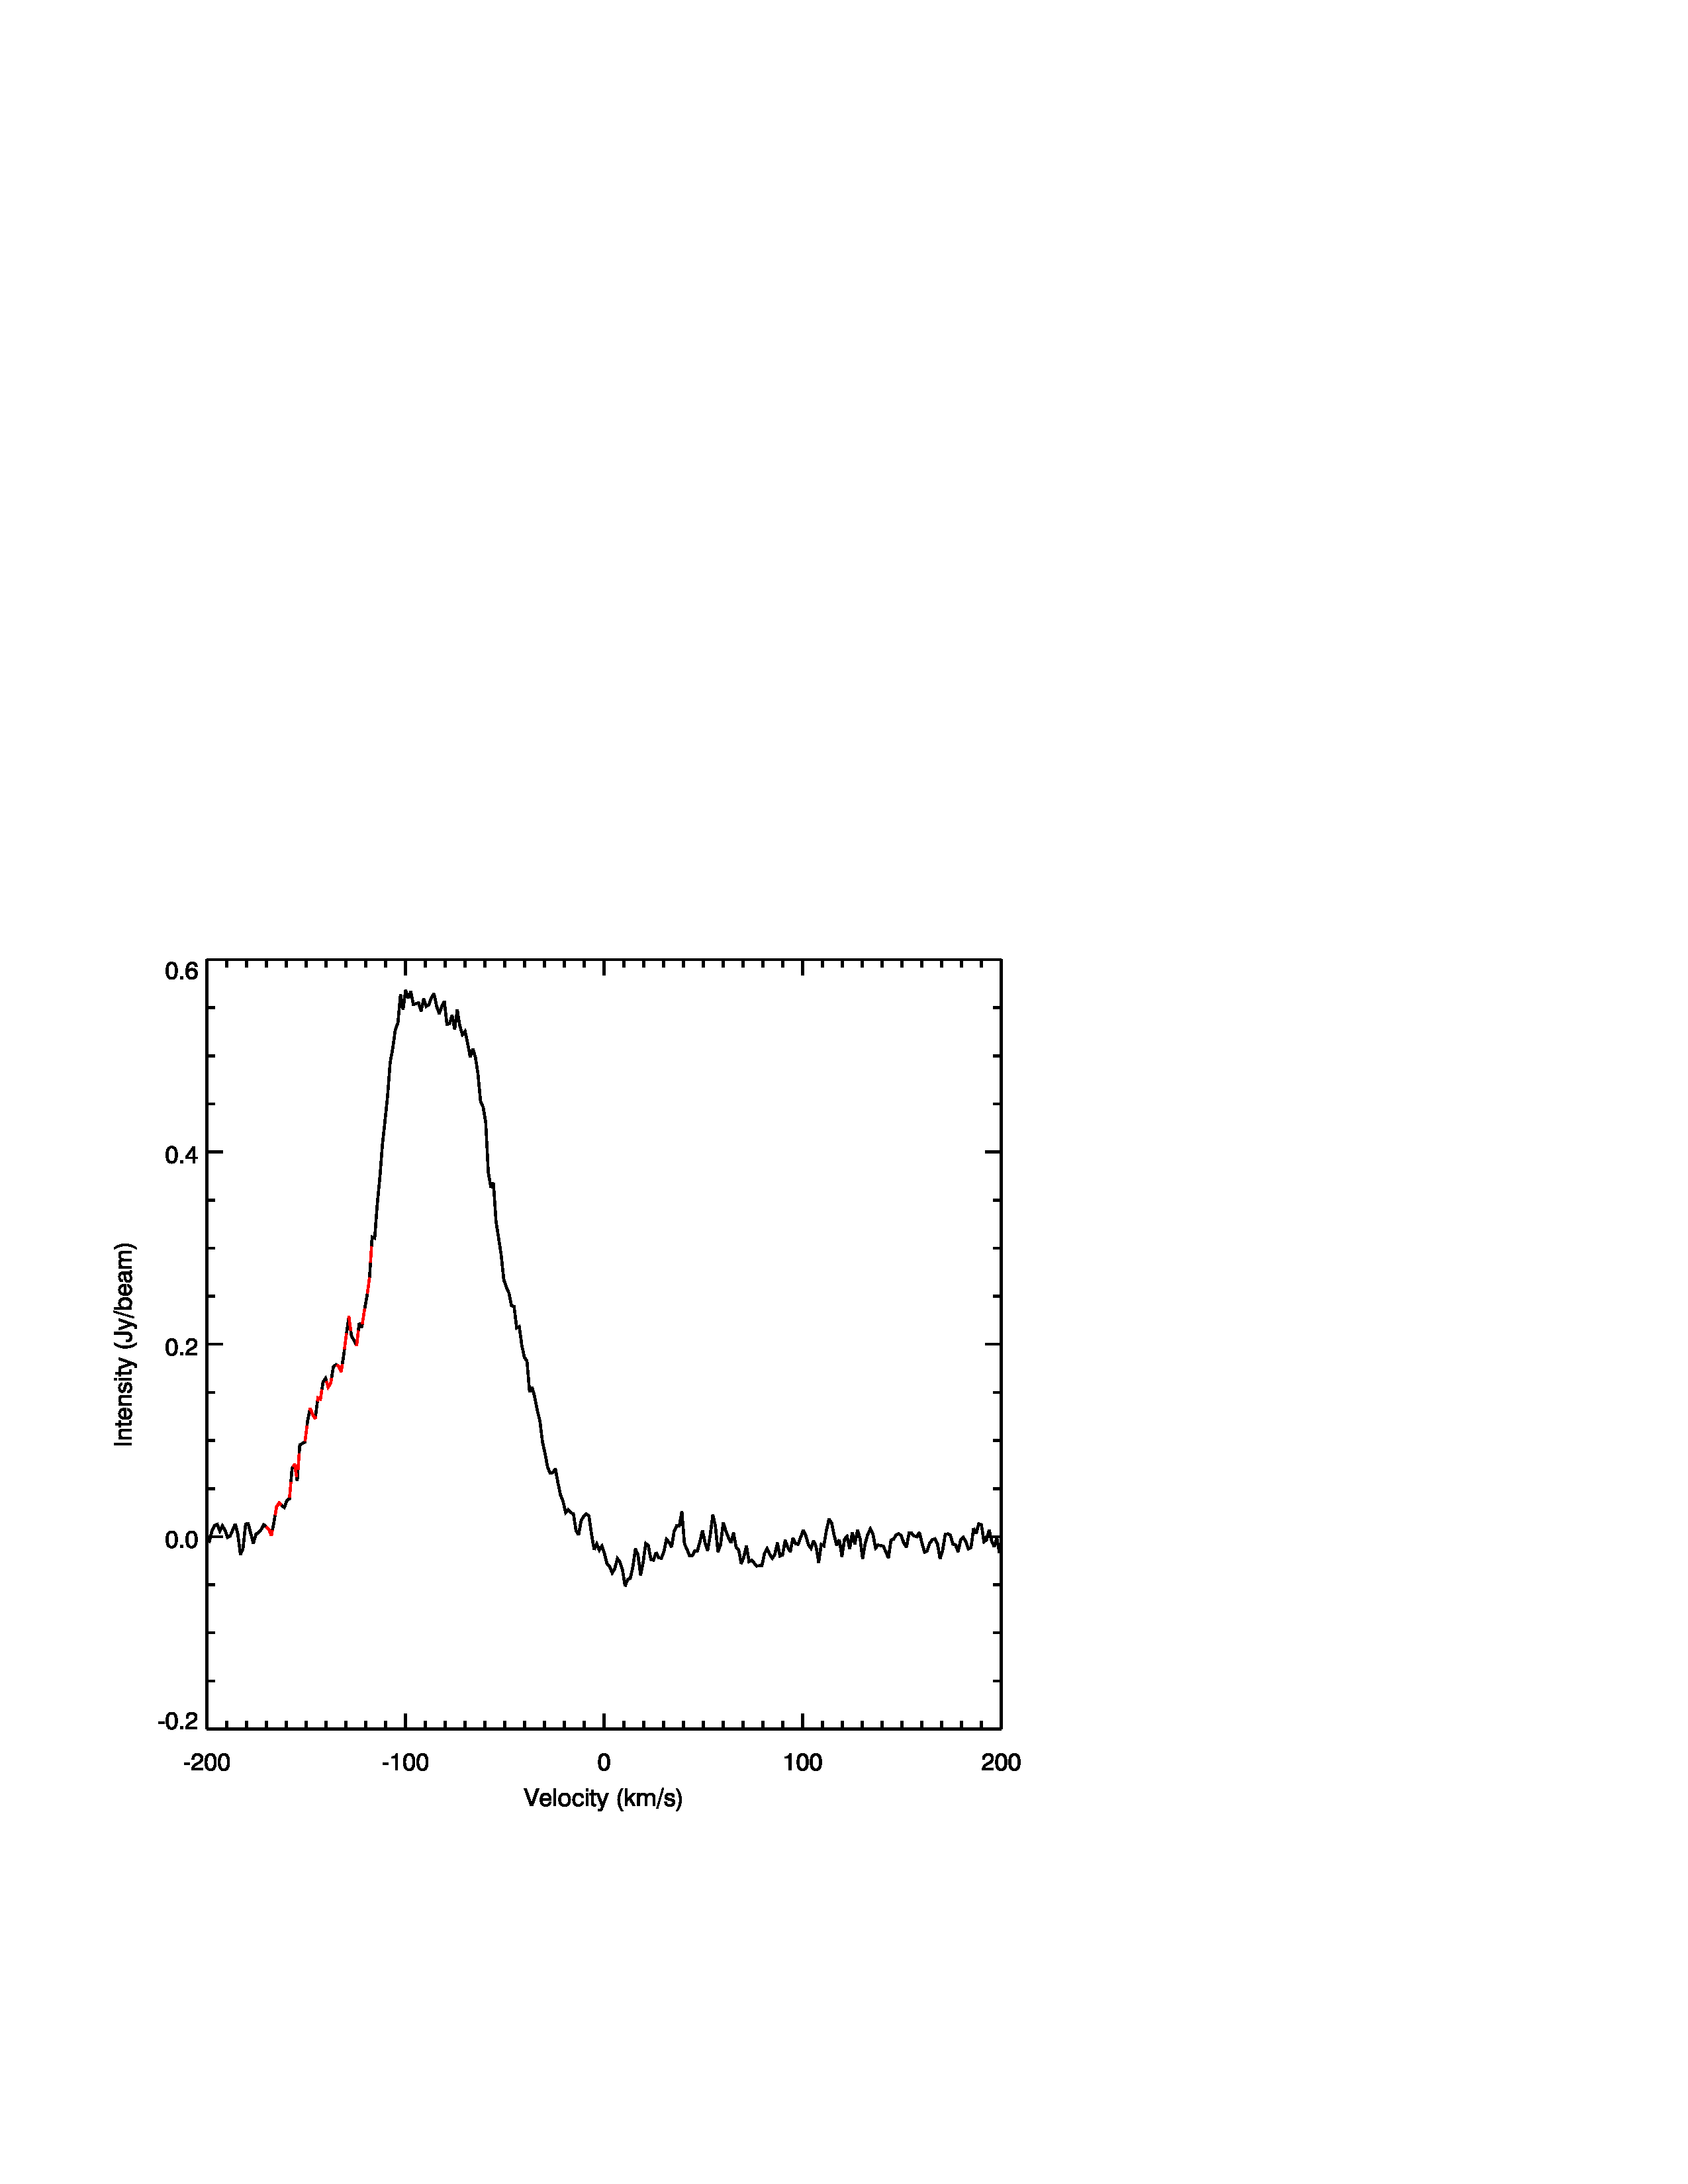
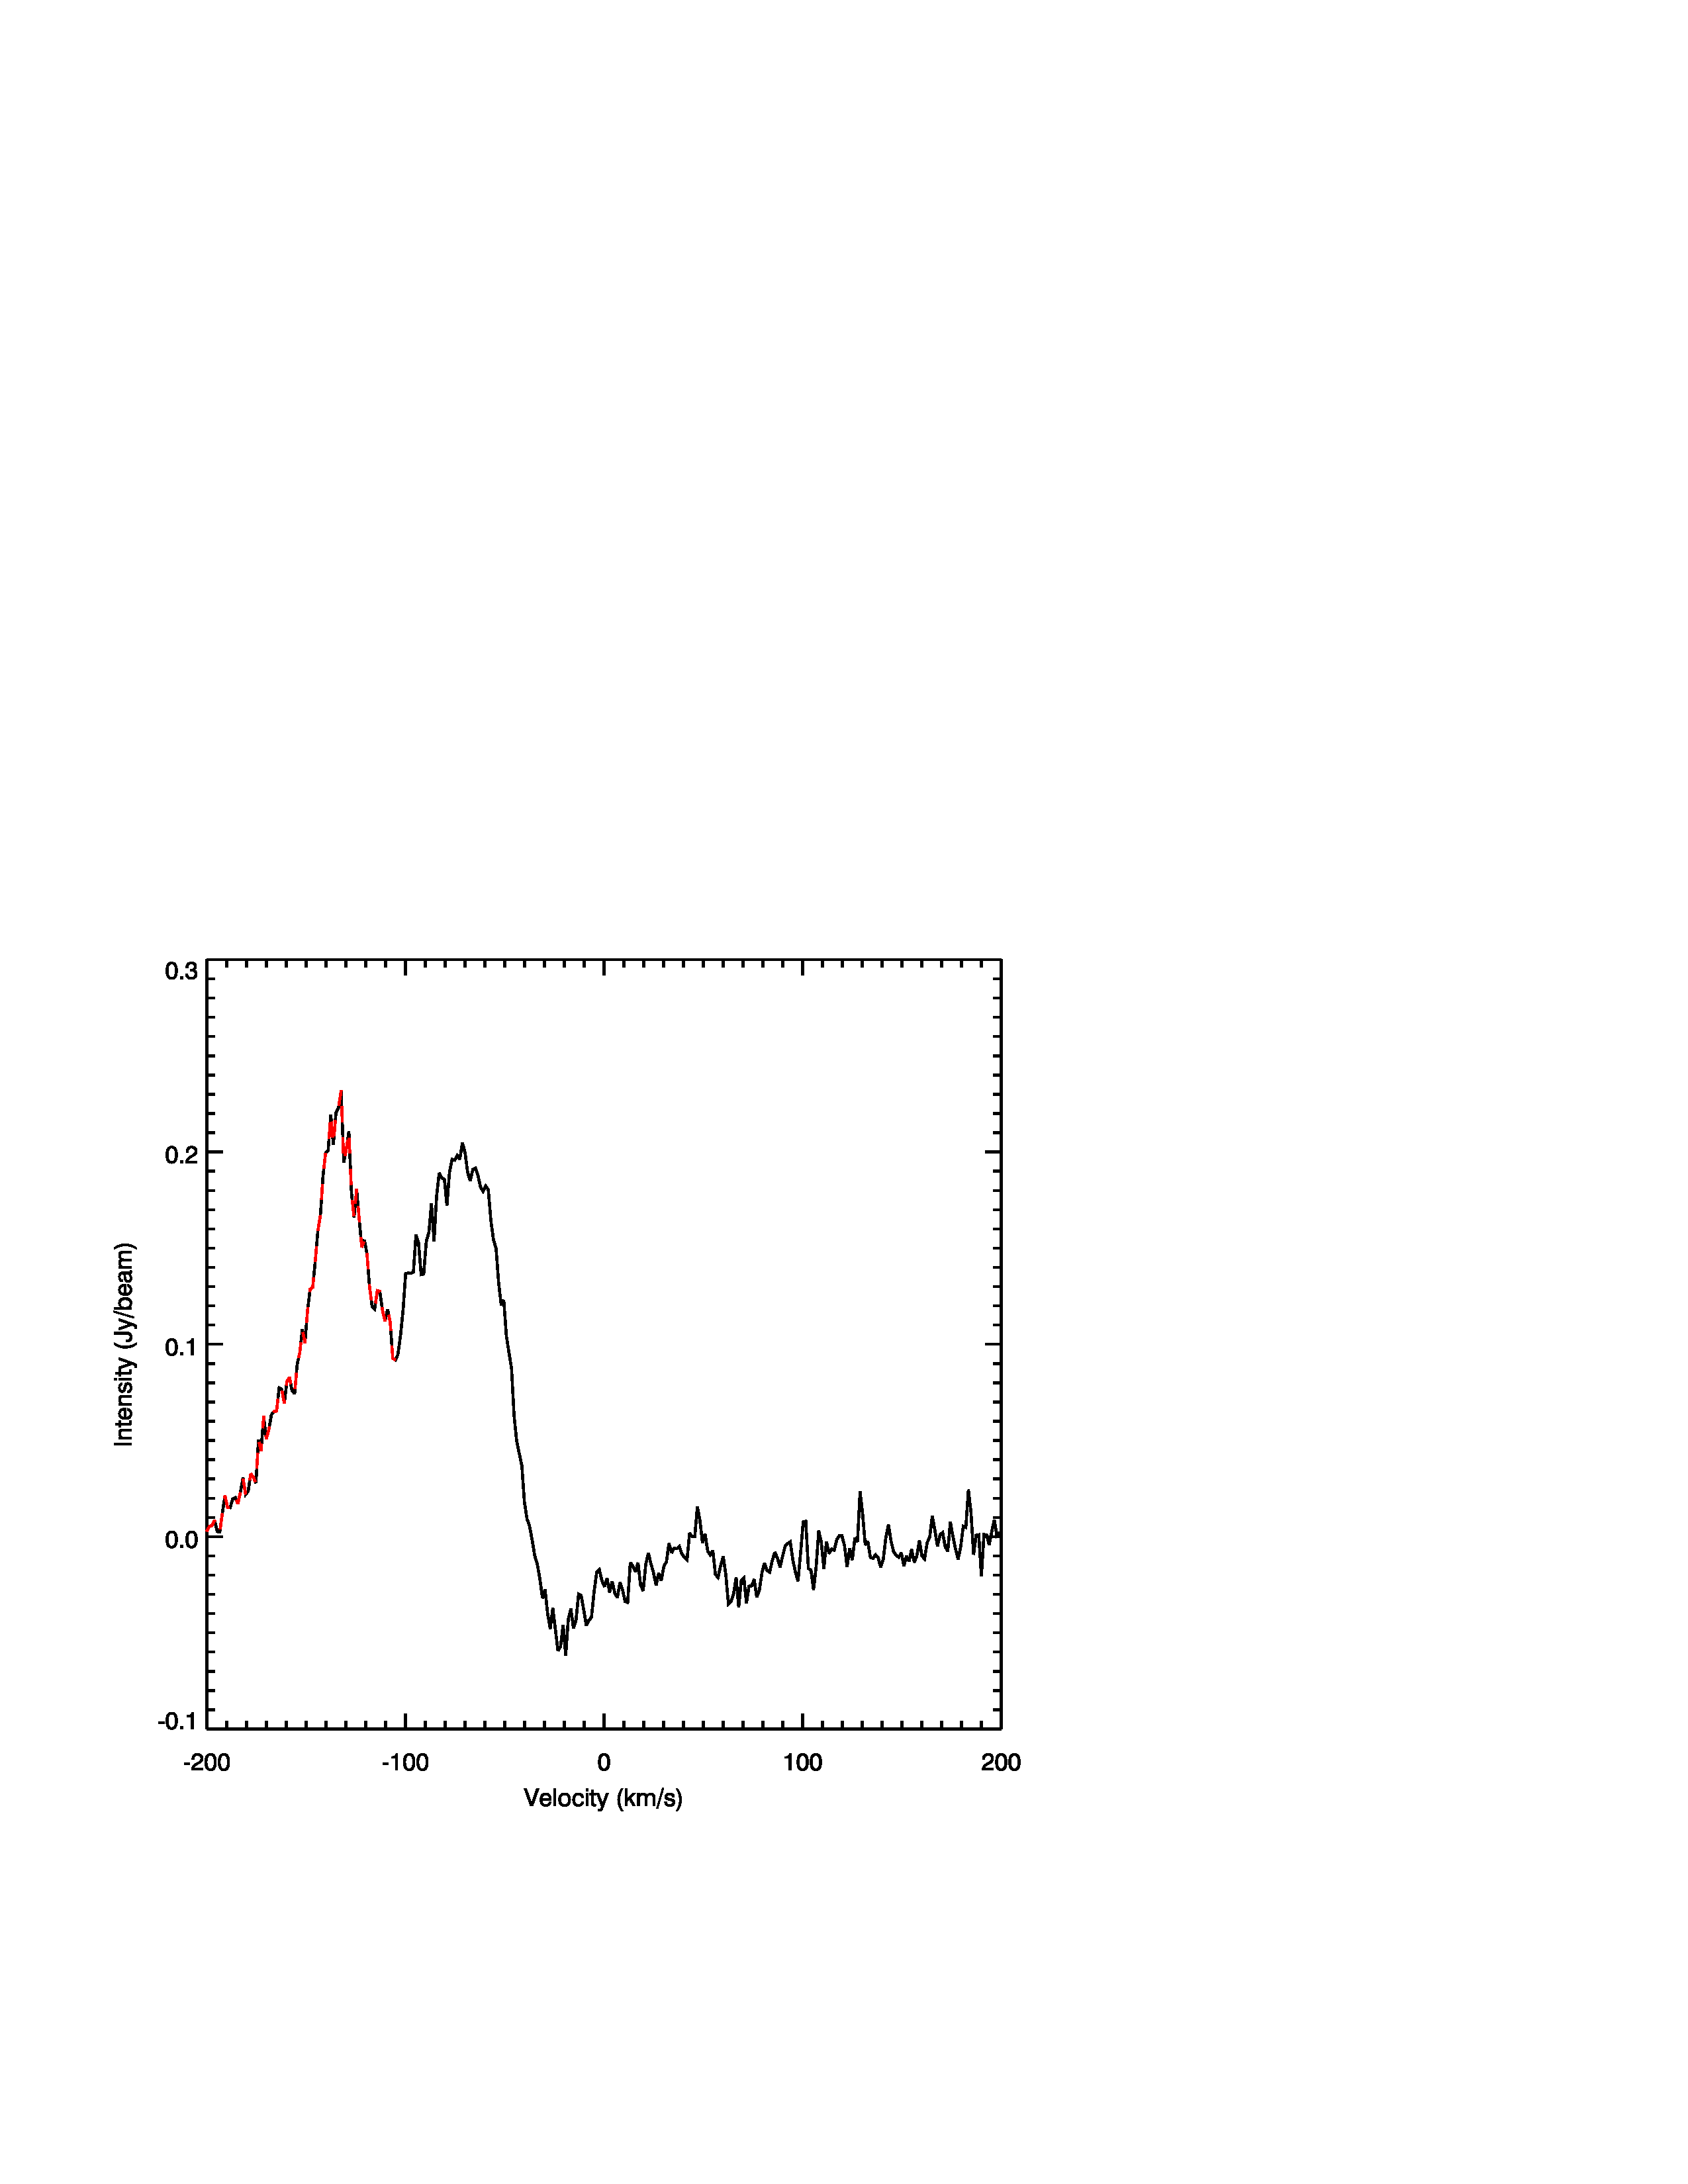
3.9 Mass of the SMBH in NGC 1566
To estimate the black hole mass in NGC 1566 , we use the empirical correlation between SMBH mass and stellar velocity dispersion (Ferrarese & Merritt, 2000; Gebhardt et al., 2000; Tremaine et al., 2002; Gültekin et al., 2009; Kormendy & Ho, 2013). Note that this M- relationship can also be reliably applied to nearby AGNs (Nelson et al., 2004; Woo et al., 2010; Graham et al., 2011). While there are several versions of the M- relation we use that of Gültekin et al. (2009) for their entire sample for several reasons; they demonstrate that previous studies are biased by considering culled samples according whether the SMBH sphere of influence is resolved (see Sect. 4 of their paper). Therefore we get:
| (3) |
where , is the central velocity dispersion in km s-1. To obtain the latter, we fit the integrated spectrum from our GMOS/IFU datacube with the program pPXF described in Cappellari & Emsellem (2004). The spectrum from 5700Å to 6300Å was fit in pPXF using SSPs templates from Bruzual & Charlot (2003), obtaining a central stellar velocity dispersion of km s-1. This value is consistent with that obtained using from Bottema (1992) for the innermost region in NGC 1566, and larger than the bulge stellar velocity dispersion used in other previous studies (van der Kruit & Freeman, 1984; Nelson & Whittle, 1995; Woo & Urry, 2002).
Our measured value of implies an estimated super massive black hole mass of .
3.10 Bolometric luminosity and accretion, inflow, and outflow rates
Given the SMBH mass estimated above, for which the Eddington Luminosity is , we would like to ascertain the bolometric luminosity of the AGN as well the Eddington ratio ( = .
Several differing values for for NGC 1566 have been obtained in previous studies. Here we use two different approaches to estimate : from the nuclear [O III] luminosity, and from the nuclear hard X-ray luminosity. The nuclear 2–10 keV luminosity as measured by XMM and scaled to our adopted distance (10 Mpc) is (Levenson et al., 2009). Using the hard X-ray to bolometric luminosity conversion of Ulvestad & Ho (2001) () we obtain . The nuclear [O III] flux (Moustakas et al., 2010) at our adopted distance gives . Using the scaling of Heckman et al. (2004) modified as recommended in Dumas et al. (2007) () we obtain . These two methods thus give relatively consistent values for and we thus adopt the mean value of which implies , i.e. a relatively low efficiency regime for the SMBH, considering the fact that in the most active galaxies, gas is accreted onto the SMBH in a efficient regime with ratios between 0.01-1 (Khorunzhev et al., 2012). We can now estimate the mass accretion rates as follows:
| (4) |
where is the accretion efficiency which in nearby galaxies with geometrically thin, optically thick accretion disks, is typically taken to be 0.1 (Soltan, 1982; Fabian & Iwasawa, 1999; Yu & Tremaine, 2002; Davis & Laor, 2011). We thus get an accretion rate of .
We note that very discrepant values of were obtained by Woo & Urry (2002) who integrated the flux in the spectral energy distribution (SED) of NGC 1566 using data from NED, after averaging multiple datapoints in the same band and correcting for dust. The value of they obtained, scaled to our adopted distance, is LBol = . This implies and an accretion rate of , 3 orders of magnitude higher than the values obtained above. Two potential reasons for this large discrepancy are (a) flux variability in the hard X-ray, see e.g. Landi et al. (2005); (b) the use of large (galaxy-wide), rather than nuclear, apertures for the data in NED. In Sect. 3.8 we roughly estimated the mass of the molecular gas potentially participating in streaming inflows using six apertures along the SSE to E spiral arm. This can be used to estimate a rough mass inflow rate. The radius of each aperture (02) corresponds to a linear diameter of 19 pc. A streaming inflow velocity of km s-1 would imply an aperture crossing time of , and thus a mass inflow rate of along this spiral arm.
A similar procedure can be used to estimate the outflow rates. We use the molecular masses deduced for the blue and red components of the outflows in the nuclear (02 radius) aperture (see Sect. 3.8 and Fig. 15). In Sect. 3.3 we have argued that the velocity of the outflows in the nucleus is km s-1 in the plane of the disk, which gives a crossing time of around for the nuclear 02 aperture used. The nuclear molecular mass outflow rates are thus for the blueshifted component and for the redshifted component. Note that these outflows do not appear to escape from the nucleus, but instead ‘pile up’ in the inner gas ring (see the CO residual map and pv diagrams). We can also estimate the kinetic power associated with cold molecular outflow following, e.g., Harrison et al. (2014) and Lena (2015):
| (5) |
Assuming a nuclear velocity dispersion of 60 km s-1(see Fig. 6) and, as mentioned above, km s-1, we obtain a total outflow kinetic power (over both blue and red outflow components) of . The ratio between the outflow kinetic power and the AGN bolometric luminosity is thus . This is significantly larger than the values obtained in previous studies of nearby active galaxies which found ranging between 0.1-10% (e.g. Storchi-Bergmann et al., 2010; Müller-Sánchez et al., 2011; Harrison et al., 2014; Lena, 2015; Müller-Sánchez et al., 2016) or even lower (e.g. Barbosa et al., 2009, less than 0.01%). However all of these studies have measured outflow masses using ionized gas, which is expected to be a minor fraction of the total gas content and also, using measurements on larger spatial scales than those considered here (04 or 24 pc).
4 Summary and Conclusions
We have analyzed the kinematics in the inner kiloparsec of the nearby active galaxy NGC 1566, using ALMA observations of CO J:2-1 along with GMOS/IFU data of ionized gas emission lines and stellar absorption lines. Our results allow us to conclude that:
-
•
NGC 1566 presents a cold molecular dense disk in the inner 144 pc, along with a clear two-arm spiral structure in the inner 96 pc. These structures are also seen in our ionized gas ([N II]) images, as well as in previous studies using CO J:3-2 and optical/IR emission lines. The inner spiral arms and dense disk appear to have some continuity with more extended CO J:2-1 spiral arms which extend out of the inner disk to larger scales, and which coincide with dust lanes seen in HST images.
-
•
Ionized gas and stars are detected over the full IFU FOV at high signal to noise. The [N II] emission is peaked at the nucleus and is also strong at the known star-forming region to the SW, about 15 from the nucleus.
-
•
The superior spectral resolution (2.6 km s-1) and image fidelity in this new CO J:2-1 datacube allows improved constraints on the nuclear kinematics. Further, our use of pv diagrams (rather than only intensity weighted velocity maps) allows the full exploitation of our velocity resolution. The molecular gas kinematics of the inner disk is dominated by rotation with peak velocities of 140 km s-1. The residual velocity field shows clear signs of non rotational motion especially in the innermost 2″ region. We argue that the strongest deviations are the result of nuclear outflows, though the strong two-arm inner spiral structure and large-scale bar also play a role. The CO rotational curve over the inner 3″ is asymmetric, which could be the consequence of a warped disk. PV diagrams at PAs between 15° to 15° show some discrepancies from our rotation + outflow model at radii 15 from the nucleus. These discrepancies could be explained by perturbations due to the barred potential and/or streaming velocities.
-
•
We argue for the presence of nuclear (inner 2″) molecular gas outflows in the plane of the galaxy disk, without ruling out the presence of bar- or spiral-related perturbations (see Sect. 3.6 for a detailed analysis of the potential bar influence). The arguments for a nuclear outflow include: (a) several previous authors have claimed kinematic and morphological evidence of outflows in the NLR, which likely intersect the galaxy disk given the observed geometries; (b) The nucleus shows a double-peaked profile with FWZI 200 km s-1, higher than that seen in the lower fidelity maps of C14, and which imply inclination corrected outflow velocities of up to 180 km s-1 in the plane of the disk. A large angle between the outflow axis and the line of sight is unlikely since this would imply extremely high true outflow velocities. Attributing these velocity features to other perturbations in the plane of the disk and along the minor axis requires true radial velocities around 80–130 km s-1in the nuclear region where rotation velocities are expected to be 40 km s-1. In Sect. 3.6 we analysed the large scale bar perturbation and its implications, showing that it does not reliably produce both the morphology and the large perturbations seen in the observed velocity field; (c) the pv diagram along the minor axis (bottom right panel of Fig. 9) connects high-velocity components to the zero velocity components seen at r 18 on both sides of the nucleus. The regions with the largest velocity deceleration are correlated with the regions brightest in CO and thus richest in molecular gas, indicating that the outflows decelerate due to mass loading which is clearly seen in the inner arcsec to the N and in the r 1–2″ range to the S; (d) the pv diagrams (Fig. 9) show velocity deviations which are consistent with radial outflows not just in the minor axis, but also in the plane of the disk over all PAs and over apertures at distances of several synthesized beams from the nucleus (see Sect. 3.5); and (e) the consistence with the evidence of a nuclear spherical (or bipolar) outflow in our ionized gas kinematics. We also argue that the molecular outflow is primarily detected within the galaxy disk. The supporting arguments for this include the low velocity dispersion of the molecular gas, the absence of evidence for radio jet-related outflows, the posited deceleration of the outflow, which would be consistent with the high density of gas in the galaxy disk. Other potential scenarios as warped disk or non coplanar disk cannot be constrained by us due to the limited resolution, the sparse velocity field and the lack of a reliable circular rotation model.
-
•
While the stellar and ionized gas kinematics predominantly traces rotation in the galaxy disk, we find evidence of two components in the ionized gas: a narrow (60 km s-1) component detected over almost the full field of view and which traces rotation in the disk, and a broad component detected in the inner 3″radius. We postulate that the broad component of ionized gas is part of a nuclear spherical outflow. The broad component of the [N II] emission line does not participate in the rotation of the galaxy disk. Instead it is preferentially blueshifted, as expected since nuclear dust obscures the receding side of the spherical outflow. Its velocity dispersion, velocity, and the correlation with strong and weaker dust features in the nucleus all strengthen the arguments for the spherical ionized gas outflow. Despite this, we are not ruling out the possibility of a bipolar outflow which currently is impeded by a poor resolution in the GMOS data. We are unable to test for deceleration in this outflow.
-
•
We have constrained and analyzed the circular vs. perturbed kinematics of the CO gas in the disk using Kinemetry, Diskfit, and linear perturbation theory. Large radial velocity perturbations are clearly required. The Diskfit model better fits the observed data as compared to the pure rotation model, but still does not attain the highest velocities seen in the inner arcsecs and fails to predict the large peak velocities seen along the minor axis in pv diagram (bottom middle panel in Fig. 12). The relatively good fits obtained by Diskfit do not necessarily imply that the perturbations are bar related. Our concerns here include the lack of definition of the physical parameters (e.g., pattern speed) used, and our findings that Diskfit typically provides good fits to perturbed kinematics of other similar datasets, even in the absence of a bar. For our linear epicyclic perturbation (in the presence of a bar or m=2 mode) modelling, which provides a more physically-based model as compared to Diskfit, we used two input rotation models, one based on the best-fit gas rotation model and one on the best-fit stellar rotation model. In both cases we varied the bar pattern speed and damping factor. While the perturbed velocity fields show the characteristic butterfly pattern expected from bar perturbations, very high pattern speeds ( 300 km s-1 kpc-1) are required to cause a resonance close to r1″ and thus explain the observed high-velocity features along the minor axis. We note however that if the true distance to NGC 1566 is higher, the problem of high pattern speeds is mitigated. Even if the resonance radii are matched, the velocity structures seen in the models are not aligned with or as sharp as those observed.
-
•
We are unable to definitely prove the existence of streaming inflows based on the kinematics of the molecular or ionized gas. This is in part due to the line profiles being complex with evidence of multiple velocity components, and also due to an asymmetry in the velocity profiles of the near and far sides of the disk, which could be due to disk warping or the non-axisymmetric potential. We present and analyze specific apertures along a spiral arm where the spectral profiles are similar to those expected from our toy streaming inflow model and from these we estimate a potential streaming inflow rate of .
-
•
We estimate the molecular mass of the unresolved nuclear outflow (the innermost 02 aperture) as and its momentum as km s-1] and km s-1] for the blue and red outflows, respectively. Summing all gas believed to be participating in the nuclear outflow (out to or 72 pc from the nucleus) we find a mass of . Given the nuclear velocities, the implied outflow rates from the nuclear 02 region are for the blueshifted component and for the redshifted component. We emphasize that these outflows appear to decelerate within the inner 100 pc and thus the gas is not lost to the galaxy nucleus.
-
•
We have used the results of three methods to estimate : from the nuclear [O III] luminosity, from the nuclear hard X-ray luminosity, and from a SED fit. The first two methods give consistent results: a mean value of , which implies of , indicating a relatively low efficiency regime for the SMBH, and an accretion rate of , significantly smaller than the posited nuclear molecular outflow rate.
-
•
A direct comparison between the molecular outflow kinetic power and the AGN bolometric luminosity gives a ratio of , a value significantly larger than typical values (between 0.01–10%) found from previous studies ionized gas in nearby AGNs. This supports the idea that the ionized gas is a minor fraction of the total gas content.
Acknowledgements.
We thank to the anonymous referee for the very constructive comments that made to improve this work. This paper makes use of the following ALMA data: ADS/JAO.ALMA#2012.1.00474.S . ALMA is a partnership of ESO (representing its member states), NSF (USA) and NINS (Japan), together with NRC (Canada), NSC and ASIAA (Taiwan), and KASI (Republic of Korea), in cooperation with the Republic of Chile. The Joint ALMA Observatory is operated by ESO, AUI/NRAO and NAOJ. Based on observations obtained at the Gemini Observatory, which is operated by the Association of Universities for Research in Astronomy, Inc., under a cooperative agreement with the NSF on behalf of the Gemini partnership: the National Science Foundation (United States), the National Research Council (Canada), CONICYT (Chile), Ministerio de Ciencia, Tecnología e Innovación Productiva (Argentina), and Ministério da Ciência, Tecnologia e Inovação (Brazil). This is research has made use of the services of the ESO Science Archive Facility. N.N. acknowledges support from BASAL-PFB/06 and extension, Fondecyt 1171506, and Anillo ACT172033. R.A.R. acknowledges support from FAPERGS (project N0. 2366-2551/14-0) and CNPq (project N0. 470090/2013-8 and 302683/2013-5). We acknowledge the usage of the HyperLeda database (http://leda.univ-lyon1.fr). This research has made use of the NASA/IPAC Extragalactic Database (NED), which is operated by the Jet Propulsion Laboratory, California Institute of Technology, under contract with the National Aeronautics and Space Administration. IRAF is distributed by the National Optical Astronomy Observatory, which is operated by the Association of Universities for Research in Astronomy (AURA) under a cooperative agreement with the National Science Foundation. G.O. acknowledges the support provided by CONICYT(Chile) through FONDECYT postdoctoral research grant no 3170942.R.S. acknoledges support from CONICYT Beca/Nacional-Doctorado 21120516.References
- Agüero et al. (2004) Agüero, E. L., Díaz, R. J., & Bajaja, E. 2004, A&A, 414, 453
- Alloin et al. (1985) Alloin, D., Pelat, D., Phillips, M., & Whittle, M. 1985, ApJ, 288, 205
- Bajaja et al. (1995) Bajaja, E., Wielebinski, R., Reuter, H.-P., Harnett, J. I., & Hummel, E. 1995, A&AS, 114, 147
- Barbosa et al. (2009) Barbosa, F. K. B., Storchi-Bergmann, T., Cid Fernandes, R., Winge, C., & Schmitt, H. 2009, MNRAS, 396, 2
- Barbosa et al. (2014) Barbosa, F. K. B., Storchi-Bergmann, T., McGregor, P., Vale, T. B., & Rogemar Riffel, A. 2014, MNRAS, 445, 2353
- Bertola et al. (1991) Bertola, F., Bettoni, D., Danziger, J., et al. 1991, ApJ, 373, 369
- Bolatto et al. (2013) Bolatto, A. D., Wolfire, M., & Leroy, A. K. 2013, ARA&A, 51, 207
- Bottema (1992) Bottema, R. 1992, A&A, 257, 69
- Bruzual & Charlot (2003) Bruzual, G., & Charlot, S. 2003, MNRAS, 344, 1000
- Cappellari & Emsellem (2004) Cappellari, M., & Emsellem, E. 2004, PASP, 116, 138
- Cicone et al. (2014) Cicone, C., Maiolino, R., Sturm, E., et al. 2014, A&A, 562, A21
- Combes et al. (2014) Combes, F., García-Burillo, S., Casasola, V., et al. 2014, A&A, 565, A97
- Comerón et al. (2010) Comerón, S., Knapen, J. H., Beckman, J. E., et al. 2010, MNRAS, 402, 2462
- Crenshaw et al. (2003) Crenshaw, D. M., Kraemer, S. B., & Gabel, J. R. 2003, AJ, 126, 1690
- da Silva et al. (2017) da Silva, P., Steiner, J. E., & Menezes, R. B. 2017, MNRAS, 470, 3850
- Davies et al. (2016) Davies, R. L., Dopita, M. A., Kewley, L., et al. 2016, ApJ, 824, 50
- Davis & Laor (2011) Davis, S. W., & Laor, A. 2011, ApJ, 728, 98
- de Vaucouleurs (1973) de Vaucouleurs, G. 1973, ApJ, 181, 31
- Dicaire et al. (2008) Dicaire, I., Carignan, C., Amram, P., et al. 2008, MNRAS, 385, 553
- Diniz et al. (2015) Diniz, M. R., Riffel, R. A., Storchi-Bergmann, T., & Winge, C. 2015, MNRAS, 453, 1727
- Dumas et al. (2007) Dumas, G., Mundell, C. G., Emsellem, E., & Nagar, N. M. 2007, MNRAS, 379, 1249
- Ehle et al. (1996) Ehle, M., Beck, R., Haynes, R. F., et al. 1996, A&A, 306, 73
- Elvis et al. (1989) Elvis, M., Fassnacht, C., Wilson, A. S., & Briel, U. 1989, European Southern Observatory Conference and Workshop Proceedings, 32, 243
- Erwin (2004) Erwin, P. 2004, A&A, 415, 941
- Fabian & Iwasawa (1999) Fabian, A. C., & Iwasawa, K. 1999, MNRAS, 303, L34
- Fathi (2004) Fathi, K. 2004, Ph.D. Thesis,
- Fathi et al. (2005) Fathi, K., van de Ven, G., Peletier, R. F., et al. 2005, MNRAS, 364, 773
- Ferrarese & Ford (2005) Ferrarese, L., & Ford, H. 2005, Space Sci. Rev., 116, 523
- Ferrarese & Merritt (2000) Ferrarese, L., & Merritt, D. 2000, ApJ, 539, L9
- Finlez et al. (in prep.) Finlez, C., Nagar, N., and others 2018, PhD thesis work.
- Franx et al. (1994) Franx, M., van Gorkom, J. H., & de Zeeuw, T. 1994, ApJ, 436, 642
- García-Burillo et al. (2014) García-Burillo, S., Combes, F., Usero, A., et al. 2014, A&A, 567, A125
- Gebhardt et al. (2000) Gebhardt, K., Bender, R., Bower, G., et al. 2000, ApJ, 539, L13
- Graham et al. (2011) Graham, A. W., Onken, C. A., Athanassoula, E., & Combes, F. 2011, MNRAS, 412, 2211
- Greenhill et al. (2003) Greenhill, L. J., Booth, R. S., Ellingsen, S. P., et al. 2003, ApJ, 590, 162
- Gruppioni et al. (2016) Gruppioni, C., Berta, S., Spinoglio, L., et al. 2016, MNRAS, 458, 4297
- Gültekin et al. (2009) Gültekin, K., Richstone, D. O., Gebhardt, K., et al. 2009, ApJ, 698, 198
- Hackwell & Schweizer (1983) Hackwell, J. A., & Schweizer, F. 1983, ApJ, 265, 643
- Harrison et al. (2014) Harrison, C. M., Alexander, D. M., Mullaney, J. R., & Swinbank, A. M. 2014, MNRAS, 441, 3306
- Heckman & Best (2014) Heckman, T. M., & Best, P. N. 2014, ARA&A, 52, 589
- Heckman et al. (2004) Heckman, T. M., Kauffmann, G., Brinchmann, J., et al. 2004, ApJ, 613, 109
- Hollyhead et al. (2016) Hollyhead, K., Adamo, A., Bastian, N., Gieles, M., & Ryon, J. E. 2016, MNRAS, 460, 2087
- Kawamuro et al. (2013) Kawamuro, T., Ueda, Y., Tazaki, F., & Terashima, Y. 2013, ApJ, 770, 157
- Kendall et al. (2011) Kendall, S., Kennicutt, R. C., & Clarke, C. 2011, MNRAS, 414, 538
- Khorunzhev et al. (2012) Khorunzhev, G. A., Sazonov, S. Y., Burenin, R. A., & Tkachenko, A. Y. 2012, Astronomy Letters, 38, 475
- Kilborn et al. (2005) Kilborn, V. A., Koribalski, B. S., Forbes, D. A., Barnes, D. G., & Musgrave, R. C. 2005, MNRAS, 356, 77
- Korchagin et al. (2000) Korchagin, V., Kikuchi, N., Miyama, S. M., Orlova, N., & Peterson, B. A. 2000, ApJ, 541, 565
- Kormendy & Ho (2013) Kormendy, J., & Ho, L. C. 2013, ARA&A, 51, 511
- Krajnović et al. (2006) Krajnović, D., Cappellari, M., de Zeeuw, P. T., & Copin, Y. 2006, MNRAS, 366, 787
- Landi et al. (2005) Landi, R., Malizia, A., & Bassani, L. 2005, A&A, 441, 69
- Lena et al. (2015) Lena, D., Robinson, A., Storchi-Bergman, T., et al. 2015, ApJ, 806, 84
- Lena (2015) Lena, D. 2015, Ph.D. Thesis,
- Leroy et al. (2015) Leroy, A. K., Walter, F., Martini, P., et al. 2015, ApJ, 814, 83
- Levenson et al. (2009) Levenson, N. A., Radomski, J. T., Packham, C., et al. 2009, ApJ, 703, 390
- Liu et al. (2013) Liu, G., Zakamska, N. L., Greene, J. E., Nesvadba, N. P. H., & Liu, X. 2013, MNRAS, 436, 2576
- Ma (2001) Ma, J. 2001, Chinese J. Astron. Astrophys., 1,
- Makarov et al. (2014) Makarov D., Prugniel P., Terekhova N., Courtois H., & Vauglin I. 2014, A&A, 570, A13
- Malkan et al. (1998) Malkan, M. A., Gorjian, V., & Tam, R. 1998, ApJS, 117, 25
- McGaugh & Schombert (2014) McGaugh, S. S., & Schombert, J. M. 2014, AJ, 148, 77
- McMullin et al. (2007) McMullin, J. P., Waters, B., Schiebel, D., Young, W., & Golap, K. 2007, Astronomical Data Analysis Software and Systems XVI, 376, 127
- Mezcua et al. (2015) Mezcua, M., Prieto, M. A., Fernández-Ontiveros, J. A., et al. 2015, MNRAS, 452, 4128
- Morganti et al. (1999) Morganti, R., Tsvetanov, Z. I., Gallimore, J., & Allen, M. G. 1999, A&AS, 137, 457
- Morganti et al. (2009) Morganti, R., Peck, A. B., Oosterloo, T. A., et al. 2009, A&A, 505, 559
- Morganti et al. (2013) Morganti, R., Frieswijk, W., Oonk, R. J. B., Oosterloo, T., & Tadhunter, C. 2013, A&A, 552, L4
- Moustakas et al. (2010) Moustakas, J., Kennicutt, R. C., Jr., Tremonti, C. A., et al. 2010, ApJS, 190, 233-266
- Mulchaey et al. (1997) Mulchaey, J. S., Regan, M. W., & Kundu, A. 1997, ApJS, 110, 299
- Müller-Sánchez et al. (2011) Müller-Sánchez, F., Prieto, M. A., Hicks, E. K. S., et al. 2011, ApJ, 739, 69
- Müller-Sánchez et al. (2016) Müller-Sánchez, F., Comerford, J. M., Stern, D., & Harrison, F. A. 2016, arXiv:1606.07446
- Nelson et al. (2004) Nelson, C. H., Green, R. F., Bower, G., Gebhardt, K., & Weistrop, D. 2004, ApJ, 615, 652
- Nelson & Whittle (1995) Nelson, C. H., & Whittle, M. 1995, ApJS, 99, 67
- Nesvadba et al. (2010) Nesvadba, N. P. H., Boulanger, F., Salomé, P., et al. 2010, A&A, 521, A65
- Pence et al. (1990) Pence, W. D., Taylor, K., & Atherton, P. 1990, ApJ, 357, 415
- Ramakrishnan et al. (in prep.) Ramakrishnan, V., Nagar, N., and others 2018.
- Regan & Teuben (2004) Regan, M. W., & Teuben, P. J. 2004, ApJ, 600, 595
- Riffel (2010) Riffel, R. A. 2010, Ap&SS, 327, 239
- Riffel et al. (2013) Riffel, R. A., Storchi-Bergmann, T., & Winge, C. 2013, MNRAS, 430, 2249
- Roche et al. (2016) Roche, N., Humphrey, A., Lagos, P., et al. 2016, MNRAS, 459, 4259
- Roy et al. (1994) Roy, A. L., Norris, R. P., Kesteven, M. J., Troup, E. R., & Reynolds, J. E. 1994, ApJ, 432, 496
- Sakamoto et al. (1999) Sakamoto, K., Okumura, S. K., Ishizuki, S., & Scoville, N. Z. 1999, ApJ, 525, 691
- Sakamoto et al. (2014) Sakamoto, K., Aalto, S., Combes, F., Evans, A., & Peck, A. 2014, ApJ, 797, 90
- Schinnerer et al. (2000) Schinnerer, E., Eckart, A., Tacconi, L. J., Genzel, R., & Downes, D. 2000, ApJ, 533, 850
- Schmitt & Kinney (1996) Schmitt, H. R., & Kinney, A. L. 1996, ApJ, 463, 498
- Schnorr-Müller et al. (2014b) Schnorr-Müller, A., Storchi-Bergmann, T., Nagar, N. M., et al. 2014, MNRAS, 437, 1708
- Schnorr-Müller et al. (2014a) Schnorr-Müller, A., Storchi-Bergmann, T., Nagar, N. M., & Ferrari, F. 2014, MNRAS, 438, 3322
- Schnorr-Müller et al. (2017b) Schnorr-Müller, A., Storchi-Bergmann, T., Ferrari, F., & Nagar, N. M. 2017, MNRAS, 466, 4370
- Schnorr-Müller et al. (2017a) Schnorr-Müller, A., Storchi-Bergmann, T., Nagar, N. M., Robinson, A., & Lena, D. 2017, MNRAS, 471, 3888
- Schoenmakers et al. (1997) Schoenmakers, R. H. M., Franx, M., & de Zeeuw, P. T. 1997, MNRAS, 292, 349
- Sheth et al. (2005) Sheth, K., Vogel, S. N., Regan, M. W., Thornley, M. D., & Teuben, P. J. 2005, ApJ, 632, 217
- Sheth et al. (2010) Sheth, K., Regan, M., Hinz, J. L., et al. 2010, PASP, 122, 1397
- Smajić et al. (2015) Smajić, S., Moser, L., Eckart, A., et al. 2015, arXiv:1508.02664
- Sorce et al. (2014) Sorce, J. G., Tully, R. B., Courtois, H. M., et al. 2014, MNRAS, 444, 527
- Solomon & Vanden Bout (2005) Solomon, P. M., & Vanden Bout, P. A. 2005, ARA&A, 43, 677
- Soltan (1982) Soltan, A. 1982, MNRAS, 200, 115
- Spekkens & Sellwood (2007) Spekkens, K., & Sellwood, J. A. 2007, ApJ, 664, 204
- Storchi-Bergmann et al. (2007) Storchi-Bergmann, T., Dors, O. L., Jr., Riffel, R. A., et al. 2007, ApJ, 670, 959
- Storchi-Bergmann et al. (2010) Storchi-Bergmann, T., Lopes, R. D. S., McGregor, P. J., et al. 2010, MNRAS, 402, 819
- Tremaine et al. (2002) Tremaine, S., Gebhardt, K., Bender, R., et al. 2002, ApJ, 574, 740
- Tully et al. (2013) Tully, R. B., Courtois, H. M., Dolphin, A. E., et al. 2013, AJ, 146, 86
- Ulvestad & Ho (2001) Ulvestad, J. S., & Ho, L. C. 2001, ApJ, 558, 561
- van der Kruit & Freeman (1984) van der Kruit, P. C., & Freeman, K. C. 1984, ApJ, 278, 81
- Veilleux & Rupke (2002) Veilleux, S., & Rupke, D. S. 2002, ApJ, 565, L63
- Veilleux et al. (2005) Veilleux, S., Cecil, G., & Bland-Hawthorn, J. 2005, ARA&A, 43, 769
- Westoby et al. (2012) Westoby, P. B., Mundell, C. G., Nagar, N. M., et al. 2012, ApJS, 199, 1
- Wada (1994) Wada, K. 1994, PASJ, 46, 165
- Woo et al. (2010) Woo, J.-H., Treu, T., Barth, A. J., et al. 2010, ApJ, 716, 269
- Woo & Urry (2002) Woo, J.-H., & Urry, C. M. 2002, ApJ, 579, 530
- Wong et al. (2004) Wong, T., Blitz, L., & Bosma, A. 2004, ApJ, 605, 183
- Yu & Tremaine (2002) Yu, Q., & Tremaine, S. 2002, MNRAS, 335, 965