Infrared spectroscopy of the merger candidate KIC 9832227
Abstract
Context. It has been predicted that the object KIC 9832227 – a contact binary star – will undergo a merger in . We describe the near infrared spectrum of this object as an impetus to obtain pre-merger data.
Aims. We aim to characterise (i) the nature of the individual components of the binary and (ii) the likely circumbinary environment, so that the merger – if and when it occurs – can be interpreted in an informed manner.
Methods. We use infrared spectroscopy in the wavelength range 0.7m–2.5m, to which we fit model atmospheres to represent the individual stars. We use the binary ephemeris to determine the orbital phase at the time of observation.
Results. We find that the infrared spectrum is best fitted by a single component having effective temperature 5 920 K, and solar metallicity, consistent with the fact that the system was observed at conjunction.
Conclusions. The strength of the infrared H lines is consistent with a high value of , and the strength of the Ca ii triplet indicates the presence of a chromosphere, as might be expected from rapid stellar rotation. The He i absorption we observe likely arises in He excited by coronal activity in a circumstellar envelope, suggesting that the weakness of the Ca ii triplet is also likely chromospheric in origin.
Key Words.:
circumstellar matter — binaries: close — binaries: eclipsing — Stars: individual (KIC 9832227) — Infrared: stars1 Introduction
There has recently come to light a new class of eruptive events whose outbursts can be attributed to a stellar merger. These events generally display high luminosity at maximum (Bond et al., 2003) () as evidenced by the occurrence of LRVs in M31 (Bond et al., 2003; Williams et al., 2015) and in other galaxies (Kasliwal, 2012; Smith et al., 2016). While the nature of these eruptions was initially unclear (with nova eruptions, planet-swallowing stars, very late thermal pulses having been suggested) the “best-bet” scenario – based on the behaviour of V1309 Sco – is the merger of two stars.
V1309 Sco is the “Rosetta Stone” of stellar mergers, in that its pre-eruptive behaviour and the subsequent eruption are not only consistent with, but conclusively point to, a stellar merger event in a contact binary. The progenitor had an orbital period of 1.4 day that decreased up to the 2008 eruption (Tylenda et al., 2011). The eruptive event that marked the merger began in 2008 March, reaching peak luminosity L⊙ (Tylenda et al., 2011). Infrared (IR) observations (McCollum et al., 2014) show that it had an IR excess at least a year before the merger. Pejcha (2014) has shown that V1309 Sco experienced mass loss through the outer Lagrangian point, which eventually obscured the binary. Zhu et al. (2013) note that the presence of a significant amount of dust around V1309 Sco suggests that the ejecta following a stellar merger is an ideal environment for dust formation and growth; they showed that M⊙ of silicate and iron dust was produced in the merger.
KIC 9832227 was identified by Molnar et al. (2015) as a potential merger candidate, and we present here a near IR spectrum of this candidate merger object.
2 KIC 9832227
KIC 9832227 is both an eclipsing and a contact binary, with an orbital period 0.458 days and amplitude mag in the optical. Molnar et al. (2017, hereafter M17) found that the orbital period as determined from Kepler data was significantly shorter than in previous years, and that the period derivative was rapidly decreasing, a sure signature of an impending merger; they estimate the time of merger to be . M17 determine that the primary (secondary) star has mass 1.4 M⊙ (0.32 M⊙), radius 2.6 R⊙ (0.78 R⊙), K (5 920 K) and (4.10). There is also some evidence for the presence of a third component in the system, with orbital period days and M⊙. A detailed discussion of the merger potential of KIC 9832227 is given by M17.
3 Observations
3.1 IRTF observation
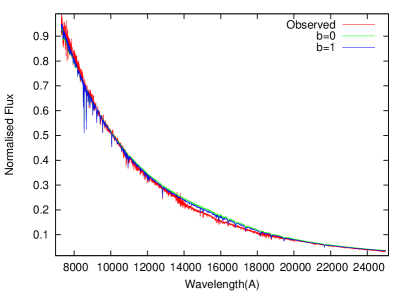
KIC 9832227 was observed with the SpeX spectrograph (Rayner et al., 2003) on the 3 m NASA Infra-Red Telescope Facility (IRTF), Hawaii, on 2017 July 7.54 UT (MJD 57941.54). SpeX was used in the cross-dispersed mode using a slit resulting in a spectral coverage m, at resolving power . The total integration time was 717 seconds. The A0V star HD194354 was used as the telluric standard. The data were reduced and calibrated using the Spextool software (Cushing et al., 2005), and corrections for telluric absorption were performed using the IDL tool Xtellcor (Vacca et al. 2003). The observed spectrum, which was dereddened by (M17), is shown in Fig. 1.
3.2 Complementary observations
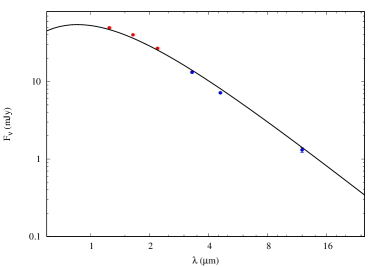
KIC 9832227 is included in the 2MASS (Skrutskie et al., 2006) and WISE (Wright et al., 2010) IR surveys; the source was not detected in other surveys, such as IRAS, AKARI and Herschel PACS. The 2MASS and WISE fluxes are given in Table 1 and shown in Fig. 2; KIC 9832227 was not detected in WISE Band 4 (22m). The IR spectral energy distribution (SED) is photospheric out to at least 12m, indicating that dust – if present in significant quantity as in V1309 Sco – has temperature K.
| Survey | Band | (m) | Flux (mJy) |
|---|---|---|---|
| 2MASS | 1.25 | ||
| 1.65 | |||
| 2.2 | |||
| WISE | W1 | 3.3 | |
| W2 | 4.6 | ||
| W3 | 12 |
3.3 Orbital phase of KIC 9832227 at the time of the IRTF observation
KIC 9832227 is an eclipsing binary: in order to interpret the IR spectrum we need to know the orbital phase and stellar velocity separation at the time of the IRTF observation. M17 do not give the full information necessary to deduce these quantities, so this process was non-trivial. We neglected the effect of the third body, which affects the orbital timings by only 0.002 cycles (Figure 10 in M17), and the proposed three-body solutions suggested by M17 because this body was not detected in the spectrum.
We adopted the parameters of the exponential fit given in Figure 12 of M17 and the linear orbital ephemeris from the Kepler Eclipsing Binary Catalogue111http://keplerebs.villanova.edu/overview/?k=9832227 (see Kirk et al., 2016). We further imposed a normalisation which forces the first point in the year 2004 to be at zero . The resulting orbital phases correctly reproduce the , instantaneous orbital period, and as plotted in Figures 12, 13 and 14 in M17.
The UTC time of mid-observation of our spectrum (2457942.04199) was converted into the BJD(TDB) timescale using the IDL routines from Eastman et al. (2010), giving a time of 2457942.04135. This corresponds to an orbital phase of 0.010, so our spectrum was obtained around a time of inferior conjunction. The velocity separation of the two stars at this time was negligible compared to their spectral line broadening, so the lines of the two stars are superposed in the spectrum.
4 Theoretical spectra and SEDs
Synthetic spectra and SEDs were computed using the WITA6 program for the SAM12 model 1D atmospheres (Pavlenko, 2003) with (in K)//[Fe/H]= 5 920/4.10/0.0 and 5 800/4.19/0.0 for the hotter () and cooler () components, respectively, as determined by M17. Significant molecular features are not seen in the observed spectrum, therefore we accounted for only atomic lines from the VALD3 database (Ryabchikova et al., 2015). Our procedure for producing the theoretical spectra is described elsewhere (see Pavlenko, 2003; Pavlenko et al., 2008). The synthetic spectra were convolved with a gaussian profile having the instrumental broadening corresponding to the spectral resolution , and rotational profiles corresponding to km s-1 () and 150 km s-1 (; M17). To account for rotational broadening of the spectra we used formulae given by Gray (1976).
5 Results
5.1 The overall spectrum
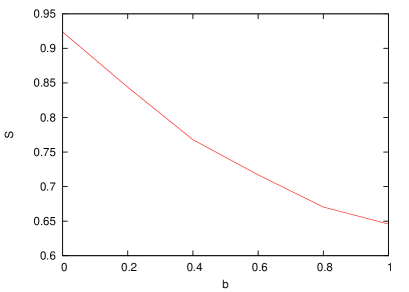
We computed theoretical spectral energy distributions for the and components, and created a grid of combined spectra , where . We computed the best fits to the dereddened spectrum for the cases ; the procedure to determine the best fit used a minimising algorithm, details of which are given elsewhere (see Pavlenko et al., 2008). The minimisation parameter indicates a minimum at (see Fig. 1). This is consistent with the fact that the observed spectrum was obtained at conjuction, when the hotter component dominates the combined spectrum (although a more compelling reason for not seeing the second component is the very similar ). Furthermore, as the eclipses are very shallow, component dominates the spectrum at all orbital phases.
5.2 Absorption lines in KIC 9832227’s spectrum
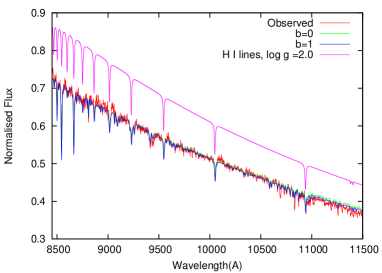
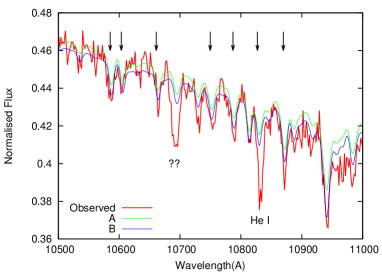
Generally speaking, both the intermediate resolution of the observed spectra () and the rapid rotation of both components complicate the use of atomic lines for abundance analysis. However, we see that practically all notable lines in the near IR spectrum are well fitted with close-to-solar abundances; the likely errors do not exceed 0.3 dex. In the right panel of Fig. 3 we show a few well-fitted Si i lines in the spectral range 10 500-11 000 Å. We find fits of the same quality to metallic lines in other spectral regions.
We draw particular attention to the modelling of the moderately strong hydrogen lines, to which our model provides a satisfactory fit. In the left panel of Fig. 3 we show the hydrogen lines computed for the case of lower . In the observed spectrum the upper members of the Bracket series are much weaker; this can be taken as independent evidence of the higher , as determined by M17. Indeed, our fits of the theoretical spectra computed for and to the observed spectra are far superior.
We also note the presence of a broad feature at 10 700 Å (identified by “??” in Fig. 3). Given the width of the feature, a possible identification is C i (3PS) at 10 686.01, 10 688.27, 10 694.17Å; these lines have relatively high excitation potentials ( eV).
5.3 The Ca ii triplet: evidence of a chromosphere
Absorption in the Ca ii triplet (8 498.023, 8 542.091, 8 662.14 Å) – by comparison with other metallic lines – is a notable feature of KIC 9832227’s spectrum (see Fig. 3). This Figure shows relevant portion of Fig.1 on a larger scale, to compare the observed Ca ii lines with those computed for the case of a classical model atmosphere. The observed lines are notably weaker by comparison with the computed. The discrepancies between computed and observed Ca ii lines strength may be explained by several factors, such as NLTE effects or a Ca deficit. In the former case, NLTE effects in other lines should also be apparent, but this is not the case. Also H i and metallic lines are well fitted for the case of solar abundances.
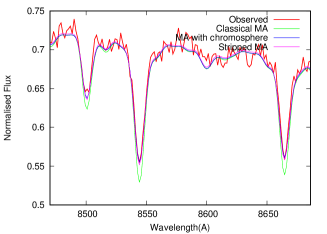

The components of the KIC 9832227 system consist of rapidly rotating, tightly bound stars in a contact binary system and we would not expect the atmospheres of such stars so be adequtely described by the classical model. In particular rapid stellar rotation is likely to lead to strong chromospheric (and related) activity, which could certainly account for the weakness of the Ca triplet.
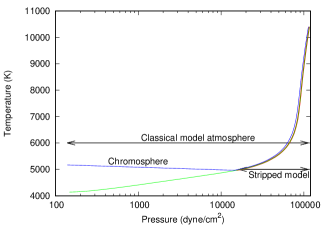
We have simulated a chromosphere by imposing a temperature minimum of 5 000 K, and a temperature gradient ( being the column density) in the model atmosphere. We fit the Ca ii line profiles by choosing the value of that minimises the fitting parameter (details of our approach to this calculation is given in Pavlenko, 1998). A model with a weak chromosphere (, cf. the solar value , with in K, in g cm-2) provides a good fit to the data in the region of the Ca ii triplet (see Fig. 4).
We also note here an alternative interpretion: our classical model atmospheres were computed for Rosseland mean optical depth in the range – 100 but such models lead to Ca ii lines that are too strong. Interestingly, a “stripped” model atmosphere for the component that lacks atmospheric layers in the range [ – ] provides an equally good fit to the Ca ii triplet (see Fig. 4).
However, while both approaches provide equally good fits to the data, for reasons to be discussed below we prefer the chromospheric interpretation.
5.4 He i at 10 830 Å
A strong absorption feature is present at 10 830 Å (see Fig. 3); we attribute this to He i 10 830 Å (3SP0), which is also observed in absorption in the spectra of metal poor subdwarfs (Smith et al., 2012) and red giants (Smith et al., 2014). This line is noticeably narrower than the rotationally broadened photospheric lines, and most likely forms outside the stellar photospheres, possibly in the common envelope.
In the case of the Sun the line is also observed in absorption; Avrett et al. (1994) suggested that coronal radiation penetrates into the upper solar chromosphere, causing sufficient helium ionisation to populate the lower level of the He i 10 830 Å transition, thus resulting in optically-thin absorption against the photospheric continuum. This, together with the presence of the C i lines at Å, lends support to the chromospheric explanation offered in Section 5.3.
6 Conclusions
We have carried out an analysis of the near IR spectrum of KIC 9832227. We computed synthetic spectra for two classical 1D model atmospheres, and fitted the dereddened spectrum. While we acknowledge that the computed model atmospheres may be overly simplistic for the case of the complex KIC 9832227 system, we do nonetheless obtain a satisfactory reproduction of the observed SEDs. This may be taken as evidence that, at the time of observation, the 1D+LTE approach is valid.
Within the constraints of our simplified model we conclude that:
-
1.
our ephemeris analysis and spectral synthesis show that, at the time of observation, the contribution of the hotter component prevails in the combined spectrum;
-
2.
the strength of the H i lines is well reproduced by our models, providing independent confirmation of the high (4.10, component ; 4.19, component ; M17) at least in the atmosphere of component . Model atmospheres with lower result in Bracket and Paschen lines that are too srong;
-
3.
a comparatively narrow feature at 10 830 Å is identified as the He i (3SP) line, and is formed in the outer part of the common envelope;
-
4.
a satisfactory fit to the Ca ii IR triplet is obtained by introducing a chromosphere into the model atmosphere. This is likely a consequence of rapid stellar rotation;
-
5.
despite the intermediate resolution of observed spectra and the fast rotation of both components, we confirm that component has near-solar abundances.
Acknowledgements.
We warmly thank David Sand for making possible the IRTF observations, and for help with the data reduction. The Infrared Telescope Facility is operated by the University of Hawaii under contract NNH14CK55B with the National Aeronautics and Space administration. We thank the referee for their helpful comments.References
- Avrett et al. (1994) Avrett, E. H., Fontenla, J. M., Loeser, R., 1994, in IAU Symposium, 154, Infrared Solar Physics, eds D. M. Rabin, J. T. Jefferies, C. Lindsey, Kluwer Academic Publishers; Dordrecht, p. 35
- Bond et al. (2003) Bond, H. E., Henden, A., Levay, Z. G., Panagia, N., Sparks, W. B., Starrfield, S., Wagner, R. M., Corradi, R. L. M., Munari, U. 2003, Nature, 422, 405
- Cushing et al. (2005) Cushing M. C., Rayner J. T., Vacca W. D., 2005, ApJ, 623, 1115
- Eastman et al. (2010) Eastman, J., Siverd, R., Gaudi, B. S., 2010, PASP, 122, 935
- Gray (1976) Gray, D. F., 1976, The observation and analysis of stellar photospheres, Wiley Interscience, New York
- Kasliwal (2012) Kasliwal, M. M. 2012, PASA, 29, 482
- Kirk et al. (2016) Kirk, B., et al., 2016, AJ, 151, 68
- McCollum et al. (2014) McCollum, B., Laine, S., Väisänen, P., Bruhweiler, F. C., Rottler, L., Ryder, S., Wahlgren, G. M., Barway, S., Nagayama, T., Ramphul, R. 2014, AJ, 147, 11
- Molnar et al. (2015) Molnar, L. A., Van Noord, D. M., Steenwyk, S. D., Spedden, C. J., Kinemuchi, K. 2015, BAAS, 225, 415.05
- Molnar et al. (2017) Molnar, L. A., Van Noord, D. M., Kinemuchi, K., Smolinski, J. P., Alexander, C. E., Cook, E. M., Jang, B., Kobulnicky, H. A., Spedden, C. J., Steenwyk, S. D. 2017, ApJ, 840, 1 (M17)
- Nichols et al. (2013) Nicholls, C. P., et al., 2013, MNRAS, 431, L33
- Pavlenko (1998) Pavlenko, Ya. V. 1998, Astronomy Reports, 42, 501
- Pavlenko (2003) Pavlenko, Ya. V. 2003, Astronomy Reports, 47, 59
- Pavlenko et al. (2008) Pavlenko, Ya. V., Evans, A., Kerr, T., et al. 2008, A&A, 485, 541
- Pejcha (2014) Pejcha, O. 2014, ApJ, 788, 22
- Rayner et al. (2003) Rayner J. T., Toomey D. W., Onaka P. M., Denault A. J., Vacca W. D., Cushing M. C., Rayner J. T., 2003, PASP, 115, 389
- Ryabchikova et al. (2015) Ryabchikova, T., Piskunov, N., Kurucz, R. L., et al. 2015, Phys. Scr, 90, 054005
- Skrutskie et al. (2006) Strutskie, M. F., et al., 2006, AJ, 131, 1163
- Smith et al. (2012) Smith, G. H., Dupree, A. K., Strader, J., 2012, PASP, 124, 1252
- Smith et al. (2014) Smith, G. H., Dupree, A. K., Strader, J., 2014, ArXiv e-prints [arXiv:1410.3487]
- Smith et al. (2016) Smith et al. 2016, MNRAS, 458, 950
- Tylenda et al. (2011) Tylenda, R., Hajduk, M., Kamiński, T., Udalski, A., Soszyński, I., Szymaáski, M. K., Kubiak, M., Pietrzyński, G., Poleski, R., Wyrzykowski, Ł., Ulaczyk, K. 2011, A&A, 528, A114
- Vacca et al. (2003) Vacca, W. D., Cushing, M. C., Rayner, J. T., 2003, PASP, 115, 389
- Williams et al. (2015) Williams, S. C., Darnley, M. J., Bode, M. F., Steele, I. A. 2015, ApJ, 805, L18
- Wright et al. (2010) Wright, E. L., et al., 2010, AJ, 140, 1868
- Zhu et al. (2013) Zhu, C., Lü, G., Wang, Z., 2013, ApJ, 777, 23