On detecting repetition from fast radio bursts
Abstract
Fast radio bursts (FRBs) are bright, millisecond-duration radio pulses whose origins are unknown. To date, only one (FRB 121102) out of several dozen has been seen to repeat, though the extent to which it is exceptional remains unclear. We discuss detecting repetition from FRBs, which will be very important for understanding their physical origin, and which also allows for host galaxy localisation. We show how the combination of instrument sensitivity, beamshapes, and individual FRB luminosity functions affect the detection of sources whose repetition is not necessarily described by a homogeneous Poisson process. We demonstrate that the Canadian Hydrogen Intensity Mapping Experiment (CHIME) could detect many new repeating FRBs for which host galaxies could be subsequently localised using other interferometers, but it will not be an ideal instrument for monitoring FRB 121102. If the luminosity distributions of repeating FRBs are given by power-laws with significantly more dim than bright bursts, CHIME’s repetition discoveries could preferentially come not from its own discoveries, but from sources first detected with lower-sensitivity instruments like the Australian Square Kilometer Array Pathfinder (ASKAP) in fly’s eye mode. We then discuss observing strategies for upcoming surveys, and advocate following up sources at approximately regular intervals and with telescopes of higher sensitivity, when possible. Finally, we discuss doing pulsar-like periodicity searching on FRB follow-up data, based on the idea that while most pulses are undetectable, folding on an underlying rotation period could reveal the hidden signal.
1 Introduction
Fast Radio Bursts (FRBs) are a new class of extragalactic radio transient. They are characterized by their large dispersion measures (DMs) (175–2600 pc cm-3) and short durations (30s–30 ms). All FRB detections to date have been one-off events, except for FRB 121102. It was first detected with Arecibo (Spitler et al., 2014), but follow-up observations by Spitler et al. (2016) found 10 repeat bursts at the same DM as the initial detection. The repetition allowed for sub-arcsecond precision localization by the Very Large Array (VLA) and the European VLBI Network (EVN) and provided the first direct host galaxy identification (Chatterjee et al., 2017; Marcote et al., 2017; Tendulkar et al., 2017). Eventually FRBs will be localized in real-time by interferometers like Australian Square Kilometer Array Pathfinder (ASKAP; Bannister et al., 2017) and realfast (Law et al., 2018), but no FRB has yet been successfully localized to a host galaxy through its discovery pulse. Finding repeating FRBs and carrying out high time resolution VLBI follow-up is still a viable avenue for localizing host galaxies.
Beyond allowing for localization, repetition also offers valuable clues about FRB progenitor models. Before the detection of FRB 121102’s repetition, most theories postulated a cataclysmic origin (Kashiyama et al., 2013; Falcke & Rezzolla, 2014; Totani, 2013; Zhang, 2014). The local environment of FRB 121102 could play a role in the nature of its repetition. Michilli et al. (2018) found that it resides in an extreme magneto-ionic environment that contributes a Faraday rotation measure (RM) of rad m-2. Burst arrival times are clustered, individual bursts exhibit considerable time and frequency structure, and strong pulse-to-pulse brightness fluctuations are seen (Spitler et al., 2016; Scholz et al., 2016; Michilli et al., 2018). While the sporadic repetition and pulse structure may be intrinsic, it is possible that they are coupled to the extreme plasma environment around the source. Cordes et al. (2017) argued that FRB 121102 might be behind a plasma lens that would magnify burst intensity and imprint time and frequency variations characteristic of caustics. Depending on the relationship between the resultant luminosity function of this amplification and the source’s intrinsic luminosity function, magnification bias may mean we preferentially see repeating FRBs that are associated with extreme environments.
It remains unclear how many FRBs repeat and if their repetition is similar to FRB 121102. Of the more than 30 FRBs found so far111All publicly released FRBs are available on the FRB Catalogue; www.frbcat.org no others have been seen to repeat. Most of these bursts have had very little later follow-up, but some have been re-observed for tens and even hundreds of hours (Lorimer et al., 2007; Ravi et al., 2016; Petroff et al., 2015a). However, meaningful constraints are difficult to achieve in the presence of clustered repetition (Connor et al., 2016b; Oppermann et al., 2018).
In this paper we consider detecting repetition from FRBs with current and future surveys. In order to address questions of optimal observing strategy, we simulate repeating FRBs with arrival times that are not described by a homogeneous Poisson process, and whose pulse intensities are drawn from power-law luminosity functions. We consider the extent to which FRB 121102 may be unusual in the frequency and statistics of its repetition. We also discuss the possibility of repetition with an underlying period and show that for many brightness distributions, periodicity searches could offer higher signal-to-noise (S/N) than single-pulse searching.
2 Repetition model
Before discussing the statistics of repetition it is important to distinguish the luminosity function of a single repeating source, which we will call , from both the global luminosity function of FRBs, , and their detected brightness distribution, . The brightness distribution usually refers to the source counts in a given flux, fluence, or S/N bin (in the case of fluence this is -). The - statistic encodes information about the volumetric distribution of FRBs, not just their intrinsic luminosities. It has important implications for survey design and the nature of the FRB population, and has been subject to considerable debate in the literature (Oppermann et al., 2016; Vedantham et al., 2016; Amiri et al., 2017; Macquart & Ekers, 2018). The ensemble luminosity function, , with which we are not concerned here, refers to the number of bursts emitted with a certain luminosity across all FRBs; unlike it would be meaningful even if all FRBs were one-off events.
To describe the arrival times of repeat bursts, we follow the formalism of Oppermann et al. (2018) and use a generalization of Poissonian statistics known as the Weibull distribution. If repetition were well-described by a homogeneous Poisson process, then the probability of seeing repeats in some time interval given a rate would be,
| (1) |
This can also be written as an expected wait time, , between bursts. It will have the following exponential distribution,
| (2) |
where . This can be expanded to include a shape parameter, , which describes the clustering (or lack thereof) of events in time. The probability density function (PDF) of time intervals for the Weibull distribution is,
| (3) |
where is the gamma function of some positive input, . Eq. 3 reduces to an exponential when is 1, so implies what we will call non-Poissonian statistics. For the probability of a new event decreases with time, whereas indicates a monotonically increasing chance of an event. In other words, when the shape parameter is less than unity, events are clustered in time; when the shape parameter is large, event spacing tends toward uniformity.
Interestingly, neutron stars span a large range of pairs. A typical radio pulsar is a good example of a 1 source, because as the shape parameter approaches infinity, the signal asymptotes to perfect periodicity. In that case, would simply be the spin period. The brightest giant pulses (GPs) from the Crab seem to follow Poissonian statistics, with (Lundgren et al., 1995). They are neither clustered in time, nor do they have predictable arrival times. If FRB 121102 does indeed come from a rotating neutron star, (Popov & Postnov, 2013; Cordes & Wasserman, 2016; Pen & Connor, 2015; Connor et al., 2016c; Spitler et al., 2016; Lyutikov et al., 2016) then this would be an example of a temporally clustered, source: Oppermann et al. (2018) fit available data from FRB 121102, to a Weibull distribution and found best-fit parameters of , repeats per day, strongly disfavouring homogeneous Poissonian repetition. They used data from 80 observations during which 17 pulses were found in a subset of just 7 pointings.
Repetition rates for an FRB must be treated in a similar way to FRB all-sky rates in general. It is not useful to give an all-sky event rate of FRBs on its own. It must be accompanied by a complete brightness threshold, for example sky-1 day-1 above 2 Jy ms for widths between 0.13–32 ms (Bhandari et al., 2018). Forecasting detection rates of surveys with different sensitivities requires further information about -. In the same way, repetition rates must be quoted not only with clustering parameters and an average interval, but also with a minimum brightness threshold. Again, forecasting expected repetition detection in different surveys will require knowledge about the particular source’s . Thus the best fit values for FRB 121102 in Oppermann et al. (2018) could be expanded to , per day above 20 mJy.
We parametrize the luminosity function in the following way.
| (4) |
This equation gives the number of repeat bursts from the same FRB-emitting source that are greater than some luminosity, . Our power-law assumption is partly motivated by the brightness distribution of giant pulses from Galactic pulsars, like the Crab (Cordes et al., 2004; Zhuravlev et al., 2011; Mickaliger et al., 2012; Oronsaye et al., 2015) or PSR B1937+21 (Zhuravlev et al., 2013), but also the distribution of burst energies and S/N from FRB 121102 (Spitler et al., 2016; Law et al., 2017).
A boost in the observed repeat rate can be achieved during follow-up observation. For example, since the original detection was necessarily made in a blind search over a large number of DM trials, the phase space that must be searched by a dedispersion back-end in follow-up will shrink by a factor of . This allows for a reduction in the S/N cutoff from the blind threshold, , to the targeted threshold, . Similarly, a boost can be achieved if the initial detection was found in an instrument’s sidelobe, or if it was found with a lower-sensitivity telescope than the one searching for repetition. Assuming the initial detection was found with a system-equivalent flux density (SEFD) of then followed up with , we can combine these with Eq. 4 to get the transformed rate,
| (5) |
where and are the bandwidths of the blind observation and the targeted one, respectively.
If either the individual FRB’s brightness function is steep (i.e. is large) or the ratio of SEFDs is large, the observed repeat rate of the source will change drastically. As an example, suppose is 2, as with Crab GPs, and the source was initially detected in an instrument’s sidelobe but can be localized to less than a primary beam width. If the forward gain of the sidelobe is 15 dB below that of on-axis, and a significance threshold was lowered from 10 to 5 , then the detectable repeat rate of the FRB will increase by a factor of 4000—an example that may be significant for FRB 121102, as discussed in Sect. 3.1. The same is true for follow-up observing with a more sensitive telescope. Assuming the same luminosity distribution, an FRB found with ASKAP in fly’s eye mode will have an average detectable repeat rate that is times larger when observed with Parkes, if the power-law continues over at least a couple of decades in .
3 Considerations for specific cases
3.1 FRB 121102
The extent to which FRB 121102 is exceptional remains unclear. Some of its ostensibly unusual properties could, in principle, be explained by observational selection effects, and others no longer appear to be unique to that source. For example, the non-power-law spectral behaviour found by Spitler et al. (2016) and Scholz et al. (2016) seemed to set FRB 121102 apart from other FRBs, but recently more events have been discovered whose frequency structure is clumpy (Bannister et al., 2017; Farah et al., 2018). The temporal structure that emerged after coherent dedispersion seemed different from other FRBs, many of which are unresolved (Ravi, 2017). However, Farah et al. (2018) showed that FRB 170827, initially unresolved after being detected with incoherent dedispersion, also exhibits rich time and frequency structure when coherently dedispersed. The large rotation measure (RM) of FRB 121102, rad m-2 (Michilli et al., 2018), may also have been present in previous FRBs with polarization measurements, but intra-channel Faraday rotation would have smeared out their linear polarization (Petroff et al., 2015b; Keane et al., 2016).
The most salient difference between FRB 121102 and other FRBs is that it is known to repeat. All other detected FRBs have been one-off events, despite, in some cases, considerable follow-up observations (Lorimer et al., 2007; Petroff et al., 2015a; Ravi et al., 2016). However, as shown by Connor et al. (2016b), when repeat pulses are clustered in time strong constraints on repeat rate are difficult to achieve. Still, there are reasons to think FRB 121102 is particularly special in its repeatability. One is discovery bias, which refers to the fact that initial detections of phenomena tend to themselves be outliers. Macquart & Ekers (2018) argued that the ultra-bright first FRB discovery, the Lorimer burst (Lorimer et al., 2007), should not be included in calculating population statistics for this reason. Indeed, there may already be evidence that FRB 121102 is exceptional in at least its frequency of repetition (Palaniswamy et al., 2018). Another reason why FRB 121102 may have been found to repeat before others is that the initial detection (Spitler et al., 2014) was in the Arecibo L-band Feed Array (ALFA) sidelobe where the forward gain was less than 1.7 K Jy-1 (Spitler et al., 2016). With the seven-beam ALFA receiver, they used a grid of six pointings and found 10 repeat bursts Spitler et al. (2016) all of which were in primary beams whose forward gains are between 8–10 K Jy-1. With Eq. 5, the rate of FRB 121102 increased by a factor of approximately 8γ for the on-axis observing.
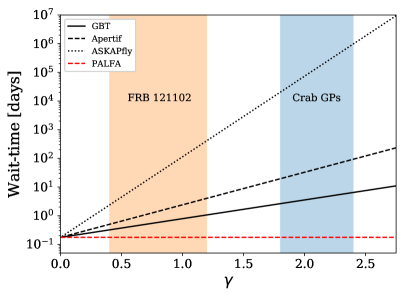
Law et al. (2017) analyzed the repetition rate of FRB 121102 as a function of burst energetics. They find that its luminosity function is described by a power-law continuing over at least 2.5 orders-of-magnitude, with . In Fig. 1 we show the expected wait time for a given telescope to see an FRB 121102 burst, plotted as a function of power-law index . We have highlighted the region of the 1–2 GHz Crab GP’s power-law index in blue, as well as the fit by Law et al. (2017) in red. There is still significant uncertainty on the average repeat rate of FRB 121102, which would result in a re-scaling of the -axis, but the purpose of the figure is to demonstrate the significance of on repetition detection.
3.2 CHIME
The Canadian Hydrogen Intensity Mapping Experiment (CHIME) is a transit instrument with no moving parts, observing between 400–800 MHz (Bandura et al., 2014; Ng et al., 2017; The CHIME/FRB Collaboration et al., 2018). It is expected to have the highest FRB detection rate of any upcoming survey due to its large collecting area and ability to search continuously 103 beams (Chawla et al., 2017; The CHIME/FRB Collaboration et al., 2018). Even if the FRB rate were diminished at low frequencies due to scattering, free-free absorption, or spectral index, Connor et al. (2016a) showed that using only the top quarter of CHIME’s band between 700–800 MHz—where the rate is known to be non-zero—would still result in 2–40 detections per day.
In Sect. 4 we prescribe observing strategies for detecting repeating FRB sources in the presence of non-Poissonian repetition and negative-power-law brightness distributions. For CHIME, which is not steerable and which records data continuously, scheduling does not have many degrees of freedom. Fortunately, transit instruments with North-South primary beams naturally apply the optimal observing strategy for clustered repetition, per unit time on source. With an East-West primary beam of 1–2∘, CHIME will have 0.3–0.6 of the sky visible at any given time. This means that once it has discovered a few hundred FRBs, CHIME will be doing repetition follow-up at almost all times because there will be a known source at most right ascensions. Therefore, even if the probability of seeing a single source repeat over the course of a year is low, CHIME will automatically follow up large numbers of FRBs and it will either produce a catalog of repeaters or establish the uniqueness of FRB 121102. If it does find repeaters, they can be followed up with longer-baseline interferometers like the VLA for localization.
One interesting implication of the effect of sensitivity on repetition rate is that CHIME may see more repeat pulses from FRBs originally detected at other, less sensitive instruments than from FRBs found with CHIME itself. Suppose each individual FRB repeats with a luminosity distribution . Suppose also that CHIME, with SEFD has detected FRBs, which it can follow up daily. Then if some other survey X, with SEFD , has detected bursts that are visible to CHIME, the condition,
| (6) |
implies that CHIME will find more repeaters that were initially detected in survey X than detected at CHIME.
As a simple example, if ASKAP in fly’s eye mode were to find 50 bursts at declinations, and CHIME amassed a set of 500 FRBs, we can calculate the values of above which the relation in Eq. 6 hold. Taking and (Bannister et al., 2017), then if CHIME will detect more repeaters from the ASKAP collection than from its own. This could also be true for Apertif (van Leeuwen, 2014) incoherent-mode detections. And in general, if is also the ratio of detection rates, then the inequality will always be true. Therefore, when possible, surveys like CHIME ought to search for repetition from known FRBs discovered by less sensitive instruments, potentially with a decreased S/N threshold at the initial detection’s DM.
Though it sees the whole Northern sky each day, a given source is only in CHIME’s primary beam for 10 minutes, totaling roughly 60 hours per year. This fact, combined with the brightness function arguments in Sect. 2 means it may not be a good tool for monitoring FRB 121102. If FRB 121102’s mean repeat rate with ALFA is 5.7 events per day, then one would expect roughly a dozen pulses per year if the source had a perfectly flat brightness distribution. But FRB 121102’s luminosity function is not flat, and almost all of the bursts detected from FRB 121102 would not have been detected by CHIME, (or Apertif, or Parkes, or ASKAP). We have assumed that FRB 121102’s repetition rate and brightness is the same at 400–800 MHz as it is at higher frequencies. The behaviour of FRB 121102 is not well contrained below 1 GHz. Out of the 80 observations in Scholz et al. (2016), 11 were taken with GBT’s 820 MHz receiver with 200 MHz bandwidth and no bursts were seen. However, given the highly non-Poissonian behaviour of FRB 121102 and the lower sensitivity at 820 MHz due to less bandwidth, it is unsurprising that none was detected.
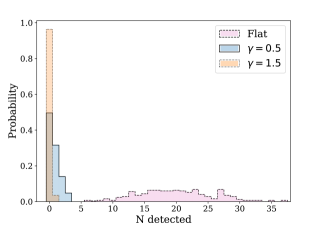
We have built a simple Monte Carlo simulation in which pulse arrival times are given by a Weibull distribution and each burst’s energy is randomly drawn from some input luminosity function. In Fig. 2 we show the number of expected FRB 121102 bursts detected per year with CHIME, assuming three different power-laws. This figure shows that unless FRB 121102’s repeat rate turns out to be considerably larger than the value used here, or is smaller than 0.5, CHIME may see at most a few FRB 121102 bursts per year.
4 Survey strategy
We advocate doing follow up observations with more sensitive instruments than the detection survey, if possible. The Five-hundred-meter Aperture Spherical Radio Telescope (FAST) will have extraordinary sensitivity at 1.4 GHz, with an expected forward gain of 18 K Jy-1 and system temperature of 20 K (Li & Pan, 2016). Therefore with an SEFD that is almost 2000 times lower than that of ASKAP in “fly’s eye” mode, FAST would see an effective repeat rate that is times higher than ASKAP, assuming the power-law holds beyond those brightnesses. For single pixel instruments, the FoV mismatch between large and smaller dishes would make this program difficult, because follow-up observations would have to be tiled. However, even in the extreme example of ASKAP fly’s eye and FAST, the tiling problem is softened by their multi-pixel receivers. ASKAP’s phased-array feed (PAF) allowed it to localize FRB 170107 to an 88 arcminute 90 confidence region, despite its nominal 1 degree beams (Bannister et al., 2017). FAST will initially have nineteen 2.9 arcminute beams in its 1.4 GHz multi-beam receiver, meaning the error region of FRB 170107 could be covered with between 1–7 pointings, depending on the angular separation of FAST’s on-sky beams.
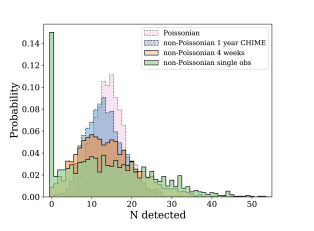
In the case of non-Poissonian repetition, the distribution of observing time has implications for detectability. If repetition is Poissonian, then detection statistics are affected only by total time on source. But if FRBs are significantly clustered in time then the worst observing strategy is to point at a source for a single long integration. Connor et al. (2016b) calculated this effect for noise, or a “pink distribution” of arrival times in which bursts are significantly temporally correlated. Oppermann et al. (2018) quantified it for a Weibull distribution with and per day, showing that the chance of not seeing a burst during a single observation was four times larger than if observations were at approximately regular intervals and separated by roughly days, holding total time on source equal. The improvement becomes more extreme for lower values of , i.e. higher clustering.
As discussed, transit telescopes like CHIME automatically apply this periodic sampling function. However, for studies of a single FRB of particular interest, one may want more than ten minutes per source per day. For steerable surveys like Apertif, follow-up should be spread out over multiple observing sessions, switching between sources. For a clustered source, detection of a burst implies a higher probability of a subsequent burst. Therefore, telescopes that detect an FRB in real-time should stay on that source. In Fig. 3 we show detection distributions from a simulated repeater. The results show that a single long observation of a clustered source can result in zero detected events, but regular short observations ( hrs) reduces the clustered repeater to a near-Poissonian source. For a source whose repetition is not clustered in time, detectability is not affected by spreading observations out, lessening the risk of assuming all FRBs are like FRB 121102.
Priority of targets could be determined by brightness, assuming there are more dim bursts than highly energetic ones for a given repeater. It may also be useful to preferentially follow up recently discovered sources whose age lower-limit is the smallest, motivated by the idea that FRBs come from young neutron stars whose emitting window is limited (Connor et al., 2016c; Piro, 2016; Metzger et al., 2017; Murase et al., 2016). Therefore, bright, recent sources like FRBs 170827 (Farah et al., 2018), 170107 (Bannister et al., 2017), and 180309222http://www.astronomerstelegram.org/?read=11385 which were 60 Jy, 20 Jy, and 100 Jy, respectively, should be followed-up periodically by, e.g., Parkes.
4.1 Galactic FRBs
An FRB from our own Galaxy would be extremely bright, and might be detected by a low-sensitivity, all-sky instrument, e.g. STARE333www.caastro.org/files/64/3383921601/bochenek_frb2018presentation_upload.pdf or in other telescope’s sidelobes (Tendulkar et al., 2016). This is because a Galactic FRB would be very rare, but would not require much forward gain to detect, so beam solid angle wins over sensitivity. It also means surveys that hope to preserve such signals should take measures not to throw them out as RFI, as they may show up as moderate-DM multi-beam detections.
Here we consider a Galactic FRB to be a short-duration radio pulse whose energetics are close to those of known extragalactic FRBs; we do not include the Crab GPs that have been measured to date to be in this category. The probability of ever seeing such an event depends strongly on the statistics of FRB repetition. Suppose there are 5000 FRBs across the sky each day above some brightness threshold. If we imagine the extreme case, where all 5000 of those come from a single repeater, then every Galaxy in the observable Universe except one has zero FRB-emitting sources in it over the timescale of the typical emitting window. Even if the average repeat rate of FRBs is once per day—lower than FRB 121102—then there are only a few thousand galaxies in the Universe containing FRBs during an emitting window. Conversely, in the non-repeating case one simply has to wait long enough to see an FRB locally. Therefore an observer in a random location sees either many ultra-bright Galactic FRBs or none. In reality there exists a continuum of FRB brightnesses, such that there are many more events below our surveys’ detection thresholds than, in this example, a few thousand. This argument also depends on repeating sources being the dominant sub-class of FRBs. Still, the statistics of repetition strongly affect the implied spatial distribution of burst-emitting sources.
4.2 Non-power-law
FRB 121102 and giant pulses have power-law , but there is no guarantee that other repeating sources will have such a functional form; brightness fluctuations in regular pulsars have been modelled with log-normal and Chi-squared distributions. However, even if the brightness function flattens out for very faint events, or decays exponentially, follow-up with higher sensitivity will significantly improve detectability so long as there are more dim repeat bursts than bright ones.
4.3 FRB periodicity search
Though no underlying periodicity has been found in FRB 121102’s repetition, it is possible that other repeating sources will have a more easily detectable periodic signal. Therefore, it may be useful to do a periodicity search on one-off FRBs. This could be done either with an FFT-search or a fast folding algorithm (FFA) to protect against missing long-period or low-duty cycle repeating sources (Staelin, 1969; Cameron et al., 2017). If other sources have luminosity distributions like FRB 121102 in which there are more dim pulses than bright ones, de-dispersing to the known DM and folding on a range of rotation periods might pull the underlying signal out of the noise. The periodicity search could either be done during follow-up with a more sensitive instrument or in data around the detection. The latter may help for intermittent sources; the former would allow a hidden underlying signal to emerge more easily. Periodicity in rotating radio transients (RRATs) was initially found using single-pulse time differencing (McLaughlin et al., 2006), but folding searches like the one we discuss here have been successfully used in sources such as RRAT J1819-1458 (Palliyaguru et al., 2011).
The S/N optimality of periodicity searching vs. single-pulse detection depends primarily on the number of pulses in an observation, , and the luminosity distribution of those pulses, (McLaughlin & Cordes, 2003). Periodicity searches tend to achieve higher S/N if there are a large number of pulses in an observation, which is why they are often used for millisecond pulsars. For a perfectly flat brightness distribution between some minimum brightness, and maximum , McLaughlin & Cordes (2003) show that FFT-periodicity searching is preferred over single-pulse search for . For other power-law index, or indeed different functional forms like an exponential distribution, the values of for which periodicity searching results in higher S/N may be larger.
It may also be that repeating FRBs do not have any underlying periodicity. If this is the case, an excess of events that are below the single-pulse threshold but above, say, 3 could be looked for in the dedispersed time-stream at the FRB detection DM. The cumulative S/N distribution of all samples (binned to the width of the initial burst) could be compared to the same data dedispersed to other DMs in order to look for statistically significant differences in their tails. While there is no guarantee that these techniques would uncover repetition, periodicity searching a small range of DMs or making a histogram of S/N is relatively low cost, whereas demonstrating repetition with a folded spectrum would be highly informative.
5 Conclusions
In this letter we have investigated the interplay between instrumental effects, survey strategy, and the detectability of FRB repetition from sources whose burst arrival times are not necessarily described by a homogeneous Poisson process. We summarize our findings as follows:
-
•
If other repeating FRBs have luminosity functions similar to FRB 121102 or the Crab’s giant pulses, in that there are many more dim bursts than bright ones, observed repeat rates can be greatly boosted by doing follow-up observations with higher sensitivity instruments than the original detection telescope. The same is true for sidelobe detections that are followed up on-axis, which is how FRB 121102 was found to repeat, and may have contributed to it being the first repeater discovered.
-
•
North-South transit telescopes like CHIME are well-suited to search for repetition in FRBs whose bursts are clustered in time, allowing for arcsecond localization by longer-baseline interferometers. However, CHIME will not be an ideal instrument for monitoring the one known repeater, FRB 121102.
-
•
Repetition found by CHIME may preferentially come from FRBs initially detected at other, lower-sensitivity instruments like ASKAP or Apertif incoherent mode.
-
•
The probability of ever detecting an ultra-bright Galactic FRB depends strongly on the statistics of repetition.
-
•
Periodicity searches at the known DM of one-off FRBs could reveal repetition in their folded spectra, ideally carried out with more sensitive instruments than the detection telescope. Such searches could also be done in pre-existing data around the initial detection.
References
- Amiri et al. (2017) Amiri, M., Bandura, K., Berger, P., et al. 2017, ApJ, 844, 161
- Bandura et al. (2014) Bandura, K., Addison, G. E., Amiri, M., et al. 2014, in Proc. SPIE, Vol. 9145, Ground-based and Airborne Telescopes V, 914522
- Bannister et al. (2017) Bannister, K. W., Shannon, R. M., Macquart, J.-P., et al. 2017, ApJ, 841, L12
- Bhandari et al. (2018) Bhandari, S., Keane, E. F., Barr, E. D., et al. 2018, MNRAS, 475, 1427
- Cameron et al. (2017) Cameron, A. D., Barr, E. D., Champion, D. J., Kramer, M., & Zhu, W. W. 2017, MNRAS, 468, 1994
- Chatterjee et al. (2017) Chatterjee, S., Law, C. J., Wharton, R. S., et al. 2017, Nature, 541, 58
- Chawla et al. (2017) Chawla, P., Kaspi, V. M., Josephy, A., et al. 2017, ApJ, 844, 140
- Connor et al. (2016a) Connor, L., Lin, H.-H., Masui, K., et al. 2016a, MNRAS, 460, 1054
- Connor et al. (2016b) Connor, L., Pen, U.-L., & Oppermann, N. 2016b, MNRAS, 458, L89
- Connor et al. (2016c) Connor, L., Sievers, J., & Pen, U.-L. 2016c, MNRAS, 458, L19
- Cordes et al. (2004) Cordes, J. M., Bhat, N. D. R., Hankins, T. H., McLaughlin, M. A., & Kern, J. 2004, ApJ, 612, 375
- Cordes & Wasserman (2016) Cordes, J. M., & Wasserman, I. 2016, MNRAS, 457, 232
- Cordes et al. (2017) Cordes, J. M., Wasserman, I., Hessels, J. W. T., et al. 2017, ApJ, 842, 35
- Falcke & Rezzolla (2014) Falcke, H., & Rezzolla, L. 2014, A&A, 562, A137
- Farah et al. (2018) Farah, W., Flynn, C., Bailes, M., et al. 2018, ArXiv e-prints, arXiv:1803.05697
- Kashiyama et al. (2013) Kashiyama, K., Ioka, K., & Mészáros, P. 2013, ApJ, 776, L39
- Keane et al. (2016) Keane, E. F., Johnston, S., Bhandari, S., et al. 2016, Nature, 530, 453
- Law et al. (2017) Law, C. J., Abruzzo, M. W., Bassa, C. G., et al. 2017, ApJ, 850, 76
- Law et al. (2018) Law, C. J., Bower, G. C., Burke-Spolaor, S., et al. 2018, ArXiv e-prints, arXiv:1802.03084
- Li & Pan (2016) Li, D., & Pan, Z. 2016, Radio Science, 51, 1060
- Lorimer et al. (2007) Lorimer, D. R., Bailes, M., McLaughlin, M. A., Narkevic, D. J., & Crawford, F. 2007, Science, 318, 777
- Lundgren et al. (1995) Lundgren, S. C., Cordes, J. M., Ulmer, M., et al. 1995, ApJ, 453, 433
- Lyutikov et al. (2016) Lyutikov, M., Burzawa, L., & Popov, S. B. 2016, MNRAS, 462, 941
- Macquart & Ekers (2018) Macquart, J.-P., & Ekers, R. D. 2018, MNRAS, 474, 1900
- Marcote et al. (2017) Marcote, B., Paragi, Z., Hessels, J. W. T., et al. 2017, ApJ, 834, L8
- McLaughlin & Cordes (2003) McLaughlin, M. A., & Cordes, J. M. 2003, ApJ, 596, 982
- McLaughlin et al. (2006) McLaughlin, M. A., Lyne, A. G., Lorimer, D. R., et al. 2006, Nature, 439, 817
- Metzger et al. (2017) Metzger, B. D., Berger, E., & Margalit, B. 2017, ApJ, 841, 14
- Michilli et al. (2018) Michilli, D., Seymour, A., Hessels, J. W. T., et al. 2018, Nature, 553, 182
- Mickaliger et al. (2012) Mickaliger, M. B., McLaughlin, M. A., Lorimer, D. R., et al. 2012, ApJ, 760, 64
- Murase et al. (2016) Murase, K., Kashiyama, K., & Mészáros, P. 2016, MNRAS, 461, 1498
- Ng et al. (2017) Ng, C., Vanderlinde, K., Paradise, A., et al. 2017, ArXiv e-prints, arXiv:1702.04728
- Oppermann et al. (2016) Oppermann, N., Connor, L. D., & Pen, U.-L. 2016, MNRAS, 461, 984
- Oppermann et al. (2018) Oppermann, N., Yu, H.-R., & Pen, U.-L. 2018, MNRAS, 475, 5109
- Oronsaye et al. (2015) Oronsaye, S. I., Ord, S. M., Bhat, N. D. R., et al. 2015, ApJ, 809, 51
- Palaniswamy et al. (2018) Palaniswamy, D., Li, Y., & Zhang, B. 2018, ApJ, 854, L12
- Palliyaguru et al. (2011) Palliyaguru, N. T., McLaughlin, M. A., Keane, E. F., et al. 2011, MNRAS, 417, 1871
- Pen & Connor (2015) Pen, U.-L., & Connor, L. 2015, ApJ, 807, 179
- Petroff et al. (2015a) Petroff, E., Johnston, S., Keane, E. F., et al. 2015a, MNRAS, 454, 457
- Petroff et al. (2015b) Petroff, E., Bailes, M., Barr, E. D., et al. 2015b, MNRAS, 447, 246
- Piro (2016) Piro, A. L. 2016, ApJ, 824, L32
- Popov & Postnov (2013) Popov, S. B., & Postnov, K. A. 2013, ArXiv e-prints, arXiv:1307.4924
- Ravi (2017) Ravi, V. 2017, ArXiv e-prints, arXiv:1710.08026
- Ravi et al. (2016) Ravi, V., Shannon, R. M., Bailes, M., et al. 2016, Science, 354, 1249
- Scholz et al. (2016) Scholz, P., Spitler, L. G., Hessels, J. W. T., et al. 2016, ApJ, 833, 177
- Spitler et al. (2014) Spitler, L. G., Cordes, J. M., Hessels, J. W. T., et al. 2014, ApJ, 790, 101
- Spitler et al. (2016) Spitler, L. G., Scholz, P., Hessels, J. W. T., et al. 2016, Nature, 531, 202
- Staelin (1969) Staelin, D. H. 1969, IEEE Proceedings, 57, 724
- Tendulkar et al. (2016) Tendulkar, S. P., Kaspi, V. M., & Patel, C. 2016, ApJ, 827, 59
- Tendulkar et al. (2017) Tendulkar, S. P., Bassa, C. G., Cordes, J. M., et al. 2017, ApJ, 834, L7
- The CHIME/FRB Collaboration et al. (2018) The CHIME/FRB Collaboration, :, Amiri, M., et al. 2018, ArXiv e-prints, arXiv:1803.11235
- Totani (2013) Totani, T. 2013, PASJ, 65, L12
- van Leeuwen (2014) van Leeuwen, J. 2014, in The Third Hot-wiring the Transient Universe Workshop, ed. P. R. Wozniak, M. J. Graham, A. A. Mahabal, & R. Seaman, 79–79
- Vedantham et al. (2016) Vedantham, H. K., Ravi, V., Hallinan, G., & Shannon, R. M. 2016, ApJ, 830, 75
- Zhang (2014) Zhang, B. 2014, ApJ, 780, L21
- Zhuravlev et al. (2011) Zhuravlev, V. I., Popov, M. V., Kondrat’ev, V. I., et al. 2011, Astronomy Reports, 55, 724
- Zhuravlev et al. (2013) Zhuravlev, V. I., Popov, M. V., Soglasnov, V. A., et al. 2013, MNRAS, 430, 2815