A Test of the Active Day Fraction Method of Sunspot Group Number Calibration: Dependence on the Level of Solar Activity
keywords:
Solar activity; sunspots; solar observations; solar cycle1 Introduction
Sec:Intro Calibration of different solar observers to compile a long, homogeneous sunspot number series is of great importance now, when the “classical” sunspot-number series have been found partly erroneous (Clette et al., 2014; Usoskin, 2017). Different methods of re-calibration of the sunspot number series were proposed (Clette et al., 2014; Lockwood, Owens, and Barnard, 2014; Svalgaard and Schatten, 2016; Clette and Lefèvre, 2016; Usoskin et al., 2016; Chatzistergos et al., 2017). While most of the new re-calibrations were based on the direct pairwise or “backbone” comparison of individual observers, forming a daisy-chain of calibrations with error accumulation in time, an alternative active-day-fraction (ADF) method was proposed by Usoskin et al. (2016) (refined by Willamo, Usoskin, and Kovaltsov, 2017). The ADF method is based on a comparison of the statistic of active day (days when at least one sunspot group was observed, as opposed to quiet days with no spots) occurrence for each observer to that of the reference dataset, which is the Royal Greenwich Observatory (RGO) series for the period 1900 – 1976 (see details given by Usoskin et al., 2016). As such, the method is free of daisy-chaining and error accumulation since each observer is compared directly to the reference dataset. As a drawback, however, the method may be somewhat sensitive to the overall level of solar activity during the period when the calibrated observer was making observations. This was qualitatively mentioned in our earlier works (Usoskin et al., 2016; Willamo, Usoskin, and Kovaltsov, 2017) but never investigated in sufficient detail. This issue has been actively discussed during several in-person meetings and teleconferences of a group working on the sunspot-number series re-calibration, and it has also led to some unpublished critique (Svalgaard and Schatten, 2017).
Accordingly, here we perform a full quantitative test of the dependence of the ADF method on the average solar-activity level during the period of observations of a calibrated observer.
2 Method
2.1 RGO Pseudo-Observers
The ADF method is tested using pseudo-observers based on the reference RGO dataset (available at solarscience.msfc.nasa.gov/greenwch.shtml). From the entire RGO dataset we have selected several subsets, each covering three solar cycle max-to-max intervals, with start times separated by one solar cycle, as listed in Table \irefTab:cycles. The periods covered by these pseudo-observers, correspond to different levels of solar activity, ranging from an average of 3.4 sunspot groups during the activity minimum around the turn of 19th and 20th centuries, to 6.15 groups during the Modern grand maximum. Each of these subsets was considered as a pseudo-observer and calibrated to the full reference dataset following the procedure described by Willamo, Usoskin, and Kovaltsov (2017). This approach makes it possible to directly assess possible biases of the method. Since the pseudo-observers are simply subsets of the reference dataset, the formal calibration should be (consistent with) zero: any non-zero difference between the “calibrated” and the reference data indicates a bias in the calibration procedure.
2.2 Observational Thresholds
In the framework of the ADF method, each observer is characterized by their observational threshold (), which is the minimum observed (i.e. uncorrected for foreshortening) area (in millionths of the solar disc: msd) of a sunspot group resolvable by the observer. In other words the observer is supposed to record all groups larger than, and miss all groups smaller than, . The value of , along with its uncertainties, is defined by matching the statistic (cumulative probability distribution function; cpdf) of the ADF occurrence recorded by the observer with that of the reference dataset by applying to the latter the observational threshold (see full details in Willamo, Usoskin, and Kovaltsov, 2017). This assumes that the calibrated observer is “poorer” than the reference observer, meaning that the positive threshold is applied to the reference dataset.
The formal application to the ADF calibration procedure to the pseudo-observers 1, 2 and 3 (see Table \irefTab:cycles) yields the thresholds of 15 to 45 msd, implying that these pseudo-observers appear poorer than the reference set. This can be understood as follows. Of course, all pseudo-observers must have the same quality (i.e. ) by construction, as subsets of the reference dataset. However, because of the low level of solar activity, there are fewer active days (lower ADF) during time interval 1, which is interpreted by the ADF method as a lower quality of the observer, or in other words, a positive threshold . This formal threshold is a bias of the method, related to the low level of activity, which is below the mean group number for the reference dataset. It appears large for pseudo-observers 1 and 2 but small, almost consistent with no threshold, for pseudo-observer 3.
The situation is inverted for pseudo-observers 4 through 6, which correspond to time intervals with enhanced solar activity . Because of that, there are more active days during these periods, which is interpreted by the method as a quality of the pseudo-observers higher than that of the reference dataset. This would lead to formally negative thresholds, which however does not make sense, since the sunspot group area cannot be negative. In order to deal with this, we define the negative threshold as follows. The threshold is considered negative when it is applied to the calibrated observer data, while keeping the reference dataset as it is (no threshold).
| Pseudo-observer | Time [years] | [msd] | |
|---|---|---|---|
| 1 | 1883.9 – 1917.6 | 3.43 | |
| 2 | 1894.1 – 1928.4 | 3.65 | |
| 3 | 1907.0 – 1937.4 | 4.01 | |
| 4 | 1917.6 – 1947.5 | 4.65 | |
| 5 | 1928.4 – 1957.9 | 5.4 | |
| 6 | 1937.4 – 1968.9 | 6.15 |
Tab:cycles
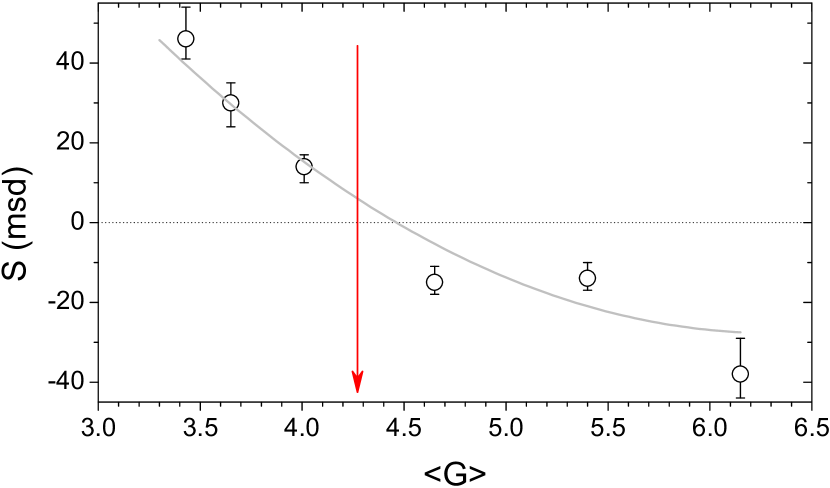
Thus-defined values of are given in Table \irefTab:cycles and presented in Figure \ireffig:S. One can see that the values of are positive for low-activity cycles (points left of the red arrow in the Figure) and negative for high-activity cycles, as expected. An interesting feature is that the relation between and is strongly non-linear, suggesting that the method is more accurate for moderate and high cycles than for low cycles. An eye-guiding line (best weighted-fit parabola) is shown for illustration.
2.3 Data “Correction”
Next we “corrected” the data of pseudo-observers, using the values of the threshold obtained above (Table \irefTab:cycles) and applying the procedure described earlier (Usoskin et al., 2016; Willamo, Usoskin, and Kovaltsov, 2017). For negative values of , the correction corresponding to was applied by inverting its sign (not added to but subtracted from the reported values). Corrections were applied to the RGO data for the corresponding pseudo-observers from Table \irefTab:cycles. Since they overlap in time, we apply the average over them for each day, as described by Willamo, Usoskin, and Kovaltsov (2017). The resultant “corrected” series is shown (with the 68 % confidence interval) in Figure \ireffig:DiffA in grey. One can see that the “corrected” series is slightly higher than the original one in the early part and slightly lower in the later part of the plot. The difference between the “corrected” and the original series is shown in panel B. Jumps are caused by the boundaries between pseudo-observers.
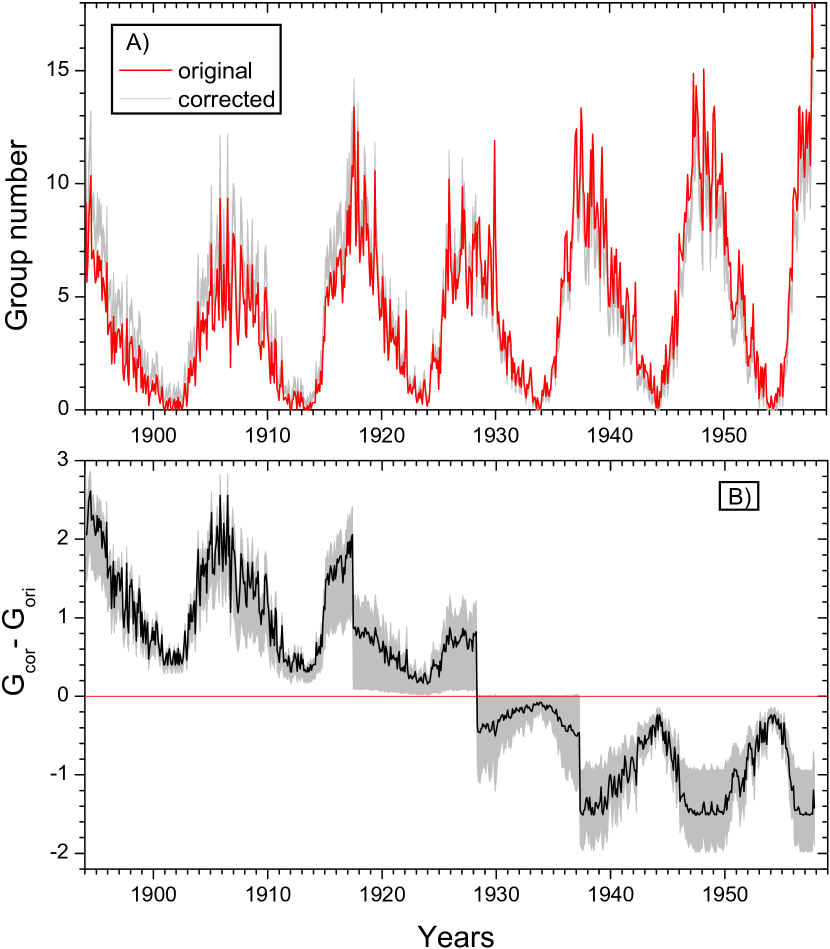
The group number () is significantly overestimated for low solar cycles (1894 – 1917), with the difference reaching 2.5 sunspot groups. Corrections are small and consistent with zero within the 68 % confidence interval for moderate cycles (1917 – 1937). Group number appears slightly underestimated, up to 1.5 groups, for high cycles (1937 – 1957), which include also the highest known solar cycle: No. 19.
3 Discussion and Conclusions
We have analyzed dependence of the ADF method of sunspot-group number re-calibration on the level of solar activity during the observational period of an observer. Such a dependence was discussed earlier (Usoskin et al., 2016) but not assessed quantitatively. Using fragments of the reference dataset of RGO we formed several pseudo-observers, who were formally calibrated against the full reference dataset. Since the pseudo-observers, by construction, are identical to the reference dataset, the true calibration must be zero or consistent with zero within uncertainties. Accordingly, any non-zero formal “correction” of the pseudo-observers can be interpreted as a bias in the method. We found that indeed, as proposed earlier, the ADF method tends to overestimate weak solar activity and underestimate high activity. However, the bias introduced is non-linear. While moderate cycles with the peak values of – 12 are reproduced correctly, high and very high cycles 12 – 17 may appear underestimated by 0.5 – 1.5 groups, or less than 10 %. On the other, hand, weak-moderate cycles with =7 – 9 appear overestimated by 2 – 2.5 groups, or about 30 %. As discussed by Usoskin et al. (2016), the ADF method cannot work with a very weak cycle, e.g. during the Dalton minimum. It is important to notice that this is related not to the height of individual cycles but to the average level of solar activity during the entire time span of a given observer.
As a result, in the long run, the ADF method tends to overestimate the overall level of activity and to reduce the long-term trends. Therefore, the sunspot-activity level reconstructed by the ADF method can be considered as a conservative upper limit for estimates of the long-term trends of solar activity.
In summary we conclude that:
-
•
The ADF method works accurately for the period of moderate solar activity.
-
•
Application of the ADF method may lead to a slight underestimate, by 0.5 – 1.5 sunspot groups (10 %), of solar activity during periods of high and very high activity.
-
•
Application of the ADF method may lead to a significant overestimate, up to 2.5 sunspot groups (30 %), of solar activity during periods of low-moderate activity.
-
•
Overall, the ADF method tends to overestimate the overall level of activity and reduce the long-term trends.
Acknowledgements
We are thankful for fruitful discussion to Frédéric Clette, Ed Cliver, Greg Kopp, Laure Lefévre, Andrés Mũnoz-Jaramillo, Alexei Pevtsov, Leif Svalggard, and José Vaquero. VarSITI/SCOSTEP is acknowledged for an opportunity to discuss this material during the 2nd VarSITI General Symposium (Irkutsk, 2017) This work was carried out in the framework of ReSoLVE Centre of Excellence (Academy of Finland, project no. 272157).
Disclosure of Potential Conflicts of Interest
The authors declare that they have no conflicts of interest.
References
- Chatzistergos et al. (2017) Chatzistergos, T., Usoskin, I.G., Kovaltsov, G.A., Krivova, N.A., Solanki, S.K.: 2017, New reconstruction of the sunspot group numbers since 1739 using direct calibration and “backbone” methods. Astron. Astrophys. 602, A69. DOI. ADS.
- Clette and Lefèvre (2016) Clette, F., Lefèvre, L.: 2016, The New Sunspot Number: Assembling All Corrections. Solar Phys. 291, 2629. DOI. ADS.
- Clette et al. (2014) Clette, F., Svalgaard, L., Vaquero, J.M., Cliver, E.W.: 2014, Revisiting the sunspot number: A 400-year perspective on the solar cycle. Space Sci. Rev. 186, 35. DOI.
- Lockwood, Owens, and Barnard (2014) Lockwood, M., Owens, M.J., Barnard, L.: 2014, Centennial variations in sunspot number, open solar flux, and streamer belt width: 1. Correction of the sunspot number record since 1874. J. Geophys. Res., Space Phys. 119, 5172. DOI. ADS.
- Svalgaard and Schatten (2016) Svalgaard, L., Schatten, K.H.: 2016, Reconstruction of the Sunspot Group Number: The Backbone Method. Solar Phys. 291, 2653. DOI. ADS.
- Svalgaard and Schatten (2017) Svalgaard, L., Schatten, K.H.: 2017, Assessment of the Failure of Active Days Fraction Method of Sunspot Group Number Reconstructions. ArXiv e-prints 1706.01154. ADS.
- Usoskin (2017) Usoskin, I.G.: 2017, A History of Solar Activity over Millennia. Living Rev. Solar Phys. 14, 3. DOI.
- Usoskin et al. (2016) Usoskin, I.G., Kovaltsov, G.A., Lockwood, M., Mursula, K., Owens, M., Solanki, S.K.: 2016, A New Calibrated Sunspot Group Series Since 1749: Statistics of Active Day Fractions. Solar Phys. 291, 2685. DOI. ADS.
- Willamo, Usoskin, and Kovaltsov (2017) Willamo, T., Usoskin, I.G., Kovaltsov, G.A.: 2017, Updated sunspot group number reconstruction for 1749-1996 using the active day fraction method. Astron. Astrophys. 601, A109. DOI. ADS.