Was the cosmic ray burst detected by the GRAPES-3 on 22 June 2015 caused by transient weakening of geomagnetic field or by an interplanetary anisotropy?
Abstract
The GRAPES-3 muon telescope in Ooty, India had claimed detection of a 2 hour (h) high-energy (20 GeV) burst of galactic cosmic-rays (GCRs) through a 50 surge in GeV muons, was caused by reconnection of the interplanetary magnetic field (IMF) in the magnetosphere that led to transient weakening of Earth’s magnetic shield. This burst had occurred during a G4-class geomagnetic storm (storm) with a delay of h relative to the coronal mass ejection (CME) of 22 June 2015 Mohanty16 . However, recently a group interpreted the occurrence of the same burst in a subset of 31 neutron monitors (NMs) to have been the result of an anisotropy in interplanetary space Evenson17 in contrast to the claim in Mohanty16 . A new analysis of the GRAPES-3 data with a fine 10.6∘ angular segmentation shows the speculation of interplanetary anisotropy to be incorrect, and offers a possible explanation of the NM observations. The observed 28 minutes (min) delay of the burst relative to the CME can be explained by the movement of the reconnection front from the bow shock to the surface of Earth at an average speed of 35 km/s, much lower than the CME speed of 700 km/s. This measurement may provide a more accurate estimate of the start of the storm.
I Introduction
It is well-known that the geomagnetic field (GMF) Olsen15 acts as the first line of defense by shielding the Earth from energetic galactic cosmic rays (GCRs) through magnetic deflection out to several Earth radii (RE) Dorman09 . The CMEs produced by the Sun are large bodies of plasma containing highly turbulent magnetic fields that are driven into heliosphere from the solar corona Webb12 . The interaction of this turbulent magnetized plasma with the GCRs produces a modulation of GCRs that offers an excellent probe of the space weather Kudela00 . The CMEs being a major driver of the space weather can have a large societal impact by triggering severe storms with potential to disrupt the space-, and ground-based communications. The largest storm in the recorded history was observed by Carrington in 1859 that disrupted the old rugged communication system of telegraph lines for several hours Carrington59 ; Liu14 . But the occurrence of a similar event today would surely cripple the modern infrastructure of mobile phones, computer networks on the ground, and the satellites in space. This is primarily due to an ever increasing miniaturization of the present day electronic devices that are unlikely to survive the high radiation environment created by a Carrington-class storm NASA08 ; OECD11 .
Reduction of the GCR intensity (GCRI) lasting several days due to turbulent IMF in a CME known as a Forbush decrease (FD), have been observed for decades Forbush38 . The episodes of short term increase (h) in the GCRI due to the lowering of the geomagnetic ‘cutoff rigidity Rc’ Smart05 were also reported earlier Kondo62 ; Kudo87 ; Dorman09 . The GRAPES-3 muon telescope had reported the detection of a 2 h burst starting 22 June 2015 19:00 UT, that was strongly correlated (94%) with a 40 nT surge in the IMF. A unique feature of this burst was a delay of about h relative to the IMF surge for which no satisfactory explanation was offered earlier. Monte Carlo simulations to reproduce this burst required compression of the IMF to 680 nT spread over several times the volume of Earth, followed by reconnection with the GMF leading to lower Rc had generated this burst Mohanty16 .
Recently, a group after examining the data from 31 NMs spread across the world had reported that only ten of them displayed a sharp feature similar to the GRAPES-3 burst. They claimed that any variation in Rc caused by the IMF will be a global process, which is inconsistent with the detection of the burst by only a subset of 31 NMs. They had offered an alternative interpretation of the GRAPES-3 burst as being a manifestation of an interplanetary anisotropy (IA) Evenson17 . In the present work this interpretation is critically examined through a new analysis of the GRAPES-3 data with a finer angular segmentation of 10.6∘.
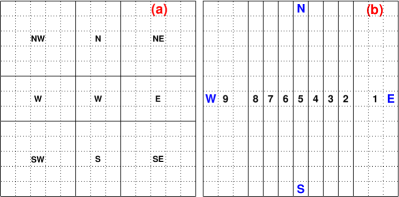
The large area (560 m2) GRAPES-3 muon telescope, hereafter called, ‘telescope’ is located in Ooty, India. The telescope experiences high cutoff rigidities (15–27 GV) due to its near-equatorial location (11.4∘N). The telescope measures the intensity of 1 GeV atmospheric muons produced by the GCRs, along 1313 = 169 directions in the sky Hayashi05 ; Nonaka06 . Thus, the muons serve as a good GCR proxy, and therefore, the terms ‘muon intensity’, and GCRI will be used interchangeably. In our previous work these 169 directions were combined into nine directions, covering a field of view (FOV) of 2.3 sr as shown in Fig. 1a Mohanty16 . However, here the 169 directions are combined in a different configuration, labeled 1 through 9 from East to West with a mean angular segmentation of (10.6∘ 1.1∘) as shown in Fig.1b. This scheme was used because an IA will first appear in direction 1, and then progressively later in directions 2, through 9. A maximum time delay of 5.5 h is expected to occur between directions 1, and 9.
As before, in the present analysis also the CME parameters including the solar wind speed (VSW), the IMF components Bx, By, Bz measured by the WIND spacecraft located at L1 (1.5106 km from Earth) from OMNIWeb were used Omniweb . The WIND data from OMNIWeb were already shifted in time to the bow shock nose to account for the propagation delay from the spacecraft Bargatze05 .
II Detection of the GRAPES-3 burst by other experiments
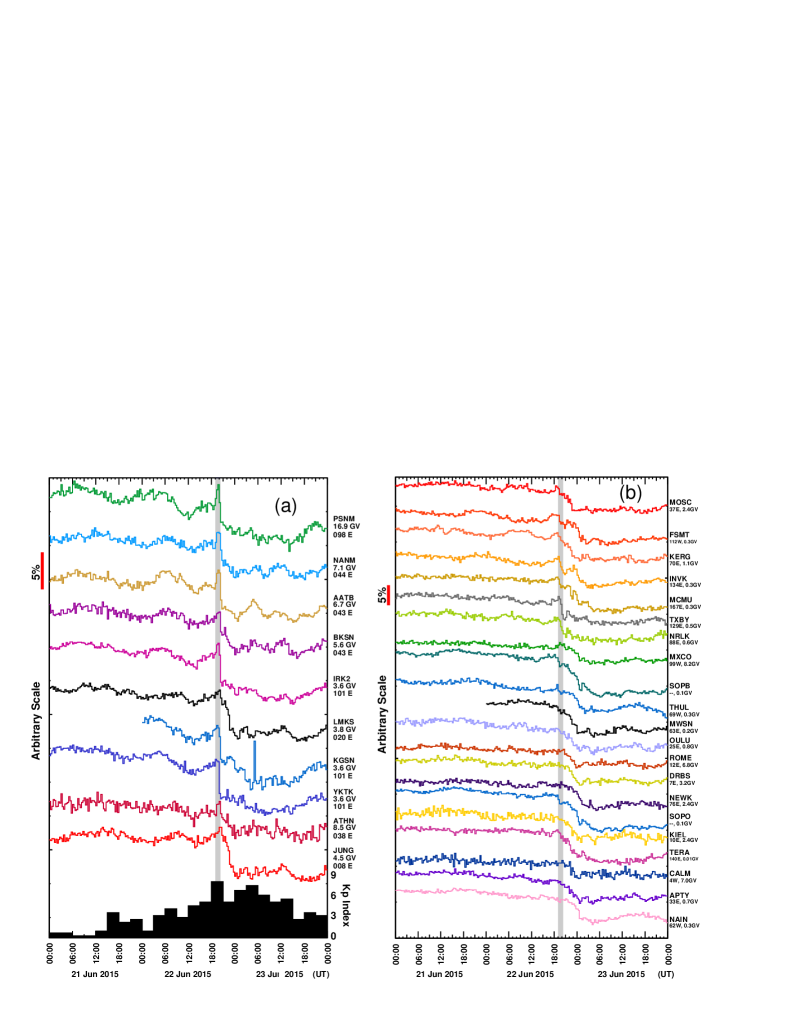
Recently, a group had reported detection of the burst from ten NMs as shown in Fig. 2a, while the remaining 21 NMs did not show any burst-like activity as seen from Fig. 2b, which is a exact reproduction of Fig. 2 from Evenson17 . One feature that stands out is the fact that the mean cutoff rigidity of the ten NMs detecting the burst was a high 6.4 GV, compared to 1.8 GV for the remaining 21 NMs that did not record the burst. This important feature will be discussed in some detail at the end of this section.
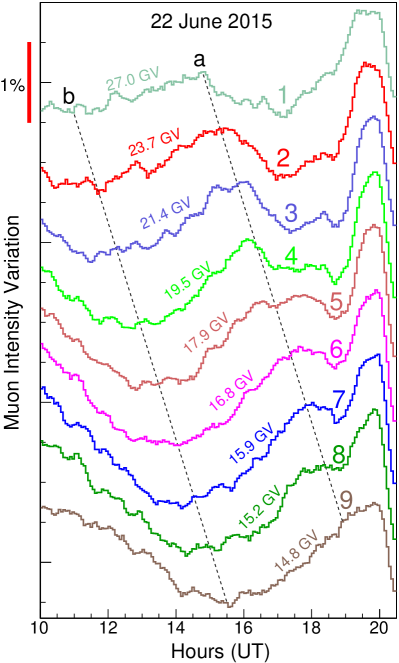
The muon intensity corrected for the instrumental, and atmospheric pressure variations Mohanty15 contains the modulation due to the FD, and the IA. For studying the IA, the muon intensity was smoothed by taking a 16 min running average. The resultant intensities are shown in Fig. 3 for the nine directions labeled 1 through 9, progressing from East to West as shown in Fig. 1b. The muon intensity shows a shift of the peak to later times for directions 2 through 9 just as expected for an IA. The locations of the IA peaks in Fig. 3 are indicated by an inclined line labeled ‘a’ and the valleys by ‘b’. The Rc for these directions varies from a high value of 27.0 GV for 1 to a low of 14.8 GV for 9. Interestingly, this decrease in Rc is associated with a steady increase of the IA amplitude from 1 to 9. The 2 h burst is clearly visible in each of the nine directions, and peaks at 20 UT in all cases in contrast to the IA that peaks at progressively later times for the western directions, eventually merging with the burst in direction 9.
The IA amplitude shows a clear power-law dependence on Rc with a spectral index of -1.5 for the rigidity range 15–27 GV. If such a dependence were to continue to lower rigidities, the IA could overwhelm the burst in low cutoff data shown in Fig. 2b. But for ten NMs with higher cutoffs (mean Rc = 6.4 GV), the IA amplitude might not have been too large, allowing the burst to stay visible as seen from Fig. 2a. A power-law behavior results in a strong dependence of the IA on Rc. But the burst being caused by a change in cutoff rigidity ‘Rc’ shows almost no dependence on Rc. Furthermore, due to high Rc the IA contribution in GRAPES-3 was small, making it sensitive to burst-like activity. To summarize, the IA, and burst are two distinct phenomena, the IA because of its interplanetary origin displays a direction dependent arrival time, and its amplitude shows a strong dependence on Rc. The burst due to its local origin close to the Earth occurs simultaneously in all nine directions, and its amplitude does not depend on Rc. The strong cutoff rigidity dependence of the IA offers a possible explanation for the inconsistent observation of the burst by the NMs.
III New simulations of the GRAPES-3 burst
Due to a slowly changing profile, the FD predominantly contributes to frequencies below 0.5 cycle per day (CPD), and the burst above 3.5 CPD. Thus, by designing, and implementing a suitable fast Fourier transform (FFT) based filter, the burst can be easily extracted. The data for 213 = 8192 intervals of 4 min each spanning 23 days (12 June 2015 18:28 UT – 4 July 2015 12:36 UT) were used, as before Mohanty16 . The muon data were analyzed by applying a filter to reject contributions from the FD, and IA by excluding frequencies below 3.5 CPD in the FFT spectrum. The inverse FFT of the filtered spectra for the nine E-W directions is shown in Fig. 4. The burst is visible in each direction that are labeled 1 through 9. Also shown on each plot, is the result of Monte Carlo simulations of the burst by superposed dotted lines as elaborated below.
In our previous work, the occurrence of the burst was explained by a lowering of the cutoff rigidity Rc which in turn was caused by the weakening of the GMF due to its reconnection with the IMF Mohanty16 . In a recent monograph, it was highlighted that typical solar wind speed VSW is 400 km/s when approaching the Earth, faster than typical waves in the solar wind including the fast magnetosonic speed VMS. At the bow shock, the plasma flow abruptly decreases over a short distance, with a corresponding increase in the plasma density, temperature, and magnetic field. For VSW far above VMS, the VSW decreases by a factor of 4 while the density, and magnetic field increase by the same factor Parker16 . In the present case, VSW being 700 km/s clearly fulfills this criterion. New simulations of the burst were carried out by implementing the above criterion by increasing the magnitude of the IMF by a factor of 4 for the duration of this study. The cutoff rigidities for the nine directions as shown in Fig.1b were calculated by tracing particle trajectories Smart05 in a GMF modeled by IGRF-11 IGRF11 as detailed in Mohanty16 . The time-dependent cutoff rigidities modified by a varying IMF were calculated every 4 min after adding 4IMF (4Bx, 4By, 4Bz) to the respective GMF components Mohanty16 .
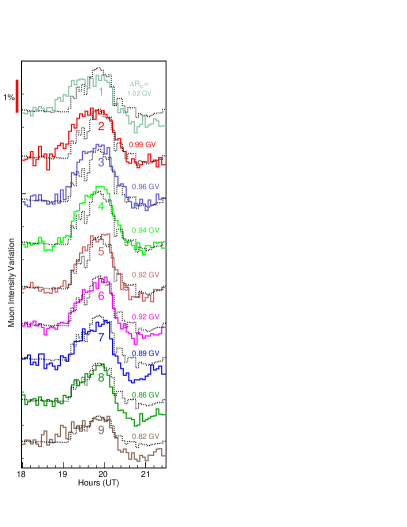
The atmospheric muons produced by the GCRs above Rc were simulated by using the Monte Carlo code CORSIKA CORSIKA . Muons meeting the telescope trigger requirement were binned into nine E-W directions shown in Fig. 1b. The difference in the muon intensity before, and after including the IMF was obtained every 4 min. The interval 18:00–18:30 UT was used as the baseline to estimate the change in muon intensity for both the data, and simulations. Simulated burst amplitudes were smaller than the measured ones. When the simulations were repeated after enhancing the IMF by a factor 2 f 6 for the duration of the burst, it showed that the amplitude of the effect scaled with ‘f’. A 28 min delay of the simulated profiles maximized their correlation with the muon intensity profiles. A simultaneous minimization of for the nine pairs of observed, and simulated profiles yielded f = (5.250.58), implying an IMF enhancement by a factor of 4(5.250.58) = (212.3).
The simulated profiles are shown in Fig. 4 by dotted lines. High correlation coefficients (mean = 0.910.03) between the two profiles are seen in all nine cases. The maximum reduction in Rc was found to vary from 1.02 in the East to 0.82 GV in the West. Thus, a simple model of the IMF enhancement by a factor of 212.3 (Bz = -84090 nT) inside the shock front reproduced the amplitude, and the shape of each profile remarkably well. The burst amplitude shows a gradual increase from East to West, reaching a maximum in direction ‘5’, and then decreasing again. This behavior is also reproduced in the simulated profiles. The concurrent change in Rc offers a natural explanation for simultaneous 2 h GCRI surge in all nine directions. A mean offset of only (-1.52) min among the nine directions obtained from a cross correlation is consistent with a zero offset within the 4 min telescope resolution. For an interplanetary phenomenon, the expected time offset between any two directions should increase with the angle between them, reaching about 5.5 h for ‘1,’ and ‘9’. The near simultaneity of the burst in all nine directions supports its origin close to the Earth, well within the magnetosphere.
IV Discussion
A new analysis of the GRAPES-3 data by segmenting its FOV into nine 10.6∘ wide E-W directions showed a clear presence of an IA along with the burst. The IA displayed a progressive shift in phase when viewed from directions ‘1’ through ‘9’, as expected for an interplanetary phenomenon. The strong rigidity dependence of IA seen by the GRAPES-3 offers a possible explanation for the detection of burst by ten NMs operating at high Rc (mean = 6.4 GV), and not by 21 NMs at low Rc (mean = 1.8 GV) Evenson17 . The effectiveness of the FFT based filter as a tool to isolate the burst by removing the IA as seen from Fig. 4 may be exploited by others to detect burst-like activity in their data. It is to be noted that during the storm both the data, and simulations display nearly identical behavior as seen from Fig. 4. An enhancement of the IMF by a factor of (212.3) is required for the simulations to reproduce the data. This value is within 1.2 of the old value of 17 reported earlier from a different analysis scheme Mohanty16 . The change in the cutoff rigidity ‘Rc’ gradually decreases by about 20% from 1.02 to 0.82 GV for directions ‘1’ through ‘9’. A correlation coefficient of 0.91 between the nine sets of data, and simulated profiles implies a significance of nearly 14 , supporting the hypothesis that the burst was caused by the lowering of Rc due to the storm.
As noted before the solar wind speed VSW is supersonic that abruptly slows down by a factor of 4, and the IMF increases by the same factor at the bow-shock Parker16 ; Kulsrud04 . However, the arrival of the CME shock front on 22 June 2015, 18:40 UT caused a compression of the bow shock Mohanty16 , and triggered magnetic reconnection. Generally, the reconnection front moves slower than the Alfvén speed Parker73 . The CME would have traveled unimpeded from L1 to the bow shock at 11 RE Omniweb . Thus, the 28 min delay measured by the GRAPES-3 would have occurred after crossing the bow-shock. This delay implies an average speed of 35 km/s for the reconnection front. This is considerably sub-Alfvénic, and much slower than the near-Earth CME speed of 700 km/s. The high fidelity reproduction of the burst by its simulated profile (91% correlation) supports the hypothesis of IMF enhancement (4), and compression (5.25) due to the interaction of the CME shock with the bow shock. Such bursts offer a unique phenomenological probe of a highly turbulent environment created by two interacting shock fronts. It is clearly shown that in large solar particle events the muon intensity at GRAPES-3, and the response of the neutron monitors around the world depends on two distinct phenomena, (i) changes in the local cutoff rigidity due to reconnection processes, and (ii) anisotropies of interplanetary cosmic-ray intensities. This recognition should lead to improved interpretation and coordination of these related data sets.
It should be noted that the measurement of the CME properties at L1 by the satellites is an essential requirement for obtaining an initial estimate of the storm arrival time on Earth. Since the burst is caused by the change in GMF in the vicinity of Earth, the start time of the storm estimated from the burst is likely to be more accurate than the extrapolation of the CME measurements from L1. Here it should be emphasized that the present work is the outcome of a post facto analysis. The GRAPES-3 telescope has collected uninterrupted data since early 1999, which is being analyzed to extract more burst-like events. The discovery of more bursts associated with CMEs of different speeds, and IMF values should lead to a better understanding of the storm arrival time on Earth with the potential for real-time space weather forecasts. Since the only known preventive measure to avoid damage to modern space, and ground based technological assets by a super-storm is to disable their electrical supply, therefore, any development leading to a better estimate of the arrival time of future super-storms is highly desirable.
V Conclusions
The GRAPES-3 muon telescope in Ooty, India had reported the detection of a 2 h burst of 20 GeV GCRs starting 22 June 2015 19:00 UT. A new analysis of this data in nine E-W directions with 10.6∘ segmentation showed the burst was accompanied by an IA with a strong rigidity dependence that can naturally explain the inconsistent detection of the burst by 31 NMs located across the globe. Based on measured 28 min delay of the storm during the 22 June 2015 burst indicates that the reconnection front in the magnetosphere of the Earth was moving with a speed of 35 km/s. The discovery of more burst-like events in the existing 19 years of data may be helpful in providing a better estimate of the arrival time of future super-storms.
VI Acknowledgments
We thank D.B. Arjunan, V. Jeyakumar, S. Kingston, K. Manjunath, S. Murugapandian, S. Pandurangan, B. Rajesh, K. Ramadass, V. Santoshkumar, M.S. Shareef, C. Shobana, R. Sureshkumar for their help in running the experiment. We are grateful to Profs. A. Kakodkar, K. Kasturirangan, B.V. Sreekantan, and M.R. Srinivasan for inspiring, and stimulating discussions.
References
- (1) P.K. Mohanty et al., Phys. Rev. Lett. 117, 171101 (2016).
- (2) P. Evenson et al., Proc. 35th Int. Cosmic Ray. Conf. Busan, PoS(ICRC2017)133 (2017).
- (3) N. Olsen et al., Geophys. Res. Lett. 42, 1092 (2015).
- (4) L.I. Dorman, Cosmic Rays in Magnetosphere of Earth and Planets, Springer, ISBN 978-1-4020-9239-8 (2009).
- (5) D.F. Webb, T.A. Howard Living Rev. Solar Phys. 9, 3 (2012).
- (6) K. Kudela, M. Storini, M.Y. Hofer, and A. Belov, Rev. Space Sci. 93, 153 (2000).
- (7) R.C. Carrington, Mon. Not. R. Astron. Soc. 20, 13 (1859).
- (8) Y.D. Liu et al., Nature Comm. 5, 3481 (2014).
- (9) Severe Space Weather Events–Understanding Societal and Economic Impacts: A Workshop Report, DOI 10.17226/12507
- (10) http://www.oecd.org/gov/risk/46891645.pdf
- (11) S. E. Forbush, Phys. Rev. 54, 975 (1938); H.V. Cane, Space Sci. Rev. 93, 55 (2000); P. Subramanian et al., Astron. Astrophys. 494, 1107 (2009); K.P. Arunbabu et al., Astron. Astrophys. 555, A139 (2013); K.P. Arunbabu et al., Astron. Astrophys. 580, A41 (2015).
- (12) D.F. Smart and M.A. Shea, Adv. Space Res. 36, 2012 (2005).
- (13) I. Kondo, J. Phys. Soc. Japan 17, 402 (1962).
- (14) S. Kudo et al., J. Geophys. Res. 92, 4719 (1987).
- (15) Y. Hayashi et al., Nucl. Instrum. Meth. A 545, 643 (2005).
- (16) T. Nonaka et al., Phys. Rev. D 74, 052003 (2006).
- (17) http://omniweb.gsfc.nasa.gov/form/omni_min.html
- (18) L.F. Bargatze et al., J. Geophys. Res. 110, A07105, (2005).
- (19) P.K. Mohanty et al., Proc. of Science (ICRC2015) 045; P.K. Mohanty et al., Astropart. Phys. 79 23 (2016).
- (20) Magnetic Reconnection, Concepts and Applications, Springer, ISBN: 978-3-319-26430-1 Ed: W.D. Gonzalez, and E.N. Parker, (2016).
- (21) C. Finlay et al., Geophys. J. Int. 183, 1216 (2010).
- (22) https://www.ikp.kit.edu/corsika/
- (23) R.M. Kulsrud, Plasma Physics for Astrophysics, Princeton U. Press, ISBN: 978-0691120737 (2004).
- (24) E.N. Parker, Astrophys. J. 180, 247 (1973); K.P. Dere, Astrophys. J. 472, 864 (1996); L. Comisso, and A. Bhattacharjee, J. Plasma Phys. 82, 595820601 (2016); P.A. Cassak, Y.-H. Liu and M.A. Shay, J. Plasma Phys. 83, 715830501 (2017).