Using late-time optical and near-infrared spectra to constrain Type Ia supernova explosion properties
Abstract
The late-time spectra of Type Ia supernovae (SNe Ia) are powerful probes of the underlying physics of their explosions. We investigate the late-time optical and near-infrared spectra of seven SNe Ia obtained at the VLT with XShooter at 200 d after explosion. At these epochs, the inner Fe-rich ejecta can be studied. We use a line-fitting analysis to determine the relative line fluxes, velocity shifts, and line widths of prominent features contributing to the spectra ([Fe ii], [Ni ii], and [Co iii]). By focussing on [Fe ii] and [Ni ii] emission lines in the 7000–7500 Å region of the spectrum, we find that the ratio of stable [Ni ii] to mainly radioactively-produced [Fe ii] for most SNe Ia in the sample is consistent with Chandrasekhar-mass delayed-detonation explosion models, as well as sub-Chandrasekhar mass explosions that have metallicity values above solar. The mean measured Ni/Fe abundance of our sample is consistent with the solar value. The more highly ionised [Co iii] emission lines are found to be more centrally located in the ejecta and have broader lines than the [Fe ii] and [Ni ii] features. Our analysis also strengthens previous results that SNe Ia with higher Si ii velocities at maximum light preferentially display blueshifted [Fe ii] 7155 Å lines at late times. Our combined results lead us to speculate that the majority of normal SN Ia explosions produce ejecta distributions that deviate significantly from spherical symmetry.
keywords:
supernovae: general – techniques: spectroscopic – line: profiles1 Introduction
Type Ia supernovae (SNe Ia) are the violent luminous deaths of carbon-oxygen white dwarfs in binary systems. Despite being precision probes of the cosmological parameters (e.g. Betoule et al., 2014), we still do not understand the mechanisms that lead to their explosions. Proposed explosion scenarios are generally split into two broad classes depending on the properties of their companion stars at the time of explosion. These are the ‘double-degenerate’ scenario (Iben & Tutukov, 1984; Webbink, 1984), where the companion star is another white dwarf and the ‘single-degenerate’ scenario (Whelan & Iben, 1973), where the companion star is a main sequence or giant star. Alternatively the competing scenarios can be framed in terms of the primary white dwarf mass at the time of explosion: those that explode near the Chandrasekhar mass limit, ‘Mch explosions’ or those that explode significantly below the Chandrasekhar mass limit, ‘sub-Mch explosions’. Historically, Mch explosions were thought to be responsible for the bulk of normal SNe Ia. However, sub-Mch explosions have been the focus of a number of recent studies. These sub-Mch models include both double-detonation scenarios (Nomoto, 1982; Livne & Glasner, 1990; Bildsten et al., 2007; Fink et al., 2010; Shen & Bildsten, 2014), where a thin layer of He on the surface of the white dwarf ignites to cause a subsequent core detonation, as well as double white-dwarf mergers where the individual masses can be well below the Chandrasekhar mass (Yoon et al., 2007; Dan et al., 2011; Pakmor et al., 2012).
Observational evidence in favour (and disfavour) of both Mch and sub-Mch explosions has been put forward, with the current evidence suggesting that there is more than one channel for producing normal SNe Ia. This evidence comes from a number of probes, not limited to companion star interaction at early times, signatures of circumstellar material, presence of H and He features stripped from a companion star, studies of SN remnants nucleosynthetic yields (e.g. Mattila et al., 2005; Leonard, 2007; Sternberg et al., 2011; Maguire et al., 2013; Seitenzahl et al., 2013a; Scalzo et al., 2014; Olling et al., 2015; Marion et al., 2016; Martínez-Rodríguez et al., 2017).
A key distinguishing prediction between Mch and sub-Mch explosions is the different ratios of stable to radioactive isotopes of Fe-group elements produced. This ratio depends on the central density of the white dwarf at the time of explosion (Höflich et al., 2004). Steadily-accreting Mch models predict significantly higher central densities (109 g cm-3) than sub-Mch models where the central densities are expected to be much lower (107 g cm-3; Pakmor et al., 2012; Rosswog et al., 2009; Shen et al., 2018). Higher central densities manifest themselves as larger ratios of stable (e.g. 54Fe, 58Ni) to radioactively-produced (56Fe) isotopes due to increased electron capture in these high-density environments.
Investigating the central density requires spectra at late times when the inner regions of the ejecta are visible. This occurs at phases of 200 d after peak magnitude when the outer ejecta have become transparent and we can see the inner Fe-group dominated regions. Detailed modelling has been performed to provide a comparison with a number of nearby SNe Ia (e.g. Axelrod, 1980; Ruiz-Lapuente & Lucy, 1992; Spyromilio et al., 1992; Liu et al., 1997; Mazzali et al., 2007, 2015; Fransson & Jerkstrand, 2015; Botyánszki & Kasen, 2017; Wilk et al., 2018). However, there are many differences between the models that depend on the inputs to the code, as well as in the details of the radiative transfer codes themselves. A good match to the shape and strength of the Ni and Fe complex at 7300 Å is difficult to achieve, which results in different implied masses of neutron-rich stable Ni material. Some predicted the presence of significant quantities of stable Ni for SN 2011fe (Mazzali et al., 2015), while others suggested for the same SN that stable Ni is not required (Botyánszki & Kasen, 2017). Therefore, we have adopted an agnostic approach to determining the abundance ratios using empirical, model-independent methods. However, we stress that radiative transfer modelling of SNe Ia at late-times is vital for providing detailed constraints on ejecta abundances and understanding SN Ia explosion physics.
The late-time spectra of SNe Ia have also provided information on potential asymmetries in the ejecta (Motohara et al., 2006; Gerardy et al., 2007; Maeda et al., 2010b). A link between maximum light Si ii velocity gradients and the wavelength shifts of late-time emission lines was identified, with SNe Ia with high Si ii velocities having preferentially redshifted late-time emission lines (Maeda et al., 2010a). It was suggested that variations in the observed properties (light-curve widths, line velocities) are a consequence of different viewing angles of an explosion with an off-centre ignition point. A tentative link between the late-time velocity shifts and SN Ia maximum-light colours has also been studied (Cartier et al., 2011; Maeda et al., 2011; Blondin et al., 2012).
In this paper, we investigate the largest sample to date of optical through near-infrared (NIR) spectral observations of SNe Ia at phases later than 200 d. At these epochs, the inner Fe-rich regions of the ejecta can be used to investigate the extent of line-emitting regions, signatures of asymmetry, and the relative abundances of stable to radioactive elements. In Section 2, we present the VLT+XShooter observations, complementary maximum-light spectral and photometric observations, as well as details of a comparison literature sample. In Section 3, the line-fitting analysis is described, combined with specific details of fitting for the prominent spectral features. The measurements of the late-time velocity shifts, the colour evolution, and calculations of the Ni to Fe abundance ratio are detailed in Sections 4, 5, and 6, respectively. A discussion of the results is presented in Section 7, and the conclusions are given in Section 8.
| SN | Observation | MJDa | Phaseb | Exposure | |
|---|---|---|---|---|---|
| date | (d) | time (s) | |||
| SN2013aa | 20140421 | 56769.2 | 425 | 7480 | |
| ASASSN14jg | 20150919 | 57285.2 | 322 | 2900 | |
| ASASSN15be | 20151021 | 57317.3 | 266 | 5800 | |
| PSNJ1149 | 20160202 | 57421.3 | 206 | 2900 | |
| ASASSN15hx | 20160626 | 57566.1 | 427 | 2980 |
aMJD = Modified Julian date.
bPhase of late-time spectrum calculated with respect to maximum light.
| Name | Phasea | Host galaxy | Helio. zb | E(B-V)c | Stretchd | Date of max.e | B - V at max. | Si ii vel. at max. | LC Ref.f | Spec. ref.f |
|---|---|---|---|---|---|---|---|---|---|---|
| (d) | (mag) | (mag) | () | |||||||
| SN 2012cg | 339 | NGC 4424 | 0.0015 | 0.20g | 1.0980.022 | 20120603 | 0.140.04 | 10420100 | 1 | 1 |
| SN 2012fr | 357 | NGC 1365 | 0.00546 | 0.018 | 1.1350.010 | 20121112 | 0.020.03 | 11928100 | 2,3 | 4 |
| SN 2012ht | 433 | NGC 3447a | 0.00355 | 0.026 | 0.8770.022 | 20130103 | 0.040.02 | 11000 | 1 | 1 |
| SN 2013aa | 360,425 | NGC 5643 | 0.003999 | 0.169 | 1.1460.019 | 20130221 | 0.050.01 | 10600100 | 1 | 1 |
| SN 2013cs | 303 | ESO 576- G 017 | 0.00924 | 0.082 | 0.9630.024 | 20130526 | 0.030.05 | 12700150 | 5 | 6 |
| SN 2013ct | 229 | NGC 0428 | 0.00384 | 0.025 | – | 20130504 | – | – | – | – |
| PSNJ11492548 | 206 | NGC 3915 | 0.0056 | 0.025 | – | 20150712 | – | 10386100 | – | 4 |
| ASASSN14jg* | 322 | PGC 128348 | 0.014827 | 0.014 | 1.0530.007h | 20141102 | – | 10928200 | 7 | 4 |
| ASASSN15be* | 266 | GALEX J0252i | 0.0219 | 0.017 | – | 20150129 | – | 11900200 | – | 4 |
| ASASSN15hx* | 427 | GALEX J1343i | 0.0084 | 0.043 | – | 20150427 | – | 10407200 | – | 4 |
∗NIR region of the spectrum is too low S/N for a detailed analysis to be performed. Used only in comparison with literature sample for line shift analysis of Maeda et al. (2010a).
aPhase of late-time spectrum calculated with respect to maximum light.
bHeliocentric redshifts are from the Nasa Extragalactic Database (NED), apart from ASASSN15hx, where the redshift is measured from narrow H emission from a WiFES (Childress et al., 2016) spectrum on 20150708, and SN 2012cg from Cortés et al. (2006).
cGalactic E(B-V) values from Schlafly & Finkbeiner (2011).
dStretch is a measure of the light curve width (Conley et al., 2008).
eMaximum light estimated from a light curve where available or estimated from the early-time spectra if not.
fSources for maximum-light photometry and Si ii 6355 Å velocities: (1) Maguire et al. (2013) (2) Silverman et al. (2015), (3) Zhang et al. (2014) (4) Childress et al. (2013a), (5) this paper, (6) Childress et al. (2016), (7) Graham et al. (2017).
gAdditional host galaxy extinction of E(B-V)=0.18 mag was found for SN 2012cg by Silverman et al. (2012). The value quoted here is the combined Galactic and host galaxy E(B-V).
hConverted from a m15(B) value to a SiFTO stretch using the relation from Conley et al. (2008).
iFull name of galaxies: GALEX J0252 = GALEXASC J025245.83-341850.6, GALEX J1343 = GALEXASC J134316.80-313318.2
2 Observations and Data Reduction
Our analysis is performed on a sample of 8 spectra of 7 SNe Ia with high signal-to-noise (S/N) optical and NIR spectral coverage at epochs greater than 200 d after maximum light. We use six spectra from the VLT+XShooter SN Ia sample presented in Maguire et al. (2016), combined with two new XShooter SN Ia spectra. Spectra of three additional SNe Ia obtained with XShooter are also presented but do not have high enough S/N in the NIR to be analysed in detail.
2.1 Late-time spectroscopy with XShooter
The spectra in our sample were obtained using the VLT+XShooter, which is an echelle spectrograph with three arms (UVB, VIS, NIR) covering the wavelength range 3000–25000 Å (Vernet et al., 2011). We used a setup with slit widths of 0.8, 0.9, and 0.9 arcsec in the UVB, VIS and NIR arms, respectively. The spectra were reduced using the REFLEX pipeline to produce flux-calibrated one-dimensional spectra (Modigliani et al., 2010; Freudling et al., 2013) as described in Maguire et al. (2016).
Five late-time spectra of SNe Ia are presented for the first time here, ASASSN14jg, ASASSN15be, PSNJ11492548-0507138 (hereafter PSNJ1149), ASASSN15hx, and a second epoch of SN 2013aa (Table 1). These spectra were reduced in the same manner as in Maguire et al. (2016), and flux calibrated using photometric measurements from the acquisition images. For PSNJ1149 and SN 2013aa, the acquisition image photometry was calibrated using the XShooter acquisition camera zero-points. The spectra of ASASSN15hx were flux calibrated to coeval photometry using g’ acquisition imaging calibrated by comparison to catalogue Pan-STARRS111http://archive.stsci.edu/panstarrs/search.php magnitudes (Chambers et al., 2016; Magnier et al., 2016). Due to the faintness of ASASSN14jg and ASASSN15be in their acquisition images, these spectra remain without absolute flux-calibration. However, since we deal only with relative line fluxes this does not affect any of our conclusions.
Telluric corrections have been applied to the spectra using the molecfit package (Smette et al., 2015; Kausch et al., 2015). For the spectra of ASASSN15be and ASASSN15hx, the low S/N did not allow for accurate fitting of the telluric regions. The spectra were corrected to their rest wavelengths using their heliocentric velocities and for Galactic extinction using the Galactic E(B-V) values given in Table 2.
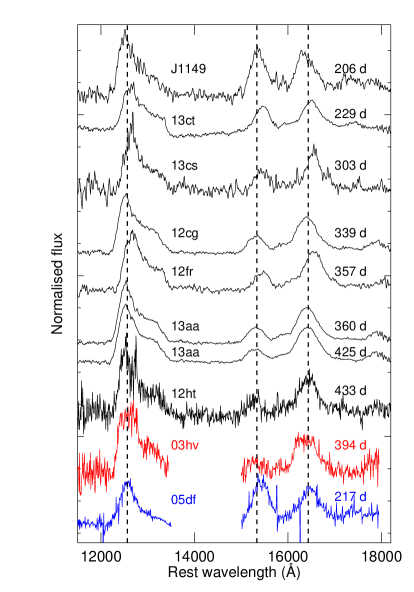
Of the five new late-time spectra, two (PSNJ1149, SN 2013aa) are included in the full analysis, while the spectra of ASASSN14jg, ASASSN15be and ASASSN15hx have lower S/N spectra, particularly in the NIR region of the spectrum. Therefore, they are excluded from the full analysis and only used in the comparison line-shift analysis presented in Section 4. The optical and NIR spectra for the sample used in the detailed analysis are shown in Fig. 1.

2.2 Maximum-light spectroscopy
Maximum-light spectroscopy (within 5 d of max.) has been used to constrain the Si ii 6355 Å velocities at maximum for our late-time spectral sample. For SNe 2012cg, 2012fr, 2012ht, 2013aa and 2013cs, these values were obtained from the literature as detailed in Table 2. This is supplemented with unpublished data for four other SNe Ia in the sample, described below.
For PSNJ1149, a maximum-light classification spectrum was obtained with the Shane 3-m telescope of the Lick Observatory using the Visible and Near-Infrared Imaging Spectrograph (VNIRIS) (Rudy et al., 2015), from which a Si ii velocity at maximum was measured. ASASSN14jg was spectroscopically classified at the 2-m Las Cumbres Observatory (LCO) telescope (Brown et al., 2013) with the FLOYDS spectrograph on 20141102 (at maximum) and from which a Si ii velocity was measured. For ASASSN15be, the Public ESO Spectroscopic Survey of Transient Objects (PESSTO; Smartt et al., 2015) obtained a spectrum on 20150126 with EFOSC2 on ESO’s New Technology Telescope. A Si ii velocity was measured from this spectrum that is consistent with a phase of 3 d with respect to maximum light. ASASSN15hx was also spectroscopically observed at the 2-m LCO telescope with FLOYDS on 20150505 and 20150511 (3 and 3 d from maximum). The Si ii velocity at maximum was taken as the mean of these two values. These Si ii 6355 Å velocities are provided in Table 2.
2.3 Photometry and light-curve analysis
The light curve properties (light-curve width, optical colour at maximum) for four SNe Ia in our sample were obtained from the literature (see references in Table 2). A gri-band light curve of SN 2013cs obtained with the LCO 1-m telescope array is presented here for the first time (Table 4). The magnitude of the SN was measured using Point Spread Function photometry and calibrated using reference stars in the field of the SN with magnitudes from the Pan-STARRS Data Release 1 catalog222http://archive.stsci.edu/panstarrs/search.php. The light curve width (‘stretch’) of SN 2013cs was calculate using the SiFTO light curve fitting code (Conley et al., 2008) to produce a stretch value and the B – V colour at maximum. No early-time photometric measurements are available for the five remaining objects in our sample.
2.4 Literature sample
To perform a comparison with literature spectra, we have compiled a sample of late-time spectra with phases that match those of our XShooter data (200–430 d). The late-time spectra come from literature spectral compilations (Maeda et al., 2010a; Blondin et al., 2012; Silverman et al., 2013; Childress et al., 2015), along with additional spectra of SN 2010ev (Gutiérrez et al., 2016) and SN 2011fe (Mazzali et al., 2015; Graham et al., 2015). Si ii 6355 Å velocities within 5 d of maximum were also complied from the literature. The majority of the Si ii velocities are from spectra from Blondin et al. (2012), supplemented with values for individual objects: SN 2003gs (Suntzeff et al., 2003), SN 2010ev (Gutiérrez et al., 2016), SN 2011by (Silverman et al., 2013), SN 2011fe (Maguire et al., 2014), SN 2013dy (Pan et al., 2015), and SN 2014J (Ashall et al., 2014).
3 Line-fitting analysis of late-time spectra
The late-time optical and NIR spectra of SNe Ia are dominated by emission lines of Fe-group elements, [Fe iii], [Fe ii], [Co iii], and [Ni ii] lines (e.g. Axelrod, 1980; Meyerott, 1980). Our aim was to use a line-fitting code on individual Fe-group spectral regions to determine the contribution of different elements to the main emission line groups seen in the optical and NIR spectra of a sample of SNe Ia. We were interested in three regions of their optical and NIR spectra: i) the 12600 Å region that is dominated by [Fe ii] lines, ii) the 7300 Å region that has contributions from [Fe ii] and [Ni ii], as well as a potential contribution from [Ca ii], and iii) the 6000 Å region, which is dominated by [Co iii] emission. The lines identified to be important in the 7300 Å region are the same as for core-collapse SN case studied in Jerkstrand et al. (2015b), and we follow a similar analysis procedure, detailed below.
For [Fe ii] and [Ni ii], the line-fitting code uses the latest atomic data (e.g. rest wavelengths, transition probabilities) from the cmfgen compilation (Hillier & Miller, 1998; Hillier & Dessart, 2012), which includes the forbidden line data from Quinet & Le Dourneuf (1996) and Quinet et al. (1996). For [Co iii] we use the atomic data from Tyndall et al. (2016).
Using the Sobolev formula and reasonable numbers for the densities and velocity gradients, we found that an optically-thin approximation for the relative line strengths is appropriate in this wavelength range. Assuming local thermodynamic equilibrium (LTE), the relative line strengths were calculated from temperatures in the range of 3000–8000 K, which is the expected range for SNe Ia at these phases (Fransson & Jerkstrand, 2015). The values used in the fits are the mean values of the line strengths in this temperature range. Line strengths are calculated relative to the strongest feature in a wavelength region. Lines that have a strength of 5 per cent of the strongest line in the region are excluded since they have a negligible influence on the fit. For the three main spectral regions discussed, the strongest two lines in each case come from the same upper energy level and therefore, their relative strengths are temperature independent.
3.1 Fitting method
Gaussian profiles are used to fit the emission lines of the Fe-group elements since the emitting regions of these features are expected to be centrally concentrated. The fitting of the emission features was performed in the following way. Continuum points to the red and blue of the spectral region under consideration were chosen interactively. These are difficult to set automatically because the velocity offsets are found to vary between objects, as well as due to changes in the background levels depending on the epoch of the spectrum. The relative strengths of lines of the same element and ionisation state were constrained using the radiative transition rates and the assumption of LTE level populations, as detailed above. The widths and velocities (relative to the rest wavelength) of features of the same element and ionisation state in the same spectral region were set to the same value since they are expected to be produced by the same regions. Loose priors were placed on some values as described below for the individual spectral regions.
The uncertainties in the fitting regimes were calculated using a Monte-Carlo approach. The largest uncertainties arise from the placement of the continuum points to the red and blue of the features under investigation. To produce an estimate of the uncertainties from this, the interactively chosen continuum values were varied by random amounts up to 10 Å to the blue and red of this value and the fitting was then repeated. This was performed 3000 times to produce mean fit values and relative uncertainties. An additional uncertainty on the velocity measurements of 200 was added to account for peculiar velocity effects of the host galaxies. The best fit values for the spectral regions studied, in terms of the velocity offset, full width at half maximum (FWHM), and pseudo-equivalent width (pEW), are presented in Table 3.
The 4000 – 5700 Å region shows the strongest Fe emission features. However, it is also the most complex with contributions from both [Fe ii] and [Fe iii] lines that are difficult to disentangle. The ratio of the strongest [Fe iii] lines (4658, 5270, 5011 Å) are also sensitive to temperature changes. Previous detailed spectral modelling of this region has failed to accurately model it, despite reasonably good agreement at other wavelengths (Maurer et al., 2011; Mazzali et al., 2015; Fransson & Jerkstrand, 2015). We attempted to fit this region but the fits were in general not good. Therefore, we leave further analysis of this region to the detailed simulations of Shingles et al. (in prep.). For comparison with other works (e.g. Black et al., 2016), we used the position of the peak as a measure of the velocity of the 4700 Å feature (using a fit with just two lines with rest wavelengths of 4658 and 4702 Å).
We also excluded the 15000–18000 Å region from detailed analysis due to the presence of [Co iii] and [Co ii] lines in this region, as well as because the strongest [Fe ii] features in this region do come from the same upper energy levels (unlike the case in the other regions studied). This wavelength region is the focus of Flörs et al. (in prep.).
| Name | Phase | Line | Velocity shift | FWHM | pEW | Name | Phase | Line | Velocity shift | FWHM | pEW | |
|---|---|---|---|---|---|---|---|---|---|---|---|---|
| (d) | (Å) | () | () | (Å) | (d) | (Å) | () | () | (Å) | |||
| PSNJ1149 | 206 | [Fe ii] 12567 | 1272478 | 7112475 | 2383780 | SN2012fr | 357 | [Fe ii] 12567 | 1091691 | 7403667 | 98593017 | |
| [Fe ii] 7155 | 1271267 | 8748332 | 61861 | [Fe ii] 7155 | 1865205 | 749880 | 66128 | |||||
| [Ni ii] 7378 | 2074437 | 5063926 | 15723 | [Ni ii] 7378 | 2063222 | 616346 | 21714 | |||||
| [Co iii] 5890 | 944201 | 934642 | 113531 | [Co iii] 5890 | 103267 | 11405265 | 360 32 | |||||
| SN2013ct | 229 | [Fe ii] 12567 | 834267 | 8020164 | 194198 | SN2013aa | 360 | [Fe ii] 12567 | 1408323 | 7211162 | 62341601 | |
| [Fe ii] 7155 | 765200 | 7343 55 | 4177 | [Fe ii] 7155 | 771206 | 7349105 | 64233 | |||||
| [Ni ii] 7378 | 845206 | 667425 | 2565 | [Ni ii] 7378 | 1535266 | 793325 | 36610 | |||||
| [Co iii] 5890 | 35216 | 8545175 | 78941 | [Co iii] 5890 | 222258 | 9671336 | 25023 | |||||
| SN2013cs | 303 | [Fe ii] 12567 | 2060770 | 7135213 | 2798654 | SN2013aa | 425 | [Fe ii] 12567 | 1189637 | 7781 900 | 97633504 | |
| [Fe ii] 7155 | 1656207 | 712250 | 4065 | [Fe ii] 7155 | 385244 | 8495210 | 73846 | |||||
| [Ni ii] 7378 | 1496207 | 676525 | 2362 | [Ni ii] 7378 | 1613395 | 7718594 | 32925 | |||||
| [Co iii] 5890 | 254216 | 11098328 | 1493271 | [Co iii] 5890 | – | – | – | |||||
| SN2012cg | 339 | [Fe ii] 12567 | 1203422 | 80011857 | 67701211 | SN2012ht | 433 | [Fe ii] 12567 | 1179469 | 74971270 | 38301444 | |
| [Fe ii] 7155 | 981201 | 747447 | 47411 | [Fe ii] 7155 | 494381 | 8130693 | 893161 | |||||
| [Ni ii] 7378 | 1381212 | 880130 | 3093 | [Ni ii] 7378 | 4242628 | 67832826 | 17434 | |||||
| [Co iii] 5890 | 65256 | 11906192 | 26416 | [Co iii] 5890 | – | – | – |
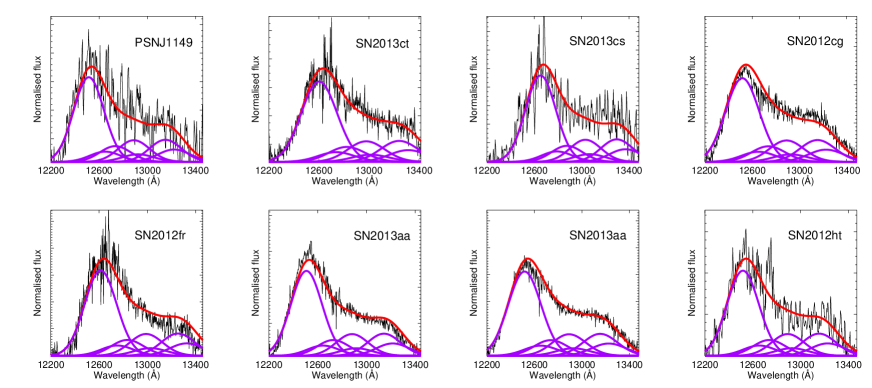
3.2 12600 Å [Fe ii]-dominated region fitting
The 12600 Å region is dominated by the [Fe ii] 12567 Å feature, along with six other weaker [Fe ii] lines (12704, 12788, 12943, 12978, 13206, 13278 Å) that have 30 per cent the strength of the 12567 Å line. No lines of other elements or other ionisation states of Fe are predicted to be present in this region, making it an excellent choice for constraining the properties of the [Fe ii] emitting region. The second strongest line at 13206 Å comes from the same energy level as the strongest line so their ratio is temperature independent. Assuming LTE, temperature-induced changes in the relative line strength of the five weakest lines are of the order of 5 per cent, resulting in variations in the strength of the strongest 12567 Å lines of 5 per cent, less than the uncertainty on the fit.
As we have constrained the relative strengths from the atomic data, and the velocity shifts and widths of the [Fe ii] features are tied, there are just four free parameters for the fit to the region (strength, width, velocity offset, and the height of the continuum). No priors are placed on these values. The best fits to this 12600 Å [Fe ii]-dominated region are shown in Fig. 2.
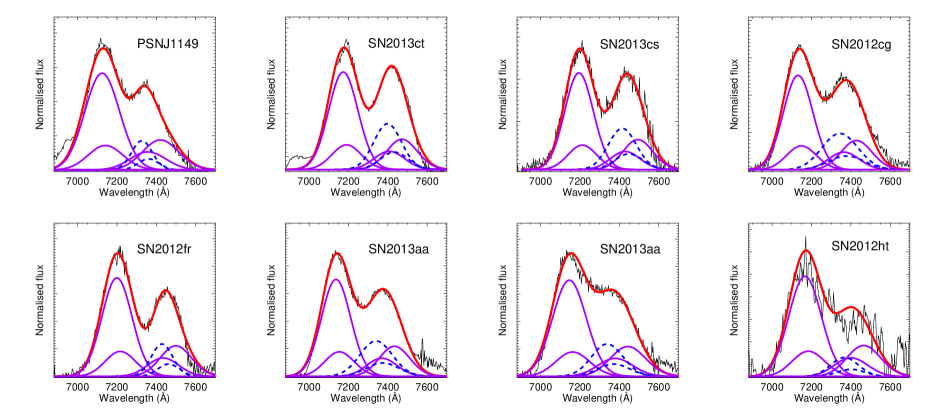
3.3 7300 Å [Fe ii]/[Ni ii]-dominated region
The 7300 Å line complex in late-time SN Ia spectra is made up of lines of [Fe ii] (7155, 7172, 7388, 7453 Å), [Ni ii] (7378, 7412 Å), and possibly [Ca ii] (7291, 7324 Å). Different explosion mechanisms predict different contributions of these elements, depending on the presence of stable Fe-group material and the completeness of burning in the explosion.
The relative strengths of the two strongest lines of the [Fe ii] lines are temperature independent. There is a small temperature dependence of the two weaker lines relative to the strongest line, [Fe ii] 7155 Å, but changes in temperature in the range 3000–8000 K results in a change in the relative strength of the strongest line of 5 per cent. These [Fe ii] lines are expected to be dominated by emission of the decay of radioactive 56Co. A smaller contribution from stable primordial Fe (54Fe, 56Fe) may be present but it is impossible to disentangle these contributions. The initial guess for the velocity and width of [Fe ii] lines in the 7300 Å complex were set as the output of the [Fe ii] 12600 Å region but were allowed to vary within 5000 of the NIR [Fe ii] velocity and width values (much greater than the velocity shifts or the range of widths observed).
Since 56Ni decays with a half-life of 6.1 days, the contribution from radioactive Ni at late-times is negligible. Therefore, any Ni emission lines seen in late-time spectra must come from stable 58Ni (and to a much smaller extent from stable 60Ni). For example, the mass ratio of 60Ni to 58Ni is 10 per cent for the Mch delayed-detonation (DDT) models of Seitenzahl et al. (2013b) so we refer to 58Ni to mean the total stable Ni contribution. Two [Ni ii] features (7378, 7412 Å) are expected to emit in this region if sufficient stable Ni is present. No priors were placed on the velocity offset of the [Ni ii] lines. Different explosion models predict different extents of the stable Fe-group element emitting regions. W7 predicts that the width of the stable Fe-group element emitting region should be 6000 (Iwamoto et al., 1999), while sub-Mch models prefer values of 7000 (Sim et al., 2010). To be agnostic as to the explosion mechanism, the width of the [Ni ii] was left to vary between 2000 and the width of the radioactive-chain dominated [Fe ii] 12567 Å line (10 per cent), which is typically of the order of 7000–9000 .
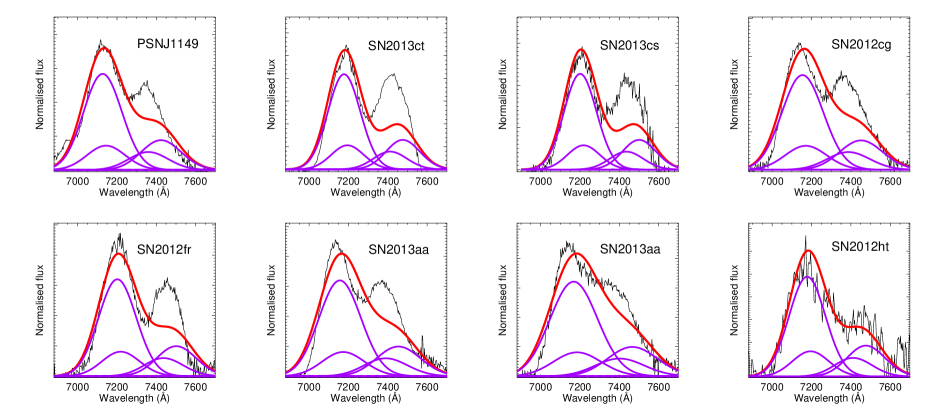
Fig. 3 shows the best fit to the 7300 Å [Fe ii]/[Ni ii] region under the assumptions and constraints detailed above. Since constraining the contribution of [Ni ii] to the region was one of our primary aims, we repeated the fitting removing the two [Ni ii] features from the fit and obtained the results shown in Fig. 4. It can be seen that the fits are significantly worse for all SNe apart from SN 2012ht (this is because it contained only a small contribution of [Ni ii] in the best fit when the presence of [Ni ii] was allowed and is also the lowest S/N of our spectral sample). Therefore, for 6 out of 7 SNe in our sample, a non-negligible contribution from [Ni ii] emission is required to produce a reasonable fit to the region.
[Ca ii] features (7291, 7324 Å) could also be present in this wavelength region. The Ca-emitting regions are expected to be further out in the ejecta than the Fe-group elements with a shell-like structure for most explosion scenarios for normal luminosity SNe Ia that are studied in this work. We approximated this as a shell with a width in the range, 5000 – 15000 covering the range predicted by Chandrasekhar and sub-Chandrasekhar mass explosions. We used a boxy profile with tapered edges with the flux for a given wavelength of the form, F , where is the velocity shift from the rest velocity (Jerkstrand et al., 2017). We tested the contribution of the [Ca ii] lines to the fit by performing the fits again with a contribution from [Ca ii]. To test if the fit is strengthened by including [Ca ii], we used the Bayesian Information Criterion (BIC; Schwarz, 1978) to select between models with and without a contribution from [Ca ii]. The BIC penalises models with a greater number of parameters. The model with the lower information criterion score is considered to be the better model for explaining a given dataset. We measured the BIC for models with and without a contribution from Ca ii and find BIC values of 10 in favour of the no Ca model, providing strong evidence against the need to include [Ca ii] in the fit to this region.
If we assume instead that [Ca ii] emission was responsible for the ‘[Ni ii]-feature’, the redder peak in this region, and that it was allowed to have a Gaussian instead of boxy profile (although this is not expected for the main explosion models), then the velocity offsets to fit the ‘[Ni ii]-feature’ would be shifted to the red by a further 3500 . For the most extreme redshifted case of SN 2012fr, this feature would have a velocity offset from the rest wavelength of [Ca ii] of 5500 . When the red peak is assumed to be dominated by [Ni ii], then the distribution of velocity offsets is centred on zero with three of the XShooter sample offsets lying to the blue and five to the red. If the origin of this feature was [Ca ii] emission then all the velocity shifts of the sample would be shifted strongly towards the red, again arguing against a centrally-peaked Ca distribution being the origin of this feature.
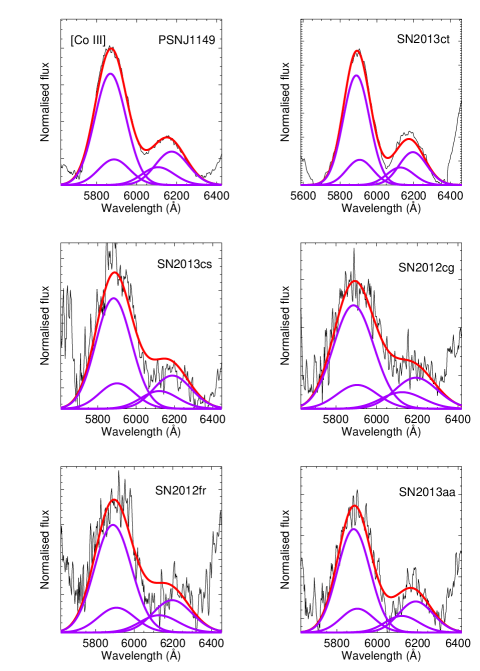
3.4 6000 Å [Co iii]-dominated region
The 5700 – 6300 Å region displays two peaks dominated by [Co iii] emission that radioactively decays with time from 60 d after explosion (Childress et al., 2015), and are undetectable after 400 d (Fig. 5). Since there are no non-negligible stable Co isotopes, the [Co iii] lines trace regions rich in radioactive material. Along with composition changes, the regions emitting [Co iii] compared to [Fe ii] and [Ni ii] lines are also likely to differ in their thermodynamic conditions since they result in the production of different ionisation states. The strengths of the [Co iii] lines (5890, 5908, 6129, 6197 Å) are constrained relative to the strongest feature. The second strongest line at 6197 Å has a fixed ratio to the strongest feature because it comes from the same upper energy level. The weakest two lines have a small temperature dependence in the 3000–8000 K regime, causing a 6 per cent uncertainty in the relative strength of the strongest line. No constraints were placed on the strength of the strongest line, its velocity offset, or width. In agreement with Dessart et al. (2014), we find that this spectral region is well fit without a contribution from Na i D.
4 Late-time velocity shifts and line widths
An asymmetric distribution of Fe in SNe Ia was first suggested by Spyromilio et al. (2004) by studying the shapes of NIR [Fe ii] lines in late-time spectra. Velocity shifts of the central wavelength of the [Fe ii] 16440 Å feature with respect to its rest wavelength were identified by Motohara et al. (2006) for three SNe Ia, 2003du, 2003hv and 2005W. In SN 2003hv, a shift was observed for [Co iii] at mid-infrared wavelengths (Gerardy et al., 2007) and [Fe ii] at optical wavelengths (Leloudas et al., 2009). Optical line shifts have also been identified for the [Fe ii] 7155 Å and [Ni ii] 7378 Å features with peak velocity shifts from rest of 3000 that correlate with Si ii velocities measured at maximum light (Maeda et al., 2010a, b; Blondin et al., 2012; Silverman et al., 2013). Here we discuss the velocity shifts, as well as measurements of the line widths, for our sample of late-time spectra, and also perform a comparison with literature objects.
4.1 Velocity shift evolution with phase
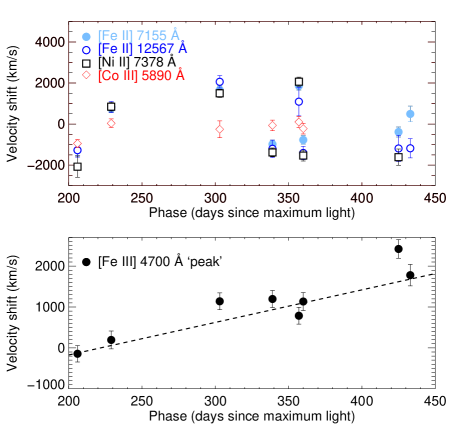
In the top panel of Fig. 6, the velocity shifts of the 7155, 12567 Å [Fe ii] lines, as well as those of [Ni ii] 7378 Å and [Co iii] 5890 Å, are shown as a function of phase for the 8 spectra of the 7 SNe Ia in our sample. No evolution with time is identified for our sample and the [Fe ii] and [Ni ii] features show large positive and negative offsets that do not appear phase dependent. Black et al. (2016) investigated the velocity offset with time for the [Co iii] 5890 Å region for a sample of SNe Ia with multiple spectra per object and found a flat trend (within the uncertainties) of their velocities in the range 200 – 350 d post maximum. In the bottom panel of the same plot, the peak of the [Fe iii] 4700 Å is shown as a function of phase. This peak value was not measured from a full fit to the region but from a simple Gaussian fit to the strongest 4700 Å peak. A clear trend of increasing redshift with time is identified for the [Fe iii] 4700 Å feature. This is in agreement with previous studies, where the wavelength of the peak of the feature was found to shift towards the red with time from 50 to 450 d past maximum light (Maeda et al., 2010b; Black et al., 2016; Graham et al., 2017). This could be due to contributions from other features in this region, such as permitted Fe and [Co ii] lines. A redshifting with time of line peaks has previously been observed in a number of core-collapse SNe (e.g. Taubenberger et al., 2009), and has been suggested to be caused by a decrease in opacity with time, that mainly effects bluer wavelengths (Jerkstrand et al., 2015a).
4.2 Velocity offsets and widths of Fe-group elements
We wished to investigate in our sample the relative velocity shifts of different Fe-group elements (and ionisation states) to determine if their emitting regions are the same. Previous studies have suggested that [Ni ii], [Fe ii], and [Fe iii] features are produced in different regions of the ejecta that depend on the density (Maeda et al., 2010b). As shown in Section 4.1, the [Fe iii] 4700 Å feature is not suitable for this study because its central position evolves with time.
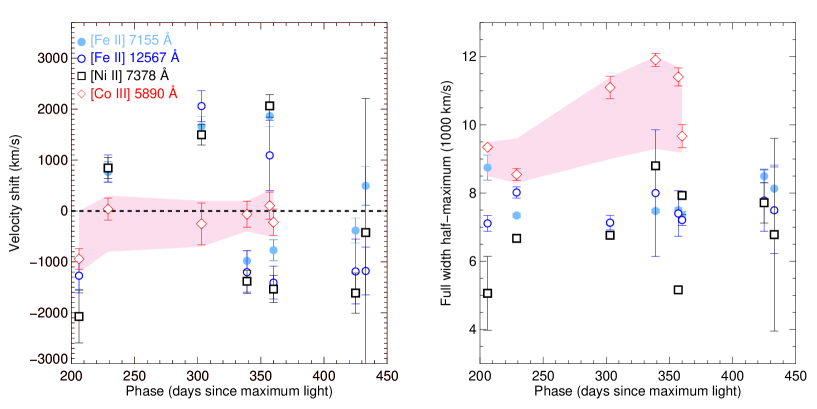
In Fig. 7, we show the results of our comparative study of the velocity and widths of singly and doubly ionised elements. We have compared the velocities of the [Co iii] 5890 Å line to those of the [Ni ii] 7378 Å, [Fe ii] 7155, 12567 Å features. We find that the mean absolute offset from zero velocity () for [Co iii] is much smaller than that for the lower ionisation lines of [Fe ii] and [Ni ii]. The [Fe ii] 7155 and 12567 Å features have mean absolute velocity offsets from zero of 1024533 and 1279355 , respectively. The [Ni ii] 7378 Å feature has a mean absolute velocity offset of 1429563 that is slightly higher that the [Fe ii] features but consistent within the uncertainties. However, the [Co iii] 5890 Å feature has a significantly lower mean absolute velocity offset of 271341 , which is consistent with zero offset from its rest wavelength.
The 15000 – 18000 Å region is also dominated by [Fe ii] features. As discussed in Section 3, we have excluded this region from our detailed analysis because of potential contributions from [Co ii] and [Co iii]that makes the fitting of the [Fe ii] features less clean. However, if we assume that the main peak in this region is dominated by emission from the [Fe ii] 16440 Å line, then it can be seen from Fig. 11 that its peak also shifted in a similar way to the peak of the 12600 Å region. The peaks of the 12600 and 16400 Å regions are shifted consistently to the red for SNe 2013ct, 2013cs and 2012fr. This confirms our previous results that the distribution of [Fe ii] emission lines is shifted in SNe Ia both positively and negatively with respect to the rest wavelengths of the lines.
We have also investigated the extent of the emitting regions of these Fe-group features using their FWHM (Fig. 7, right panel). We found that the [Co iii] lines (mean FWHM of 103001300 ) are significantly broader than the [Fe ii] 7155 Å, [Fe ii] 12567 Å, and [Ni ii] 7378 Å lines, with mean FWHM of 7800600, 7500400, and 69001300 , respectively.
4.3 Late-time velocity shifts of [Fe ii] and the connection to maximum-light Si ii velocities
A connection between the average peak line shift of the two main components of the 7300 Å region (suggested to be due to [Fe ii] 7155 Å and [Ni ii] 7378 Å for the blue and red peaks, respectively) in the late-time spectra (150 – 400 d past max.) and the Si ii velocity gradient at maximum light was first identified by Maeda et al. (2010a). SNe Ia displaying redshifted late-time 7300 Å region spectral features have higher velocity gradients at early times, suggested to originate from asymmetric and off-centre explosion mechanisms. Silverman et al. (2013) extended this work to show that the relation also holds if Si ii velocities at maximum are used instead of the harder to measure velocity gradient.
We wished to measure velocity offsets for our new late-time spectral sample (200 d after max.) and compare with Si ii velocities at maximum (presented in Table 2). We included the three additional XShooter spectra (described in Section 2), with lower S/N spectra in the NIR region, to increase the sample. Unlike Maeda et al. (2010a), we chose to focus on the blueward peak that is predominantly [Fe ii] because the redward peak of this feature is not due to solely [Fe ii] or [Ni ii] but is a blend of both (Fig. 3). Therefore, it is not as clean a measurement of Fe-group velocity offsets as the [Fe ii] 7155 Å peak.
We measured the [Fe ii] 7155 Å velocity shift using two methods: the ‘peak’ method of Maeda et al. (2010a) and the more detailed multi-line fitting method we presented in Section 3. We also remeasured values of the late-time velocity offset of the [Fe ii] 7155 Å feature for the literature sample described in Section 2.4, which includes SNe Ia falling in the same phase range of our late-time sample of 200–430 d post max. This is a stricter lower phase cut than that used by Maeda et al. (2010a).
A comparison between the two methods (‘peak’ and full fit) shows that there is a systematic offset such that the values measured from the peak of the blueward feature ([Fe ii] 7155 Å) are 150–300 offset to the red compared to the full fitting method. This is evidence for line blending skewing the measured peak value of the emission profile. However, this is a small offset and generally within the uncertainties of the line fitting so we conclude that the choice of method does not significantly impact the final results. We used the full fitting method in our further analysis.
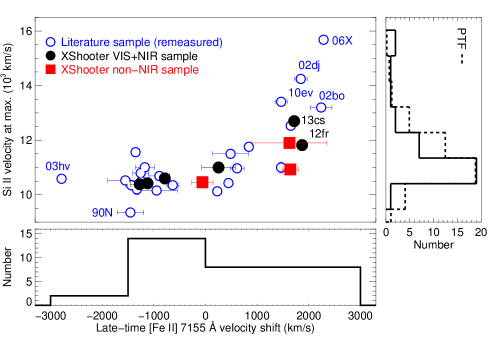
Fig. 8 shows the results of our analysis of the relation between Si ii velocity at maximum and late-time velocity offset of the [Fe ii] 7155 Å lines for our SN sample and remeasured literature sample. We find results in agreement with that of previous studies but strengthened (with no clear outliers) by the inclusion of additional objects, the stricter phase cut, and the consistent measurements of solely the [Fe ii] 7155 Å feature using our more detailed fitting technique. We also tested for relations between the maximum-light light curve width parameter, ‘stretch’, the B-V colour at maximum, and the late-time velocities but find no significant correlations.
A similar relation is seen between Si ii velocity at maximum and the late-time velocity offset of the NIR [Fe ii] 12567 Å line – not surprisingly given the clear correlation between the optical and NIR [Fe ii] lines observed in Fig. 7. However, the sample size is small since the literature spectral sample generally did not cover combined optical and NIR wavelengths. We have also investigated the relation between the Si ii velocity at maximum and the late-time velocity shift of the [Co iii] 5890 Å lines for the combined XShooter and literature sample. We identify a tentative trend in the sense that SNe Ia with positive (redward shifted) [Co iii] late-time velocities are more likely to have higher Si ii velocities at maximum (in the same sense as the [Fe ii] lines). However, when we measure the mean Si ii velocity for samples with redward or blueward [Co iii] shifts, the means agree within the uncertainties. The [Co iii] lines also have significantly smaller offsets from zero velocity (Fig. 7).
To determine if the combined XShooter and literature sample is unbiased with respect to selection effects, we have compared it to the untargeted Palomar Transient Factory (PTF) sample of 247 SNe Ia within 5 d of maximum light (Maguire et al., 2014). We have found that the percentage of SNe Ia with Si ii velocities above 12000 is consistent between the samples at 18 and 16 per cent for the late-time spectral sample and the maximum-light PTF sample, respectively. This suggests that there is no significant bias in the sample selection for the late-time sample.
5 Late-time colours of SNe Ia
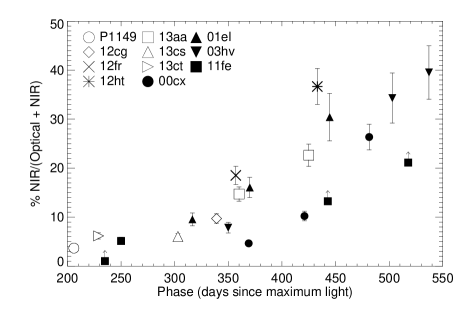
The percentage flux in the NIR bands was compared to the total flux in the optical and NIR by measuring the flux through a broad optical filter (3550–9500 Å), as used in Dimitriadis et al. (2017), and the sum of the flux through the JHK bands. The percentage flux in the NIR compared to the combined optical+NIR is shown as a function of phase in the range of 200 – 550 d post maximum in Fig. 9. This figure includes measurements from the new spectral sample presented here, as well as the late-time optical and NIR measurements of SNe 2000cx, 2001el, 2003hv, 2011fe (Sollerman et al., 2004; Stritzinger & Sollerman, 2007; Leloudas et al., 2009) that were presented in Dimitriadis et al. (2017).
An increase in the NIR flux contribution with time is seen over the phase range studied. The NIR contribution to the combined optical and NIR flux is relatively constant in the range of 200 – 350 d with a mean of 72 per cent. In the range 350 – 450 d, there is a larger spread with a mean of 1310 per cent, while in the range 450 – 550 d, the NIR flux contribution has increased significantly with a mean of 337 per cent.
6 Calculation of Ni to Fe abundance ratio
We have produced fits to the 7300 Å spectral region, which output relative line strengths, velocity shifts and line widths of [Fe ii] and [Ni ii]. The pseudo-equivalent widths of the line profiles can be used to estimate the Ni/Fe abundance for SNe Ia in the sample, under some basic assumptions. Assuming optically thin emission, we used equation 2 of Jerkstrand et al. (2015b), with an additional term to account for the departure coefficients, to give the equation
| (1) |
where is the measured flux ratio of the [Ni ii] 7378 Å to [Fe ii] 7155 Å line, and are the number densities of Ni ii and Fe ii, is the Boltzmann constant in units of eV per K, T is the temperature in K, and is the ratio of departure coefficients from LTE for the appropriate states of Ni ii and Fe ii, respectively. The numerical constants are the same as were used in Jerkstrand et al. (2015b).
The ratio of departure coefficients for the Fe and Ni-emitting zones is estimated from the W7 model at 330 d using the modelling of Fransson & Jerkstrand (2015) to be in the range of 1.2 – 2.4 over the phase range of interest with smaller coefficients at earlier times when the conditions are slightly closer to LTE (priv. comm.). We use a mean value of the departure coefficient of 1.8. Since Ni ii and Fe ii are both singly ionised and have similar ionisation potentials, we assumed that the / ratio should closely follow the total Ni/Fe ratio. This is supported by the nebular phase modelling of Fransson & Jerkstrand (2015) at 330 d past maximum light, which gives values in the range of 0.8 – 1.2, with a mean of 1.0 (priv. comm.). Similar ionisation rates are also found in the NLTE modelling of Shingles et al. (in prep.).
The uncertainties on the Ni/Fe ratio were calculated by varying the temperature in the range 3000-8000 K and the departure coefficient in the range 1.2 – 2.4 (the range of departure coefficients in different zones from the model of Fransson & Jerkstrand, 2015), and the ionisation balance in the range of 0.8 – 1.2, also from the Fransson & Jerkstrand (2015) model. The uncertainties on the line fitting are negligible in comparison to these uncertainties.
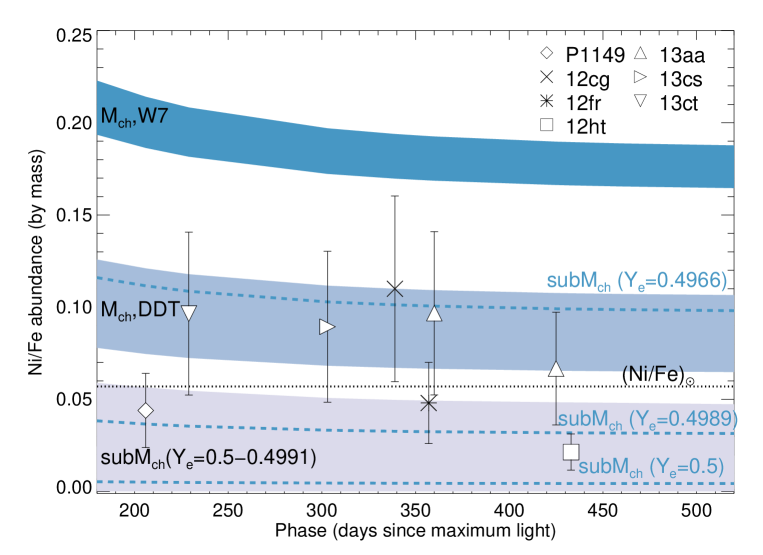
Fig. 10 shows the measured ratio of Ni to Fe abundance compared to four SN Ia explosion models (a Mch deflagration model, a Mch DDT model, and two different versions of sub-Mch detonation models). The Mch deflagration explosion model, ‘W7’, is shown with a range of values from Nomoto et al. (1997) and Iwamoto et al. (1999), along with the three-dimensional Mch DDT models, ‘N100’, ‘N100l’, ‘N100h’, ‘N150’, of Seitenzahl et al. (2013b). In the DDT models, the neutron-rich isotopes, such as 58Ni, are synthesised mainly in the explosion itself in the highest density regions, and these models set the range of the models labelled as ‘DDT’ in Fig. 10.
Neutronisation can also occur due to a increased progenitor star metallicity that results in a higher 22Ne content, which in turn introduces an excess of neutrons and different electron fractions, Ye. This results in the production of neutron-rich isotopes but in smaller amounts than those produced during the explosion itself. For the Mch DDT models of Seitenzahl et al. (2013b), variations in initial progenitor star metallicity are dwarfed by the variations produced by varying the central density at explosion.
Two sets of sub-Mch detonation models are shown from Sim et al. (2010) and Shen et al. (2018). In these models, the neutron-rich 58Ni depends on the progenitor star metallicity and is not produced in the explosion. The models of Sim et al. (2010) are of a 1.06 M⊙CO white dwarf calculated for the case of zero metallicity (Ye = 0.5), and two neutron-rich environments of Ye = 0.4989 and 0.4966, roughly equivalent to twice and six times solar metallicity, respectively. The models of Shen et al. (2018) are of 0.9 and 1.0 M⊙ CO white dwarfs, calculated in the range, Ye=0.5 – 0.4991, roughly equivalent to zero to twice solar metallicity.
All the model ratios of Ni over Fe abundance decline with phase because while the stable Ni mass stays constant, the amount of Fe is increasing with time due to decay from Co. ‘W7’ over-predicts the Ni/Fe abundance for all the SNe Ia in the sample. The data are found to be broadly consistent with the ‘DDT’ model range, as well as some of the sub-Mch models. However, to explain the data, the sub-Mch detonation models would need neutron excesses equivalent to a few times solar metallicity.
7 Discussion
We have presented an analysis of the largest sample to date of late-time optical and NIR SN Ia spectra, where we used a line-fitting code to estimate the widths, velocity offsets, and strengths of prominent spectral features. In this section, we review the evidence for asymmetries in the ejecta and the constraints on the presence of stable material. We also discuss the rate of cooling of the ejecta, as well as the absence of flat-topped profiles. These results are linked to a number of explosion models to constrain which models are the most viable to explain the bulk of normal SNe Ia.
7.1 Stratification of stable and radioactive material
In the W7 model (often used as a reference model), the stable material is more centrally concentrated than the radioactive decay products. The velocities of the stable material are predicted to be 4000 (Nomoto et al., 1997; Iwamoto et al., 1999). The stable Ni and Fe material in SN 2011fe was found using a modified density W7 model to have velocities below 4000 (Mazzali et al., 2015). The DDT models predict distributions of stable 58Ni that when spherically averaged are approximately co-spatial with the radioactive material (see fig. 1 of Seitenzahl et al., 2014). The sub-Mch detonation models of Sim et al. (2010) and Shen et al. (2018) predict distributions of stable Fe-group material that cover a similar velocity range to that of the radioactive isotopes.
For our SN Ia spectral sample, we have measured the width of Fe-group element features to constrain the extent of their emitting region. The width of the [Co iii] line is found to be significantly broader than those of the [Fe ii] and [Ni ii] features. The mean FWHM of the [Fe ii] 7155 Å and [Ni ii] 7378 Å lines are 7600700 and 66001500 , respectively, agreeing within the uncertainties. The mean FWHM of the [Co iii] 5890 line is 103001300 . This means the region producing the [Fe ii] and [Ni ii] features is smaller than the region producing the [Co iii] lines.
The [Ni ii] emission is dominated by stable 58Ni since the radioactive 56Ni is decayed by these epochs but the [Co iii] lines are produced from 56Co, the product of radioactive decay. To first order, since the [Ni ii] emitting region is narrower that of the [Co iii] region, we can assume that the underlying composition between the two emitting regions is different. Since the difference in mean FWHM for the [Ni ii] 7378 Å and [Co iii] 5890 Å lines is of the order of a thousand to a few thousand (taking into account the uncertainties), this suggests that the stable material is (at least slightly) more concentrated and coming from a narrower region than the radioactive material. We have not used [Fe iii] in our study because of the time-dependent evolution of the most prominent [Fe iii] feature (see Section 4.1).
This suspected stratification of the stable and radioactive material is in quantitative agreement with most of the models (W7, DDT, sub-Mch detonation). However, W7 predicts that the velocities of the stable material are 4000 , which we do not see in our sample. The lowest FWHM of [Ni ii] 7378 Å for a SN Ia in our sample is SN 2012fr, with a FWHM of the [Ni ii] 7378 Å line of 4650 . The gravitationally-confined detonation models of Seitenzahl et al. (2016) are ruled out for the SNe Ia in our sample; these models have no stable Fe or Ni at low velocities but significant high-velocity stable material, which is at odds with our results.
However, there are a number of caveats with connecting the underlying distribution of stable and radioactive material to line emissions of [Ni ii] and [Co iii]. Since their ionisation states are different (singly-ionised [Ni ii] compared to doubly-ionised [Co iii]), the density of their emitting regions is expected to be different (Maeda et al., 2010b). An isolated blob of stable material will not emit without an energy source – there must be some radioactive material mixed in with the stable material to produce line emission. Therefore, although different line emitting regions are likely dominated by differences in the composition, the role of thermodynamic conditions can of course not be neglected to focus only on differences in composition. Full non-LTE radiative-transfer modelling of different explosion models is needed to confirm these results.
The [Fe ii] emitting region is more difficult to link to stable or radioactive material since most of the models predict that there is a non-negligible amount of stable 54Fe and 56Fe produced in the explosion. These contributions can not be easily disentangled. We have found that the [Fe ii] and [Ni ii] line have significant positive and negative velocity shifts with respect to the rest wavelengths. Interestingly, the shifts of the two features correlate, i.e. when the [Fe ii] emission lines are shifted to the blue, the [Ni ii] lines usually do as well. The [Fe ii] and [Ni ii] velocity shifts are also significantly higher (up to 2000 ) than those of the [Co iii] lines, which are consistent with zero shift.
A toy model was set up by Maeda et al. (2010b) with i) an offset (from zero velocity) high-density region dominated by electron-capture elements (90 per cent by mass as stable 58Ni, 10 per cent of 56Fe), ii) an offset relatively high-density region with 56Fe, and iii) an extended, non-offset low-density region with 56Fe. They assumed in this model that the NIR lines of [Fe ii] (12567 Å, 16440 Å) and the [Fe ii] 7155 Å line should come from the offset high-density 56Fe-dominated region. Our result that the [Co iii] lines come from a non-offset (zero velocity shift), extended (broader width) 56Fe-dominated region agrees with the toy model of Maeda et al. (2010b). The shifts to the red and blue for the [Fe ii] and [Ni ii] lines can be interpreted as viewing angle effects of an asymmetric explosion (see further discussion below in Section 7.2).
7.2 Asymmetry predictions from explosions models
Bulla et al. (2016) investigated the line velocities and polarisation signals of the DDT model (‘N100’) of Seitenzahl et al. (2013b) and the sub-Mch double-detonation model of Fink et al. (2010). They found that both models have continuum polarisation levels that match well with the observations but differ significantly in the level of asymmetries, with the sub-Mch double-detonation model having significantly higher levels of global asymmetry. These asymmetries are introduced by the explosion mechanism, where the detonation is ignited at a single point on the surface and the detonation wave then travels on this surface to converge at the opposite side. This results in intermediate-mass elements that have a wider range of velocities and are more abundant on one side of the ejecta than on the other (Fink et al., 2010). The N100 DDT model of Seitenzahl et al. (2013b) does not predict significant variations in the offset of stable material (the stable 58Ni offset averaged over the ejecta is of the order of just tens of ) or variation in the Si ii velocity with viewing angle. For one of the most asymmetric models (N0003) of Seitenzahl et al. (2013b), the average velocity offset is larger but still not very large: 200 .
We have confirmed and strengthened the trend first identified by Maeda et al. (2010b) that the SNe Ia with more redshifted velocities of the late-time [Fe ii] lines are found to have higher maximum-light Si ii velocities (see Fig. 8). This suggests that the Si ii velocity is greatest when the bulk of the Fe-group elements are moving away from the observer. This is in good qualitative agreement with the sub-Mch double-detonation model predictions, where an observer would see a high Si ii velocity when viewing the explosion from the opposite side of the ejecta to where the core detonation has occurred. The Fe material would in this case to be moving away from the observer (see fig. 2 of Bulla et al., 2016).
Dong et al. (2015) investigated the shape of the [Co iii] 5890 Å feature in a sample of 18 SNe Ia from the literature and found that some SNe Ia with (stretch 0.85) have double-peaked profiles. They suggested this could be due to different viewing angles of a bimodal explosion of the direct collisions of white dwarfs. They suggested that [Fe ii] lines should also show double-peaked features. We have not identified double-peaked features of [Co iii] or [Fe ii] in the SNe Ia in our sample. Recent triple system population synthesis suggests that direct collisions are unlikely to explain more than 0.1 per cent of normal SNe Ia (Toonen et al., 2017).
7.3 Constraints on Ni to Fe abundance
Different explosion models predict different production rates of stable material due to different central densities at the time of explosion, with only Mch mass white dwarfs able to produce neutron-rich isotopes, such as 58Ni, during the explosion itself. However, sub-Mch models can have non-zero amounts of neutron-rich isotopes but this is dependent on the white dwarf metallicity that results in higher neutronisation for higher metallicity progenitors. The ratio of Ni to Fe is much lower for sub-Mch models than for Mch models, except for when very high metallicity (many times solar) sub-Mch progenitors are invoked (Sim et al., 2010; Ruiter et al., 2013; Shen et al., 2018).
Stable Fe is difficult to measure at late times because radioactively produced 56Fe from the decay of 56Ni via 56Co is also present. However, at late times, all the radioactively-produced 56Ni has decayed and so any features of Ni seen in SN Ia spectra should be dominated by stable 58Ni. The most prominent lines to study are the doublet of [Ni ii] 7378, 7412 Å. We find that a contribution from [Ni ii] is required to fit this region.
We estimate the Ni/Fe abundance ratio to be in the range 0.02 – 0.10 for the 7 SNe Ia studied here, within uncertainties on the values of 40 per cent, excluding systematic uncertainties, such as those due to choosing a certain set of atomic data. In Fig. 10, we show that Ni/Fe abundance for our sample is broadly consistent with the Mch DDT models of Seitenzahl et al. (2013b). However, as discussed in Sec. 7.2, the measured velocity offsets seen for the [Fe ii] and [Ni ii] lines appear inconsistent with this model. While there is overlap between the data and the sub-Mch explosion models of Sim et al. (2010) and Shen et al. (2018), they generally underproduce the Ni/Fe abundance compared to the observations and the sub-Mch models that match best are those with progenitor star metallicities significantly above solar. This increase in metallicity boosts the neutron excess available to produce stable Fe-group elements. The ‘W7’ model significantly over-predicts the Ni/Fe abundance for our sample, because of its large stable Ni core. Previous studies of SNe Ia have also found that the high nickel content of W7 leads to too strong emission lines of [Ni ii] at late times (Ruiz-Lapuente & Lucy, 1992; Liu et al., 1997; Leloudas et al., 2009; Fransson & Jerkstrand, 2015).
To make a crude estimate of the number of SNe Ia occurring in super-solar metallicity environments, we used the results of a number of spectroscopic metallicity studies of the global host galaxy properties of SNe Ia. We find that the percentage of SNe Ia in high-metallicity galaxies is approximately half (46 – 64 per cent; Childress et al., 2013b; Pan et al., 2014; Campbell et al., 2016). However, to explain the majority of Ni over Fe abundances in our sample, a metallicity of 2 times solar would be required, which is reasonably rare for SNe Ia host galaxy locations – estimates of the number of SNe Ia exploding in galaxies at greater than twice solar metallicity are of the order of 1–25 per cent (Childress et al., 2013b; Pan et al., 2014; Campbell et al., 2016).
Studies of the local host galaxy properties of SNe Ia find similar numbers of events at greater than solar metallicity (50 per cent), and at greater than twice solar metallicity (5 per cent) (Galbany et al., 2016, Galbany et al. in prep.). We also found that our SN sample all occur in emission-line, morphologically spiral galaxies, suggesting that they are not biased towards very high-metallicity environments. Therefore, with the current sub-Mch detonation models it appears difficult to explain the bulk of the SN Ia Ni over Fe abundances observed in our late-time spectral sample.
Previous modelling efforts have suggested that [Ca ii] emission could play a role in this region (Liu et al., 1997; Fransson & Jerkstrand, 2015; Mazzali et al., 2015; Botyánszki & Kasen, 2017). The explosion models generally predict that intermediate-mass elements, such as Ca, have a shell-like ejecta structure. The presence of any broad [Ca ii] emission would have a pedestal effect, increasing the level of the underlying continuum. We have found that a contribution is not needed in our analysis to fit the 7300 Å region (Fig. 3) and is rejected as a component in our fits using a model-selection technique. If we assumed that the redward peak in the 7300 Å region had a contribution from Gaussian-shaped [Ca ii] lines instead of [Ni ii] lines then it would produce much larger velocity offsets, with the maximum redshifted SN 2012fr being shifted by 5500 – a very large shift for any explosion model. Therefore, our conclusion is that [Ca ii] emission does not significantly contribute to the 7300 Å region of late-time SN Ia spectra.
The measured Ni/Fe abundance ratios for our sample of SNe Ia at late times are broadly consistent (mean of 0.060.03) with the solar Ni/Fe value of 0.057 (Asplund et al., 2009). A previous study of Ni/Fe abundances in a sample of six core-collapse SNe found significantly super-solar ratios in two of these objects, and around solar for the other four (Jerkstrand et al., 2015b). It was speculated that SNe Ia may have, on average, lower than solar Ni/Fe ratios that would bring the combined yield of SNe Ia and core-collapse SNe to the solar value (Jerkstrand et al., 2015c). However, we have shown that the Ni/Fe ratio for SNe Ia is broadly consistent with the solar value. Future studies of the Ni/Fe abundances in both core-collapse SNe and SNe Ia are needed so that we can put stronger constraints on their explosions, and their relative contributions to Galactic chemical evolution.
7.4 Absence of flat-topped NIR [Fe ii] features
‘Flat-topped’ profiles have been suggested to arise in SNe Ia originating from Mch explosions, where the high central density at the time of explosion results in significant electron capture resulting in a core that is dominated by stable Fe-group elements (Höflich et al., 2004). At 150–200 d, local deposition by positrons should dominate over gamma-ray deposition (e.g. Penney & Höflich, 2014). Therefore, if there is no mixing of the ejecta, this highest density region could produce nebular-phase emission lines of radioactivity-dominated species that have flat-topped profiles (due to the lack of radioactive elements in this region). Previous studies have identified flat-topped profiles at NIR wavelengths for SNe 2003du and 2003hv (Höflich et al., 2004; Motohara et al., 2006). They were not seen at optical wavelengths, which was suggested to be due to more line blending at optical wavelengths. Flat-topped profiles were not seen in the NIR for SN 2005df (Diamond et al., 2015) or SN 2011fe (Mazzali et al., 2015).
For our XShooter sample, we have found that the 12600 Å region is well fit by multiple Gaussians of [Fe ii] lines (see Fig. 2). The main peak of this feature comes nearly exclusively from the [Fe ii] 12567 Å line and we identified no evidence for a flat-topped profile of this or the other weaker [Fe ii] features in this region. In Fig. 11, we show the NIR region from 11000–18000 Å for our sample of 8 late-time SN Ia spectra, as well as the 394 d spectrum of SN 2003hv (Motohara et al., 2006; Leloudas et al., 2009) and 217 d spectrum of SN 2005df (Diamond et al., 2015). As previously discussed, we did not include the 15000–18000 Å region in our detailed fitting analysis due to the more complicated temperature dependence of [Fe ii] lines in this region and potential contributions from other elements. However, from a qualitative analysis of Fig. 11, we do not identify flat-topped profiles for the SNe in our sample in any of the main [Fe ii] emission features in the NIR. Although it cannot be ruled out that the previously identified flat-topped profiles are real, it is possible that they were due to low S/N in these regions.
We also do not require flat-topped profiles for the [Fe ii] at optical wavelengths, which are predicted by models that only have stable material in their highest density regions (Höflich et al., 2004). A central region solely comprised of stable material is not required for our spectra. The widths of the [Ni ii] lines of 5000 – 9000 also overlap with those of the [Fe ii] features of 7000 –9000 , again suggesting that the stable material that we have identified in our spectra is not confined to a high-density region without any radioactive material present.
7.5 Cooling at late-times
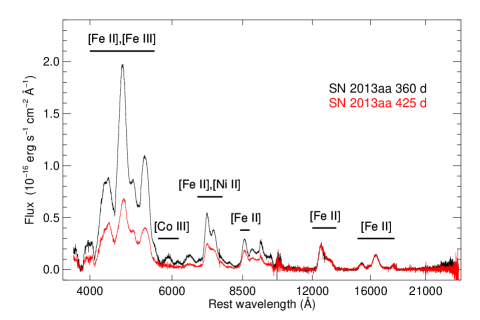
As has been seen in other studies of late-time data of SNe Ia, there is a marked increase in flux emerging at NIR compared to optical wavelengths at 350 d past explosion (Fig. 9). This is seen for SN 2013aa in Fig. 12, which has spectra at 360 and 425 d post maximum. The flux in the NIR [Fe ii] lines remains constant between the two epochs but the flux at bluer wavelengths has significantly decreased. This levelling off in the flux of the NIR bands of SNe Ia at late times was previously seen in SN 1998bu (Spyromilio et al., 2004) and SN 2000cx (Sollerman et al., 2004) in the phase range of 250 – 480 d. Since most of the emission at these phases is still from thermal collisions, this relative increase in the the flux in the NIR bands is expected to be due to the continued cooling of the ejecta, resulting in the transition to emission at longer wavelengths. This temporarily cancels out the decreasing radioactive heating at NIR wavelengths resulting in little evolution in the NIR bands at these epochs.
We have also identified a hint of the transition from [Fe iii]/[Fe ii] to [Fe ii]/[Fe i]-dominated spectra that was previously observed in SN 2011fe between 365 and 593 days post explosion (Graham et al., 2015). The main peak in the blue at 4700 Å is dominated by [Fe iii] emission while the peak to the red of this at 5300 Å is mixture of [Fe iii] and [Fe ii]. If we normalise to this peak at 5300 Å we find that the peak at 4700 Å has decreased with respect to it, meaning that [Fe iii]/[Fe ii] ratio has decreased between theses epochs. We have not identified any [Fe i] emission features in our spectra but speculate based on the results of Graham et al. (2015) that we may be seeing the beginning of a transition from an [Fe iii]/[Fe ii] to [Fe ii]/[Fe i]-dominated spectrum in the range of 360 and 425 d post maximum for SN 2013aa.
8 Conclusions
In this paper, we have presented a detailed analysis of the late-time (200 d post explosion) optical and NIR spectra of 7 SNe Ia. The late-time XShooter spectra were supplemented by maximum-light photometric and spectroscopic observations. Using a multi-Gaussian fitting code, we have performed fits to three prominent spectral regions: the 12600 Å [Fe ii]-dominated region, the 7300 Å [Fe ii]/[Ni ii]-dominated region, and the 6000 Å [Co iii] region. This has allowed us to constrain the stable Ni over Fe abundance ratio, the velocity shifts and widths of the measured features, and their connection to maximum-light observations. We have investigated the NIR compared to optical flux contribution, along with a study of the presence of flat-topped NIR profiles and the double-peaked [Co iii] features.
Our main results are:
- 1.
-
2.
The abundance ratio of Ni to Fe is found to be in the range of 0.02 – 0.10 for the 7 SNe Ia in our sample, with uncertainties of 40 per cent, making them broadly consistent with DDT and some super-solar sub-Mch models. The mean value of our sample is consistent with solar Ni/Fe abundance measurements.
-
3.
Using a simple fit to the 4700 Å [Fe iii] main peak, we confirm the results of previous studies that the peak of this feature shifts to the red with time.
-
4.
We have constrained the velocity offsets (from rest wavelength) of the [Fe ii], [Ni ii], and [Co iii] features. The [Fe ii] 7155 Å, 12567 Å and the [Ni ii] 7378 Å features are found to have significant offsets (500–2000 ) both positive and negative from their rest wavelengths (Fig. 7). The [Co iii] 5890 Å feature does not show such significant offsets with a mean absolute velocity offset of 271341 , suggesting a different emitting region for the [Co iii] compared to the [Fe ii] and [Ni ii] features.
-
5.
The [Co iii] 5890 Å feature is found to have significantly broader FWHM of 10000 than the [Fe ii] and [Ni ii] features of 6600 – 7600 , suggesting a broader emitting region for [Co iii] compared to [Fe ii] and [Ni ii] features.
-
6.
By connecting the late-time [Fe ii] line shift velocities with the velocity of the Si ii absorption feature at maximum light, we confirm (and strengthen) the trend of Maeda et al. (2010a) where SNe Ia with blue-shifted [Fe ii] features have lower Si ii velocities.
-
7.
A trend of increasing NIR flux with time at epochs 350 d past explosion is identified (from 10 at 350 d up to 40 per cent at 550 d). The onset of the transformation from [Fe iii]/[Fe ii]- to [Fe ii]/[Fe i]-dominated spectra is potentially identified for SN 2013aa in the range of 360 – 425 d post maximum light.
-
8.
In contradiction with some previous studies, we do not see flat-topped profiles for the [Fe ii] features at NIR wavelengths, which may be due to the higher S/N spectra in our sample.
-
9.
No double-peaked [Co iii] or [Fe ii] features are identified that have been suggested to be present in fainter SNe Ia in direct collision models.
The largest sample to date of late-time combined optical and NIR spectra of SNe Ia has allowed us to test a number of theories related to density structures, asymmetries, and elemental abundances. We have identified signatures of potential asymmetries in their explosions through measurements of the velocities and widths of key Fe-group elements. Our results suggest that the explosions of normal SNe Ia, as studied here, may be intrinsically non-spherically symmetric with significant offsets from zero velocity for some elements and ionisation states. Future work will involve larger samples of SNe Ia at late times, combined with state-of-the-art spectral modelling (Shingles et al. in prep.), to allow the geometry and explosion products to be quantified to higher precision, and place tighter constraints on viable SN Ia explosion models.
9 Acknowledgements
KM is supported by STFC through an Ernest Rutherford Fellowship (ST/M005348/1). SS, LS, and KM acknowledge support from STFC through grant, ST/P000312/1. TWC is supported by an Alexander von Humboldt Fellowship. LG was supported in part by the US National Science Foundation under grant AST-1311862. CPG acknowledges support from EU/FP7-ERC grant No. [615929]. DAH and GH are supported by NSF AST-1313484. RR received support from The Aerospace Corporation s Technical Investment Program. Based on data taken at the European Organisation for Astronomical Research in the Southern Hemisphere, Chile, under program IDs: 091.D-0764(A), 092.D-0632(A), 096.D-0627(A), and as part of PESSTO (188.D-3003). This research has made use of the NASA/IPAC Extragalactic Database (NED) which is operated by the Jet Propulsion Laboratory, California Institute of Technology, under contract with the National Aeronautics and Space Administration. This work makes use of the LCO network.
The Pan-STARRS1 Surveys (PS1) and the PS1 public science archive have been made possible through contributions by the Institute for Astronomy, the University of Hawaii, the Pan-STARRS Project Office, the Max-Planck Society and its participating institutes, the Max Planck Institute for Astronomy, Heidelberg and the Max Planck Institute for Extraterrestrial Physics, Garching, The Johns Hopkins University, Durham University, the University of Edinburgh, the Queen’s University Belfast, the Harvard-Smithsonian Center for Astrophysics, the Las Cumbres Observatory Global Telescope Network Incorporated, the National Central University of Taiwan, the Space Telescope Science Institute, the National Aeronautics and Space Administration under Grant No. NNX08AR22G issued through the Planetary Science Division of the NASA Science Mission Directorate, the National Science Foundation Grant No. AST-1238877, the University of Maryland, Eotvos Lorand University (ELTE), the Los Alamos National Laboratory, and the Gordon and Betty Moore Foundation.
References
- Ashall et al. (2014) Ashall C., Mazzali P., Bersier D., Hachinger S., Phillips M., Percival S., James P., Maguire K., 2014, MNRAS, 445, 4427
- Asplund et al. (2009) Asplund M., Grevesse N., Sauval A. J., Scott P., 2009, ARA&A, 47, 481
- Axelrod (1980) Axelrod T. S., 1980, PhD thesis, California Univ., Santa Cruz.
- Betoule et al. (2014) Betoule M. et al., 2014, A&A, 568, A22
- Bildsten et al. (2007) Bildsten L., Shen K. J., Weinberg N. N., Nelemans G., 2007, ApJ, 662, L95
- Black et al. (2016) Black C. S., Fesen R. A., Parrent J. T., 2016, MNRAS, 462, 649
- Blondin et al. (2012) Blondin S. et al., 2012, AJ, 143, 126
- Botyánszki & Kasen (2017) Botyánszki J., Kasen D., 2017, ApJ, 845, 176
- Brown et al. (2013) Brown T. M. et al., 2013, PASP, 125, 1031
- Bulla et al. (2016) Bulla M. et al., 2016, MNRAS, 462, 1039
- Campbell et al. (2016) Campbell H., Fraser M., Gilmore G., 2016, MNRAS, 457, 3470
- Cartier et al. (2011) Cartier R., Förster F., Coppi P., Hamuy M., Maeda K., Pignata G., Folatelli G., 2011, A&A, 534, L15
- Chambers et al. (2016) Chambers K. C. et al., 2016, ArXiv e-prints
- Childress et al. (2013a) Childress M. et al., 2013a, ApJ, 770, 108
- Childress et al. (2013b) Childress M. et al., 2013b, ApJ, 770, 107
- Childress et al. (2015) Childress M. J. et al., 2015, MNRAS, 454, 3816
- Childress et al. (2016) Childress M. J. et al., 2016, Publications of the Astronomical Society of Australia, 33, e055
- Conley et al. (2008) Conley A. et al., 2008, ApJ, 681, 482
- Cortés et al. (2006) Cortés J. R., Kenney J. D. P., Hardy E., 2006, AJ, 131, 747
- Dan et al. (2011) Dan M., Rosswog S., Guillochon J., Ramirez-Ruiz E., 2011, ApJ, 737, 89
- Dessart et al. (2014) Dessart L., Hillier D. J., Blondin S., Khokhlov A., 2014, MNRAS, 439, 3114
- Diamond et al. (2015) Diamond T. R., Höflich P., Gerardy C. L., 2015, ApJ, 806, 107
- Dimitriadis et al. (2017) Dimitriadis G. et al., 2017, MNRAS, 468, 3798
- Dong et al. (2015) Dong S., Katz B., Kushnir D., Prieto J. L., 2015, MNRAS, 454, L61
- Fink et al. (2010) Fink M., Röpke F. K., Hillebrandt W., Seitenzahl I. R., Sim S. A., Kromer M., 2010, A&A, 514, 53
- Fransson & Jerkstrand (2015) Fransson C., Jerkstrand A., 2015, ApJ, 814, L2
- Freudling et al. (2013) Freudling W., Romaniello M., Bramich D. M., Ballester P., Forchi V., García-Dabló C. E., Moehler S., Neeser M. J., 2013, A&A, 559, A96
- Galbany et al. (2016) Galbany L. et al., 2016, A&A, 591, A48
- Gerardy et al. (2007) Gerardy C. L. et al., 2007, ApJ, 661, 995
- Graham et al. (2017) Graham M. L. et al., 2017, MNRAS, 472, 3437
- Graham et al. (2015) Graham M. L., Nugent P. E., Sullivan M., Filippenko A. V., Cenko S. B., Silverman J. M., Clubb K. I., Zheng W., 2015, MNRAS, 454, 1948
- Gutiérrez et al. (2016) Gutiérrez C. P. et al., 2016, A&A, 590, A5
- Hillier & Dessart (2012) Hillier D. J., Dessart L., 2012, MNRAS, 424, 252
- Hillier & Miller (1998) Hillier D. J., Miller D. L., 1998, ApJ, 496, 407
- Höflich et al. (2004) Höflich P., Gerardy C. L., Nomoto K., Motohara K., Fesen R. A., Maeda K., Ohkubo T., Tominaga N., 2004, ApJ, 617, 1258
- Iben & Tutukov (1984) Iben I., Tutukov A. V., 1984, ApJS, 54, 335
- Iwamoto et al. (1999) Iwamoto K., Brachwitz F., Nomoto K., Kishimoto N., Umeda H., Hix W. R., Thielemann F.-K., 1999, ApJS, 125, 439
- Jerkstrand et al. (2017) Jerkstrand A., Alsabti A. W., Murdin P., eds., 2017, Spectra of Supernovae in the Nebular Phase, Springer International Publishing, Cham, pp. 1–48
- Jerkstrand et al. (2015a) Jerkstrand A., Ergon M., Smartt S. J., Fransson C., Sollerman J., Taubenberger S., Bersten M., Spyromilio J., 2015a, A&A, 573, A12
- Jerkstrand et al. (2015b) Jerkstrand A. et al., 2015b, MNRAS, 448, 2482
- Jerkstrand et al. (2015c) Jerkstrand A. et al., 2015c, ApJ, 807, 110
- Kausch et al. (2015) Kausch W. et al., 2015, A&A, 576, A78
- Leloudas et al. (2009) Leloudas G. et al., 2009, A&A, 505, 265
- Leonard (2007) Leonard D. C., 2007, ApJ, 670, 1275
- Liu et al. (1997) Liu W., Jeffery D. J., Schultz D. R., 1997, ApJ, 483, L107
- Livne & Glasner (1990) Livne E., Glasner A. S., 1990, ApJ, 361, 244
- Maeda et al. (2010a) Maeda K. et al., 2010a, Nature, 466, 82
- Maeda et al. (2011) Maeda K. et al., 2011, MNRAS, 413, 3075
- Maeda et al. (2010b) Maeda K., Taubenberger S., Sollerman J., Mazzali P. A., Leloudas G., Nomoto K., Motohara K., 2010b, ApJ, 708, 1703
- Magnier et al. (2016) Magnier E. A. et al., 2016, ArXiv e-prints
- Maguire et al. (2014) Maguire K. et al., 2014, MNRAS, 444, 3258
- Maguire et al. (2013) Maguire K. et al., 2013, MNRAS, 436, 222
- Maguire et al. (2016) Maguire K., Taubenberger S., Sullivan M., Mazzali P. A., 2016, MNRAS, 457, 3254
- Marion et al. (2016) Marion G. H. et al., 2016, ApJ, 820, 92
- Martínez-Rodríguez et al. (2017) Martínez-Rodríguez H. et al., 2017, ApJ, 843, 35
- Mattila et al. (2005) Mattila S., Lundqvist P., Sollerman J., Kozma C., Baron E., Fransson C., Leibundgut B., Nomoto K., 2005, A&A, 443, 649
- Maurer et al. (2011) Maurer I., Jerkstrand A., Mazzali P. A., Taubenberger S., Hachinger S., Kromer M., Sim S., Hillebrandt W., 2011, MNRAS, 418, 1517
- Mazzali et al. (2007) Mazzali P. A., Röpke F. K., Benetti S., Hillebrandt W., 2007, Science, 315, 825
- Mazzali et al. (2015) Mazzali P. A. et al., 2015, MNRAS, 450, 2631
- Meyerott (1980) Meyerott R. E., 1980, ApJ, 239, 257
- Modigliani et al. (2010) Modigliani A. et al., 2010, in Society of Photo-Optical Instrumentation Engineers (SPIE) Conference Series, Vol. 7737, Society of Photo-Optical Instrumentation Engineers (SPIE) Conference Series
- Motohara et al. (2006) Motohara K. et al., 2006, ApJ, 652, L101
- Nomoto (1982) Nomoto K., 1982, ApJ, 253, 798
- Nomoto et al. (1997) Nomoto K., Iwamoto K., Nakasato N., Thielemann F.-K., Brachwitz F., Tsujimoto T., Kubo Y., Kishimoto N., 1997, Nuclear Physics A, 621, 467
- Olling et al. (2015) Olling R. P. et al., 2015, Nature, 521, 332
- Pakmor et al. (2012) Pakmor R., Kromer M., Taubenberger S., Sim S. A., Röpke F. K., Hillebrandt W., 2012, ApJ, 747, L10
- Pan et al. (2015) Pan Y.-C. et al., 2015, MNRAS, 452, 4307
- Pan et al. (2014) Pan Y.-C. et al., 2014, MNRAS, 438, 1391
- Penney & Höflich (2014) Penney R., Höflich P., 2014, ApJ, 795, 84
- Quinet & Le Dourneuf (1996) Quinet P., Le Dourneuf M., 1996, A&AS, 119, 99
- Quinet et al. (1996) Quinet P., Le Dourneuf M., Zeippen C. J., 1996, A&AS, 120, 361
- Rosswog et al. (2009) Rosswog S., Kasen D., Guillochon J., Ramirez-Ruiz E., 2009, ApJ, 705, L128
- Rudy et al. (2015) Rudy R. J., Ardila D. R., Crawford K. B., Moody M. S. L., Safrit T. K., Puetter R. C., 2015, ATEL, 7825
- Ruiter et al. (2013) Ruiter A. J. et al., 2013, MNRAS, 429, 1425
- Ruiz-Lapuente & Lucy (1992) Ruiz-Lapuente P., Lucy L. B., 1992, ApJ, 400, 127
- Scalzo et al. (2014) Scalzo R. et al., 2014, MNRAS
- Schlafly & Finkbeiner (2011) Schlafly E. F., Finkbeiner D. P., 2011, ApJ, 737, 103
- Schwarz (1978) Schwarz G., 1978, The Annals of Statistics, 6, 461
- Seitenzahl et al. (2013a) Seitenzahl I. R., Cescutti G., Röpke F. K., Ruiter A. J., Pakmor R., 2013a, A&A, 559, L5
- Seitenzahl et al. (2013b) Seitenzahl I. R. et al., 2013b, MNRAS, 429, 1156
- Seitenzahl et al. (2014) Seitenzahl I. R. et al., 2014, MNRAS, 444, 350
- Seitenzahl et al. (2016) Seitenzahl I. R. et al., 2016, A&A, 592, A57
- Shen & Bildsten (2014) Shen K. J., Bildsten L., 2014, ApJ, 785, 61
- Shen et al. (2018) Shen K. J., Kasen D., Miles B. J., Townsley D. M., 2018, ApJ, 854, 52
- Silverman et al. (2012) Silverman J. M. et al., 2012, ApJ, 756, L7
- Silverman et al. (2013) Silverman J. M., Ganeshalingam M., Filippenko A. V., 2013, MNRAS, 430, 1030
- Silverman et al. (2015) Silverman J. M., Vinkó J., Marion G. H., Wheeler J. C., Barna B., Szalai T., Mulligan B. W., Filippenko A. V., 2015, MNRAS, 451, 1973
- Sim et al. (2010) Sim S. A., Röpke F. K., Hillebrandt W., Kromer M., Pakmor R., Fink M., Ruiter A. J., Seitenzahl I. R., 2010, ApJ, 714, L52
- Smartt et al. (2015) Smartt S. J. et al., 2015, A&A, 579, A40
- Smette et al. (2015) Smette A. et al., 2015, A&A, 576, A77
- Sollerman et al. (2004) Sollerman J. et al., 2004, A&A, 428, 555
- Spyromilio et al. (2004) Spyromilio J., Gilmozzi R., Sollerman J., Leibundgut B., Fransson C., Cuby J.-G., 2004, A&A, 426, 547
- Spyromilio et al. (1992) Spyromilio J., Meikle W. P. S., Allen D. A., Graham J. R., 1992, MNRAS, 258, 53P
- Sternberg et al. (2011) Sternberg A. et al., 2011, Science, 333, 856
- Stritzinger & Sollerman (2007) Stritzinger M., Sollerman J., 2007, A&A, 470, L1
- Suntzeff et al. (2003) Suntzeff N. B., Candia P., Stritzinger M., 2003, IAU Circ., 8171
- Taubenberger et al. (2009) Taubenberger S. et al., 2009, MNRAS, 397, 677
- Toonen et al. (2017) Toonen S., Perets H. B., Hamers A. S., 2017, arXiv:1709.00422
- Tyndall et al. (2016) Tyndall N. B., Ramsbottom C. A., Ballance C. P., Hibbert A., 2016, MNRAS, 462, 3350
- Vernet et al. (2011) Vernet J. et al., 2011, A&A, 536, A105
- Webbink (1984) Webbink R. F., 1984, ApJ, 277, 355
- Whelan & Iben (1973) Whelan J., Iben I. J., 1973, ApJ, 186, 1007
- Wilk et al. (2018) Wilk K. D., Hillier D. J., Dessart L., 2018, MNRAS, 474, 3187
- Yoon et al. (2007) Yoon S.-C., Podsiadlowski P., Rosswog S., 2007, MNRAS, 380, 933
- Zhang et al. (2014) Zhang J. et al., 2014, ApJ, 797, 5
Appendix A Photometry of SN 2013cs
| MJDa | g | r | i |
|---|---|---|---|
| (mag) | (mag) | (mag) | |
| 56427.1 | 14.820.06 | 14.740.08 | 15.170.11 |
| 56427.7 | 14.710.05 | 14.630.06 | 15.040.17 |
| 56428.8 | 14.500.05 | 14.470.07 | 14.800.12 |
| 56431.1 | 14.150.04 | 14.140.04 | – |
| 56448.0 | 14.450.07 | 14.480.09 | 15.270.06 |
| 56453.7 | 14.820.04 | 14.590.06 | 15.430.20 |
| 56454.0 | 14.910.05 | 14.640.06 | 15.310.12 |
| 56459.0 | 15.290.06 | – | 15.180.06 |
| 56461.0 | 15.430.06 | 14.920.06 | – |
| 56463.0 | 15.630.05 | 14.580.08 | 15.130.09 |
| 56465.0 | 15.700.05 | 14.820.06 | 15.000.10 |
| 56467.0 | 15.990.04 | 14.990.06 | 15.170.13 |
| 56469.0 | 16.220.05 | 15.160.08 | 15.310.09 |
aMJD = Modified Julian date.