The ever-surprising blazar OJ 287: multi-wavelength study and appearance of a new component in X-rays
Abstract
We present a multi-wavelength spectral and temporal investigation of OJ 287 emission during its strong optical-to-X-ray activity between July 2016 - July 2017. The daily -ray fluxes from Fermi-LAT are consistent with no variability. The strong optical-to-X-ray variability is accompanied by a change in power-law spectral index of the X-ray spectrum from to , with variations often associated with changes in optical polarization properties. Cross-correlations between optical-to-X-ray emission during four continuous segments show simultaneous optical-ultraviolet (UV) variations while the X-ray and UV/optical are simultaneous only during the middle two segments. In the first segment, the results suggest X-rays lag the optical/UV, while in the last segment X-rays lead by 5-6 days. The last segment also shows a systematic trend with variations appearing first at higher energies followed by lower energy ones. The LAT spectrum before the VHE activity is similar to preceding quiescent state spectrum while it hardens during VHE activity period and is consistent with the extrapolated VHE spectrum during the latter. Overall, the broadband spectral energy distributions (SEDs) during high activity periods are a combination of a typical OJ 287 SED and an HBL SED, and can be explained in a two-zone leptonic model, with the second zone located at parsec scales, beyond the broad line region, being responsible for the HBL-like spectrum. The change of polarization properties from systematic to chaotic and back to systematic, before, during and after the VHE activity, suggest dynamic roles for magnetic fields and turbulence.
keywords:
BL Lac objects: individual: OJ 287 – galaxies: active – galaxies: jets – radiation mechanisms: non-thermal – gamma-rays: galaxies – X-rays: galaxies1 Introduction
Blazars are the high and rapidly variable subclass of active galactic nuclei (AGNs) with emission dominated by non-thermal radiation emanating from relativistic jets oriented at small angles to our line of sight. The variability activity is typically incoherent and complex, covers all the accessible observational domains from radio to GeV/TeV -rays with temporal variation from minutes to decades, polarization from a few to %, and spatially extended jets up to Mpc scales. The Doppler boosting associated with bulk relativistic motions in the jets severely affects the spectral and temporal domains, making the variability appear to be the most energetically extreme among persistently variable astrophysical objects. Historically, blazars have been classified empirically as BL Lacartae objects and flat spectrum radio quasars (FSRQs) based on the properties of their optical-ultraviolet (UV) spectra. The former is characterized by very weak emission lines or even a featureless spectrum while the latter exhibits prominent broad emission lines (e.g. Urry & Padovani, 1995).
Unlike the apparent stochastic temporal variability (Goyal et al., 2017; Kushwaha et al., 2016, 2017), the spectral domain exhibits a characteristic spectral energy distribution (SED) dominated by two broad humps. The first hump peaks somewhere between the near-infrared (NIR) to UV or soft-X-ray bands, while the second hump peaks at -ray energies. This characteristic has led to the classification of blazars in terms of the location of the first hump. Thus, BL Lacs have been named as low-energy peaked (LBL), intermediate-energy peaked (IBL) and high-energy peaked (HBL) BL Lacs, respectively (Fossati et al., 1998; Padovani & Giommi, 1995) while FSRQs, so far, have been found to be exclusively low-energy peaked. The radiation from the first hump is well understood to be the synchrotron emission from relativistic non-thermal electrons while the processes for the high energy emission are still uncertain. Both leptonic and hadronic based processes can reproduce the high hump fairly well. In the leptonic scenarios, the high energy hump results from inverse Compton (IC) scattering of the surrounding photon fields (e.g. Ghisellini & Tavecchio, 2009); e.g. for synchrotron photons themselves this is called the synchrotron-self-Compton (SSC) process whereas for fields external to the jet, such as from the accretion disk or broad line region this is external Comptonization (EC). The hadronic picture invokes proton-synchrotron and/or proton-photon cascade processes (e.g. Mücke et al., 2003).
OJ 287 is a BL Lacartae object with an LBL SED, located at the redshift of . It is one of the bright and highly variable sources in radio and optical bands. The source has been observed to exhibit a very wide range of variations in all the domains and is best known for its regular 12 years outbursts in optical R-band data available since 1890 (Hudec et al., 2013; Valtonen et al., 2016, and references therein). This regular feature has been used to claim it to be a binary super-massive black hole (SMBH) system (Sillanpää et al., 1988; Valtonen et al., 2016, and references therein) with the major outbursts arising from the impact of the secondary black hole on the accretion disk of the primary. The model has evolved from its original inception with observational inputs and has been successful in predicting the timing of the regular flares quite well. In addition, many other quasi-periodicities of different durations have been claimed for OJ 287 e.g. 40–50 days (Pihajoki, Valtonen, & Ciprini, 2013; Wu et al., 2006), 435 days (Sandrinelli et al., 2016), and 400 days (Bhatta et al., 2016).
Being bright at radio and optical energies with intriguing variability features, OJ 287 has been followed extensively and intensively in different energy bands, including exploration of jet features and emission in radio (Matveyenko & Sivakon’, 2017; Tateyama, 2013; Agudo et al., 2012; Moór et al., 2011; Tateyama & Kingham, 2004), optical (Villforth et al., 2010), UV and X-rays (Siejkowski & Wierzcholska, 2017; Marscher & Jorstad, 2011), along with its broadband emission variability and spectrum (Seta et al., 2009; Agudo et al., 2011; Kushwaha, Sahayanathan, & Singh, 2013; Kushwaha et al., 2018). On long terms, jet kinematic studies at radio wavelengths show complex patterns with a sharp swing of in the projected jet-position-angle and jet precession/wobbling (Agudo et al., 2012; Tateyama & Kingham, 2004). The optical/UV emission has been found to lack any clear relation vis-à-vis X-ray, with optical variability being more pronounced than the X-ray (Siejkowski & Wierzcholska, 2017). Additionally, Siejkowski & Wierzcholska (2017) also found a harder-when-brighter spectral behavior in the X-ray but not in the optical band. On short terms, the multi-wavelength emission has been found to vary almost simultaneously from NIR to -ray energies (Agudo et al., 2011; Kushwaha, Sahayanathan, & Singh, 2013; Kushwaha et al., 2018). Normally in BL Lacs, the high energy emission is argued to be the result of SSC. However, using a systematic analysis during a very well observed flare of OJ 287 in 2009, Kushwaha, Sahayanathan, & Singh (2013) showed that SSC cannot explain the high energy emission (see also Seta et al., 2009) and argued that it originated via an EC process. This interpretation is consistent with the recent detection of new components in NIR-optical and optical-UV with a hardening of the -ray spectra (Kushwaha et al., 2018) compared to previous ones (Seta et al., 2009; Kushwaha, Sahayanathan, & Singh, 2013).
The latest optical outburst of OJ 287 produced by an impact on the accretion disc was expected to occur in December 2015 in the binary SMBH model (Valtonen et al., 2010, and references therein). Hence, the source was being monitored and indeed the hint of first enhancement/activity at IR-optical energies was noted around November 14, 2015 (MJD 57340; Valtonen et al., 2016; Gupta et al., 2017a) and was subsequently followed intensively by many research groups and observatories across the globe in both photometry and polarization (Valtonen et al., 2016; Gupta et al., 2017a; Rakshit et al., 2017; Kushwaha et al., 2018). The predicted disk impact flare was observed on 5th December 2015 showing a relatively low flux polarization ( 10%; Valtonen et al., 2016). Concurrent to this, activity across the electromagnetic spectrum was observed, with increased activity at X-ray and -ray energies as well (Kushwaha et al., 2018). A detailed investigation of multi-wavelength spectral and temporal variability by Kushwaha et al. (2018) during November 2015 – May 2016, for the first time revealed a spectral bump in the optical-IR and another in the optical-UV spectrum along with a hardening and shift in the peak of -ray SED. The NIR-optical jump was found to be consistent with the accretion disk of the primary while the optical-UV could come from the little blue bump. Addition of IC scattering of the optical-UV bump naturally reproduced the observed hardening and the shift of the peak of the -ray SED (Kushwaha et al., 2018). Recently, the source underwent the highest ever rise in X-rays (Grupe et al., 2017) and was concurrently detected at the very high energy band (VHE, GeV) by VERITAS (O’Brien, 2017) between February and March 2017 with its energy spectrum being consistent with a power-law model of spectral index .
Here we present new observations that follow those of our study of OJ 287 in Gupta et al. (2017a, 2018) and Kushwaha et al. (2018), focusing on multi-wavelength (MW) spectral and temporal variability. The paper has five sections, with §2 describing the summary of the compiled MW data and the reduction procedures. §3 presents the details of the spectral and temporal analysis with implications and insights given in §4, followed by our conclusions in §5. A CDM cosmology with = 69.6 km s-1 Mpc-1, = 0.286 and = 0.714 is assumed for calculation of physical quantities.
2 Multi-wavelength Data and Reduction
2.1 Fermi -ray Data
The -ray data belong to the Large Area Telescope (LAT), the primary instrument on board the Fermi space observatory. It operates primarily in scanning mode and covers all of the sky every 3 hours, detecting -ray photons between 20 MeV and 300 GeV (Atwood et al., 2009). In the present work, we have used the latest, Pass 8111http://www.slac.stanford.edu/exp/glast/groups/canda/lat_Performance.htm, (Atwood et al., 2013) instrument response processed data of the source from 31 July 2016 to 24 July 2017 (MJD: 57600 – 57950).
The data are analyzed following the standard procedures222https://fermi.gsfc.nasa.gov/ssc/data/analysis/scitools/python_tutorial.html using the Fermi Science Tool version v10r0p5. For each data point, the photons event file was generated by selecting “source” class events with “evclass=128, evtype=3” from a circular region of interest (ROI) of centered on the source with energies between 0.1E300 GeV. A maximum zenith angle of 90∘ was used to avoid the Earth’s limb -ray photon background. The corresponding good time intervals were generated with “(DATA_QUAL0)&&(LAT_CONFIG==1)”. The exposure file, incorporating corrections for cuts and contribution from other sources in the ROI and those immediately outside it, was generated on the ROI plus an additional annulus of around it. The events were then optimized for the input spectral model file using the ‘unbinned likelihood analysis’ of Gtlike provided within the Python library of the analysis software. The input model file was generated from the 3rd LAT catalog (3FGL–gll_psc_v16.fit; Acero et al., 2015) and included the Galactic and isotropic extragalactic contributions through their respective templates gll_iem_v06.fits and iso_P8R2_SOURCE_V6_v06.txt.
We generated the daily -ray light curve for OJ 287 following the above-mentioned procedure. The source was modeled with a power-law -ray spectrum while the default models, as used in the 3FGL catalog, were used for the rest of the sources. During the optimization, the Galactic and extragalactic components were fixed to the their best fit values obtained from the whole duration of these observations. In addition, we extracted two -ray SEDs, for MJD 57600–57750 and for MJD 57750–57900. The former corresponds to the state when the source is not detected in VHE while the latter represents frequent detection at VHE (O’Brien, 2017). For this, we divided the LAT energy band into six bins, 0.1–0.3, 0.3–1, 1–3, 3–10, 10-100, and 100–300 GeV, and a power-law source spectrum was used.
2.2 Swift X-ray and UV/Optical Data
X-ray: The X-ray Telescope (XRT) on board the Swift observatory has a wide dynamic coverage with automatic data acquisition depending on the source brightness (Burrows et al., 2005). For count rates below 0.5 count s-1, the data is recorded in photon counting (PC) mode and this shifts to window timing (WT) mode above it for rates up to 100 count s-1. In the present work, we have used the pointed observations of these two modes which are analyzed following the recommended procedures with default parameters. The science level files were generated by processing each observation ID via the xrtpipeline task with latest calibration files. The resulting events files were then analyzed within xselect using a circular region of for OJ 287 and an annular source-free region for the background to estimate the source flux and spectrum. The PC mode observations with source region count rate 0.5 count s-1 were checked for pile-up and were corrected following the recommended procedures333http://www.swift.ac.uk/analysis/xrt/pileup.php (e.g. Gupta et al., 2017b).
The spectra were modeled in XSPEC using ancilliary response file generated by the xrtmkarf task. We used a minimum of 20 counts per energy bin and the statistics. Most of the observations were found to depart from a power-law description at the high energy end. Thus, we additionally used a log-parabola model based on the ftest probability. The log-parabola description was used over power-law whenever the ftest probability became . During the analysis, the neutral hydrogen column density (NH) was fixed to the Galactic value of if the best fit resulted in a value below, or consistent with, it. The unabsorbed flux was calculated using the cflux task while the X-ray SEDs were corrected for NH absorption using the ratio of the model without NH (NH = 0 without fit) and with NH (best fit).
Swift-UVOT: The UV-Optical observations by the Ultraviolet and Optical Telescope (UVOT; Roming et al., 2005) on board the Swift observatory were analysed for all the filters (v, b, u, uvw1, uvm2, uvw2). We used the available sky images which were already corrected for any shift or rotation from the source position. We summed the frame exposures to increase the signal to noise ratio, if any, by using ftool task uvotimsum. Low sensitivity patches on the CCD were checked by running UVOTSOURCE on sky images of the UVOT filters using the latest small scale sensitivity file444https://swift.gsfc.nasa.gov/analysis/uvot_digest/sss_check.html. Data points associated with the bad patches on the CCD were excluded from the analysis. A circular region of 5″was employed for the source and an annular region centered on the source, of inner and outer radii of 25″and 35″, respectively, was used to find the background.
We then extracted the flux density for the net exposure of a particular observation by using uvotsource with latest calibration. The extracted light curves between MJD 57600 to MJD 57950 for every band of each observation as shown in Fig. 1. The fluxes have been corrected for extinction following the description of Roming et al. (2009) with an E(BV) value of .
2.3 Optical Data
Photometry and Polarimetry: Our ground-based optical photometric data for the blazar OJ 287 during this temporal period are taken from nine 1–2m class optical telescopes in Japan, China, Georgia, Bulgaria (2 telescopes), Serbia, Spain, and USA (2 telescopes). Optical photometric observations were made on 140 observing nights during which we collected a total of 1750 image frames of OJ 287. The detailed photometric observation log is given in Gupta et al. (2018). Optical polarimetric observation of OJ 287 were taken during 75 observing nights from which we obtained 85 polarimetric measurements.
The data include the photometric and polarimetric observations from the public archive555http://james.as.arizona.edu/psmith/Fermi/datause.html of Steward Observatory, University of Arizona, USA. The observations were carried out using two telescopes with SPOL CCD Imaging/Spectropolarimeter instruments attached to them. The details about the telescopes, instruments, observation and data analysis methods are given in Smith et al. (2009).
New photometric observations for this project were carried out with seven other optical telescopes. CCD detectors and optical BVRI broad band filters are attached to these telescopes. The details about these telescopes and their CCDs are given in our earlier papers (e.g. Hu et al., 2014; Agarwal et al., 2015; Gupta et al., 2016, 2018). Photometric data collected from these telescopes were processed using standard image processing techniques. Image processing (i.e. bias subtraction, flat fielding, cosmic ray removal, etc.) of different telescope data are done using Image Reduction and Analysis Facility (IRAF)666IRAF is distributed by the National Optical Astronomy Observatories, which are operated by the Association of Universities for Research in Astronomy, Inc., under cooperative agreement with the National Science Found or locally developed procedures using the Interactive Data Language (IDL), or using the software MaxIm DL. Instrumental magnitudes of the blazar OJ 287 and standard stars in the blazar field are estimated using DAOPHOT II software (Stetson, 1987, 1992), or MaxIm DL. A differential photometric technique is used and the blazar OJ 287 photometric data is calibrated using the local standard stars (Fiorucci & Tosti, 1996). The details of the observations and analysis procedure will be given another paper Gupta et al. (2018). The extinction correction of the data is done with the E(B-V) value mentioned above, following Schlafly & Finkbeiner (2011), while the magnitude to flux conversion is done using the zero point fluxes from Bessell, Castelli, & Plez (1998). The data from different observatories are in excellent agreement with each other during overlapping or nearly simultaneous measurements, and have similar measurement errors (e.g. Gupta et al., 2017a).
2.4 Multi-wavelength Light Curves
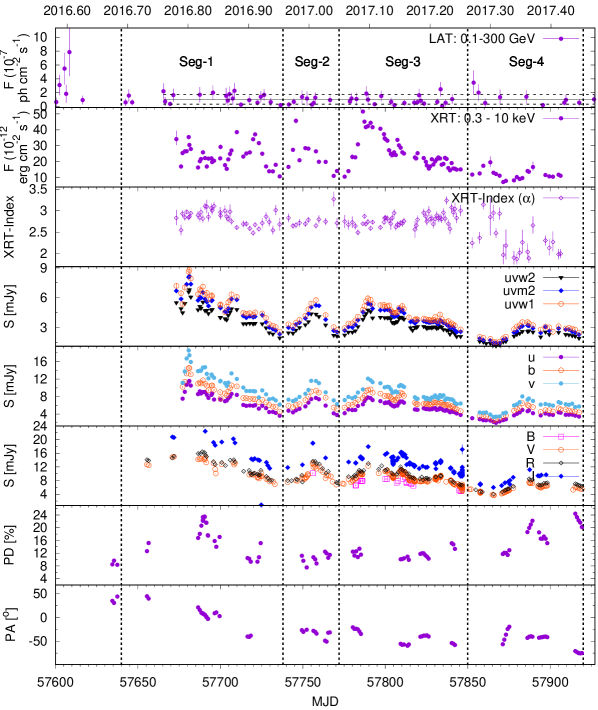
The MW light curve of the source covering the broad optical-to--ray portion of the electromagnetic spectrum, along with the X-ray power law spectral index and optical polarization data, is shown in Figure 1. The most prominent and interesting feature in the MW light curve is the huge flux variations in optical-to-X-ray bands without any significant variability at the Fermi-LAT -ray energies, though the source is detected frequently in the Fermi-LAT bands on daily timescales. However, all -ray data are consistent with the mean and average error around it for the duration of the MW campaign, as shown by the solid and dashed lines in fig 1 and hence, statistically, not considered to be variable. The optical-to-X-ray light curves, on the other hand, show periods of high activity which can be grouped into four segments: (MJD) 57640 – 57738, 57738 – 57772, 57772 – 57850, and 57850 – 57920 based on the activity in the optical-UV light curves. The dashed vertical lines in fig. 1 mark these temporal durations which are refered to hereafter as Seg-1, Seg-2, Seg-3, and Seg-4, respectively. Additionally, we have listed the MJDs discussed/considered in the text related to the fluxes and spectral states of the source in Table 1.
| MJD | Event |
|---|---|
| 57552 | appearance of inverted XRT spectrum within Swift observations |
| 57786 | highest ever reported X-ray flux of OJ 287 |
| 57861 | close to minimum flux in optical-UV but flaring in X-ray |
| 57871 | minimum flux in X-ray, UV, and optical |
The strong X-ray variability is accompanied by a change in the X-ray photon spectral index, (Power-law: ; Log-parabola: ) from its normal state where a power-law index is typical (Kushwaha et al., 2018; Siejkowski & Wierzcholska, 2017; Kushwaha, Sahayanathan, & Singh, 2013) to steep values (2.5 – 3), although it appears to be reverting to its normal state at the end of the period of these measurements. Interestingly, this change in X-ray behavior is also coincident with the first-ever detection of the source at VHE by VERITAS on a nightly basis (O’Brien, 2017). This detection is also reflected in the LAT -ray SED of the source, where the first half (57600–57750) is softer compared to the latter half (57750–57900). Further, the extrapolated VHE spectrum during the latter half is consistent with the LAT spectrum (see Fig. 4).
Visually, the optical-to-X-ray variability appears well correlated with simultaneous changes within the observational cadence of different bands. However, there are periods where X-ray, and optical variations are at odds with each other, especially during MJD 57850 – 57865 when the variations at higher energies systematically seem to precede the lower ones. The optical polarization degree (PD) also shows significant variations and is in tune with the optical variation (e.g. Gupta et al., 2018) while the polarization angle (PA) shows a monotonic decrement with swings () superposed on it.
3 Spectral and Temporal Variability Analysis and Results
3.1 Cross Correlation Analysis


| Light curves | Seg-1 | Seg-2 | Seg-3 | Seg-4 |
|---|---|---|---|---|
| XRT vs uvm2 | ||||
| XRT vs v | ||||
| XRT vs R | – | |||
| uvm2 vs v | ||||
| uvm2 vs R | ||||
| v vs R | ||||
| Seg-1: 57640-57738; Seg-2: 57738-57772; Seg-3: 57772-57850; Seg-4: 57850-57920 | ||||
To understand the inter-band correlations during the four activity periods (Segs 1–4), we performed cross-correlation analyses between optical, UV and X-ray light curves777The DCF of LAT -ray with others result in zero/insignificant correlation (DCF value 0.6). using the z-transformed discreet correlation function (zDCF) of Alexander (2013, see also ()). The method is applicable to homogeneously as well as sparse, unevenly sampled data and uses the Fisher’s z-transform and equal population binning to correct the sampling and other biases. For a given pair of light curves, it first constructs all the possible time lag pairs using data from the two light curves. These are then sorted according to their lags and binned by equal population to have at least 11 lag points per bin, discarding the interdependent pairs. The correlation coefficients are then calculated for these bins which are transformed into the z-space via
where and are, respectively, the bin correlation coefficient and the unknown population correlation coefficient. The transformation makes the highly skewed distribution of coefficients r in the real domain into an approximately normal distribution in the z-space, thereby making the estimation of error reliable. For an error estimate, it uses a Monte Carlo method where it constructs new light curves by adding a random error to observed fluxes based on the measurement error and then applies the zDCF on it. The mean and variance of these runs in the z-space, when transformed back into the real space provide the coefficients and errors on them.
Figure 2 shows the DCFs between possible light curve pairs for the four high activity durations (Segs 1 – 4) and the corresponding lag results are listed in Table 2. The errors are estimated from 1000 Monte Carlo simulations of each pair of light curves. In Figure 2 and Table 2 the DCF labels tagged as “LC1 vs LC2” refer to the two light curves between which the correlation is examined. In this notation, a positive lag means the variation appears first in “LC1” followed by “LC2”, while a negative lag means the opposite.
3.2 Spectral Energy Distributions
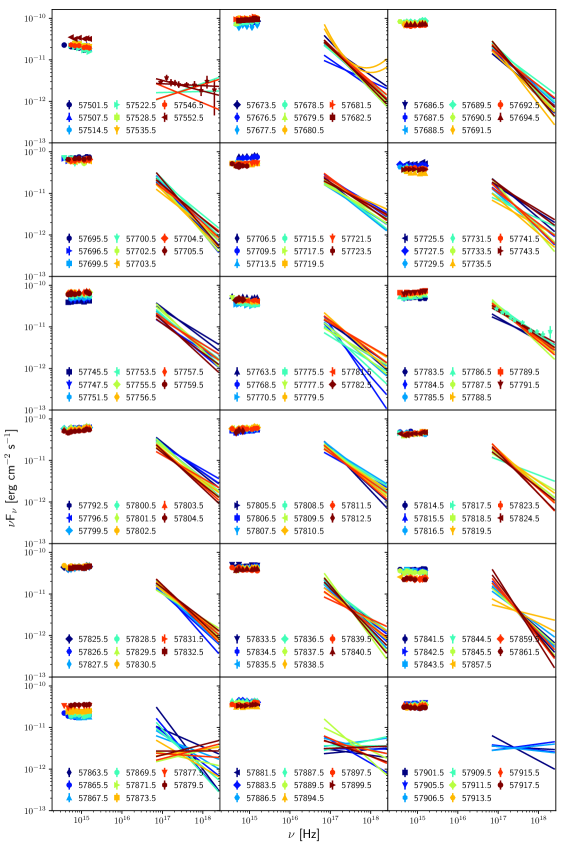
Figure 3 shows the daily evolution of optical to X-ray SEDs of OJ 287 between MJD 57500 and 57920. Only days having data in four different bands are shown. The X-ray SED is represented as the range around the best fit power-law/log-parabola spectrum to each of the X-ray observation IDs while the data belong to the optical-UV bands. The representation provides a good overall description of the actual SEDs except for the highest end of the spectrum for a few of the observations as can be seen from the overlaid star data in first (for MJD 57552.5) and third (for MJD 57786.5) rows of Figure 3.
Particularly interesting are the strong variability (by a factor of ) of the X-ray fluxes and the spectral inversion of the X-ray emission (in the sense that the values decline, or ) from its previously observed normal states where they are flat or rising () (Kushwaha et al., 2018; Siejkowski & Wierzcholska, 2017; Kushwaha, Sahayanathan, & Singh, 2013; Seta et al., 2009). Within the observational cadence, the inversion first appeared on MJD 57552 (see Fig. 3). This change in X-ray spectrum is also reflected in the optical-UV SED, which also hardens. The spectral variations from the beginning until MJD 57677, show the building up of this new spectral state, leading to an inverted spectrum. Following MJD 57677 to 57840 the X-ray spectrum is quite stable, except for an overall change in the normalization, which is also reflected in the optical-UV. In fact, most of the X-ray SEDs show departures from the fitted power-law spectrum at the high energy end of the spectrum, a typical example of which can be seen in the third row of Fig. 3 (see also Fig. 4), thereby revealing the historical state that is being dominated by the new component during most of these observations. After MJD 57860, the X-ray spectrum becomes chaotic, showing frequent changes but with a tendency towards its normal SED state. This is also reflected in the optical-UV part as well and suggests the weakening of this new component.
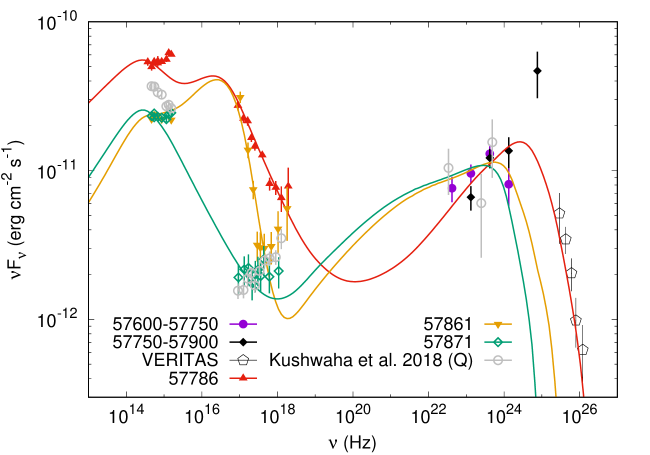
Figure 4 shows the broadband SEDs corresponding to the different flux and spectral states of the source in optical-UV and X-rays: MJD 57871 corresponding to the lowest optical-to-X-ray flux; MJD 57861 corresponding to a high X-ray flux but close to the lowest in optical-to-UV; MJD 57786 corresponding to the highest X-ray flux and a high optical-to-UV flux. The optical to X-ray SED for other flux states are in between these three with changes mainly in the overall normalization/strength. Since the Fermi-LAT -ray fluxes do not show significant variability, the -ray spectrum is extracted for two equal durations: MJD 57600–57750 and MJD 57750–57900, roughly representative of the no VHE and VHE activity reported by VERITAS (O’Brien, 2017). In addition, we have plotted the quiescent state broadband SED (Q) from Kushwaha et al. (2018) for comparison where the X-ray spectrum was still in its typical state. The Fermi-LAT -ray SEDs also reflect the reported VHE variability, where the first half appears consistent with the quiescent state SED clearly showing the spectral break and the shift in the peak as reported before in Kushwaha et al. (2018, see also ()) but with much better statistics. The latter half is consistent with the reported VHE spectrum upon extrapolation to Fermi-LAT energies.
Observationally, the low state broadband SED (MJD 57871) is similar to the quiescent SED of the preceding segment (Kushwaha et al., 2018) and thus, can be attributed to the emission from a single zone. The SEDs for high activity periods, on the other hand, can be characterized as a sum of an LBL SED (typical OJ 287 SED with modified -ray spectrum) and an HBL SED where in the latter, the synchrotron peaks occur in the UV to soft-X-ray regions. Thus, the emission during high activity periods is attributed to two emission zones (see arguments in §4) where the first zone represents the typical source SED as presented in Kushwaha et al. (2018) while the second zone is responsible for an HBL-like SED. For modelling, we have followed the approach adopted in Kushwaha, Sahayanathan, & Singh (2013) of inferring the parameters from observations directly. However, such an unambiguous estimation of parameters is not possible in the present case due to the strong dominance of one of the zones in some part of the optical to X-ray region while the other is more important in the rest (zone one mainly in the optical, while second contributes more in UV-X-ray), thereby making the level of flux and the spectral indices uncertain except for the low state SED (MJD 57771). However, even in the low state SED case, information from NIR bands (J and K) is missing where the break due to accretion disk was seen during the preceding duration (Kushwaha et al., 2018). This further introduces uncertainty about the level of thermal/non-thermal contribution (see Kushwaha et al., 2018). Within these limits, we provide a brief description of the model below.
For the low state, the emission region is from a spherical blob of plasma, moving with a bulk Lorentz factor () at an angle theta () to the observer’s line of sight. The blob is filled with a randomly oriented magnetic field and an isotropic non-thermal electron population with a broken power-law distribution given by (primed quantities refers to the blob frame while unprimed to the observer frame)
where and are respectively the spectral indices responsible for the shape of the SED, before and after its peak. is the particle normalization while represents the particle energy in units of rest mass energy with being the break in the particle spectrum and observationally associated with the peak of the broadband SED and and define the span of the particle spectrum. The second zone is similar to first in terms of constituents and parameter except for their values which correspond to the new component with synchrotron peak in UV – X-ray region.
The size of the first emission zone, representing a typical OJ 287 SED is , taken from the previous study (Kushwaha et al., 2018) which corresponds to a variability time of 1.5 days for a bulk Doppler factor of 10. For the second zone, the daily VHE light curve presented in O’Brien (2017) show a rise time of 2 days, while the X-ray light curve having observations on adjacent days indicate 1 day, thereby suggesting a variability time similar to the first zone. Thus, we have assumed the size of the second zone to be same as that of first zone, i.e., . The jet angle to our line of sight is taken to be while is assumed to be equal to the bulk Lorentz factor (Kushwaha, Sahayanathan, & Singh, 2013).
We first start by modeling the low state SED with particle spectral indices from the LAT -ray spectrum. Under the Dirac delta function approximation of IC scattering in the Thomson regime, the observed flux before the SED peak due to the EC process is (Kushwaha et al., 2018; Kushwaha, Sahayanathan, & Singh, 2013)
| (1) |
where , and are respectively, the Doppler factor and the photon field for the IC scattering (little blue bump/BLR: Hz). Similarly, the synchrotron flux after the SED peak in the optical-NIR region, in the Dirac delta function approximation is
| (2) |
where is the magnetic field in the emission region and the SED peak of the synchrotron emission is related to Larmor frequency () by
| (3) |
Thus, for a given Doppler factor and the observed -ray flux, the particle normalization can be estimated from equation 1. With this, the magnetic filed can be estimated using equations 3 and 2 by the constraint that the peak is below the lowest frequency of the optical bands while at the same time it reproduces the X-ray emission. Thus, one can iterate until the the condition is satisfied. It should be noted that for IC of BLR, the LAT spectrum lies in the Klein-Nishina regime (Georganopoulos, Kirk, & Mastichiadis, 2001) and hence, slightly harder particle spectral indices will be needed.
| Parameters | 57786 | 57861 | 57871 |
| Particle index before break (p) | 2.5 (2.0) | 2.2 (2.0) | 2.2 |
| Particle index after break (q) | 4.4 (4.2) | 4.4 (6.6) | 4.0 |
| Magnetic field (Gauss) | 11.5 (0.8) | 1.8 (1.7) | 2.5 |
| Particle break energy | 1145 (36086) | 3729 (35512) | 2537 |
| Relativistic particle energy density (erg cm-3) | () | () | |
| Doppler factor | 9.3 (17.3) | 7.5 (17.3) | 8.5 |
| Jet power (logscale, erg/s) | 46.1 (45.5) | 45.7 (45.9) | 45.6 |
| Minimum electron Lorentz factor∗ | 5 (30) | 4 (30) | 5 |
| Size of the emission region: cm | |||
| Jet angle to the line of sight: | |||
| Maximum electron Lorentz factor: | |||
| ∗in units of electron rest mass energy | |||
| Values in parentheses correspond to the second zone (see §4) | |||
Similarly, for the broadband SEDs from the duration of high activity, the particle spectral indices can be retrieved from the corresponding X-ray and LAT/VHE spectrum for second zone but these are uncertain for the first zone. Also, the level of optical and -ray emission from the first zone is uncertain. This, thereby, opens a huge parameter space with varied contribution from each such that the combined output equals the observed emission level. Following the above mentioned approach, we list a parameter set in Table 3 which reproduces the observed flux reasonably well, as shown in Figure 4. For the optical to X-ray SED of MJD 57861, the LAT SED (57600 – 57750) represent the -ray emission as no VHE was detected after MJD 57845 (O’Brien, 2017) while the LAT (57750 – 57900) and VERITAS VHE spectrum represent the -ray emission for the optical to X-ray SED of MJD 57786. Finally, it should be noted that any change in the inputs used to derived the parameters will affect the reported values. Such a systematic and extensive investigation is beyond the scope of present work.
4 Discussion
OJ 287 has been active at optical, UV and X-ray energies since 15 November 2015, as expected in the binary SMBH scenario for the disk impact outburst which was observed on 5 December 2015 (Valtonen et al., 2017, 2016, and references therein). Coordinated observations by many observatories were made focusing mainly on the timing and polarization in the context of the binary SMBH model (Valtonen et al., 2017, 2016) and on the optical-NIR variability (Gupta et al., 2017a; Rakshit et al., 2017). However, high activity was also seen in X-rays and -rays as well, and a systematic MW investigation by Kushwaha et al. (2018) revealed many new features: a bump in NIR-optical and another in optical-UV along with a hardening of the LAT -ray SED. Such features have never been seen in this or any other BL Lac source to date to the best of our knowledge. The period considered here, 31 July 2016 through 16 July 2017 (MJDs: 57600-57950) is a continuation of the work presented in Gupta et al. (2017a) and Kushwaha et al. (2018) with focus on MW aspects. The details of optical variation on various timescales, including intra-day, along with polarimetric variability will be presented in the accompanying paper (Gupta et al., 2018).
OJ 287 is continuing its surprising trends across the MW electromagnetic spectrum, both spectrally and temporally, with many first-ever features reported for this source recently. These include the highest-ever observed X-ray state till date (Grupe et al., 2017) and the very first detection of the source at VHE energies (O’Brien, 2017). The period shows intense variability in X-ray to optical bands which can be grouped into four segments (Seg: 1 – 4) of high activity. However, the daily LAT -ray light curve is statistically invariable (see Fig. 1) with all data points being consistent with the band formed by the mean flux-error around the mean flux for the considered duration. Further, most of the photometric variations are associated with significant changes in PD and PA on similar timescales. The former shows a positive bias towards the optical flux, more often displaying an increased PD with an increment in optical flux; however, this is not a strict correlation and so does not directly reflect the change of the photometric amplitude. The latter shows PA swings superposed on a monotonic declining trend, often reflective of the change in the PD.
Cross-correlations between optical-to-X-ray bands during the four activity periods (Segments 1 – 4) show that the optical and UV variations are simultaneous for all of them while the X-ray–optical/UV variations are simultaneous only for Seg-2 and Seg-3. During Seg-1, the results are ambiguous. It suggests optical (R) and UV(uvm2) leading the X-rays, but at the same time also suggests a nominal lead for X-ray with respect to optical (v) (ref Table 2). However, as mentioned, the optical and UV variations are simultaneous throughout, thereby making these results suspicious. Further, the peak DCF values are low ( 0.6) and are at the edge of the explored lag duration. During Seg-4, the X-ray leads the optical-UV emission by 5–6 days with variations being anti-correlated: high flux (flaring profile) in X-ray while minima in UV/optical. This correlation is the very first reported for this source on short timescales (during flares). It should be further noted that Seg-4 suggests some peculiar features: a systematic trend in observed variations, appearing first at higher energies followed by the lower ones, e.g., a possible increment in LAT flux around MJD 57855, followed by X-ray around 57810 and then finally in UV-optical around 57835. Interestingly, the fluxes at lower energies have been close to the minima of the respective bands during these rises seen at the higher energies.
The spectral domain also reflects the variations seen in the temporal domain and the evolution of the optical to X-ray SEDs presented here is unique, with unprecedented coverage and cadence. The X-ray spectra () are inverted throughout these observations, as opposed to the normally rising spectrum (e.g. Kushwaha et al., 2018; Kushwaha, Sahayanathan, & Singh, 2013; Idesawa et al., 1997). The effects of changes in the X-ray emission are also seen in the optical-UV SEDs, through the concurrent hardening/softening and/or change in level of emission (Fig. 3). The actual X-ray SED data overlaid in the third row of Figure 3 (see also Fig. 4) show departures from the best-fitting power-law at the highest end of the X-ray spectrum, thereby revealing the nature of the emission feature. Comparison with a quiescent state SED in the MW study of the preceding period as presented in Kushwaha et al. (2018) suggests that the inverted spectrum is a new emission component, overshadowing the typical X-ray SED of the source. Such inverted as well as flat X-ray spectra have been seen before for OJ 287 (Siejkowski & Wierzcholska, 2017; Idesawa et al., 1997, and references therein), but they lacked the MW coverage and cadence that we now have. Finally, we note that OJ 287 seems to be returning towards its typical X-ray emission spectrum by the end of these observations (MJD 57870) where the variation becomes chaotic, strongly suggesting we are seeing the weakening of the new component. This can be seen clearly in the quiescent SED corresponding to the MJD 57871 in figure 4 vis-a-vis the quiescent SED in the preceding phase (Kushwaha et al., 2018).
The uniqueness of the spectral evolution as plotted in Figure 3 allowed us to pinpoint the instance of transition from its historical well-known state (Kushwaha et al., 2018; Siejkowski & Wierzcholska, 2017; Kushwaha, Sahayanathan, & Singh, 2013; Seta et al., 2009) to the present inverted one at around MJD 57752. On the other hand, comparison with flux and spectral state during the previous study by Kushwaha et al. (2018) allows us to track the evolution to this state. This comparison suggests that the build up of the new component had already started around MJD 57500 (see Fig. 3) when the X-ray SED started becoming flat. However, this may not be the true signature of a new component since similar flat X-ray SEDs have been inferred before by Siejkowski & Wierzcholska (2017) without any subsequent enhancement in X-ray flux variability. Further, the subsequent gap in X-ray observations does not allow an unambiguous claim that it is the sign of a new component. Nonetheless, the observed spectral variation, along with the temporal flux and the concurrent VHE detection on a nightly basis, suggesting significant variation with X-rays (O’Brien, 2017), clearly show that the bulk of these variations result from the new component.
The rapid variation in the PD, the power-law broadband nature of the new X-ray component extending down to optical energies, and the concurrent VHE detection suggests the new component to be non-thermal, with the emission originating within the jet. Observationally, the overall broadband SEDs (see Fig. 4) during a high activity period appears to be a combination of typical OJ 287 SED with a modified -ray spectrum (as seen during the preceding phase (Kushwaha et al., 2018) and an HBL SED. In the latter, the first peak in broadband SED occurs in UV-soft-X-ray region while the second peaks in the -rays, with emission extending to VHEs. Further, the strong correlation between the X-ray and the VHE emission reported in O’Brien (2017) imply co-spatial emission and favors a leptonic origin.
Investigation of MW emission in OJ 287 during the previous adjacent period by Kushwaha et al. (2018) shows BLR emission (blue bump) and a strong accretion disc emission (see also Nilsson et al., 2010). Thus, for VHE photons to be observed, the emission region has to be beyond the BLR region to avoid pair absorption (e.g. Kushwaha et al., 2014). Further, the strong variability in optical to X-ray bands while no significant variability is seen in the LAT -ray band, along with X-ray spectra showing a rising trend at the high energy end at the level of the quiescent X-ray spectrum during the preceding period, suggest the observed strong variability comes from another region. Thus, the simplest description for the broadband SEDs during the high activity period would involve two independent emission regions: one at the sub-pc scale as argued in Kushwaha et al. (2018), responsible for the general OJ 287 spectrum, and another at the parsec scale for the VHE emission. Similar suggestions have been made based on X-ray emission during earlier observations (Idesawa et al., 1997; Isobe et al., 2001; Seta et al., 2009). Other leptonic emission models involving two or multiple zones where there are tighter connections between the zones are also possible, but then for VHE to be observed, this has to be located at or beyond the boundary of the BLR. In our model here, the first zone represents the typical emission of OJ 287 with -rays mainly arising as a result of IC of BLR component as in Kushwaha et al. (2018). The second zone is located beyond BLR and thus, only SSC and IC of infrared photons of around 250 K, as found by Kushwaha, Sahayanathan, & Singh (2013) are contributing to -ray and VHE energies.
Since the observed emission is possibly the sum of contributions from two regions, a varied level of contribution from each with the final sum fixed to observed values, is plausible. Hence, many parameter sets may be possible and a systematic study with information in IR and VHE band is needed to remove degeneracies. Here, in Table 3, we list a parameter set which represents the observations reasonably, with the second zone parameter value given in parentheses (see §3.2 for details). The corresponding model flux is plotted in Figure 4. In this model, the VHE spectrum is considered only for the optical to X-ray SED of MJD 57786, emanating from zone 2, which is responsible for the HBL like spectrum. The low state SED corresponding to MJD 57871 is modeled assuming a single zone emission as it is similar to the quiescent state SED of the preceding period (gray data, fig 4) except with a lower optical flux.
Being a potential binary SMBH system, OJ 287 presents a very complex dynamical system during the close encounter periods, particularly considering that each SMBH may have its own magnetized jet and accretion disc. The complexity of the interaction can be understood from the behavior of the high energy emission during the claimed impact encounters (Valtonen et al., 2016). Barring the current epoch, the source has never been detected at VHE energies (Seta et al., 2009; Idesawa et al., 1997, and references therein). However, an inverted X-ray spectrum, such as seen in the present work, seems to have been present around the 1983 impact (Isobe et al., 2001; Idesawa et al., 1997, and references therein) while the 1994 spectrum was a mixture of both, declining below 2 keV and rising above it. The more recent impact events in 2005 and 2008, however, had the typical (uprising) X-ray spectrum. The X-ray variability has also been very different during the impact events. The December 5, 2015 flare showed a factor of 2 brightening (Kushwaha et al., 2018). A similar X-ray brightening was seen in the November 2008 impact with a significant detection in hard X-rays as well (Seta et al., 2009), while no elevated X-ray emission was seen during the 1994 impact event (Idesawa et al., 1997).
The dynamics of close encounters in the binary SMBHs model of OJ 287 (Lehto & Valtonen, 1996) has been explored by Pihajoki et al. (2013) in connection with observations via hydrodynamical modeling of the accretion disk with particles interacting hydrodynamically. As per the details in Lehto & Valtonen (1996), the latest disk impact occurred on 2013.45 (MJD 56457.25), thereby releasing a hot bubble of gas. As a result, it predicted the beginning of an optical/UV flare on 2015.96 0.12 (MJD 57373 43.8). The rise was in fact seen on MJD 57351 (Valtonen et al., 2016), peaking on MJD 57361. Interestingly, the signature of the accretion disc in the OJ 287 was observationally seen around the time of the predicted disk impact (MJD 56439) by Kushwaha et al. (2018). Further investigation by Pihajoki et al. (2013) suggests escape of particles vertically from the disc starting in 2014.2 (MJD 56731) and reaching its peak around 2014.6 (MJD 56877), then falling to minimum on 2015.1 (MJD 57059.5), followed by a second peak on 2015.3 (MJD 57132.5) (Valtonen et al., 2017). Thus, if the current activities are related to these particles reaching the blazar zone where they can further accelerate to ultra-relativistic velocities in shocks (Böttcher, 2016; Marscher & Gear, 1985) or magnetic reconnection sites (e.g. Singh, Mizuno, & de Gouveia Dal Pino, 2016), the location of the blazar zone can be estimated. Associating the highest X-ray flux on MJD 57786 ( 2017.09) with the escape peak of 2014.6 (MJD 56877), the observed time difference years transforms to 11.5 years () or 3.5 parsec in the jet frame, assuming a constant Doppler factor () of 10, consistent with a parsec scale origin, as argued in previous works (Kushwaha, Sahayanathan, & Singh, 2013; Agudo et al., 2012) and the current VHE detection. Though previous observations lacked a good polarimetric cadence, the detection of strong changes in polarization properties showing both systematic and chaotic features during the ongoing activity (Gupta et al., 2018), along with the concurrent detection of high energy emission, clearly suggest a dynamic role of the magnetic field associated with shock and turbulence region (Böttcher, 2016). In fact, the fractional polarization changes from a systematic variation to a chaotic one during the VHE detection duration and then returns again to a systematic one at the end (Gupta et al., 2018), suggesting an important role for turbulence during the VHE activity. Thus, to gain better insights, a self-consistent account of the relativistic SMBH evolution considering the effects of magnetic fields is needed, though this would be far from simple (Valtonen et al., 2017).
5 Conclusions
We systematically investigated the spectral and temporal features of MW emission from OJ 287 during April 2016–July 2017 period. The period corresponds to the historic X-ray variability and a concurrent, very first, detection of the source at the VHE energies by VERITAS.
The optical to X-ray emissions show intense variability while no appreciable variability is seen in the LAT -ray light curve. Cross-correlation analyses between optical, UV, and X-ray during four continuous segments of the light curves resulted a simultaneous variations at optical-UV energies throughout. The optical/UV-X-ray correlation, on the other hand, is simultaneous only during the two middle segments. In the first segment the X-ray may lag the UV/optical, while it leads them by 5-6 days during the last segment with the X-ray being essentially anti-correlated with respect to the optical/UV. Further, the last segment also shows a hint of systematic variation with changes first appearing at the higher energies followed by the lower energies. Most of the X-ray spectra show departure from a power-law description at the highest end, which is consistent with a log-parabolic spectrum with a rising trend in plots. The departure in the X-ray spectrum is consistent with the level of quiescent X-ray emission found in Kushwaha et al. (2018). The combination of these results suggests that during this period most of the X-ray and VHE photons arise from a different region than do the lower-energy emission. The new component looks typical of HBL SEDs, having the first SED peak in UV-soft-X-ray energies with emission extending to VHEs. The overall SEDs during high activity episode are sum of the normal OJ 287 SED (LBL) and HBL SED, and can be reproduced in a two-zone scenario with the second zone located at parsec scales beyond BLR region being responsible for the new X-ray component and the VHE emission. Most of the variations are associated with strong changes in PD as well as in PA. In addition, the duration of VHE detection corresponds to a change of fractional polarization from systematic and chaotic (Gupta et al., 2018), suggesting that the current historic high energy activity is associated with the dynamics of the magnetic field and turbulence.
Acknowledgements
This research has made use of data, software and web tools of High Energy Astrophysics Science Archive Research Center (HEASARC), maintained by NASA’s Goddard Space Flight Center. Observations obtained by the Fermi/Steward Observatory blazar monitoring program have been funded through NASA/Fermi Guest Investigator grants NNX08AW56G, NNX09AU10G, NNX12AO93G, and NNX15AU81G.
PK acknowledges support from FAPESP grant no. 2015/13933-0. ACG is partially supported by Indo-Poland project No. DST/INT/POL/P–19/2016 funded by Department of Science and Technology (DST), Government of India, and also partially by the Chinese Academy of Sciences (CAS) President’s International Fellowship Initiative (PIFI) grant no. 2016VMB073. PJW is grateful for hospitality at KIPAC, Stanford University, and SHAO during a sabbatical. HG is sponsored by a CAS Visiting Fellowship for researchers from developing countries, CAS PIFI (grant no. 2014FFJB0005), supported by the NSFC Research Fund for International Young Scientists (grant no. 11450110398) and also supported by a Special Financial Grant from the China Postdoctoral Science Foundation (grant no. 2016T90393). EMGDP acknowledges support from the Brazilian funding agencies FAPESP (grant 2013/10559-5) and CNPq (grant 306598/2009-4). The Abastumani team acknowledges financial support by the Shota Rustaveli National Science Foundation under contract FR/217950/16. OMK also acknowledges grants NSFC11733001 and NSFCU1531245 of the China NSF. The work of the Bulgarian team was partially supported by the Bulgarian National Science Fund of the Ministry of Education and Science under grants DN 08-1/2016 and DN 18-13/2017. GD and OV gratefully acknowledge the observing grant support from the Institute of Astronomy and Rozhen National Astronomical Observatory, Bulgaria Academy of Sciences, via bilateral joint research project “Study of ICRF radio-sources and fast variable astronomical objects”. This work is a part of the project nos. 176011, 176004, and 176021 supported by the Ministry of Education, Science and Technological Development of the Republic of Serbia SMH’s work is supported by the National Natural Science Foundation of China under grants nos. 11203016 and 11143012, and also partly supported by Young Scholars Program of Shandong University, Weihai, China. MFG is supported by the National Science Foundation of China (grants 11473054 and U1531245). ZZ is thankful for support from the CAS Hundred-Talented program (Y787081009).
References
- Acero et al. (2015) Acero F., et al., 2015, ApJS, 218, 23
- Agarwal et al. (2015) Agarwal A., et al. 2015, MNRAS, 451, 3882
- Agudo et al. (2011) Agudo I., et al., 2011, ApJ, 726, L13
- Agudo et al. (2012) Agudo I., Marscher A. P., Jorstad S. G., Gómez J. L., Perucho M., Piner B. G., Rioja M., Dodson R., 2012, ApJ, 747, 63
- Alexander (2013) Alexander T., 2013, arXiv:1302.1508
- Alexander (1997) Alexander T., 1997, ASSL, 218, 163
- Atwood et al. (2013) Atwood, W., Albert, A., Baldini, L., et al. 2013, arXiv:1303.3514
- Atwood et al. (2009) Atwood W. B., et al., 2009, ApJ, 697, 1071
- Böttcher (2016) Böttcher, M. 2016, Galaxies, 4, 22
- Burrows et al. (2005) Burrows, D. N., Hill, J. E., Nousek, J. A., et al. 2005, Space Sci. Rev., 120, 165
- Bessell, Castelli, & Plez (1998) Bessell M. S., Castelli F., Plez B., 1998, A&A, 333, 231
- Bhatta et al. (2016) Bhatta G., et al., 2016, ApJ, 832, 47
- Fiorucci & Tosti (1996) Fiorucci M., Tosti G., 1996, A&AS, 116, 403
- Fossati et al. (1998) Fossati G., Maraschi L., Celotti A., Comastri A., Ghisellini G., 1998, MNRAS, 299, 433
- Georganopoulos, Kirk, & Mastichiadis (2001) Georganopoulos M., Kirk J. G., Mastichiadis A., 2001, ApJ, 561, 111
- Ghisellini & Tavecchio (2009) Ghisellini G., Tavecchio F., 2009, MNRAS, 397, 985
- Goyal et al. (2017) Goyal A., et al., 2017, arXiv, arXiv:1709.04457
- Grupe et al. (2017) Grupe D., Komossa S., amp, Falcone A., 2017, ATel1, 10043,
- Gupta et al. (2018) Gupta A. C., et al., 2018, arXiv, arXiv:1803.03964
- Gupta et al. (2017b) Gupta A. C., et al., 2017b, MNRAS, 472, 788
- Gupta et al. (2017a) Gupta A. C., et al., 2017a, MNRAS, 465, 4423
- Gupta et al. (2016) Gupta A. C., et al., 2016, MNRAS, 458, 1127
- Hodgson et al. (2017) Hodgson J. A., et al., 2017, A&A, 597, A80
- Hu et al. (2014) Hu S.-M., Han S.-H., Guo D.-F., Du J.-J., 2014, RAA, 14, 719-732
- Hudec et al. (2013) Hudec R., Bašta M., Pihajoki P., Valtonen M., 2013, A&A, 559, A20
- Idesawa et al. (1997) Idesawa E., et al., 1997, PASJ, 49, 631
- Isobe et al. (2001) Isobe N., Tashiro M., Sugiho M., Makishima K., 2001, PASJ, 53, 79
- Kushwaha et al. (2016) Kushwaha P., Chandra S., Misra R., Sahayanathan S., Singh K. P., Baliyan K. S., 2016, ApJ, 822, L13
- Kushwaha et al. (2018) Kushwaha P., et al., 2018, MNRAS, 473, 1145
- Kushwaha et al. (2014) Kushwaha, P., Sahayanathan, S., Lekshmi, R., et al. 2014, MNRAS, 442, 131
- Kushwaha, Sahayanathan, & Singh (2013) Kushwaha P., Sahayanathan S., Singh K. P., 2013, MNRAS, 433, 2380
- Kushwaha, Singh, & Sahayanathan (2014) Kushwaha P., Singh K. P., Sahayanathan S., 2014, ApJ, 796, 61
- Kushwaha et al. (2017) Kushwaha, P., Sinha, A., Misra, R., Singh, K. P., & de Gouveia Dal Pino, E. M. 2017, ApJ, 849, 138
- Larionov et al. (2008) Larionov V. M., et al. 2008, A&A, 492, 389
- Lehto & Valtonen (1996) Lehto H. J., Valtonen M. J., 1996, ApJ, 460, 207
- Liu, Zhao, & Wu (2006) Liu F. K., Zhao G., Wu X.-B., 2006, ApJ, 650, 749
- Marscher & Gear (1985) Marscher A. P., Gear W. K., 1985, ApJ, 298, 114
- Marscher & Jorstad (2011) Marscher A. P., Jorstad S. G., 2011, ApJ, 729, 26
- Matveyenko & Sivakon’ (2017) Matveyenko L. I., Sivakon’ S. S., 2017, AstL, 43, 796
- Moór et al. (2011) Moór A., Frey S., Lambert S. B., Titov O. A., Bakos J., 2011, AJ, 141, 178
- Moretti et al. (2005) Moretti A., et al., 2005, SPIE, 5898, 360
- Mücke et al. (2003) Mücke A., Protheroe R. J., Engel R., Rachen J. P., Stanev T., 2003, APh, 18, 593
- Nilsson et al. (2010) Nilsson K., Takalo L. O., Lehto H. J., Sillanpää A., 2010, A&A, 516, A60
- O’Brien (2017) O’Brien S., 2017, arXiv, arXiv:1708.02160
- Padovani & Giommi (1995) Padovani P., Giommi P., 1995, ApJ, 444, 567
- Pihajoki (2016) Pihajoki P., 2016, MNRAS, 457, 1145
- Pihajoki et al. (2013) Pihajoki P., et al., 2013, ApJ, 764, 5
- Pihajoki, Valtonen, & Ciprini (2013) Pihajoki P., Valtonen M., Ciprini S., 2013, MNRAS, 434, 3122
- Rakshit et al. (2017) Rakshit S., Stalin C. S., Muneer S., Neha S., Paliya V. S., 2017, ApJ, 835, 275
- Roming et al. (2009) Roming P. W. A., et al., 2009, ApJ, 690, 163
- Roming et al. (2005) Roming P. W. A., et al., 2005, SSRv, 120, 95
- Sandrinelli et al. (2016) Sandrinelli A., Covino S., Dotti M., Treves A., 2016, AJ, 151, 54
- Sawada-Satoh et al. (2015) Sawada-Satoh S., et al., 2015, PKAS, 30, 429
- Schlafly & Finkbeiner (2011) Schlafly E. F., Finkbeiner D. P., 2011, ApJ, 737, 103
- Seta et al. (2009) Seta H., et al., 2009, PASJ, 61, 1011
- Siejkowski & Wierzcholska (2017) Siejkowski H., Wierzcholska A., 2017, MNRAS, 468, 426
- Sillanpää et al. (1988) Sillanpää A., Haarala S., Valtonen M. J., Sundelius B., Byrd G. G., 1988, ApJ, 325, 628
- Singh, Mizuno, & de Gouveia Dal Pino (2016) Singh C. B., Mizuno Y., de Gouveia Dal Pino E. M., 2016, ApJ, 824, 48
- Smith et al. (2009) Smith P. S., Montiel E., Rightley S., Turner J., Schmidt G. D., Jannuzi B. T., 2009, 2009 Fermi Symposium, eConf Proc. C091122: arXiv:0912.3621
- Stetson (1987) Stetson P. B., 1987, PASP, 99, 191
- Stetson (1992) Stetson P. B., 1992, ASPC, 25, 297
- Tateyama (2013) Tateyama C. E., 2013, ApJS, 205, 15
- Tateyama & Kingham (2004) Tateyama C. E., Kingham K. A., 2004, ApJ, 608, 149
- Urry & Padovani (1995) Urry C. M., Padovani P., 1995, PASP, 107, 803
- Valtonen et al. (2010) Valtonen M. J., et al., 2010, ApJ, 709, 725
- Valtonen et al. (2017) Valtonen M., et al., 2017, Galax, 5, 83
- Valtonen et al. (2016) Valtonen M. J., et al., 2016, ApJ, 819, L37
- Villforth et al. (2010) Villforth C., et al., 2010, MNRAS, 402, 2087
- Wu et al. (2006) Wu J., et al., 2006, AJ, 132, 1256