White dwarf-main sequence binaries from LAMOST: the DR5 catalogue
Abstract
We present the data release (DR) 5 catalogue of white dwarf-main sequence (WDMS) binaries from the Large Area Multi-Object fiber Spectroscopic Telescope (LAMOST). The catalogue contains 876 WDMS binaries, of which 757 are additions to our previous LAMOST DR1 sample and 357 are systems that have not been published before. We also describe a LAMOST-dedicated survey that aims at obtaining spectra of photometrically-selected WDMS binaries from the Sloan Digital Sky Survey (SDSS) that are expected to contain cool white dwarfs and/or early type M dwarf companions. This is a population under-represented in previous SDSS WDMS binary catalogues. We determine the stellar parameters (white dwarf effective temperatures, surface gravities and masses, and M dwarf spectral types) of the LAMOST DR5 WDMS binaries and make use of the parameter distributions to analyse the properties of the sample. We find that, despite our efforts, systems containing cool white dwarfs remain under-represented. Moreover, we make use of LAMOST DR5 and SDSS DR14 (when available) spectra to measure the Na I 8183.27, 8194.81 absorption doublet and/or emission radial velocities of our systems. This allows identifying 128 binaries displaying significant radial velocity variations, 76 of which are new. Finally, we cross-match our catalogue with the Catalina Surveys and identify 57 systems displaying light curve variations. These include 16 eclipsing systems, two of which are new, and nine binaries that are new eclipsing candidates. We calculate periodograms from the photometric data and measure (estimate) the orbital periods of 30 (15) WDMS binaries.
keywords:
binaries: close – binaries: spectroscopic – white dwarfs – stars: low-mass1 Introduction
Detached binary stars containing a white dwarf (WD) primary and a main sequence companion star are referred to as WD-main sequence (WDMS) binaries. Depending on the orbital separations of the main sequence binaries from which they descend, the previous evolution of WDMS binaries follows two main different paths. Thus, in approximately 75 per cent of the cases the orbital separations are wide enough for the WD precursors to evolve as single stars (de Kool, 1992; Willems & Kolb, 2004). In the remaining cases the main sequence binary components are close enough for the systems to experience dynamically unstable mass transfer interactions when the more massive star evolves into a red giant or asymptotic giant. This generally results in a common envelope (CE) phase (Iben & Livio, 1993; Webbink, 2008) in which friction of the binary components with the material of the envelope leads to a dramatic decrease of the binary separation. The orbital energy released during this process is used to eventually expel the envelope (Passy et al., 2012; Ricker & Taam, 2012). Close WDMS binaries that evolve through a CE phase are known as post-CE binaries or PCEBs. Whilst, stricly speaking, a PCEB refers to any type of binary that evolved through CE evolution – e.g. hot subdwarf B stars with close low-mass main sequence companions (Han et al., 2002, 2003; Heber, 2016) – in this work we will only consider a PCEB as a close WDMS binary.
The orbital period distribution of WDMS binaries is bi-modal. Numerical simulations predict the orbital periods of wide systems that did not evolve through a CE to range between a few hundred to several thousand days (Willems & Kolb, 2004; Camacho et al., 2014; Cojocaru et al., 2017). This is observationally confirmed by Farihi et al. (2010). The observed PCEB orbital period distribution displays a clear concentration of systems at 8 h (Miszalski et al., 2009; Nebot Gómez-Morán et al., 2011), although PCEBs with periods as long as 10 days have been also identified (e.g. Rebassa-Mansergas et al., 2012b).
After the CE phase, PCEBs evolve to even shorter orbital periods through angular momentum loss driven by magnetic braking and/or gravitational wave emission. Therefore, they may undergo a second phase of CE evolution, leading to double-degenerate WDs (Rebassa-Mansergas et al., 2017; Breedt et al., 2017; Kilic et al., 2017), or enter a semidetached state and become cataclysmic variables (Gänsicke et al., 2009; Pala et al., 2017) or super-soft X-ray sources (Parsons et al., 2015b). Double degenerate WDs, cataclysmic variables and super-soft X-ray sources are considered to be possible progenitors of type Ia supernova (Langer et al., 2000; Han & Podsiadlowski, 2004; Wang et al., 2010; Wang & Han, 2012), which are of important interest for cosmological studies.
Thanks to the Sloan Digital Sky Survey (SDSS; York et al., 2000; Stoughton et al., 2002) the number of spectroscopically confirmed WDMS binaries has dramatically increased during the last decade (Silvestri et al., 2006; Rebassa-Mansergas et al., 2007; Heller et al., 2009; Rebassa-Mansergas et al., 2010; Rebassa-Mansergas et al., 2012a; Liu et al., 2012; Rebassa-Mansergas et al., 2013b; Li et al., 2014; Rebassa-Mansergas et al., 2016a). Thus, the current most updated SDSS WDMS catalogue includes 3 294 binaries111https://sdss-wdms.org/, which is by far the largest and most homogeneous sample of compact binaries in the literature (Rebassa-Mansergas et al., 2016a). Among the 3 294 SDSS WDMS, observational follow-up studies have resulted in the identification of 1000 wide binaries that did not interact and more than 200 PCEBs (Rebassa-Mansergas et al., 2007; Schreiber et al., 2008, 2010; Rebassa-Mansergas et al., 2011; Rebassa-Mansergas et al., 2016a), of which 90 have available orbital periods (Rebassa-Mansergas et al., 2008; Nebot Gómez-Morán et al., 2011; Rebassa-Mansergas et al., 2012b) and 71 are eclipsing (Nebot Gómez-Morán et al., 2009; Pyrzas et al., 2009, 2012; Parsons et al., 2013a, 2015a).
The superb sample of SDSS WDMS binaries has led to many and diverse advances in the field of astrophysics. Among these we emphasise the following: providing constraints on theories of CE evolution (Davis et al., 2010; Zorotovic et al., 2010; De Marco et al., 2011), analysing the Galactic properties of WDMS binaries through population synthesis studies aimed at reproducing the ensemble properties of the observed population (Toonen & Nelemans, 2013; Camacho et al., 2014; Zorotovic et al., 2014; Cojocaru et al., 2017), testing the age-metallicity relation in the solar neighbourhood (Rebassa-Mansergas et al., 2016b), identifying pulsating low-mass WDs in detached WDMS binaries (Pyrzas et al., 2015), providing evidence for disrupted magnetic braking (Schreiber et al., 2010; Zorotovic et al., 2016), studying the origin of low-mass WDs (Rebassa-Mansergas et al., 2011), investigating the age-rotation-activity relation of low-mass M stars (Rebassa-Mansergas et al., 2013a; Skinner et al., 2017), constraining the critical binary star separation for a planetary system origin of WD pollution (Veras et al., 2018), testing the mass-radius relation of low-mass main sequence stars and WDs (Parsons et al., 2012a, b, 2017) and investigating the origin of circumbinary giant planets around PCEBs (Zorotovic & Schreiber, 2013; Marsh et al., 2014; Parsons et al., 2014; Schleicher et al., 2015; Bours et al., 2016).
However, despite the importance of the SDSS WDMS binary sample, it is important to emphasise that it suffers from serious selection effects (Rebassa-Mansergas et al., 2016a). This is because the SDSS focused mainly on spectroscopic observations of quasars and galaxies, which overlap in colour space with hot WDs (Richards et al., 2002; Smolčić et al., 2004). Hence, WDMS containing cool WDs and early-type companions are under-represented. In order to overcome this issue, Rebassa-Mansergas et al. (2012a) presented a dedicated survey within SEGUE (The Sloan Extension for Galactic Understanding and Exploration; Yanny et al., 2009) that obtained spectra for 291 WDMS binaries containing cool WDs and/or early type companions. Moreover, Rebassa-Mansergas et al. (2013b) photometrically selected 3419 WDMS candidates for containing cool WDs.
The Large sky Area Multi-Object fiber Spectroscopic Telescope (LAMOST) survey is a large-scale spectroscopic survey which follows completely different target selection algorithms than SDSS, hence opening the possibility for identifying WDMS binaries that help in overcoming the selection effects of the SDSS sample. Ren et al. (2013); Ren et al. (2014) identified a total of 121 LAMOST WDMS binaries from the data release (DR) 1 of LAMOST (Luo et al., 2012). They found that the intrinsic properties of the LAMOST WDMS binary sample were different from those of the SDSS population. In particular, LAMOST WDMS binaries are found at considerably shorter distances and are dominated by systems containing early-type companions and hot WDs (Ren et al., 2014). LAMOST WDMS thus represent an important addition to the current known spectroscopic catalogue of SDSS WDMS binaries. However, the number of WDMS containing cool WDs remains still under-represented, and the number of LAMOST WDMS binaries identified so far is rather small.
Here we present an updated LAMOST WDMS binary catalogue based on the most recent DR of LAMOST – DR5, to thus increase the current small number of LAMOST WDMS binaries. Moreover, we present a dedicated LAMOST survey for obtaining spectra of as many as possible photometrically selected SDSS WDMS binaries from Rebassa-Mansergas et al. (2013b) that presumably contain cool WDs. We measure the stellar parameters from the LAMOST spectra of all our identified objects and perform a statistical analysis of their intrinsic properties. We also determine the radial velocities (RVs) of each binary with the aim of detecting PCEBs. Finally, we cross-match our sample with photometric data from the Catalina Sky Survey (CSS) and Catalina Real Time Transient Survey (CRTS; Drake et al., 2009) in order to search for WDMS binaries displaying light curve variations (e.g. eclipsing systems).
2 The DR5 of LAMOST
LAMOST is a quasi-meridian reflecting Schmidt telescope of 4 meter effective aperture and a field of view of 5 degrees in diameter (Wang et al., 1996; Su et al., 2004; Cui et al., 2012). LAMOST is located in Xinglong station of National Astronomical Observatories of Chinese Academy of Sciences. Being a dedicated large-scale survey telescope, LAMOST uses 4 000 fibres to obtain spectra of celestial objects as well as sky background and calibration sources in one single exposure. To that end, LAMOST uses 16 fiber-fed spectrographs each accommodating 250 fibers. Each spectrograph is equipped with two CCD cameras of blue and red channels that simultaneously provide blue and red spectra of the 4 000 selected targets, respectively. The LAMOST spectra cover the entire optical wavelength range ( 3700 – 9000Å) at a resolving power 1800.
From 2012 September, LAMOST has been carrying out a five-year Regular Survey. Before that, there was a one-year Pilot Survey preceded by a two-year commissioning phase. The LAMOST Regular Survey consists of two components (Zhao et al., 2012): the LAMOST Extra-Galactic Survey of galaxies (LEGAS) that aims at studying the large scale structure of the universe, and the LAMOST Experiment for Galactic Understanding and Exploration (LEGUE) that aims at obtaining millions of stellar spectra in order to study the structure and evolution of the Milky Way (Deng et al., 2012). LEGUE is sub-divided into three sub-surveys: the spheroid, the anticentre (Liu et al., 2014; Yuan et al., 2015; Xiang et al., 2017) and the disc surveys. The five-year Regular Survey finished in June 16th 2017 and the spectra have been released internally to the Chinese scientific community through the DR5 of LAMOST222http://dr5.lamost.org/. The raw spectra are processed with the LAMOST two-dimensional (2D) pipeline (Luo et al., 2012, 2015), which includes dark and bias subtractions, cosmic ray removal, one-dimensional (1D) spectral extraction, merging sub-exposures (note that each plate is generally observed consecutively for a minimum of three times), and finally, splicing the sub-spectra from the blue- and red channels of the spectrographs, respectively. The LAMOST 1D pipeline is then carried out to perform spectral classification and to measure the redshift (or radial velocity) of each spectrum. There are 4 119 plates observed in LAMOST DR5, thus including a total of 8 952 297 spectra, of which 7 930 178 are stars, 152 608 are galaxies, 50 132 are quasars, and 819 379 are classified as unknowns.
3 The LAMOST DR5 WDMS binary catalogue
In this section we describe how we identify WDMS binaries within LAMOST DR5 and we estimate the completeness of the sample.
3.1 Identification of WDMS binaries
In Ren et al. (2014) we developed a fast and efficient routine based on the wavelet transform (WT; Chui, 1992) to identify WDMS binaries from LAMOST DR1. The analysis unit of the WT is the local flux of the spectrum, i.e. the selected spectral features. In other words, the WT recognises the spectral features rather than the global continuum of a given spectrum. This is done by decomposing a considered spectral range (covering the desired spectral features) into approximation signals, often referred to as approximation coefficients. The wavelength values under the considered spectral region are converted into data points. This decomposition process can be iterated by decomposing the approximation coefficients into successive approximation coefficients (thus reducing by half the number of data points in each iteration) until the decomposition level is satisfactory. This occurs when the spectral features of a WDMS binary spectrum can be identified in the approximation coefficients as compared to a non-WDMS binary spectrum in which the approximation coefficients are dominated by continuum emission and/or by spectral features different from those of WDMS binaries. The outcome of a WT can be hence considered as a smoothed version of the spectrum (for comparative purposes). Because of its high efficiency in identifying spectral features, the WT is very suitable to identify WDMS binaries among low signal-to-noise (SN) ratio spectra.
| Jname | fWT | fPhot | fSDSS | fCAND | fDR1 | RA | Dec | u | Err | g | Err | r | Err | i | Err | z | Err |
|---|---|---|---|---|---|---|---|---|---|---|---|---|---|---|---|---|---|
| (∘) | (∘) | (mag) | (mag) | (mag) | (mag) | (mag) | (mag) | (mag) | (mag) | (mag) | (mag) | ||||||
| J000448.23+343627.4 | 1 | 0 | 0 | 0 | 00 | 1.2009999 | 34.6076320 | ||||||||||
| J000612.32+340358.3 | 1 | 1 | 0 | 0 | 00 | 1.5513397 | 34.0661980 | 18.954 | 0.029 | 18.327 | 0.008 | 17.794 | 0.008 | 16.535 | 0.005 | 15.713 | 0.007 |
| J000729.32+023124.5 | 1 | 0 | 0 | 0 | 00 | 1.8721920 | 2.5234990 | 19.912 | 0.042 | 19.092 | 0.010 | 18.379 | 0.008 | 17.494 | 0.007 | 16.937 | 0.011 |
| J001258.26+062617.9 | 1 | 0 | 0 | 0 | 00 | 3.2427542 | 6.4383056 | 18.505 | 0.016 | 17.987 | 0.006 | 18.001 | 0.007 | 17.528 | 0.007 | 17.088 | 0.011 |
| J001733.59+004030.4 | 1 | 0 | 1 | 0 | 00 | 4.3899705 | 0.6751216 | 20.200 | 0.051 | 19.517 | 0.014 | 18.982 | 0.013 | 17.925 | 0.009 | 17.166 | 0.014 |
| J001752.63+332424.9 | 1 | 1 | 0 | 0 | 00 | 4.4693105 | 33.4069250 | 18.582 | 0.015 | 17.625 | 0.005 | 16.519 | 0.004 | 15.616 | 0.004 | 15.069 | 0.005 |
| J001752.63+332424.9 | 1 | 1 | 0 | 0 | 00 | 4.4693105 | 33.4069250 | 18.582 | 0.015 | 17.625 | 0.005 | 16.519 | 0.004 | 15.616 | 0.004 | 15.069 | 0.005 |
| J002237.90+334322.1 | 1 | 0 | 0 | 0 | 10 | 5.6579420 | 33.7228090 | 19.548 | 0.033 | 17.361 | 0.005 | 15.985 | 0.003 | 14.590 | 0.004 | 13.858 | 0.004 |
| J002407.31+054856.4 | 1 | 1 | 0 | 0 | 00 | 6.0304700 | 5.8156830 | 17.068 | 0.008 | 16.393 | 0.004 | 15.851 | 0.004 | 14.808 | 0.004 | 14.128 | 0.004 |
| J002633.13+390904.0 | 1 | 1 | 0 | 0 | 00 | 6.6380824 | 39.1511210 | 16.348 | 0.006 | 15.905 | 0.003 | 16.011 | 0.004 | 15.831 | 0.004 | 15.327 | 0.005 |
| J002633.14+390904.0 | 1 | 1 | 0 | 0 | 00 | 6.6385030 | 39.1508170 | 16.348 | 0.006 | 15.905 | 0.003 | 16.011 | 0.004 | 15.831 | 0.004 | 15.327 | 0.005 |
| MJD | Plate | spID | fiberID | SNu | SNg | SNr | SNi | SNz | WD | Err | WD | Err | Err | Sp | Simbad | |
|---|---|---|---|---|---|---|---|---|---|---|---|---|---|---|---|---|
| (K) | (K) | (dex) | (dex) | (M☉) | (M☉) | |||||||||||
| 56948 | M31001N35M2 | 05 | 156 | 8.66 | 33.80 | 30.05 | 49.00 | 32.49 | 16717 | 245 | 8.02 | 0.06 | 0.63 | 0.03 | 4 | |
| 56948 | M31001N35M2 | 01 | 139 | 3.92 | 12.66 | 22.09 | 47.00 | 50.04 | 28389 | 1448 | 7.87 | 0.23 | 0.58 | 0.11 | 4 | |
| 55893 | F9302 | 01 | 235 | 1.72 | 2.52 | 4.11 | 7.63 | 6.58 | 1 | |||||||
| 56602 | EG001605N080655M01 | 02 | 066 | 1.52 | 3.01 | 2.25 | 3.48 | 3.23 | 4 | |||||||
| 56978 | EG001639N015102M01 | 05 | 141 | 1.52 | 5.07 | 7.31 | 16.86 | 14.32 | 3 | DA+dM | ||||||
| 56952 | M31005N35M1 | 02 | 120 | 2.44 | 13.88 | 35.84 | 71.58 | 60.63 | 1 | |||||||
| 57717 | M31007N33B2 | 10 | 109 | 3.66 | 16.36 | 34.31 | 71.88 | 63.27 | 29727 | 1312 | 8.34 | 0.25 | 0.82 | 0.14 | 2 | |
| 56255 | VB007N33V1 | 03 | 085 | 2.23 | 3.49 | 2.78 | 1.72 | 3.15 | DA+M | |||||||
| 56621 | EG002616N034932B01 | 11 | 020 | 8.25 | 27.85 | 40.10 | 86.82 | 82.41 | 14899 | 395 | 8.41 | 0.08 | 0.85 | 0.05 | 3 | |
| 57280 | M31007N36M1 | 11 | 163 | 1.80 | 3.81 | 4.02 | 4.78 | 4.40 | 9 | DA4.6 | ||||||
| 56911 | HD002951N381926B01 | 15 | 227 | 4.28 | 9.16 | 5.54 | 4.01 | 3.84 | DA4.6 |
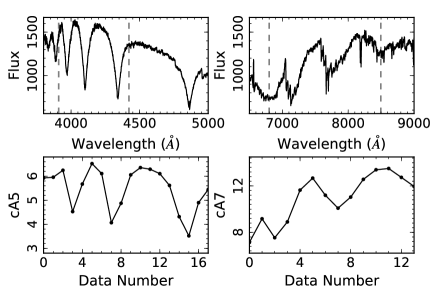
WDMS binaries containing a DA (hydrogen-rich) WD and a low-mass main sequence star have two obvious spectral features: the Balmer lines in the blue band arising from the WD and the molecular absorption bands in the red that are typical of M dwarfs. We hence applied the WT to the following spectral regions: the 3910–4422Å range in the blue band that covers the H to H Balmer lines and the 6800–8496Å range which covers a large number of TiO and VO molecular bands. By choosing these two spectral features we focus our search on the identification of WDMS binaries containing a DA WD and a M dwarf companion (hereafter DA/M binaries; see an example of WT applied to a DA/M binary in Figure 1). The main reason for this choice is that DA/M are by far the most common among WDMS binaries, including 80 per cent of all systems (Rebassa-Mansergas et al., 2016a). This is because of the following two reasons. First, DA WDs comprise 80 per cent of all single WDs (Kepler et al., 2015), hence it is not surprising that they are the most common WDs in binaries too. Second, because of selection effects, main sequence stars of spectral type earlier than M generally outshine the WDs in the optical, which implies only a handful of WDs with late K-type companions have been identified (Rebassa-Mansergas et al., 2016a). We will pursue the identification of LAMOST WDMS binaries harboring other WD types (DB, DQ, DZ, etc) as well as late K-type companions elsewhere. Of course, in order for our WT to efficiently identify DA/M binaries we require the two components (DA WD plus M dwarf) to be visible in the spectrum. This implies that systems in which one of the two components clearly dominates the spectral energy distribution will be harder (or even impossible) to detect. We note however that this issue makes the detection of such systems to be very difficult by any method (see for example Rebassa-Mansergas et al., 2010).
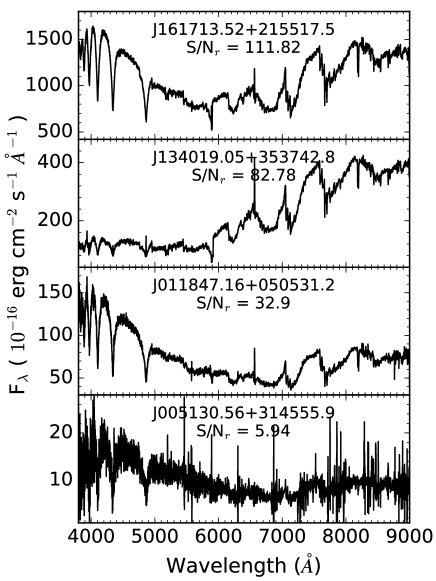
After applying the WT method to the 9 million LAMOST DR5 spectra, we obtained an initial list of 29 269 WDMS binary candidate spectra that we visually inspected. This resulted in 776 spectra (579 unique systems) that we considered as genuine DA/M binaries, and 47 spectra (46 unique systems) that we catalogued as DA/M candidates. The majority of spectra selected by the WT that we did not consider DA/M binaries corresponded to single MS stars and to the superposition in the line of sight of two main sequence stars. Table 1 lists all the genuine and candidate DA/M binaries identified by the WT, where we also include LAMOST spectroscopic identifiers and modified Julian dates of the observations. In Figure 2 we show four example spectra of LAMOST DA/M binaries of different SN ratio.
3.2 Completeness of the LAMOST DR5 DA/M binary sample
In Ren et al. (2014) we showed the WT method is highly efficient (90 per cent) in identifying DA/M binaries and that the spectra it fails to identify are either clearly dominated by one of the stellar components and/or are associated to very low SN ratio (). In order to estimate the completeness of the LAMOST DR5 DA/M binary catalogue (i.e. the number of DA/M binaries observed by LAMOST that the WT successfully identified), we cross-matched the entire 9 million spectroscopic data base of LAMOST with the SDSS DR12 spectroscopic catalogue of WDMS binaries. We found 447 objects in common (583 LAMOST spectra).
111 (153 spectra) of the 447 objects (583 spectra) were non-DA/M binaries that the WT failed to identify for obvious reasons: the spectral features of these WDMS binaries were different from those of DA/M binaries. In order to compile a catalogue as complete as possible, we added the 111 objects (105 genuine WDMS, 143 spectra; 6 WDMS binary candidates, 7 spectra) to our list.
The remaining 330 systems were DA/M binaries (424 spectra), 233 (312 spectra) of which were identified by the WT and 97 (112 spectra) were missed. This translated into a completeness of 70 per cent, a value which is considerably lower than the 90 per cent claimed by Ren et al. (2014). We repeated the exercise excluding all spectra of SN ratio below 5 and found the number of DA/M binaries identified and missed by the WT were 156 (188 spectra) and 37 (42 spectra), respectively, i.e. a completeness of 80 per cent. We visually inspected the 42 missed spectra and realised that 19 of them were clearly dominated by the flux contribution of the WD and 15 by the flux contribution of the M dwarf. We also found 5 broken spectra. Excluding the broken spectra and those dominated by one of the stellar components, the completeness increased to 98 per cent. We added the 97 objects (93 genuine WDMS, 108 spectra; 4 candidate WDMS, 4 spectra) the WT missed to our list of LAMOST DR5 WDMS binaries.
We conclude the WT is highly efficient at identifying DA/M binaries and that the LAMOST DR5 DA/M binary catalogue is 98 per cent complete. However, the completeness drops to 70 per cent when considering spectra clearly dominated by the flux contribution of one of the stellar components and/or spectra of very low SN ratio (5). Unfortunately, identifying DA/M binary spectra of such characteristics is challenging for any method (Rebassa-Mansergas et al., 2010).
4 A dedicated LAMOST survey of photometrically selected SDSS WDMS binaries
The spectroscopic catalogue of SDSS WDMS binaries is severely biased against systems containing cool WDs and/or early type companions. This is mainly because SDSS dedicated most of its efforts to obtain spectra of quasars and galaxies, which overlap in colour space with WDMS binaries containing hot (10 000–15 000 K) WDs and/or late type (M3–4) companions. In order to overcome this selection effect, Rebassa-Mansergas et al. (2013b) developed a colour selection criteria that combines optical (SDSS ) plus infrared (UKIRT Infrared Sky Survey , Two Micron All Sky Survey and/or Wide-Field Infrared Survey Explorer ) magnitudes to photometrically select 3 419 WDMS binary candidates for harboring cool WDs and/or dominant (M dwarf) companions in their spectra. Visual inspection of 567 photometric candidates with available SDSS spectra allowed Rebassa-Mansergas et al. (2013b) to conclude that 84 per cent of entire the photometric sample are expected to be genuine WDMS binaries, and that 71 per cent should contain WDs of effective temperatures below 10 000–15 000 K and M dwarf companions of spectral types concentrated at M2–3.
In this section we present a dedicated LAMOST survey that so far has obtained spectra of 622 photometrically selected SDSS WDMS binaries.
4.1 The LAMOST observations
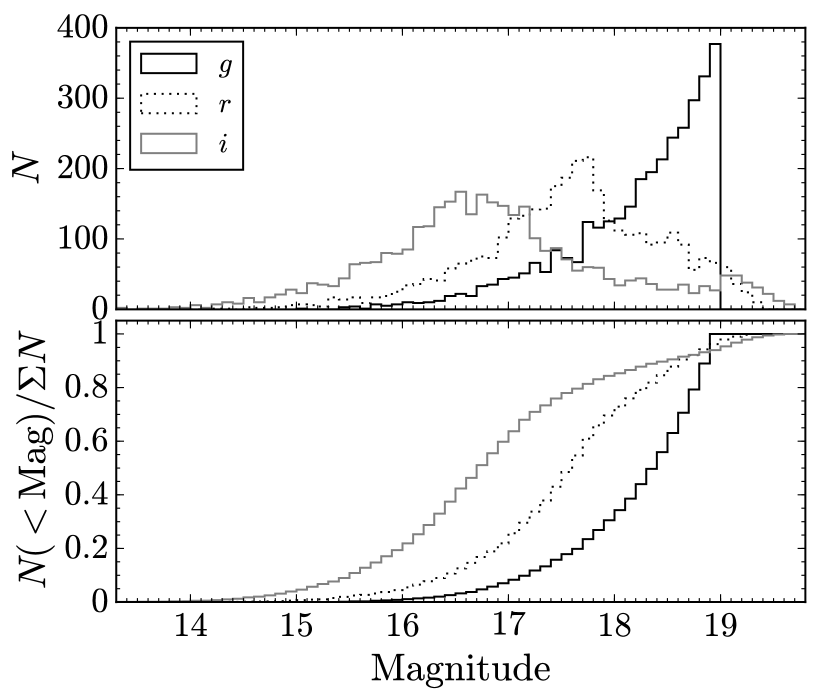
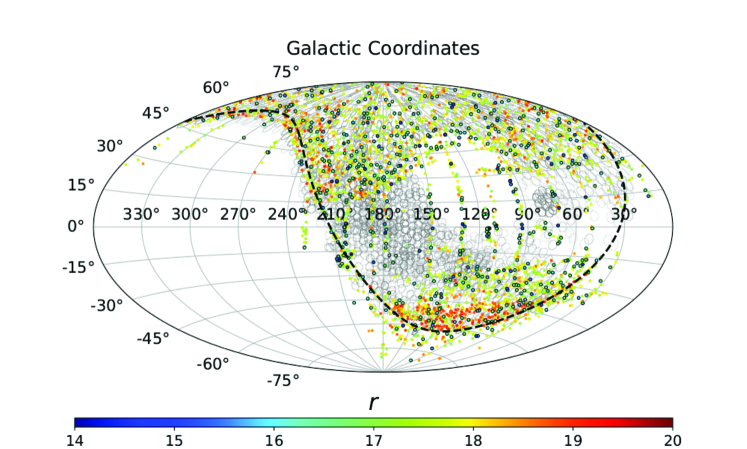
Since 2014, the LAMOST target selection algorithm has incorporated the photometrically selected WDMS binary list of Rebassa-Mansergas et al. (2013b) with the aim of obtaining as many WDMS binary spectra as possible. As mentioned in Luo et al. (2015), the LAMOST observations are carried out using four different modes, i.e. the selected objects are observed using different plates according to their magnitudes: very bright plates (VB, 14 mag), bright plates (B, 14 mag 16.8 mag), medium-bright plates (M, 16.8 mag 17.8 mag) and faint plates (F, 17.8 mag). LAMOST DR5 has made use of 4 000 plates, of which 80 per cent are VB/B plates (46 per cent are VB plates), i.e. most of the observed targets have magnitudes below 16.8. Fig 3 shows the magnitude distribution of the 3 419 photometrically selected WDMS binaries of Rebassa-Mansergas et al. (2013b), where one can clearly see the number of systems with 16.8 mag is low (17 per cent). Moreover, it is important to emphasize that, on occasions, the coordinates of the LAMOST plates and the WDMS binaries do not overlap (see Fig 4). Overall, this implies that only a small fraction of photometrically selected WDMS binaries has been so far observed by LAMOST.
4.2 The success rate of the SDSS photometric sample
The LAMOST observations above described resulted in a total number of 872 spectra of 622 unique sources from the Rebassa-Mansergas et al. (2013b)’s list. We visually inspected the spectra and identified 298 genuine WDMS binaries (436 spectra) and 41 (57 spectra) that we considered as WDMS binary candidates. The remaining sources were cataclysmic variables (7; 13 spectra), single M dwarfs (161; 214 spectra), quasars (23; 36 spectra), main sequence stars (16; 26 spectra), single WDs (4; 4 spectra), main sequence plus main sequence superpositions (11; 20 spectra), and unknown objects due to the bad quality of their spectra (61; 66 spectra).
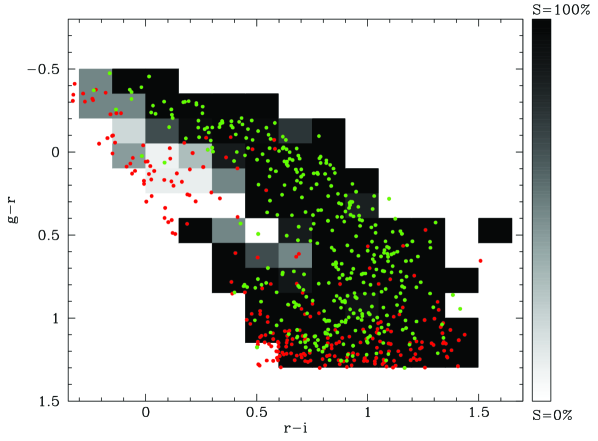
If we exclude the 61 unknown sources we find that 60 per cent of the photometric candidates are indeed genuine WDMS binaries or WDMS binary candidates. This value is low compared to the 84 per cent of success rate claimed by Rebassa-Mansergas et al. (2013b) for the same sample. However, it is important to emphasise that Rebassa-Mansergas et al. (2013b) showed the success rate varies from 40 per cent up to 100 per cent depending on colour space and that the 84 per cent value represents an average success rate over the entire colour space. This can clearly be seen in Figure 5, where we illustrate the success rate in form of a density map in the vs. colour space. In this figure we also show the location of the genuine WDMS binaries observed by LAMOST DR5 (green solid dots) and those that we consider contaminants (i.e. non WDMS binaries). It becomes obvious that the contaminants are either located in areas of expected low success rate or concentrated at 1. At such red colours the WD contribution in the optical spectrum is expected to be rather low, which makes it difficult to judge simply by eye whether or not these objects are real WDMS binaries or single MS stars. Our visual inspection decided for the latter, although the former cannot be ruled out.
We checked how many of the 298 genuine WDMS binaries identified in this section were also found by the WT and realised that only 30 objects (a total of 49 spectra) were missing. We made use of this result to derive (in an alternative way) the completeness of the LAMOST DR5 WDMS binary catalogue, which results in this case in 90 per cent. This value is slightly lower than the 98 per cent we obtained before (see Section 3.2), however it confirms the WT is an efficient tool to identify WDMS binaries among large spectroscopic samples. We also found that 37 (52 spectra) of the 41 (57 spectra) WDMS binary candidates were not identified by the WT. Visual inspection revealed most of these candidate spectra were dominated by the flux of the M dwarf, some were broken, and others were of low SN ratio. Hence, it is not surprising that the WT was not successful at identifying these spectra.
Among the 30 objects the WT missed (49 spectra), 14 (25 spectra) were found cross-matching the entire LAMOST data base with the SDSS DR12 WDMS binary catalogue (see Section 3.2). Hence, we added to our list the remaining 16 WDMS binaries (24 spectra). In the same way, among the 37 WDMS binary candidates (52 spectra) the WT missed, 10 (11 spectra) were identified in Section 3.2. Thus, we added the remaining 27 (41 spectra) WDMS binary candidates to our LAMOST DR5 catalogue.
5 The final catalogue of LAMOST DR5 WDMS binaries
The WT identified 579 genuine (776 spectra) and 46 candidate (47 spectra) WDMS binaries (Section 3.1). To this list we added 97 (112 spectra) DA/M binaries (93 genuine binaries, 108 spectra; 4 candidates, 4 spectra) and 111 (150 spectra) non DA/M binaries (105 genuine non DA/M, 143 spectra; 6 non DA/M candidates, 7 spectra) by cross-matching the SDSS DR12 WDMS catalogue with the entire LAMOST spectroscopic data base (Section 3.2). Finally, we added 16 (24 spectra) genuine and 27 (41 spectra) candidate DA/M binaries by visually inspecting the LAMOST spectra of 622 SDSS photometrically selected targets (Section 4). This brings the total number of genuine LAMOST DR5 WDMS binaries to 793 (1 051 spectra) and 83 WDMS binary candidates (99 spectra), i.e. 876 objects and 1150 spectra. The entire catalogue is included in Table 1.
We compared our LAMOST DR5 catalogue to the one we presented in Ren et al. (2014) and found that 119 objects (194 spectra) were already identified in the DR1 of LAMOST. Hence, the DR5 catalogue contains 757 (956 spectra) new entries. Moreover, we found that 400 (509 spectra) objects were already discovered in the SDSS DR12 catalogue of Rebassa-Mansergas et al. (2016a), which implies 357 (447 spectra) are new systems that have not been published before.
6 Characterization of the LAMOST DR5 WDMS binary catalogue
In this section we measure the WD stellar parameters and determine the M dwarf spectral subclass of all DA/M binaries that are part of our new LAMOST DR5 WDMS binary catalogue. We also describe the properties of the new DR5 sample by analysing the parameter distributions.
6.1 Stellar parameter determinations
We determined the stellar parameters following the decomposition/fitting routine described by Rebassa-Mansergas et al. (2007). The first step was to fit the DA/M binary spectrum with a two-component model using a set of observed M dwarf and WD templates, which allowed obtaining the spectral type of the M dwarf. Then, the best-fit M dwarf template was subtracted from the DA/M binary spectrum and the Balmer lines (H to H) of the residual WD spectrum were fitted using a grid of DA WD atmosphere models (Koester, 2010) to derive the WD effective temperature () and surface gravity (). Given that the equivalent widths of the Balmer lines reach a maximum near = 13 000 K (with the exact value being a function of ), the and determined from Balmer line profile fits are subject to a degeneracy. That is, fits of similar quality can be achieved on either side of the temperature at which the maximum equivalent width is occurring. We broke this degeneracy fitting the entire WD residual spectrum (continuum plus Balmer lines).
It has been shown that one-dimensional WD model atmosphere spectra such as those used in this work yield overestimated values for WDs of effective temperatures below 12 000 K (Koester et al., 2009; Tremblay et al., 2011). Therefore, we applied the corrections of Tremblay et al. (2013), which are based on three-dimensional WD model atmosphere spectra, to our WD parameter determinations. We then interpolated the and values in the cooling sequences of Renedo et al. (2010) to derive the WD masses. In cases where more than one spectrum per target were available we averaged the stellar parameters (namely the , and mass of the WD and the spectral type of the M dwarf). The stellar parameters are provided in Table 1 for each individual spectrum.

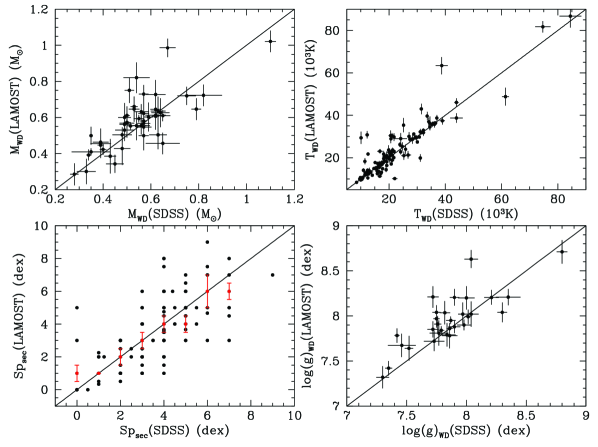
Given that a large number of LAMOST DA/M binaries have also been observed by SDSS, we decided to compare the stellar parameters determined here with those obtained fitting the SDSS spectra. We note that we applied the same fitting routine to both the LAMOST and SDSS spectra. The result can be seen in Figure 6, where we display only WDs with relative error in their effective temperatures below 10 per cent (128 objects), and absolute errors below 0.15 dex (in ; 30 objects) and 0.1 M⊙ (in mass; 50 objects). Moreover, we only took into account DA/M binaries with available M dwarf spectral subclasses (318 objects). Visual inspection reveals the WD parameters are broadly consistent with each other. Quantitatively, if we define (Gentile Fusillo et al., 2015):
| (1) |
then we find that the WD parameters show a comparable agreement ( 2) in 70 (), 77 () and 82 (mass) per cent of the cases. We can conclude then that the WD parameters derived using LAMOST and SDSS spectra are indeed broadly in agreement.
Visual comparison of the M dwarf spectral subclasses obtained fitting the SDSS and LAMOST spectra (bottom left panel of Figure 6) seems to indicate a large spread of values for a given spectral subtype. However, only in 12 of the 318 cases considered the difference in spectral subtypes is larger than 2, and in 49 cases larger than 1. We visually inspected the LAMOST spectra of these 49 objects and found that they were either dominated by the WD contribution and/or of low SN ratio. These are clear cases in which we expect higher uncertainties in the determination of the M dwarf spectral subclasses. In order to quantitatively study the apparent disagreement further, we obtained the average LAMOST spectral subclass and its standard deviation fixing the SDSS spectral subclasses. The result is shown as red solid dots and red solid lines in the bottom left panel of Figure 6. It becomes clear that, in the majority of cases, the spectral subtypes agree well with each other and that the apparent scatter at a given spectral subtype is caused by isolated cases.
| Sample 1 vs. Sample 2 | Sample 3 vs. Sample 4 | |
|---|---|---|
| WD | 0.09 | 0.35 |
| WD | 0.66 | 0.46 |
| WD mass | 0.40 | 0.09 |
| M dwarf Sp | 0.93 | 0.56 |
6.2 Properties of the LAMOST DA/M binary catalogue
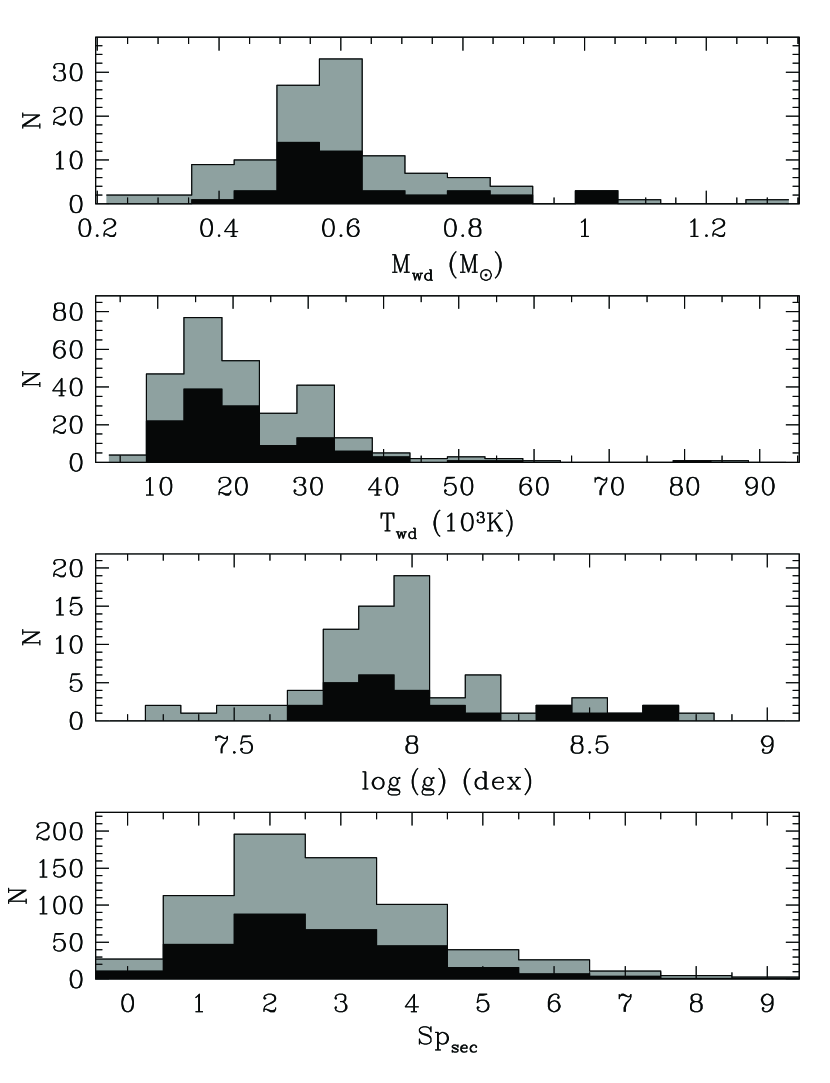
In the previous section we determined the stellar parameters of our LAMOST DR5 DA/M binaries. This allows us to present here the corresponding stellar parameter distributions, which we show in Figure 7 in the following order: WD mass (top panel), WD effective temperature (top-middle panel), WD surface gravity (bottom-middle panel) and M dwarf spectral subtype (bottom panel). Following Section 6.1, and in order to exclude values subject to large uncertainties, we exclude WDs with relative error in their effective temperatures above 10 per cent (we are left with 277 objects in the top-middle panel of Figure 7), and absolute errors above 0.15 dex in (76 objects; middle-bottom panel) and 0.1 M⊙ in mass (116 objects; top panel). In the same way, we only consider DA/M binaries with well-determined M dwarf spectral subclasses (686 objects; bottom panel of Figure 7). Visual inspection of the parameter distributions reveals that the WDs are concentrated at 0.6 (which is equivalent to say they are concentrated at 8 dex), with a steep decline towards higher and lower masses (being the latter WDs that are presumably part of close binaries, see Section 7 for a further discussion) and with typical effective temperature values between 10 000 and 40 000 K (with a peak at 15 000 K). The M dwarf spectral types are concentrated between M1–M4, with a decline towards earlier and later types. For completeness, we also show in Figure 7 the parameter distributions that result from considering only the photometrically-selected SDSS DA/M binary sample that has been observed by LAMOST. We note that we did not include any DA/M binary considered as candidate in this exercise.
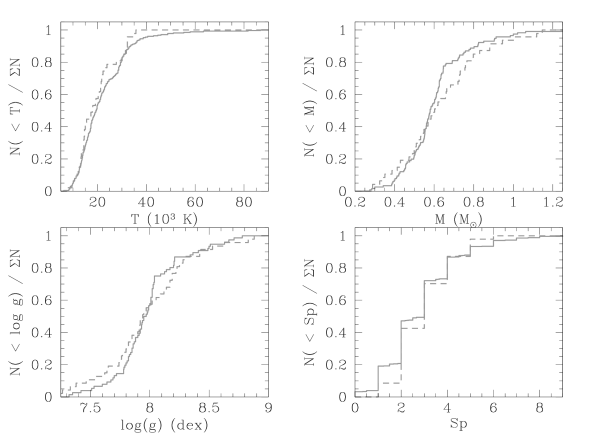
We run Kolmogorov-Smirnov (KS) tests to the WD cumulative parameter distributions and apply a test to the cumulative spectral type distributions resulting from the SDSS photometrically-selected sample and the total sample of LAMOST DR5 DA/M binaries (excluding the SDSS photometrically selected ones). The cumulative distributions are shown in the left panels of Figure 8 and the results are given in Table 2. The probabilities obtained do not seem to indicate the two samples are statistically different, which is what we should expect given that the photometric sample is selected based on colour cuts that favour the detection of systems containing cooler WDs and/or earlier type companions. This may be a consequence of the fact that it is more difficult to derive reliable WD parameters for this type of systems. That is, cooler WDs are systematically fainter and hence their spectra are of lower SN ratio, which translates into larger parameter uncertainties. Hence the objects containing the coolest WDs either cannot be fitted because they are subject to too low SN spectra or the fitted values do not survive our quality cuts and are excluded from the analysis. This, unfortunately, implies that our sample of LAMOST DR5 DA/M binaries with available stellar parameters is still biased against systems containing cool WDs.
We also run KS and tests to the cumulative distributions resulting from the entire LAMOST DR5 DA/M sample and the LAMOST DR1 catalogue we presented in Ren et al. (2014). The distributions are shown in the right panels of Figure 8 and in Table 2 we provide the probabilities. Again, we find no strong indications for the DR1 and DR5 LAMOST populations to be statistically different.
| Jname | HJD | RV(Na I) | Err | RV() | Err | Telescope |
|---|---|---|---|---|---|---|
| (days) | () | () | () | () | ||
| J000448.23+343627.4 | 2456948.07023 | 21.59 | 45.97 | 96.14 | 17.32 | LAMOST |
| J000448.23+343627.4 | 2456948.09106 | 45.61 | 20.86 | 93.60 | 18.83 | LAMOST |
| J000448.23+343627.4 | 2456948.09341 | 43.07 | 15.78 | 62.27 | 24.84 | LAMOST |
| J000448.23+343627.4 | 2456948.11661 | 37.64 | 20.67 | 76.21 | 19.09 | LAMOST |
| J000612.32+340358.3 | 2456948.07026 | 4.35 | 12.62 | 12.92 | 10.50 | LAMOST |
| J000612.32+340358.3 | 2456948.09109 | 39.19 | 12.72 | 14.71 | 10.45 | LAMOST |
| J000612.32+340358.3 | 2456948.09344 | 30.75 | 11.87 | 9.55 | 10.28 | LAMOST |
| J000612.32+340358.3 | 2456948.11664 | 64.64 | 12.63 | 26.05 | 10.43 | LAMOST |
| J000729.32+023124.5 | 2455892.99443 | 14.98 | 14.38 | LAMOST |
| Jname | Flag | RV shift | RV shift | Jname | Flag | RV shift | RV shift | Jname | Flag | RV shift | RV shift |
| (km/s) | (km/s) | (km/s) | (km/s) | (km/s) | (km/s) | ||||||
| Na I | Na I | Na I | |||||||||
| J000612.32+340358.3 | 10 | 68.99 | J093507.99+270049.2 | 11 | 248.88 | 182.41 | J122514.92+292523.1 | 11 | 113.00 | 87.11 | |
| J004751.47+340212.7 | 01 | 70.77 | J093809.28+143036.9 | 11 | 100.51 | 113.59 | J123339.40+135943.2 | 11 | 133.43 | 106.79 | |
| J011739.90+340209.4 | 11 | 177.57 | 158.24 | J094101.91+510719.8 | 01 | 59.05 | J123642.53+580230.6 | 11 | 86.16 | 69.09 | |
| J011847.16+050531.2 | 11 | 155.83 | 100.75 | J095641.79+013130.7 | 01 | 87.01 | J124831.79+435318.3 | 11 | 78.02 | 121.40 | |
| J024924.76+071344.3 | 01 | 118.56 | J101356.31+272410.8 | 11 | 600.06 | 652.14 | J124830.76+540803.6 | 11 | 83.12 | 219.67 | |
| J025301.60013006.8 | 01 | 72.39 | J101616.82+310506.5 | 11 | 114.66 | 66.68 | J132001.24+112805.3 | 10 | 79.95 | ||
| J030944.99+285507.5 | 10 | 58.73 | J103125.93+020751.4 | 11 | 76.84 | 61.33 | J132341.89+541636.5 | 10 | 137.35 | ||
| J032750.32+222618.9 | 10 | 109.05 | J104318.65+305012.9 | 10 | 146.37 | J134051.00+321015.9 | 01 | 127.69 | |||
| J050825.81+252050.8 | 11 | 102.87 | 73.50 | J104534.46+315740.6 | 01 | 80.16 | J135825.68+171204.1 | 11 | 377.78 | 235.72 | |
| J054119.24051838.4 | 11 | 154.71 | 167.96 | J105352.90+340923.5 | 01 | 254.71 | J140115.68+214157.1 | 10 | 49.64 | ||
| J060040.31+312118.6 | 10 | 45.48 | J105657.35+330416.2 | 11 | 102.26 | 68.60 | J142917.86+285103.0 | 10 | 90.38 | ||
| J063840.55+130253.5 | 01 | 101.87 | J110827.40+303031.3 | 01 | 73.91 | J144307.83+340523.5 | 01 | 94.57 | |||
| J073128.30+264353.6 | 11 | 56.08 | 161.49 | J111614.48+535720.9 | 01 | 74.54 | J145248.79+234807.6 | 01 | 54.60 | ||
| J081126.70+053912.9 | 01 | 293.08 | J112007.64+250221.3 | 11 | 193.70 | 204.91 | J145430.02+203902.5 | 11 | 120.18 | 148.83 | |
| J081654.35+354230.6 | 10 | 146.69 | J112124.82+273046.2 | 11 | 256.30 | 252.29 | J151042.63+273509.9 | 10 | 90.99 | ||
| J082214.50+433343.6 | 10 | 98.77 | J113102.81+522645.3 | 01 | 74.78 | J153934.63+092221.5 | 11 | 175.68 | 118.65 | ||
| J082656.51+480545.7 | 11 | 148.67 | 145.12 | J113910.49+315013.1 | 10 | 121.59 | J153914.69+263710.8 | 01 | 290.97 | ||
| J082845.07+133551.6 | 11 | 227.51 | 210.96 | J114732.48+591735.1 | 10 | 60.98 | J154101.07+294829.4 | 11 | 168.15 | 185.74 | |
| J083056.11+315941.9 | 01 | 69.67 | J114732.25+593921.9 | 10 | 106.47 | J160645.02+284725.9 | 11 | 88.25 | 100.14 | ||
| J084418.12+340458.9 | 11 | 122.49 | 105.03 | J115057.60+282637.8 | 11 | 235.92 | 160.12 | J165354.16+322937.6 | 01 | 75.64 | |
| J085024.05+054757.8 | 10 | 37.21 | J115026.28+302359.4 | 01 | 231.17 | J213136.72+002947.6 | 10 | 74.41 | |||
| J085025.75+344053.2 | 10 | 98.86 | J115113.14011111.1 | 01 | 168.85 | J224522.49+063817.2 | 01 | 88.17 | |||
| J085414.26+211148.1 | 11 | 233.93 | 149.53 | J115510.86+271324.3 | 01 | 95.53 | J224805.92+144328.3 | 01 | 66.04 | ||
| J085634.83+373913.4 | 11 | 180.94 | 202.61 | J121301.82+282310.0 | 11 | 389.86 | 388.75 | J234106.82+083550.3 | 01 | 81.32 | |
| J090210.95+252913.3 | 01 | 114.09 | J122037.01+492334.0 | 10 | 76.86 | J235408.04+291623.1 | 01 | 54.65 | |||
| J092712.02+284629.2 | 01 | 96.31 |
7 Identification of close WDMS binaries
In this section we aim at detecting PCEBs among the WDMS binaries identified in this work. To that end we require measuring the radial velocities (RVs) of at least one stellar component. WD RVs can be measured fitting the Balmer lines (Breedt et al., 2017) and/or employing cross-correlation techniques (Anguiano et al., 2017). However, we expect the WD RV shifts to be smaller than those measured from their M dwarf companions, since the WDs are generally closer to the center of mass in this type of binaries. We hence measure the Na I 8183.27, 8194.81 absorption doublet and the emission RVs arising from the M dwarf companions from all the LAMOST WDMS binary spectra identified in this work. We identify a PCEB when we detect more than 3 RV variation. Conversely, if no RV variation is detected from spectra taken separated by at least one night, the system is considered as a likely wide binary candidate that presumably evolved avoiding episodes of mass transfer. We fit the Na I 8183.27, 8194.81 absorption doublet with a second-order polynomial plus a double-Gaussian line profile of fixed separation, while the emission line (if present in the spectrum) is fitted with a second-order polynomial plus a single-Gaussian line profile (Rebassa-Mansergas et al., 2008; Ren et al., 2013). With the aim of increasing the SN ratio, the final released LAMOST DR5 spectra are the result of combining several different sub-exposure spectra (hereafter sub-spectra). Hence, we measure the RVs from all available sub-spectra as well as from the final combined spectra.
| Object | Notes | Classification | Orbital Period |
|---|---|---|---|
| J000729.32+023124.5 | Some faint points | Candidate new eclipser | ? |
| J001752.63+332424.9 | Reflection effect? | Candidate non-eclipser | 6.4 hours? |
| J003033.11+070657.5 | Seems to display variation | Candidate non-eclipser | 1.2 hours? or double |
| J004232.56+415403.0 | Reflection effect? | Non-eclipser | 0.10312 days |
| J004751.47+340212.7 | Large variations | Candidate non-eclipser | ? |
| J005130.56+314555.9 | Reflection effect? | Candidate non-eclipser | 1.7 hours? |
| J010010.53+003739.1 | Reflection effect? | Candidate non-eclipser | 1.7 hours? |
| J011547.58+005350.0 | Not many points | Candidate non-eclipser | 1.2 hours? |
| J012549.89+330940.6 | Variations | Non-eclipser | 0.24244 days, or double |
| J012550.48+280756.0 | Some faint points | Candidate new eclipser | ? |
| J013157.96+084948.2 | Reflection effect? | Candidate non-eclipser | 2.3 hours? |
| J024924.77+071344.3 | Variations | Non-eclipser | 0.17334 days, or double |
| J030308.35+005444.1 | Clear eclipser | Known eclipser [1] | 0.13444 days |
| J042955.26+344734.3 | Clear eclipser | New eclipser | 0.30716 days |
| J064959.81+424110.2 | Reflection effect? | Non-eclipser | 0.24496 days |
| J082145.27+455923.4 | Clear eclipser | Known eclipser [2] | 0.50909 days |
| J084028.85+501238.2 | Variation | Candidate non-eclipser | 1.2 hours? or double |
| J085414.28+211148.2 | Reflection effect? | Non-eclipser | 0.10215 days |
| J085835.56+281356.3 | large variations | LARP? | ? |
| J090812.04+060421.2 | Clear eclipser | Known eclipser [3] | 0.14944 days |
| J091216.37+234442.5 | Reflection effect? | Non-eclipser | 0.26356 days |
| J092712.02+284629.2 | Variation | Candidate non-eclipser | 3.1 hours? or double |
| J092741.73+332959.1 | Clear eclipser | Known eclipser [2] | 2.30822 days |
| J093207.63+334805.9 | Some faint points | Candidate new eclipser | 1.7 days? |
| J093507.99+270049.2 | Clear eclipser | Known eclipser [4] | 0.20103 days |
| J093947.95+325807.3 | Clear eclipser | Known eclipser [3] | 0.33098 days |
| J094913.36+032254.5 | Reflection effect? | Candidate non-eclipser | 3.1 hours? |
| J095719.24+234240.7 | Clear eclipser | Known eclipser [3] | 0.15087 days |
| J095737.59+300136.5 | Clear eclipser | Known eclipser [2] | 1.92613 days |
| J101307.79+245713.1 | Clear eclipser | Known eclipser [5] | 0.12904 days |
| J104012.99+252559.9 | Reflection effect? | Candidate non-eclipser | 3.7 hours? |
| J110827.40+303031.3 | Variation | Non-eclipser | 0.81820 days, or double |
| J112007.64+250221.3 | Some faint points | Candidate new eclipser | ? |
| J112738.71+281532.7 | Several faint points | Candidate new eclipser | ? |
| J113102.81+522645.3 | Variation | Candidate non-eclipser | 2 hours? or double |
| J114224.71022610.0 | Variation | Non-eclipser | 0.56112 days, or double |
| J114509.77+381329.2 | Variation | Non-eclipser | 0.19004 days, or double |
| J114853.34+555217.0 | Active star? Flares? | Active M dwarf? | ? |
| J120020.81+363557.3 | Some faint points | Candidate new eclipser | ? |
| J121010.13+334722.9 | Clear eclipser | Known eclipser [6] | 0.12449 days |
| J121258.25012309.9 | Clear eclipser | Known eclipser [7] | 0.33587 days |
| J122630.86+303852.5 | Reflection effect? | Non-eclipser | 0.25869 days |
| J123214.38+351324.8 | Variation | Candidate non-eclipser | 2.5 hours? |
| J132925.21+123025.4 | Clear eclipser | Known eclipser [2] | 0.08097 days |
| J134234.78+304849.2 | Several faint points | Candidate new eclipser | 1.66 days? |
| J135825.68+171204.1 | Variation | Non-eclipser | 0.16046 days, or double |
| J141811.97+204150.8 | Reflection effect? | Candidate non-eclipser | 2.6 hours? |
| J143547.87+373338.5 | Clear eclipser | Known eclipser [8] | 0.12563 days |
| J143900.62+560219.0 | Variation | Non-eclipser | 0.34268 days, or double |
| J144307.83+340523.5 | Shows big variations | Unclear | ? |
| J144846.85+071304.3 | Some faint points, real? | Candidate new eclipser | ? |
| J151426.90+285720.4 | Flares? CV? | Unclear | ? |
| J152804.92+331012.1 | Clear eclipser | New eclipser | 0.21155 days |
| J154846.00+405728.7 | Clear eclipser | Known eclipser [8] | 0.18552 days |
| J212309.40+040929.5 | Many faint points | Candidate new eclipser | ? |
| J212531.92010745.9 | Reflection effect | Non-eclipser | 0.28982 days |
| J233900.38+115707.2 | Variation | Non-eclipser | 0.12286 days, or double |
We cross-matched our LAMOST DR5 catalogue with the current newest spectroscopic data base of SDSS, i.e. DR14. This resulted in 685 additional spectra for 465 of our targets. Combining LAMOST DR5 and SDSS DR14 we thus gathered a total of 1835 spectra (1150 from LAMOST, 685 from SDSS) for measuring RVs. We derived at least one Na I 8183.27, 8194.81 absorption doublet and one emission RV of an accuracy better than 20 for 685 and 477 WDMS binaries in our catalogue, respectively. For 607 and 408 WDMS binaries we managed to measure at least two Na I and RVs, respectively. The RVs are provided in Table 3 (for completeness, we also provide the RVs we measured with accuracies worse than 20 ).
We identified 89 and 103 objects displaying more than 3 Na I and RV variation, respectively. If we only take into account systems with RVs taken on different nights (337 objects for Na I, 229 objects for ), we obtain a PCEB fraction of 26 per cent based on the Na I RV measurements, or 45 per cent based on the RV measurements. The PCEB fraction derived from the Na I RV analysis agrees well with those obtained in previous works from the SDSS WDMS sample (e.g. Nebot Gómez-Morán et al., 2011; Rebassa-Mansergas et al., 2016a). It has to be noted that the higher PCEB fraction derived by analysing the RVs needs to be taken with caution. This is because RVs are less robust for detecting RV variations due to magnetic activity effects (Rebassa-Mansergas et al., 2008).
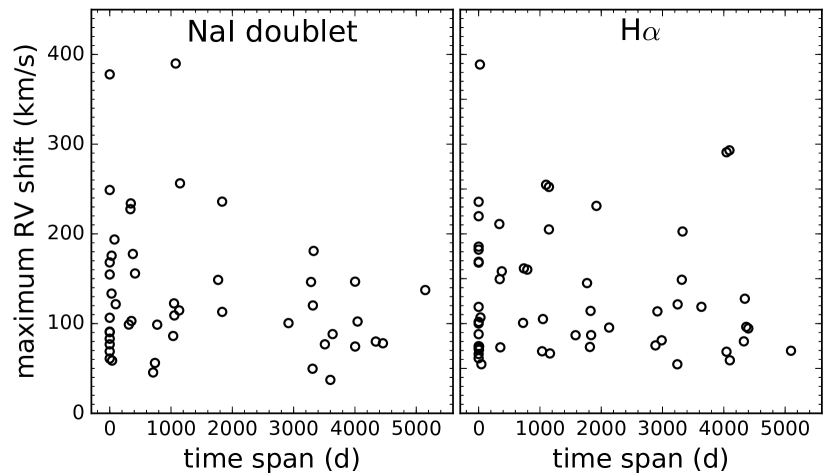
The total number of unique PCEBs we have identified that results from excluding duplicated targets from both the Na I and PCEB lists is 128. Among these, four were previously identified by Ren et al. (2014) within the LAMOST DR1 catalogue and 50 by Rebassa-Mansergas et al. (2016a) within the SDSS DR12 sample (we note that two were both detected within the LAMOST DR1 and SDSS DR12 catalogues). Thus, we are left with 76 new PCEB identifications in this work. In table 4 we provide the object names of these 76 PCEBs and in Figure 9 we show their maximum radial velocity shift vs. time span between the observed spectra. It is worth mentioning that in 1/2 of the cases the time span is over 1000 days. This is due to the fact that we combine LAMOST and SDSS spectra to detect close binaries, thus resulting in time baselines as long as 15 years.
8 Eclipsing WDMS systems
Following the approach presented in Parsons et al. (2013a) and Parsons et al. (2015a), we cross-matched our LAMOST DR5 WDMS binary catalogue with the photometric data from the Catalina Sky Survey (CSS) and Catalina Real Time Transient Survey (CRTS Drake et al., 2009). This allowed detecting WDMS binaries displaying light curve variations. During this process the raw CSS data were re-reduced by us to identify deeply eclipsing systems and to remove contaminated exposures.
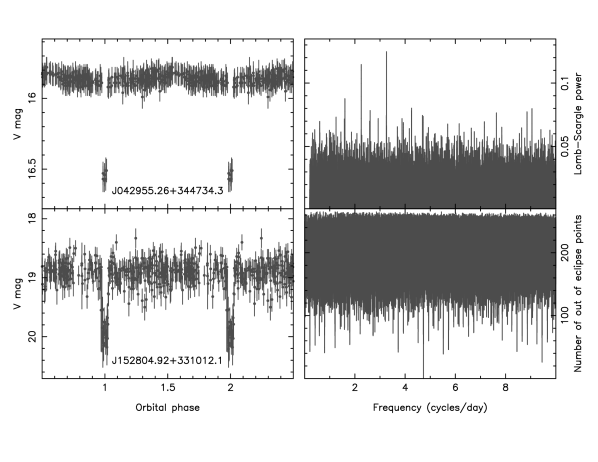
Among the 876 unique WDMS binaries that form the DR5 LAMOST catalogue, 687 were observed by the Catalina surveys, of which 630 did not display light curve variations. The remaining 57 objects include 16 eclipsing systems, two of which are new (see the light curves in Figure 10), 9 new eclipsing candidates, 14 objects displaying reflection effects or irradiation effects, 14 candidates for displaying reflection or irradiation effects, one candidate low-accretion rate polar, one candidate active M dwarf and two systems displaying light curve variations which we are not able to classify. We provide additional notes and our classification for these 57 objects in Table 5.
We calculated Scargle (1982) periodograms from the Catalina photometric data with the aim of measuring the orbital periods of the 57 objects displaying light curve variations. This is a suitable method when analysing light curves displaying out-of-eclipse variations due to reflection or ellipsoidal modulation effects (see an example in the top right panel of Figure 10). In the absence of such variations, i.e. only the eclipses are sampled by the CSS data, we employed the box fitting method outlined by Parsons et al. (2013a). We first identify the in-eclipse points from the raw light curve and fold the data over a given orbital period. From the folded data we identify the first and last in-eclipse points and count the number of out-of-eclipse points in between. This procedure is repeated over a large range of adopted orbital periods, being the correct determination the value that results in zero out-of-eclipse points. The number of out-of-eclipse points as a function of the adopted orbital period for our newly identified eclipsing system J152804.92+331012.1 is shown in the bottom right panel of Figure 10.
For 30 systems we were able to determine precise values of the orbital periods. In additional 15 cases, we could only derive estimates of the orbital periods due to insufficient information provided by the periodograms. We note that since, a priory, we do not know whether the light curve variations are due to reflection of irradiation effects for our non-eclipsing systems, there is a possibility that the orbital periods are double the measured ones. We include our measured values of the orbital periods in Table 5. We note that, for the two new eclipsing systems found here, we were not able to derive accurate RVs due to the low SN ratio of their spectra, thus they are not included in our PCEB list.
9 Summary and conclusions
The catalogue of WDMS binaries from LAMOST DR5 contains 876 objects and it is 8 times larger than our previous DR1 sample. 357 of these systems (40 per cent of the catalogue) are new identifications that have not been published before. Moreover, 339 were observed as part of a dedicated LAMOST survey for obtaining spectra of WDMS binaries photometrically selected within SDSS that are expected to contain cool WDs and/or early type M dwarf companions.
We determined the stellar parameters (white dwarf effective temperatures, surface gravities and masses, and M dwarf spectral types) of our systems following a decomposition/fitting routine, and we used the corresponding parameter distributions to analyse the intrinsic properties of the LAMOST DR5 sample. We found that the population of cool WDs remains under-represented. This is most likely due to the fact that cool (10 000 K) WDs are systematically fainter and hence associated to lower SN ratio spectra. This increases considerably the probability for our decomposition/fitting method to determine WD parameters associated to large uncertainties and, as a consequence, these objects are not taken into account in our analysis.
We measured the Na I 8183.27, 8194.81 absorption doublet and the emission radial velocities of each object in our catalogue from their LAMOST DR5 as well as SDSS DR14 spectra (when available). We detected 128 systems (76 of which are new identifications) displaying more than 3 radial velocity variations and hence classify these objects as PCEBs. The close binary fraction we derived is 26 per cent, in agreement with previous studies.
By cross-matching our catalogue with the Catalina Surveys we found 57 systems displayed light curve variations. Among these we identified 16 eclipsing systems, two of which are new, and nine additional eclipsing WDMS binary candidates. By analysing the periodograms calculated from the photometric data we were able to determine the orbital periods of 30 objects and estimate the orbital periods of 15 additional systems.
Acknowledgements
We thank the anonymous referee for the helpful comments and suggestions. This work is supported by Joint Funds of the National Natural Science Foundation of China (Grant No. U1531244) and the National Key Basic Research Program of China 2014CB845700. JJR acknowledges support from the Young Researcher Grant of National Astronomical Observatories, Chinese Academy of Sciences. ARM acknowledges support from the MINECO under the Ramón y Cajal programme (RYC-2016-20254) and the AYA2017-86274-P grant, and the AGAUR grant SGR-661/2017.
This work has made use of data products from the Guoshoujing Telescope (the Large Sky Area Multi-Object Fibre Spectroscopic Telescope, LAMOST). LAMOST is a National Major Scientific Project built by the Chinese Academy of Sciences. Funding for the project has been provided by the National Development and Reform Commission. LAMOST is operated and managed by the National Astronomical Observatories, Chinese Academy of Sciences.
References
- Anguiano et al. (2017) Anguiano B., Rebassa-Mansergas A., García-Berro E., Torres S., Freeman K. C., Zwitter T., 2017, MNRAS, 469, 2102
- Bours et al. (2016) Bours M. C. P., Marsh T. R., Parsons S. G., et al., 2016, MNRAS, 460, 3873
- Breedt et al. (2017) Breedt E., et al., 2017, MNRAS, 468, 2910
- Camacho et al. (2014) Camacho J., Torres S., García-Berro E., Zorotovic M., Schreiber M. R., Rebassa-Mansergas A., Nebot Gómez-Morán A., Gänsicke B. T., 2014, A&A, 566, A86
- Chui (1992) Chui C. K., 1992, Wavelets: A tutorial in theory and applications
- Cojocaru et al. (2017) Cojocaru R., Rebassa-Mansergas A., Torres S., García-Berro E., 2017, MNRAS, 470, 1442
- Cui et al. (2012) Cui X.-Q., et al., 2012, Research in Astronomy and Astrophysics, 12, 1197
- Davis et al. (2010) Davis P. J., Kolb U., Willems B., 2010, MNRAS, 403, 179
- De Marco et al. (2011) De Marco O., Passy J.-C., Moe M., Herwig F., Mac Low M.-M., Paxton B., 2011, MNRAS, 411, 2277
- Deng et al. (2012) Deng L.-C., et al., 2012, Research in Astronomy and Astrophysics, 12, 735
- Drake et al. (2009) Drake A. J., et al., 2009, ApJ, 696, 870
- Drake et al. (2010) Drake A. J., et al., 2010, preprint, (arXiv:1009.3048)
- Drake et al. (2014) Drake A. J., et al., 2014, ApJS, 213, 9
- Farihi et al. (2010) Farihi J., Hoard D. W., Wachter S., et al., 2010, ApJS, 190, 275
- Gänsicke et al. (2009) Gänsicke B. T., et al., 2009, MNRAS, 397, 2170
- Gentile Fusillo et al. (2015) Gentile Fusillo N. P., et al., 2015, MNRAS, 452, 765
- Han et al. (2002) Han Z., Podsiadlowski P., Maxted P. F. L., Marsh T. R., Ivanova N., 2002, MNRAS, 336, 449
- Han et al. (2003) Han Z., Podsiadlowski P., Maxted P. F. L., Marsh T. R., 2003, MNRAS, 341, 669
- Han & Podsiadlowski (2004) Han Z., Podsiadlowski P., 2004, MNRAS, 350, 1301
- Heller et al. (2009) Heller R., Homeier D., Dreizler S., Østensen R., 2009, A&A, 496, 191
- Heber (2016) Heber U., 2016, PASP, 128, 082001
- Iben & Livio (1993) Iben Jr. I., Livio M., 1993, PASP, 105, 1373
- Kepler et al. (2015) Kepler S. O., et al., 2015, MNRAS, 446, 4078
- Kilic et al. (2017) Kilic M., Brown W. R., Gianninas A., Curd B., Bell K. J., Allende Prieto C., 2017, MNRAS, 471, 4218
- Koester (2010) Koester D., 2010, Mem. Soc. Astron. Italiana, 81, 921
- Koester et al. (2009) Koester D., Kepler S. O., Kleinman S. J., Nitta A., 2009, in Journal of Physics Conference Series. p. 012006 (arXiv:0812.0491), doi:10.1088/1742-6596/172/1/012006
- Langer et al. (2000) Langer N., Deutschmann A., Wellstein S., Höflich P., 2000, A&A, 362, 1046
- Li et al. (2014) Li L., Zhang F., Han Q., Kong X., Gong X., 2014, MNRAS, 445, 1331
- Liu et al. (2012) Liu C., Li L., Zhang F., Zhang Y., Jiang D., Liu J., 2012, MNRAS, 424, 1841
- Liu et al. (2014) Liu X.-W., et al., 2014, in Feltzing S., Zhao G., Walton N. A., Whitelock P., eds, IAU Symposium Vol. 298, Setting the scene for Gaia and LAMOST. pp 310–321 (arXiv:1306.5376), doi:10.1017/S1743921313006510
- Luo et al. (2012) Luo A.-L., et al., 2012, Research in Astronomy and Astrophysics, 12, 1243
- Luo et al. (2015) Luo A.-L., et al., 2015, Research in Astronomy and Astrophysics, 15, 1095
- Marsh et al. (2014) Marsh T. R., et al., 2014, MNRAS, 437, 475
- Miszalski et al. (2009) Miszalski B., Acker A., Moffat A. F. J., et al., 2009, A&A, 496, 813
- Nebot Gómez-Morán et al. (2009) Nebot Gómez-Morán A., et al., 2009, A&A, 495, 561
- Nebot Gómez-Morán et al. (2011) Nebot Gómez-Morán A., et al., 2011, A&A, 536, A43
- Pala et al. (2017) Pala A. F., et al., 2017, MNRAS, 466, 2855
- Parsons et al. (2012a) Parsons S. G., et al., 2012a, MNRAS, 419, 304
- Parsons et al. (2012b) Parsons S. G., et al., 2012b, MNRAS, 420, 3281
- Parsons et al. (2013a) Parsons S. G., et al., 2013a, MNRAS, 429, 256
- Parsons et al. (2013b) Parsons S. G., Marsh T. R., Gänsicke B. T., Schreiber M. R., Bours M. C. P., Dhillon V. S., Littlefair S. P., 2013b, MNRAS, 436, 241
- Parsons et al. (2014) Parsons S. G., et al., 2014, MNRAS, 438, L91
- Parsons et al. (2015a) Parsons S. G., et al., 2015a, MNRAS, 449, 2194
- Parsons et al. (2015b) Parsons S. G., et al., 2015b, MNRAS, 452, 1754
- Parsons et al. (2017) Parsons S. G., et al., 2017, MNRAS, 470, 4473
- Passy et al. (2012) Passy J.-C., et al., 2012, ApJ, 744, 52
- Pyrzas et al. (2009) Pyrzas S., et al., 2009, MNRAS, 394, 978
- Pyrzas et al. (2012) Pyrzas S., et al., 2012, MNRAS, 419, 817
- Pyrzas et al. (2015) Pyrzas S., et al., 2015, MNRAS, 447, 691
- Rebassa-Mansergas et al. (2007) Rebassa-Mansergas A., Gänsicke B. T., Rodríguez-Gil P., Schreiber M. R., Koester D., 2007, MNRAS, 382, 1377
- Rebassa-Mansergas et al. (2008) Rebassa-Mansergas A., et al., 2008, MNRAS, 390, 1635
- Rebassa-Mansergas et al. (2010) Rebassa-Mansergas A., Gänsicke B. T., Schreiber M. R., Koester D., Rodríguez-Gil P., 2010, MNRAS, 402, 620
- Rebassa-Mansergas et al. (2011) Rebassa-Mansergas A., Nebot Gómez-Morán A., Schreiber M. R., Girven J., Gänsicke B. T., 2011, MNRAS, 413, 1121
- Rebassa-Mansergas et al. (2012a) Rebassa-Mansergas A., Nebot Gómez-Morán A., Schreiber M. R., Gänsicke B. T., Schwope A., Gallardo J., Koester D., 2012a, MNRAS, 419, 806
- Rebassa-Mansergas et al. (2012b) Rebassa-Mansergas A., et al., 2012b, MNRAS, 423, 320
- Rebassa-Mansergas et al. (2013a) Rebassa-Mansergas A., Schreiber M. R., Gänsicke B. T., 2013a, MNRAS, 429, 3570
- Rebassa-Mansergas et al. (2013b) Rebassa-Mansergas A., Agurto-Gangas C., Schreiber M. R., Gänsicke B. T., Koester D., 2013b, MNRAS, 433, 3398
- Rebassa-Mansergas et al. (2016a) Rebassa-Mansergas A., Ren J. J., Parsons S. G., Gänsicke B. T., Schreiber M. R., García-Berro E., Liu X.-W., Koester D., 2016a, MNRAS, 458, 3808
- Rebassa-Mansergas et al. (2016b) Rebassa-Mansergas A., et al., 2016b, MNRAS, 463, 1137
- Rebassa-Mansergas et al. (2017) Rebassa-Mansergas A., Parsons S. G., García-Berro E., Gänsicke B. T., Schreiber M. R., Rybicka M., Koester D., 2017, MNRAS, 466, 1575
- Ren et al. (2013) Ren J., Luo A., Li Y., Wei P., Zhao J., Zhao Y., Song Y., Zhao G., 2013, AJ, 146, 82
- Ren et al. (2014) Ren J. J., et al., 2014, A&A, 570, A107
- Renedo et al. (2010) Renedo I., Althaus L. G., Miller Bertolami M. M., Romero A. D., Córsico A. H., Rohrmann R. D., García-Berro E., 2010, ApJ, 717, 183
- Richards et al. (2002) Richards G. T., et al., 2002, AJ, 123, 2945
- Ricker & Taam (2012) Ricker P. M., Taam R. E., 2012, ApJ, 746, 74
- Scargle (1982) Scargle J. D., 1982, ApJ, 263, 835
- Schleicher et al. (2015) Schleicher D. R. G., Dreizler S., Völschow M., Banerjee R., Hessman F. V., 2015, Astronomische Nachrichten, 336, 458
- Schreiber et al. (2008) Schreiber M. R., Gänsicke B. T., Southworth J., Schwope A. D., Koester D., 2008, A&A, 484, 441
- Schreiber et al. (2010) Schreiber M. R., et al., 2010, A&A, 513, L7
- Silvestri et al. (2006) Silvestri N. M., et al., 2006, AJ, 131, 1674
- Skinner et al. (2017) Skinner J. N., Morgan D. P., West A. A., Lépine S., Thorstensen J. R., 2017, AJ, 154, 118
- Smolčić et al. (2004) Smolčić V., et al., 2004, ApJ, 615, L141
- Stoughton et al. (2002) Stoughton C., et al., 2002, AJ, 123, 485
- Su et al. (2004) Su D.-Q., Cui X.-Q., 2004, Chinese J. Astron. Astrophys., 4, 1
- Toonen & Nelemans (2013) Toonen S., Nelemans G., 2013, A&A, 557, A87
- Tremblay et al. (2011) Tremblay P.-E., Ludwig H.-G., Steffen M., Bergeron P., Freytag B., 2011, A&A, 531, L19
- Tremblay et al. (2013) Tremblay P.-E., Ludwig H.-G., Steffen M., Freytag B., 2013, A&A, 559, A104
- Veras et al. (2018) Veras D., Xu S., Rebassa-Mansergas A., 2018, MNRAS, 473, 2871
- Wang & Han (2012) Wang B., Han Z., 2012, New Astron. Rev., 56, 122
- Wang et al. (2010) Wang B., Li X.-D., Han Z.-W., 2010, MNRAS, 401, 2729
- Wang et al. (1996) Wang S.-G., Su D.-Q., Chu Y.-Q., Cui X., Wang Y.-N., 1996, Appl. Opt., 35, 5155
- Webbink (2008) Webbink R. F., 2008, in Milone E. F., Leahy D. A., Hobill D. W., eds, Astrophysics and Space Science Library Vol. 352, Astrophysics and Space Science Library. p. 233 (arXiv:0704.0280), doi:10.1007/978-1-4020-6544-6_13
- Willems & Kolb (2004) Willems B., Kolb U., 2004, A&A, 419, 1057
- Xiang et al. (2017) Xiang M.-S., et al., 2017, MNRAS, 467, 1890
- Yanny et al. (2009) Yanny B., et al., 2009, AJ, 137, 4377
- York et al. (2000) York D. G., et al., 2000, AJ, 120, 1579
- Yuan et al. (2015) Yuan H.-B., et al., 2015, MNRAS, 448, 855
- Zhao et al. (2012) Zhao G., Zhao Y.-H., Chu Y.-Q., Jing Y.-P., Deng L.-C., 2012, Research in Astronomy and Astrophysics, 12, 723
- Zorotovic & Schreiber (2013) Zorotovic M., Schreiber M. R., 2013, A&A, 549, A95
- Zorotovic et al. (2010) Zorotovic M., Schreiber M. R., Gänsicke B. T., Nebot Gómez-Morán A., 2010, A&A, 520, A86
- Zorotovic et al. (2014) Zorotovic M., Schreiber M. R., García-Berro E., Camacho J., Torres S., Rebassa-Mansergas A., Gänsicke B. T., 2014, A&A, 568, A68
- Zorotovic et al. (2016) Zorotovic M., et al., 2016, MNRAS, 457, 3867
- de Kool (1992) de Kool M., 1992, A&A, 261, 188