Muon content of extensive air showers: comparison of the energy spectra obtained by the Sydney University Giant Air-shower Recorder and by the Pierre Auger Observatory
Abstract
The Sydney University Giant Air-shower Recorder (SUGAR) measured the energy spectrum of ultra-high-energy cosmic rays reconstructed from muon-detector readings, while the Pierre Auger Observatory, looking at the same Southern sky, uses the calorimetric fluorescence method for the same purpose. Comparison of their two spectra allows us to reconstruct the empirical dependence of the number of muons in a vertical shower on the primary energy for energies between and eV. We compare this dependence with the predictions of hadronic interaction models QGSJET-II-04, EPOS-LHC and SIBYLL-2.3c. The empirically determined number of muons with energies above 0.75 GeV in a vertical shower exceeds the simulated one by the factors 1.7 and 1.3 for eV proton and iron primaries, respectively. The muon excess grows moderately with the primary energy, increasing by an additional factor of for eV primaries.
I Introduction
In recent years, considerable attention has been paid to discrepancies between theoretical models of the development of extensive air showers (EAS), realized in Monte-Carlo simulations, and real EAS data, see e.g. Ref. Kampert_and_Unger for a review and Ref. EAS-MSU_mu for a recent summary. Understanding of fundamental reasons for these discrepancies might shed light on the physics of hadronic interactions at energies and in kinematical regions hardly accessible in accelerator experiments. One of the best studied, though not yet understood, discrepancies is the so-called muon excess. Analyses of the muon content of air showers initiated by primary particles with energies eV by the Pierre Auger Observatory PAOmu-old ; PAOmu1 ; PAOmu2 and the Yakutsk experiment Yak-mu revealed an overall excess (several tens per cent, depending on the assumed primary composition and interaction model) in the number of muons with energies GeV in EAS, compared to simulations performed with available hadronic-interaction models. This is in line with earlier results of the HiRes/MIA experiment HiRes-MIA obtained for eV. While preliminary IceTop results IceTop for GeV muons and eV eV suggested that no excess is seen, they have been superseded by newer preliminary results IceTop_v2 demonstrating the rise of the muon excess near eV, consistent with the excess seen by HiRes/MIA (see also discussion in Ref. Watson ). The NEVOD/DECOR group has studied the number, multiplicity and energy of bundles of GeV muons in inclined showers at eV and found the excess of the number of bundles over the simulation NEVOD while the energy deposited per bundles agrees well with models NEVOD_v2 . Analysis of the muon density of EAS in KASCADE-Grande KASCADE-Grande for muons with MeV and eV eV did not reveal the excess in the muon density though a mismatch in the muon attenuation length was found. Also, the analysis of the muon data of the EAS-MSU experiment EAS-MSU_mu did not reveal any excess of GeV muons at eV eV. As it is discussed in Ref. EAS-MSU_mu , all these data have been obtained in different conditions, that is for different ranges of the primary energy , various muon energies , at different atmospheric depths, for different zenith angles and with data obtained at different distances from the shower axis. A more systematic study of the muon excess over a large range of primary energies and zenith angle is needed with a single experiment.
In this work, we make an attempt to use the data of the Sydney University Giant Air-shower Recorder (SUGAR) array, which consisted of 54 muon detectors spread over 70 km2, for the study of the muon-excess problem. The present note reports the first results obtained from comparison of published UHECR spectra measured by two Southern hemisphere experiments, SUGAR and Auger. We assume that, since both experiments see the same sky, the true cosmic-ray (CR) spectra should be identical, and any differences are due to different reconstruction methods used. The Auger spectrum is normalized to fluorescence detector energy measurements, a method which is described as calorimetric with accuracy of PAO1 . We therefore use the Auger spectrum as a proxy to the true CR spectrum seen from the Southern hemisphere. The SUGAR spectrum was derived from the muon-detector data, and model assumptions have necessarily been invoked to estimate the primary energy from the effective vertical muon number for each shower. In this work, we take the SUGAR spectrum and fit the relation in such a way that the Auger spectrum is reproduced from the SUGAR data. Comparison of our empirical relation with the theoretical one, , used by the SUGAR group, reveals the excess of muons in data with respect to the model relation: , hence the number of observed muons in a shower with a given primary energy is larger than expected from the models. This is in line with the results of the Auger and Yakutsk arrays on the muon content and opens the possibility to study the muon excess in more detail with SUGAR data on individual events. While this more detailed study, tracing the origin of the excess, will be performed elsewhere, we compare here our empirical relation with those predicted by Monte-Carlo simulations performed with modern hadronic-interaction models. This confirms the muon excess in data with respect to simulations and addresses the energy dependence of this excess: the excess grows very moderately with energy over 1.5 decades in the primary energy between and eV.
In Sec. II, we discuss briefly the published spectra of SUGAR and Auger which we use as the input for this study. We compare the spectra and derive the empirical muon number – energy relation in Sec. III. This relation is compared to results of simulations with three hadronic interaction models in Sec. IV. Section V contains our brief conclusions and discusses prospects for future work.
II The spectra
II.1 SUGAR
The SUGAR experiment was in operation between 1968 and 1979 SUGAR1 ; Brownlee ; SUGAR3 . The array was located near the town of Narrabri in New South Wales, Australia at latitude S, longitude E and altitude 250 m above sea level. The array covered an area of about 70 km2 and consisted of 54 underground detector stations. There were no surface-based detectors. Each detector station had two liquid-scintillator tanks 50 m apart in the North-South direction, buried at the depth varying within m Brownlee . The effective area of each scintillator tank was 6.0 m2. The threshold energy for detected muons was GeV, where is the zenith angle of the incident muon. To reconstruct the primary energy, readings of these muon detectors were used as the input. Model-based relations between the muon number and the energy were invoked.
Early work of the SUGAR group had been criticised for underestimation of the photomultiplier afterpulsing effect. However, it was subsequently taken into account properly. In this work, we use the spectrum presented in Ref. SUGARWinn , where the afterpulsing effect was correctly taken into account. Still, the spectrum was considerably higher than those obtained by other groups. We believe that this is a manifestation of the “muon excess”. Note that in an early work, the SUGAR group did study the surface component. There was a spark chamber detector placed between two of the closest array SUGAR stations, triggered by a coincidence of the two stations SUGAR-spark . The correction for afterpulsing was not implemented at that time, but qualitatively, the results of that study agree well with those of the present work.
We restrict ourselves to the energy range where SUGAR had sufficient statistics, that is, far below the Greizen–Zatsepin–Kuzmin suppression. We use the differential vertical muon number, , spectrum obtained by combining various muon-number spectra at different zenith angles SUGARWinn . For a given EAS zenith angle , the effective vertical muon number in a shower is related to the reconstructed muon number through the following relation,
| (1) |
where the coefficients are , , , and the normalization scale is . This relation was obtained in Ref. SUGAR_Nv empirically from the data by means of the constant-intensity cuts method. The muon number, , is, in turn, determined by fitting individual detector readings by the experimentally determined muon lateral distribution function (LDF),
| (2) |
Here, is the muon density, is the estimated total number of muons, is the incident zenith angle, is the perpendicular distance from the shower axis, m, , , and
| (3) |
The resulting spectrum, shown in Fig. 1,
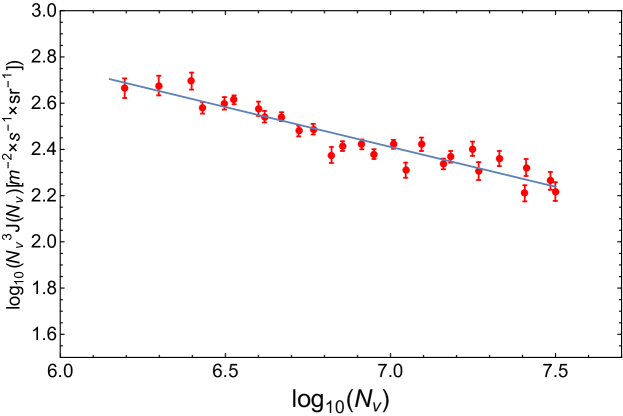
is well described by a power law for , the range used in this study. More details on the SUGAR data processing may be found in Ref. SUGARWinn .
According to the SUGAR procedure, the primary energy of the shower is related to the number of vertical muons by the following expression,
| (4) |
For the Hillas model H used in Ref. SUGARWinn ,
| (5) |
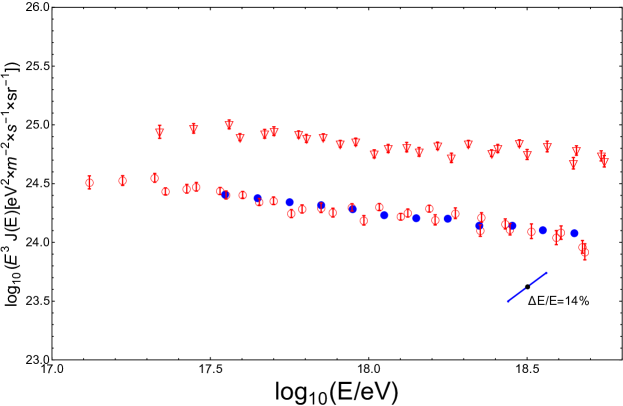
Given the power-law shape of the spectrum and the relation (4), the resulting SUGAR energy spectrum SUGARWinn , see Fig. 2 (red empty triangles), is also power-law. The systematic error of the SUGAR spectrum measurement is as one may conclude from Ref. SUGAR3 (the dominant source of uncertainties discussed there is related to the determination of the shower geometry). This relatively low value is not surprising because the dominant source of systematics in the energy spectrum comes from relating the primary energy to observable quantities, while here we use the muon number measured directly at the surface and keep the relation free, see Sec. III.
II.2 The Pierre Auger Observatory
The Pierre Auger Observatory has been in operation since 2004 PAO1 . The experiment is located near the town of Malargüe in Mendoza Province, Argentina at latitude S, longitude W, and the average altitude 1400 m above sea level. The Observatory includes the large surface-detector (SD) array of 1600 water-Cherenkov detectors distributed over the area of km2, supplemented by an additional, more dense array of 61 detectors spreading over the area of km2. Jointly with SD, the fluorescence detector (FD) consisting of 4 telescope stations works in coincidence with the large SD during a limited fraction of time (clear, moonless nights). An additional FD station, the High-Elevation Auger Telescope (HEAT), is able to detect lower-energy showers in coincidence with the dense SD array. The FD method provides the primary energy estimates with reduced model uncertainties and is therefore used to calibrate the SD energy scale by means of simultaneous (hybrid) observations of a number of events. The systematic error of the Auger energy scale is PAO1 and is dominated by the uncertainty in the fluorescence yield measurement. For the present study, we use the most recent combined energy spectrum reported in Ref. Aab:2017njo . In the energy range we use, eV, the spectrum is dominated by the dense SD data, with a modest contribution from hybrid data in the higher-energy part, and is well approximated by a power law Aab:2017njo . The spectrum is also shown in Fig. 2 (blue filled circles).
III Comparison of the spectra
The key part of the present study is to change the relation in such a way that the SUGAR muon data produces the Auger spectrum calibrated by the FD. This is straightforward to do given the power-law shapes of both spectra. We fit parameters and of Eq. (4) requiring that the SUGAR energy spectrum, reconstructed with these new parameters, matches the Auger combined energy spectrum. As a result we obtain the following values of parameters for Eq. (4),
| (6) |
where the systematics discussed above was propagated. The modified SUGAR spectrum is shown in Fig. 2 by red empty circles and demonstrates an excellent agreement with the Auger spectrum.
IV Comparison to the Monte-Carlo simulations
At the next step, we quantify the “muon excess” by comparing our empirical relation with those predicted by modern Monte-Carlo (MC) models. We use the CORSIKA 7.4001 Heck:1998vt EAS simulation package. We choose the QGSJET-II-04 Ostapchenko:2010vb , EPOS-LHC EPOS-LHC and SYBYLL-2.3c (SIBYLL, ) as the high-energy hadronic interaction models and FLUKA2011.2c Fluka as the low-energy hadronic interaction model. We simulate a library of artificial EAS with primary energies following an differential spectrum SUGARWinn with eV eV. These EAS are simulated with zenith angles in the range between and (as in the real SUGAR data used in Ref. SUGARWinn ) assuming an isotropic distribution of arrival directions in the celestial sphere. The simulations were performed with the thinning parameter and maximal weight limitations, cf. Ref. Kobal . As it is customary in simulations with thinning for sparse ground arrays, particles within 100 m from the core were discarded.
For each of the three high-energy hadronic interaction models, we simulated 10000 showers for primary protons and the same number of showers for primary iron. The lower energy thresholds are fixed for hadrons (excluding ) and muons as 50 MeV; for photons, e+, e- and as 250 keV. The standard geomagnetic field for the SUGAR array location is assumed, T and T.
Since we are interested in the mean relation and not in its fluctuations, we estimate the number of muons with energies above the SUGAR threshold in an artificial shower and calculate the muon density in concentric rings around the shower axis. As was done with the real data, we use the experimental muon LDF in Eq. (2) and fit it to the muon density distribution in MC, obtaining . Then, we use Eq. (1) to express the effective number of vertical muons through and . As a result, is determined for each artificial shower. We note that this procedure gives, of course, a rough approximation to the data analysis chain, since, in reality, only a few detector stations were firing, which reduced considerably the precision of reconstruction of the core position, the arrival angles and the LDF. To demonstrate that mean relations are not strongly affected by these uncertainties, we performed a simple simulation in which the effect of a limited number of stations was imitated in the following way. A random location of the shower within the SUGAR array was generated and the mean muon density at each detector station was calculated from LDF and transformed into detector readings by means of the Poisson distribution. The true geometry was modified to imitate reconstruction errors (50 m in the core location and 2.6∘ in the arrival direction, assuming Gaussian distributions). Then, was reconstructed from these data and compared to the input one. For an individual shower, the statistical error introduced by this procedure was in , symmetric with respect to the central value. As a result, the total effect of our simplified procedure on the reconstruction of the MC relations from 10000 artiicial events was far below statistical fluctuations. A more detailed study, taking into account all steps of the SUGAR reconstruction procedure, will be performed elsewhere.
Figure 3
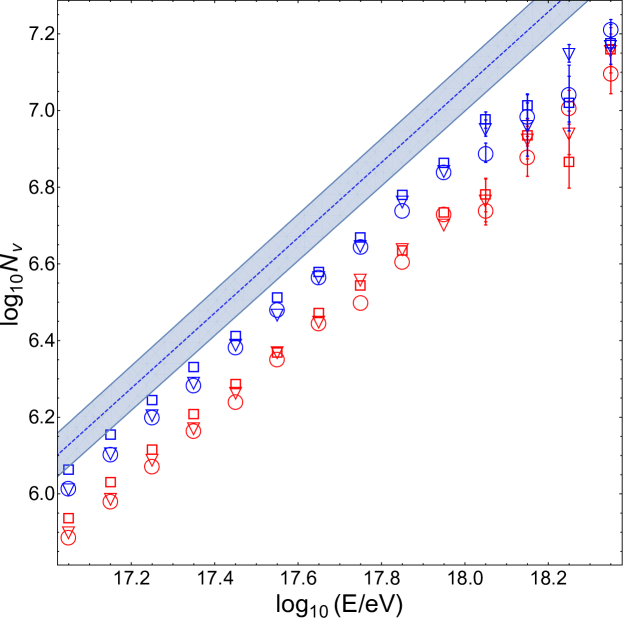
presents a comparison of the simulation results for with our empirical relation. The “muon excess” is clearly seen, and its dependence on the energy may be studied. To this end, we parametrise the ratio of empirical, , and simulated, , muon numbers in vertical showers as a power law in energy ,
| (7) |
Best-fit normalizations and exponents for the relation (7) are given in Table 1
| Simulation | ||
|---|---|---|
| QGSJET-II-04 protons | ||
| QGSJET-II-04 iron | ||
| EPOS-LHC protons | ||
| EPOS-LHC iron | ||
| SIBYLL-2.3c protons | ||
| SIBYLL-2.3c iron |
for eV and various models and primaries. These relations, quantifying the muon excess, are plotted in Fig. 4.
We see that the muon excess grows moderately with energy. It could be possible that extrapolation of this dependence to even lower energies may result in the disappearence of the excess at eV. We note that the discrepancy between the data and simulations is less pronounced for heavier primaries, though still significant. Agreement at eV between the three hadronic-interaction models we use is not surprising because all three were tuned to reproduce the Large Hadron Collider results.
V Conclusions and outlook
In this paper, we obtained an empirical relation between the number of muons in an extensive air shower and the primary energy, for energies eV eV. To this end, we took the SUGAR effective muon-number spectrum and determined the relationship (4), (7) between the energy and muon number in a vertical shower, starting from the requirement that the Auger energy spectrum is reproduced from the SUGAR muon data. Then, we compared our empirical relation with the Monte-Carlo simulations performed with the help of modern hadronic-interaction models. We found the excess of muons in real air showers with respect to simulations, as parametrized by Eq. (7) with parameters listed in Table 1, for three hadronic-interaction models, QGSJET-II-04, EPOS-LHC and SIBYLL-2.3c, and two types of primary particles, protons and iron nuclei.
In our work, we treated the Auger energy spectrum as the true underlying primary spectrum for the SUGAR events. This assumption is motivated by the similar fields of view of the two Southern experiments and by the calibration of the Auger spectrum to the FD measurements, which suppresses model dependencies. Nevertheless, the correctness of this assumption remains the main source of the systematic uncertainties of our approach, and the systematic error of the experimental energy scale dominates the uncertainties of our study.
This work represents the first step in exploitation of unique SUGAR muon data for a detailed study of the muon excess. The shower-by-shower SUGAR data will be analized to compare real and simulated muon numbers as a function of not only the primary energy, but also of the atmospheric depth (zenith-angle dependence), distance to the shower core (the LDF shape) etc., allowing us to trace the origin of the discrepancies between data and simulations. This work, currently in progress, would ultimately affect both our understanding of hadronic interactions and the interpretation of all high-energy cosmic-ray results.
Acknowledgements
We thank Leonid Bezrukov, Bruce Dawson, Oleg Kalashev, Mikhail Kuznetsov, Maxim Pshirkov, Peter Tinyakov and Yana Zhezher for helpful discussions. Monte-Carlo simulations have been performed at the computer cluster of the Theoretical Physics Department, Institute for Nuclear Research of the Russian Academy of Sciences. Development of the analysis methods (IK and GR) is supported by the Russian Science Foundation (grant 17-72-20291).
References
- (1) K.-H. Kampert, M. Unger, “Measurements of the Cosmic Ray Composition with Air Shower Experiments,” Astropart. Phys. 35 (2012) 660 [arXiv:1201.0018 [astro-ph.HE]].
- (2) Yu. A. Fomin et al., “No muon excess in extensive air showers at eV primary energy: EAS-MSU muon versus surface detector data,” Astropart. Phys. 92 (2017) 1 [arXiv:1609.05764 [astro-ph.HE]].
- (3) R. Engel [Pierre Auger Collaboration], “Test of hadronic interaction models with data from the Pierre Auger Observatory,” (2007) arXiv:0706.1921 [astro-ph].
- (4) A. Aab et al. [Pierre Auger Collaboration], “Testing Hadronic Interactions at Ultrahigh Energies with Air Showers Measured by the Pierre Auger Observatory,” Phys. Rev. Lett. 117 (2016) 192001 [arXiv:1610.08509 [hep-ex]].
- (5) A. Aab et al. [Pierre Auger Collaboration], “Muons in air showers at the Pierre Auger Observatory: Mean number in highly inclined events,” Phys. Rev. D 91 (2015) 032003. Erratum: [Phys. Rev. D 91 (2015) 059901] [arXiv:1408.1421 [astro-ph.HE]].
- (6) A. V. Glushkov et al. “Muon content of ultrahigh-energy air showers: Yakutsk data versus simulations,” JETP Lett. 87 (2008) 190 [arXiv:0710.5508 [astro-ph]].
- (7) T. Abu-Zayyad et al. [HiRes and MIA Collaborations], “Evidence for Changing of Cosmic Ray Composition between -eV and -eV from Multicomponent Measurements,” Phys. Rev. Lett. 84 (2000) 4276 [astro-ph/9911144].
- (8) J. G. Gonzalez [IceCube Collaboration], “Measurement of the Muon Content of Air Showers with IceTop”, J. Phys. Conf. Ser. 718 (2016) 052017.
- (9) H. Dembinski [IceCube Collaboration], “Investigating cosmic rays and air shower physics with IceCube/IceTop”, EPJ Web Conf., 145 (2017) 01003.
- (10) A. A. Watson, “Conclusions about properties of high-energy cosmic-rays drawn with limited recourse to hadronic models,” Nucl. Part. Phys. Proc. 291-293 (2017) 66 [arXiv:1610.09098 [astro-ph.HE]].
- (11) Kokoulin et al., “New approach to muon investigations in inclined EAS”, Nucl. Phys. B (Proc. Suppl.) 196 (2009) 106.
- (12) A. G. Bogdanov et al., “Energy characteristics of multi-muon events in a wide range of zenith angles,” J. Phys. Conf. Ser. 798, no. 1, 012049 (2017) [arXiv:1612.09175 [astro-ph.IM]].
- (13) J.C. Ateaga-Velazquez et al., “Measurements of the muon content of EAS in KASCADE-Grande compared with SIBYLL 2.3 predictions”, PoS (ICRC2017) 316.
- (14) A. Aab et al. [Pierre Auger Collaboration], “The Pierre Auger Cosmic Ray Observatory,” Nucl. Instrum. Meth. A 798 (2015) 172 [arXiv:1502.01323 [astro-ph.IM]].
- (15) C. B. A. McCusker and M. M. Winn, “A new method of recording large cosmic-ray air showers”, Nuovo Cimento 28 (1963) 175.
- (16) R. G. Brownlee et al., “Design of an array to record air showers of energy up to eV”, Can. J. Phys. 46S (1968) 259.
- (17) C. J. Bell et al., “The upper end of the observed cosmic ray energy spectrum,” J. Phys. A 7 (1974) 990.
- (18) M. M. Winn, J. Ulrichs, L. S. Peak, C. B. Mccusker, L. Horton, “The cosmic-ray energy spectrum above eV,” J. Phys. G 12 (1986) 653.
- (19) C. J. Bell et al., “The structure functions of very large E.A.S.,” Proc. 13th ICRC, Denver 4 (1973) 2569.
- (20) L. Horton, C. B. Mccusker, L. S. Peak, J. Ulrichs, M. M. Winn, “Muon-size spectrum of large EAS”, Proc. 18th ICRC, Bangelore, 6 (1983) 124.
- (21) A.M. Hillas, J.D. Hollows, H.W. Hunter, D.J. Marsden, “Calculated density distributions of particles in air showers, and their sensitivity to primary mass and assumed interaction characteristics”, Proc. 12th ICRC, Hobart, 3 (1971) 1007.
- (22) A. Aab et al. [Pierre Auger Collaboration], “The Pierre Auger Observatory: Contributions to the 35th International Cosmic Ray Conference (ICRC 2017),” arXiv:1708.06592 [astro-ph.HE].
- (23) D. Heck, J. Knapp, J. N. Capdevielle, G. Schatz and T. Thouw, “CORSIKA: A Monte Carlo code to simulate extensive air showers,” (1998) FZKA-6019.
- (24) S. Ostapchenko, “Monte Carlo treatment of hadronic interactions in enhanced Pomeron scheme: I. QGSJET-II model,” Phys. Rev. D 83 (2011) 014018 [arXiv:1010.1869 [hep-ph]].
- (25) T. Pierog et al., “EPOS LHC: Test of collective hadronization with data measured at the CERN Large Hadron Collider,” Phys. Rev. C 92 (2015) 034906 [arXiv:1306.0121 [hep-ph]].
- (26) F. Riehn, R. Engel, A. Fedynitch, T. K. Gaisser and T. Stanev, EPJ Web Conf. 99, 12001 (2015) [arXiv:1502.06353 [hep-ph]].
- (27) G. Battistoni et al., “The FLUKA code: Description and benchmarking”, AIP Conf. Proc. 896 (2007) 31.
- (28) M. Kobal [Pierre Auger Collaboration], “A thinning method using weight limitation for air-shower simulations,” Astropart. Phys. 15 (2001) 259.