Depletion of heavy nitrogen in the cold gas of star-forming regions
Abstract
We investigate nitrogen isotope fractionation in forming and evolving molecular clouds using gas-ice astrochemical simulations. We find that the bulk gas can become depleted in heavy nitrogen (15N) due to the formation of 15N-enriched ices. Around the chemical transition from atomic nitrogen to \ceN2, N15N is selectively photodissociated, which results in the enrichment of 15N in atomic nitrogen. As 15N-enriched atomic nitrogen is converted to ammonia ice via grain surface reactions, the bulk gas is depleted in 15N. The level of 15N depletion in the bulk gas can be up to a factor of two compared to the elemental nitrogen isotope ratio, depending on the photodesorption yield of ammonia ice. Once the nitrogen isotopes are differentially partitioned between gas and solids in a molecular cloud, it should remain in the later stages of star formation (e.g., prestellar core) as long as the sublimation of ammonia ice is inefficient. Our model suggests that all the N-bearing molecules in the cold gas of star-forming regions can be depleted in 15N, which is at least qualitatively consistent with the observations toward prestellar core L1544. In our models, icy species show both 15N and deuterium fractionation. The fractionation pattern within ice mantles is different between 15N and deuterium, reflecting their fractionation mechanisms; while the concentration of deuterium almost monotonically increases from the lower layers of the ice mantles to the upper layers, the concentration of 15N reaches the maximum at a certain depth and declines towards the surface.
1 Introduction
Molecular isotope ratios are essential tools to investigate the origin of solar system materials and their possible chemical link with interstellar materials. Nitrogen has two isotopes, 14N and 15N. The most primitive materials in the solar system, such as cometary ices (e.g., HCN and \ceNH3), show the enrichment of 15N by a factor of up to several compared to the Sun (e.g., Marty et al., 2011; Mumma & Charnley, 2011; Shinnaka et al., 2016). There remain open questions as to what the main cause of 15N fractionation in the solar system materials was, and when and where the fractionation was implemented. To address these questions, studies of 15N fractionation in star- and planet-forming regions are crucial.
The elemental abundance ratio [14N/15N]elem in the local ISM has been estimated to be 200-300 from observations toward diffuse clouds. Ritchey et al. (2015) estimated [14N/15N] from the studies of CN absorption lines in the optical, while Lucas & Liszt (1998) estimated [14N/15N] from the studies of HCN absorption lines in the mm range. In diffuse clouds, nitrogen isotope fractionation would be efficient neither by isotope exchange reactions nor by isotope selective photodissociation of \ceN2 (see below), given that the gas temperature is warm (20 K) and the majority of elemental nitrogen is likely present in the atomic form (e.g., Knauth et al., 2004; Ritchey et al., 2015). The estimated [14N/15N]elem ratio in the local ISM is lower than that in the Sun (441, Marty et al., 2011), indicating the galactic chemical evolution over the last 4.6 billion years (e.g., Romano et al., 2017).
Recent observations have quantified the degree of 15N fractionation in various molecules in low-mass dense cores (e.g., Bizzocchi et al., 2013; Daniel et al., 2013, 2016; Gerin et al., 2009; Hily-Blant et al., 2013a, b). The measurements in L1544 (prestellar core) and B1 (a core possibly harboring the first hydrostatic core; e.g., Pezzuto et al., 2012) are summarized in Table 1. Among the measurements, the depletion of 15N in \ceN2H+ is the most puzzling, because its parent molecule, \ceN2, may be the primary reservoir of gaseous nitrogen and because astrochemical models have failed to explain this trend as discussed below. In particular, in L1544 \ceN2H+ is depleted in 15N by a factor of around four compared to [14N/15N]elem in the local ISM (Bizzocchi et al., 2013).
| L1544a),a),footnotemark: b),b),footnotemark: c),c),footnotemark: d)d)footnotemark: | B1e)e)footnotemark: | Modelf)f)footnotemark: | |||
|---|---|---|---|---|---|
| \ceN2H+/N15NH+ | 400 | 524 (517,518) | 410 (405,406) | 313 (308,310) | |
| \ceN2H+/15NNH+ | 600 | 524 (517,518) | 411 (405,407) | 315 (312,310) | |
| \ceNH3/15\ceNH3 | – | 300 | 372 (447,492) | 400 (371,388) | 374 (290,297) |
| \ceNH2D/15\ceNH2D | 700 | 230 | 371 (448,492) | 384 (371,388) | 349 (289,297) |
| CN/C15Ng)g)footnotemark: | 290 | 335 (383,501) | 292 (338,383) | 224 (257,276) | |
| HCN/HC15Ng)g)footnotemark: | 257 | 330 | 342 (390,502) | 306 (349,385) | 244 (271,280) |
| N/15N (bulk gas) | – | – | 495 (513,518) | 410 (408,407) | 320 (314,311) |
| \ceNH3/15\ceNH3 (ice) | – | – | 292 (292,282) | 272 (274,276) | 246 (252,259) |
| \ceHCN/HC15N (ice) | – | – | 274 (293,326) | 238 (276,283) | 193 (196,220) |
The chemical network of nitrogen isotope fractionation triggered by isotope exchange reactions was proposed by Terzieva & Herbst (2000) and updated by Roueff et al. (2015). Following these works, there have been many numerical studies on nitrogen isotope fractionation in molecular clouds and prestellar cores in the framework of pseudo-time-dependent models (e.g., Charnley & Rodgers, 2002; Rodgers & Charnley, 2008a; Wirström et al., 2012; Hily-Blant et al., 2013b; Roueff et al., 2015; Wirström & Charnley, 2017). These models are diverse in terms of the primary nitrogen reservoir in the gas phase (N I or \ceN2), the degree of CO freeze out (from non-depleted to fully depleted), the adopted chemical network (e.g., with or without nuclear spin state chemistry of \ceH2), and physical conditions (density of 104-6 cm-3). Neverthless, common qualitative prediction is that N I is depleted in 15N, while \ceN2 is enriched in 15N. This is a natural consequence of the lower zero point energy of N15N compared to 14\ceN2 (e.g., Roueff et al., 2015). Since \ceN2H+ forms from \ceN2, the previous models have predicted that \ceN2H+ is enriched in 15N, which contradicts the observations (Wirström et al., 2012). Moreover, Roueff et al. (2015) have shown that the 15N fractionation triggered by isotope exchange reactions is much less effective than had been previously thought, due to the presence of activation barriers for some key reactions, such as 15N + \ceN2H+.
On the other hand, 15N depletion in \ceN2H+ could be explained by isotope selective photodissociation of \ceN2 (Liang et al., 2007; Heays et al., 2014). Photodissociation of \ceN2 is subject to self-shielding (Li et al., 2013). Because N15N is much less abundant than \ceN2, N15N needs a higher column density of the ISM gas for self-shielding than 14\ceN2. As a result, in some regions, N15N is selectively photodissociated with respect to \ceN2, and then \ceN2 is depleted in 15N, while the photofragment, N I, is enriched in 15N. Heays et al. (2014) developed a depth-dependent pseudo-time-dependent model of a molecular cloud, considering both isotope selective photodissociation of \ceN2 and a set of nitrogen isotope exchange reactions. They found that the isotope selective photodissociation is at work and \ceN2 (and \ceN2H+) are depleted in 15N, but only in the chemical transition zone from N I to \ceN2, where the interstellar FUV radiation field is not significantly attenuated, i.e., visual extinction of a few mag. Prestellar cores, however, typically have higher visual extinction (10 mag for a dust continuum peak) compared to their cloud model.
In this paper, we propose that nitrogen isotope fractionation in prestellar cores are largely inherited from their parent clouds, where interstellar UV radiation can penetrate, based on our physico-chemical models. We investigate the nitrogen isotope fractionation in a forming and evolving molecular cloud via converging flow. As in Heays et al. (2014), N I is enriched in 15N at the N I/\ceN2 chemical transition via isotope selective photodissociation of \ceN2. In our models, 15N-enriched N I is frozen out onto grains and converted to \ceNH3 ice, which depletes 15N from the bulk gas. Once the nitrogen isotopes are differentially partitioned making 15N-depleted gas and 15N-enriched solids in a molecular cloud, it should remain in the later stages of star formation (e.g., prestellar core) as long as dust temperature is cold and ice sublimation is inefficient. This process can be seen as an analog of oxygen isotopic anomaly production in the solar system materials through isotope selective photodissociation of CO (Clayton, 2002; Yurimoto & Kuramoto, 2004; Füri & Marty, 2015), while, to the best of our knowledge, it has never been investigated in details.
This paper is organized as follows. We describe our physical and chemical models in Section 2. In Section 3, we show that the bulk gas becomes depleted in 15N in our models and discuss the mechanism. In Section 4, we extend our model to the prestellar core phase, which is compared to the prestellar core observations. The nitrogen and dueterium isotope fractionation of icy species are also briefly discussed. We conclude this paper in Section 5.
2 Model
We simulate molecular evolution in a forming and evolving molecular cloud. Since our physical and chemical models are similar to those in Furuya et al. (2015) and Furuya & Persson (2018) except for the inclusion of 15N fractionation chemistry, we present here the brief summary of the models.
2.1 Physical model
One of the plausible scenarios of molecular cloud formation is that diffuse H I gas is compressed by super-sonic accretion flows (e.g., Inoue & Inutsuka, 2012). To simulate the physical evolution of post-shock materials (i.e., forming cloud), we use the steady shock model developed by Bergin et al. (2004) and Hassel et al. (2010). The model solves the conservation laws of mass and momentum with the energy equation, considering time-dependent cooling/heating rates and simplified chemistry in a plane parallel configuration. The cloud is assumed to be irradiated by the Draine field (Draine, 1978) and the cosmic ray ionization rate is set to be s-1. As time proceeds, the column density of post-shock materials increases, which assists molecular formation by attenuating the UV radiation. The column density of post-shock materials at a given time after passing through the shock front is , where and are preshock H I gas density and velocity of the accretion flow, respectively. We convert into visual extinction, , by the formula . The simulation is performed until reaches 3 mag (i.e., 12 Myr). In the most of the simulation time, the density and temperature of the cloud is 104 cm-3 and 10-15 K, respectively (see Fig. 2 of Furuya et al., 2015).
2.2 Chemical model
Our astrochemical model takes into account gas-phase chemistry, interactions between gas and (icy) grain surfaces, and grain surface chemistry. We adopt a three phase model (Hasegawa & Herbst, 1993b), assuming the top four monolayers are chemically active; the rest of the ice mantles are assumed to be inert. Our chemical network is based on the gas-ice network of Garrod & Herbst (2006) and has been extended to include deuterium chemistry (up to triply deuterated species) and nuclear spin state chemistry of \ceH2, \ceH3+, and their isotopologues. For this work, we excluded species containing chlorine, phosphorus, or more than three carbon atoms in order to shorten the computational time. In our model, the ortho-to-para ratio of \ceH2 is mostly determined by the competition between two processes; the ratio is three upon the formation of \ceH2 on grain surfaces (e.g., Watanabe et al., 2010), while the ratio is reduced via the proton exchange reactions between \ceH2 and \ceH+ (or \ceH3+) (e.g., Honvault et al., 2011). The reaction rate coefficients of the \ceH2-\ceH3+ system is taken from Hugo et al. (2009). Gas-phase nitrogen chemistry has been updated referring to Wakelam et al. (2013) and Loison et al. (2014). For this work, the chemical network is extended to include mono-15N species, relevant isotope exchange reactions (Roueff et al., 2015), and isotope selective photodissociation of \ceN2 (Li et al., 2013; Heays et al., 2014). We therefore added 460 species and 26,000 reactions to our reduced deuterated network, resulting in the increase of the number of species from 1350 to 1810 and the number of reactions from 73,000 to 99,000.
The binding energy of each species is not constant in our simulations, but depends on the composition of an icy surface, following the method presented in Furuya & Persson (2018). The binding energy of species , , is calculated as a function of surface coverage of species , , where = \ceH2, CO, \ceCO2, or \ceCH3OH:
| (1) |
where is the binding energy of species on species . The set of the binding energies on water ice, , is taken from Garrod & Herbst (2006) and Wakelam et al. (2017). In particular for this study, are set to be 550 K for H I and \ceH2, 720 K for N I, 1170 K for \ceN2, and 5500 K for \ceNH3 (Collings et al., 2004; Fayolle et al., 2016; Minissale et al., 2016). There is no laboratory data or estimate for most in the literature. In order to deduce for all species, where is either \ceH2, CO, \ceCO2, or \ceCH3OH, we assume scaling relations (cf. Taquet et al., 2014),
| (2) |
where is . We adopt = 23/550, = 855/1300, = 2300/2690, and = 4200/5500 (e.g., Öberg et al., 2005; Cuppen & Herbst, 2007; Noble et al., 2012). For example, the binding energy of \ceN2 becomes 770 K in our simulations when an icy surface is fully covered by CO (Öberg et al., 2005; Fayolle et al., 2016). For sticking probabilities of gaseous species onto (icy) grain surfaces, we use the formula recommended by He et al. (2016, their Eq. 1), which leads to the sticking probability of around unity for all species for the relevant temperature range in our physical model. For 15N- and/or D-bearing species, we use the same binding energies and sticking probabilities as for normal species. The exception is the binding energy of atomic deuterium, whose binding energy is set to be 21 K higher than that of atomic hydrogen (Caselli et al., 2002). Adsorption rates are inversely proportional to the square root of the mass of species, so that adsorption of gaseous species tends to make the bulk gas enriched in heavier isotopes, D and 15N. This effect is not important especially for 15N, because the difference in the rates is only a few %.
As non-thermal desorption processes, we consider stochastic heating by cosmic-rays, photodesorption, and chemical desorption (e.g., Hasegawa & Herbst, 1993a; Westley et al., 1995; Garrod et al., 2007). We assume that species formed by surface reactions are desorbed by chemical desorption with the probability of roughly 1 % (Garrod et al., 2007). Photodissociation rates of icy species are calculated in the same way as Furuya et al. (2015). Photodissociation occurs only in the surface layers (i.e., top four monolayers) in our model, since the rest of ice mantle is assumed to be chemically inert. In other words, photofragments is assumed to immediately recombine in the bulk ice mantle in our model (Furuya et al., 2017). According to molecular dynamics (MD) simulations, there are several possible outcomes after a UV photon dissociates water ice; (i) the photofragments are trapped on the surface; (ii) either of the fragments is desorbed into the gas phase; (iii) the fragments recombine and the product is either trapped on the surface or desorbed into the gas phase, etc. (Andersson & van Dishoeck, 2008; Arasa et al., 2015, ; see also e.g., Hama et al. (2010) for experimental studies). Note that desorption of the photofragments or the recombination product occurs from the top several monolayers only (Andersson & van Dishoeck, 2008; Arasa et al., 2015). To the best of our knowledge, similar MD simulations for other molecules have not been reported in the literature. For water ice photodissociation, we consider all the possible outcomes and their branching ratios found by the MD simulations of Arasa et al. (2015). For photodissociation of other icy species, we assume the same branching ratios as in the gas-phase photodissociation, and that all the photofragments are trapped on the surface for simplicity. For those species, photodesorption rate is given as following, separately from photodissociation rate:
| (3) |
where is the number density of dust grains, is the radius of dust grains (0.1 m), and are the interstellar and cosmic-ray induced FUV photon fluxes, respectively, is the parameter for the attenuation of interstellar radiation field by dust grains, is the ptotodesorption yield per incident FUV photon for thick ice (4 monolayers), and is the number of monolayers of the whole ice mantle. The parameter is the surface coverage of species , which is defined as a fractional abundance of species in the top four monolayers. The photodesorption yield for \ceN2 ice per incident FUV photon is given as an increasing function of the surface coverage of CO, varying from to (Bertin et al., 2013). We assume that \ceNH3 ice is photodesorbed intact (as \ceNH3) with the yield of . This value is similar to the recently measured photodesorption yield for pure \ceNH3 ice in laboratory (, Martin-Domenech et al., 2017), but the yield would depend on ice compositions and the FUV spectrum adopted in experiments (Ligterink et al., 2015; Martin-Domenech et al., 2017). The dependence on the \ceNH3 photodesorption yield is discussed in Section 3.2. We assume the same photodesorption yields for 15N- and/or D-bearing species as for normal species.
Elemental abundance ratios for H:He:C:N:O:Na:Mg:Si:S:Fe are 1.00:9.75(-2):7.86(-5):2.47(-5):1.80(-4):2.25(-9):1.09(-8):9.74(-9):9.14(-8):2.74(-9), where means (Aikawa & Herbst, 1999). Elemental abundance ratios, [D/H]elem and [N/15N]elem, are set to be and 300, respectively (Linsky, 2003; Ritchey et al., 2015). All the elements, including hydrogen, are initially in the form of either neutral atoms or atomic ions, depending on their ionization energy.
3 Result
3.1 Fiducial model
Figure 1(a) shows abundances of N-bearing species as functions of . With increasing , N I is gradually converted to \ceNH3 ice and \ceN2. At the final simulation time in our model (12 Myr), which corresponds to mag, most nitrogen is locked in molecules, and the fraction of elemental nitrogen in N I, \ceN2 (gas+ice), and \ceNH3 ice are 0.05 %, 20 % and 80 %, respectively. Note that 90 % of nitrogen is in ice at mag. In our models, the partitioning of elemental nitrogen among the three species depends on the photodesorption yield of ammonia ice as shown in Furuya & Persson (2018) and briefly discussed in Section 3.2. Observationally, the primary nitrogen reservoir in dense star forming regions is not well constrained, although it has been expected to be either N I, gaseous \ceN2, or icy N-bearing species, such as \ceN2 and \ceNH3 (e.g., Maret et al., 2006; Daranlot et al., 2012).
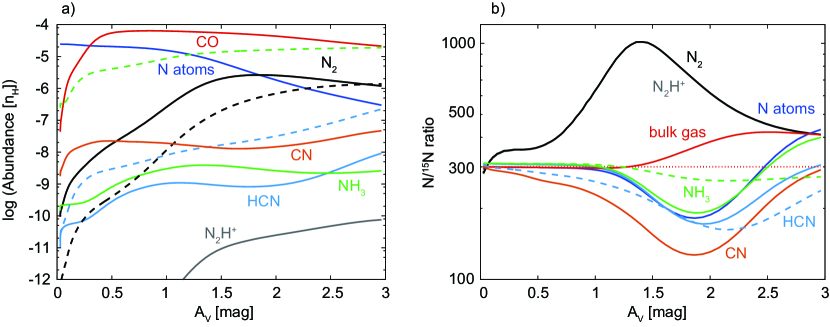
The N/15N abundance ratios in selected species are shown in Figure 1(b). In our model, 15N fractionation is predominantly caused by isotope selective photodissociation of \ceN2 rather than isotope exchange reactions. At mag, the primary reservoir of nitrogen in the gas phase changes from N I to \ceN2. Around this N I/\ceN2 transition, N I is significantly enriched in 15N (a factor of up to two compared to [N/15N]elem), while \ceN2 is significantly depleted in 15N. Isotope selective photodissociation of \ceN2 is at work only in the limited regions (), where the interstellar UV radiation field is not significantly attenuated (see also Heays et al., 2014). On the other hand, it is seen that the N/15N ratio of the bulk gas starts to increase around the N I/\ceN2 transition. This is due to the freeze out of 15N-enriched N I and subsequent \ceNH3 ice formation, which result in the 15N depletion in the bulk gas. Even at mag, where \ceN2 photodissociation is negligible, the bulk gas is depleted in 15N with the N/15N ratio of 400. The freeze-out of \ceN2 is less efficient than that of N I in our fiducial model, because adsorbed \ceN2 does not react with other species in contrast to N I, and adsorbed \ceN2 partly goes back to the gas phase via photodesorption and stochastic heating by cosmic rays. The binding energy of \ceN2 is much lower than that of \ceNH3, while the photodesorption yield of \ceN2 is higher than that of \ceNH3 in our fiducial model (3 versus 10-3). Then most nitrogen lost from the gas phase is in the form of N I rather than \ceN2 around the N I/\ceN2 transition in our fiducial model, leading to the 15N depletion in the bulk gas.
3.2 Dependence on the ptotodesorption yield of \ceNH3 ice
The degree of 15N depletion in the bulk gas depends on how much of 15N I is frozen out and converted to 15\ceNH3 ice around the N I/\ceN2 transition. The dominant destruction process of \ceNH3 ice in our fiducial model is photodesorption, assuming the yield of 10-3 per incident FUV photon. It is expected that the degree of 15N depletion in the bulk gas depends on the \ceNH3 photodesorption yield (). Note that photodissociation of \ceNH3 ice, the products of which are assumed to be \ceNH2ice + Hice or \ceNHice + \ceH2ice, is included in our model with much higher rate than its photodesorption (by a factor of 10). A significant fraction of the photofragments, however, is hydrogenated to reform \ceNH3 ice. The late limiting step of \ceNH3 ice formation is adsorption of N I onto grain surfaces in our model, and the reformation of \ceNH3 ice via surface hydrogenation reactions is efficient enough to compensate for its photodissociation. Then the dominant destruction process of \ceNH3 ice is photodesorption rather than photodissociation. In our fiducial model, the rates of photodissociation and photodesorption of \ceNH3 ice are calculated separately, while the MD simulations have shown that, at least for water ice, photodesorption is some of the possible outcomes of photodissociation (e.g., Andersson & van Dishoeck, 2008). In order to investigate the dependence of our results on the assumptions on photodissociation and photodesorption of \ceNH3 ice, we ran an additional model, in which photodissociation of \ceNHn ice (n = 1, 2, 3) leads to several outcomes, including desorption of \ceNHn or \ceNH(n-1), assuming that the probability of each outcome is the same as that of water ice photodissociation obtained by the MD simulations of Arasa et al. (2015). The most significant difference between this modified model and our fiducial model is that in the former, photodissociation of \ceNHn ice most likely leads to \ceNH(n-1)ice + Hgas rather than \ceNH(n-1)ice + Hice. In the modified model, the total photodesorption yield of \ceNH3 ice (desorbed as \ceNH2 or \ceNH3) per incident photon is . We confirmed that our result is robust; the bulk gas is depleted in 15N with the N/15N ratio of 440 at mag in the modified model. The evolution of the abundances and the N/15N ratios of the major nitrogen species is also similar in the fiducial and modified models. In the rest of this paper, we use our original treatment of photodissociation and photodesorption of \ceNH3 ice, but varying .
Figure 2 depicts variations of the N/15N ratio in the bulk gas (panel a) and in the bulk ice (panel b) when is varied in the range between and . In general, the model with lower shows the larger level of 15N depletion in the bulk gas. The bulk gas 15N depletion is most significant in the model with ; N/15N ratio is 500, which is comparable to some of the observed molecular N/15N ratios (see Section. 4.1). Compared to the degree of the bulk gas 15N depletion, the enrichment of 15N in the bulk ice is modest, because more nitrogen is present in the ice than in the gas phase.
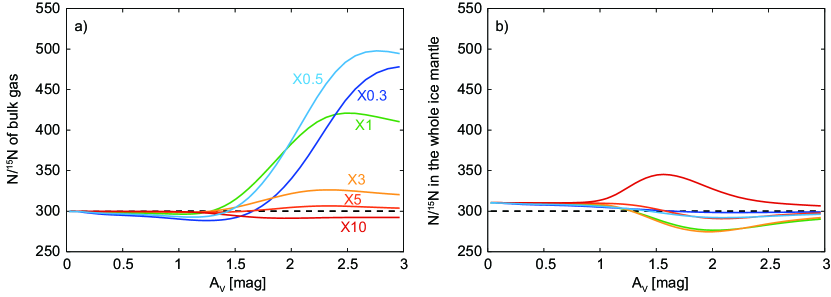
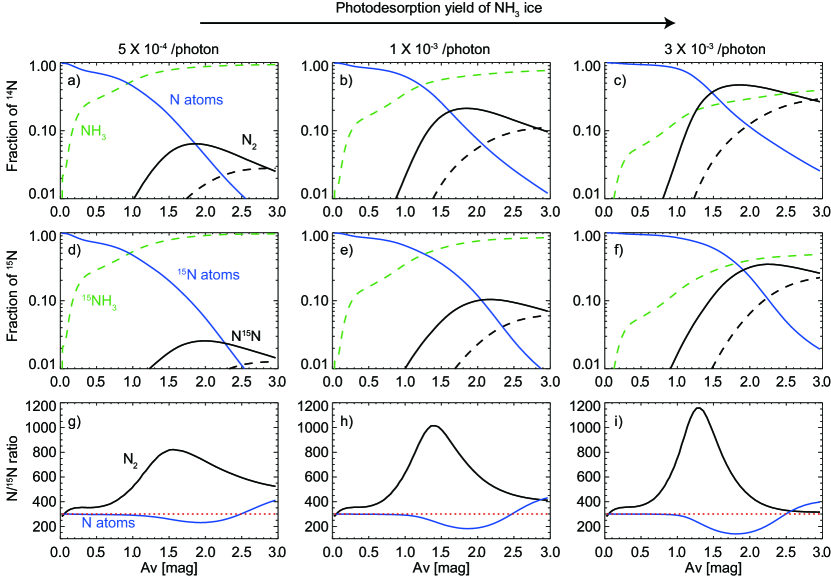
Figure 3 shows fractions of elemental 14N (panels a,b,c) and 15N (d,e,f) locked in N I, \ceN2, and \ceNH3 as functions of in the models with (left panels), (middle, our fiducial model), and (right). With increasing , the fraction of nitrogen in \ceNH3 ice is reduced, while that in \ceN2 is enhanced (Furuya & Persson, 2018). In the models with higher , the self-shielding of \ceN2 is more efficient, which makes the N I/\ceN2 transition sharper, and enhances the maximum level of 15N enrichment in N I (Fig. 3, panels g,h,i). Neverthless, with increasing the level of the bulk gas 15N depletion is lowered as discussed above. The 15N fractionation between the gas and the ice mostly occurs between the 14N I/14\ceN2 transition and the 15N I/14N15N transition. With increasing , the accumulation of \ceNH3 ice is slowed down, while the 14\ceN2/14N I abundance ratio in the gas phase becomes higher between the two transitions. Then the freeze out of 15N-depleted \ceN2 becomes more important with increasing , which (partly) cancels out the bulk gas 15N depletion through the freeze out of 15N-enriched N I. In the model with , where the photodesorption yield of \ceNH3 ice is higher than that of \ceN2 ice, the bulk gas becomes slightly enriched in 15N, because more \ceN2 than N I is frozen out.
4 Discussion
4.1 Comparisons with observations
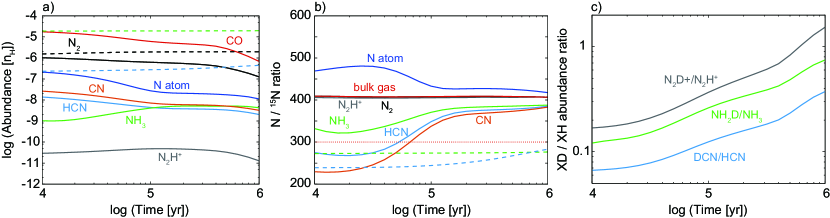
Table 1 compares the observed and model N/15N ratios of \ceN2H+, gaseous \ceNH3, and nitriles (HCN and CN). Note that the observed N/15N ratios for the nitriles are derived from the observations of the corresponding 13C isotopologues, assuming that the molecular C/13C ratios are the same as the elemental C/13C ratio. The observationally derived N/15N ratio for the nitriles may be considered as lower limits (see Roueff et al., 2015). As a general trend in our models, the N/15N ratio decreases in the order, \ceN2H+, \ceNH3, and the nitriles. Since our model in the previous section is more appropriate for molecular clouds than for prestellar cores, we further run our astrochemical models under prestellar core conditions ( cm-3, 10 K, and 10 mag) for 106 yr, using the molecular abundances at mag as the initial abundances. Figure 4 shows the temporal evolution of abundances (panel a) and the N/15N ratios (panel b) of selected species under the prestellar core conditions in the model with (see also Table 1). The abundances of CO and \ceN2 decrease with time due to freeze-out, while the drop of CO abundance is more significant than that of \ceN2. The \ceN2H+ abundance is relatively constant, because their formation and destruction rates depend on the abundances of \ceN2 and CO, respectively. The gaseous \ceNH3 abundance increases with time, because the CO freeze-out leads to the enhanced conversion rate from \ceN2 to \ceNH3 (e.g., Aikawa et al., 2005). It is confirmed that the 15N depletion in the bulk gas is almost preserved, while the differences in the N/15N ratios among the molecules become smaller with time. The latter point indicates that 15N fractionation by isotope exchange reactions is not efficient in the prestellar core conditions which is consistent with the model of Roueff et al. (2015). Although the rate of cosmic-ray induced photodissociation of N15N is higher than that of \ceN2, this process does not contribute to 15N fractionation in prestellar cores; destruction of \ceN2 by \ceHe+. which is the product of cosmic-ray ionization of atomic \ceHe, is much faster than cosmic-ray induced photodissociation of \ceN2 (Heays et al., 2014). Deuterium fractionation, which is driven by hydrogen isotope exchange reactions, becomes more efficient with time under the prestellar core conditions (Figure 4c). The different time dependence (or no clear correlation) between 15N and deuterium fractionation has been reported by Fontani et al. (2015) and De Simone et al. (2018), based on the observations of \ceN2H+, \ceN2D+, and 15N isotopologues of \ceN2H+ towards a sample of high-mass and low-mass star-forming cores.
In the models with , all the species in Table 1 are depleted in 15N, which is consistent with the observations in L1544 qualitatively, but the models still underestimate the degree of 15N depletion, in particular, in \ceN2H+. The results presented in this paper are based on a specific physical model. More numerical studies, varying physical parameters, are necessary to better understand the 15N observations.
Additional comments on each species are as follows. \ceN2H+ is a daughter molecule of \ceN2, and thus the N/15N ratio of \ceN2H+ follows that of \ceN2. The N15NH+/15NNH+ ratio is around unity throughout our simulations, which is consistent with the observations in L1544, but inconsistent with those in B1. The only known process so far that could deviate the N15NH+/15NNH+ ratio from unity is the isotope exchange reaction between N15N and \ceN2H+ (Adams & Smith, 1981; Roueff et al., 2015). This pathway would be inefficient in the ISM, since the exchange reaction competes with destruction of \ceN2H+ by CO, which would be much faster. Gaseous \ceNH3 is mainly produced by photodesorption of \ceNH3 ice with some contribution from the sequential ion-neutral reactions, starting from \ceN2 + \ceHe+. Then the N/15N ratio of gaseous \ceNH3 follows that of N I. Wirström et al. (2012) found that gaseous \ceNH3 can be significantly depleted in 15N (by a factor of around two compared to [N/15N]elem) in some conditions as a result of competition among the three reactions, 15\ceN+ + \ceN2, 15\ceN+ + \ceCO, and 15\ceN+ + \ceH2. The necessary conditions are , where is the abundance of species with respect to hydrogen nuclei and OPR(\ceH2) is the ortho-to-para ratio of \ceH2. In our models, in which adsorption and desorption of N I, \ceN2, and CO are considered, \ceN2 is less abundant than CO in the gas phase, even though the binding energy of \ceN2 is set to be lower than that of CO. Then the mechanism found by Wirström et al. (2012) does not work in our models. The critical assumptions in the models of Wirström et al. (2012) and Wirström & Charnley (2017) are that N I and \ceN2 do not freeze out onto grain surfaces, while CO does, leading to after several freeze-out timescales. CN and HCN are produced from N I. Their N/15N ratios basically follow that of N I, but more enriched in 15N, due to the isotope exchange reaction between CN and 15N (Roueff et al., 2015).
4.2 15N and deuterium fractionation in icy species
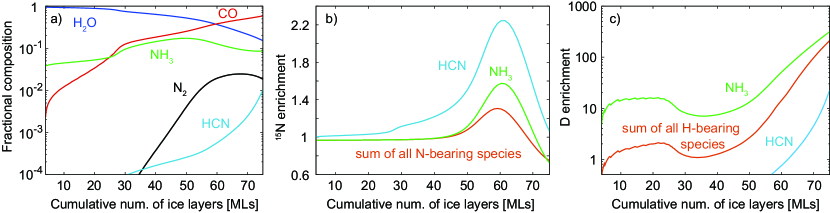
Figure 5 shows the fractional composition (panel a), the 15N enrichment (panel b) and the deuterium enrichment (panel c) in \ceNH3 and HCN ices as functions of cumulative number of ice layers formed in our fiducial model. Around 75 monolayers (MLs) of ice in total are formed by = 3 mag. \ceH2O is the dominant component in the lower ice layers (60 MLs), while CO becomes more abundant than \ceH2O in the upper ice layers. The CO/\ceH2O ratio in the whole ice mantle is 40 % in our model, which is similar to the the observed median ice composition toward back ground stars (31 %, Öberg et al., 2011). The \ceNH3/\ceH2O and \ceHCN/\ceH2O ratios in the whole ice mantle are 17 % and 0.2 %, respectively, in our fiducial model. To the best of our knowledge, no measurements are available for \ceNH3 ice and HCN ice toward back ground stars in the literature. The \ceNH3/\ceH2O ice ratio in our model is higher than the observed median ratio toward low-mass and high-mass protostars (Öberg et al., 2011, and references therein) by a factor of 3, as often reported in published astrochemical models (e.g., Chang & Herbst, 2014; Furuya et al., 2015; Pauly & Garrod, 2016). If the \ceNH3 and \ceNH4+ ice abundances toward the protostellar sources are summed up (see Table 3 of Öberg et al., 2011), the discrepancy still remains, but becomes smaller (within a factor of 2).
The \ceNH3 and HCN in the whole ice mantles are enriched both in deuterium and 15N compared to the elemental ratios, but the degrees of the enrichment are significantly different. In our fiducial model, the \ceNH2D/\ceNH3 ratio and the DCN/HCN ratio in the whole ice mantles are and , respectively, while the N/15N ratios of \ceNH3 ice and HCN ice are 270 and 240, respectively (Table 1). The level of 15N enrichment in the icy species weakly depends on . For example, in the model with , the N/15N ratios of \ceNH3 ice and HCN ice in the whole ice mantles are 250 and 190, respectively, which are lower than those in the fiducial model. This trend can be understood, recalling that the maximum level of 15N enrichment in N I is higher with increasing (Fig. 3, panels g,h,i) and that \ceN2 ice does not react with other species to form \ceNH3 ice or \ceHCN ice. Another factor is the timing of \ceNH3 ice formation; in the models with lower , the amount of \ceNH3 ice formed prior to the N I/\ceN2 chemical transition, which is not fractionated in 15N, is higher (Fig. 3, panels a,b,c). This early formed unfractionated \ceNH3 ice can overshadow later formed 15N enriched \ceNH3 ice. Then, stronger 15N depletion in the bulk gas does not necessarily mean stronger 15N enrichment of icy species in our proposed scenario. On the other hand, regardless of , our model predicts that the N/15N ratios of icy HCN and icy \ceNH3 are lower than those of corresponding gaseous molecules. This prediction can be observationally tested by comparing a molecular N/15N ratio in the warm gas (100 K) around protostars, where all ices sublimate, with that in the cold outer envelope; the molecular N/15N ratio in the warm gas should be lower than that in the cold gas.
The fractionation pattern within the ice mantles is different between deuterium and 15N. The concentration of 15N is nonmonotonic within the ice mantles, while that of deuterim increases from the lower layers to the upper layers. This is a direct consequence that 15N fractionation is triggered by isotope selective photodissociation of \ceN2, while deuterium fractionation is caused by isotope exchange reactions; the former is most efficient at certain , while the latter becomes more efficient with time. The signatures of the different fractionation mechanisms are preserved in the ice layered structure. This prediction could be observationally tested by comparing the \ceNH3/15\ceNH3 ratio with the \ceNH2D/15\ceNH2D ratio in the warm gas (100 K) around protostars, where all ices sublimate; the \ceNH3/15\ceNH3 ratio should be lower than \ceNH2D/15\ceNH2D. Note that if nitrogen fractionation occurs by isotope exchange reactions as deuterium fractionation, the \ceNH3/15\ceNH3 ratio should be larger than \ceNH2D/15\ceNH2D (see Fig. 4 of Rodgers & Charnley, 2008b).
5 Conclusion
The nitrogen fractionation in the ISM has been a puzzling question. Previous astrochemical models, which investigate nitrogen isotope fractionation in prestellar cores, have faced difficulties to explain the observations, in particular 15N depletion in \ceN2H+ in prestellar cores. In this study, we have proposed that nitrogen fractionation in prestellar cores are largely inherited from their parent clouds, which are not fully shielded from the interstellar UV radiation, based on our physico-chemical models of molecular clouds. Around the N I/\ceN2 chemical transition, N I is enriched in 15N, while \ceN2 is depleted in 15N via isotope selective photodissociation of \ceN2. N I is adsorbed onto grain surfaces and converted into \ceNH3 ice by surface reactions, while adsorbed \ceN2 does not react with any other species. As long as the non-thermal desorption (especially photodesorption in our models) of \ceNH3 ice is less efficient than that of \ceN2 ice, the net effect is the loss of 15N from the gas phase, producing the 15N-enriched ice. Once the nitrogen isotopes are differentially partitioned between gas and ice in a molecular cloud, it should remain in the later stages of star formation (e.g., prestellar core) as long as dust temperature is cold and ice sublimation is inefficient. If this is the case, 15N fractionation in dense cores depends on the environments where the cores were formed, rather than the current physical conditions of the cores. The results presented in this paper are based on a specific physical model. More numerical studies of 15N fractionation prior to the formation of dense cores, varying physical parameters, are necessary to better understand the 15N observations.
The proposed fractionation mechanism is closely related to the conversion of N I to \ceN2 in the gas phase. Regardless of the assumed value of the photodesorption yield of ammonia ice, the N I/\ceN2 transition occurs before reaches 3 mag in our models, where one-sided irradiation geometry is employed with the Draine UV radiation field. Such modest UV attenuation at the transition zone is necessary for the 15N depletion in the bulk gas, although it is not easy to observationally constrain when and where the N I/\ceN2 transition occurs in the sequence of star formation. If the depletion of 15N in the bulk gas is observationally confirmed, it not only verifies our model, but also suggests that the N I/\ceN2 transition already occurs in the regions, where external UV radiation field is not fully shielded.
References
- Adams & Smith (1981) Adams, N. G. & Smith, D. 1981, ApJ, 247, L123
- Aikawa & Herbst (1999) Aikawa, Y., & Herbst, E. 1999, ApJ, 526, 314
- Aikawa et al. (2005) Aikawa, Y., Herbst, E., Roberts, H., & Caselli, P., 2005, ApJ, 620, 330
- Andersson & van Dishoeck (2008) Andersson, S., & van Dishoeck, E. F. 2008, A&A, 491, 907
- Arasa et al. (2015) Arasa, C, Koning, J., Kroes, G.-J.,Walsh, C., & van Dishoeck, E. F. 2015, A&A, 575, A121
- Bergin et al. (2004) Bergin, E. A., Hartmann, L.W., Raymond, J. C., & Ballesteros-Paredes, J. 2004, ApJ, 612, 921
- Bertin et al. (2013) Bertin, M., Fayolle, E. C., Romanzin, C., et al. 2013, ApJ, 779, 120
- Bizzocchi et al. (2013) Bizzocchi, L., Caselli, P., Lenardo, E., & Dore, L. 2013, A&A, 555, 109
- Caselli et al. (2002) Caselli, P., Stantcheva, T., Shalabia, O., Shematovich, V. I., & Herbst, E. 2002, P&SS, 50, 1257
- Chang & Herbst (2014) Chang, Q., & Herbst, E. 2014, ApJ, 787, 135
- Charnley & Rodgers (2002) Charnley, S. B., & Rodgers, S. D. 2002, ApJ, 569, L133
- Clayton (2002) Clayton, R. N. 2002, Nature, 415, 860
- Collings et al. (2004) Collings, M. P., Anderson, M. A., Chen, R., et al. 2004, MNRAS, 354, 1133
- Cuppen & Herbst (2007) Cuppen, H. M., & Herbst, E. 2007, ApJ, 668, 294
- Daniel et al. (2016) Daniel, F., Faure, A., Pagani, L., et al. 2016, A&A, 592, 45
- Daniel et al. (2013) Daniel, F., Gérin, M., Roueff, E., et al. 2013, A&A, 560, 3
- Daranlot et al. (2012) Daranlot, J., Hincelin, U., Bergeat, A., et al. 2012, PNAS, 109, 10233
- De Simone et al. (2018) De Simone, M., Fontani, F., Codella, C., et al. 2018, arXiv:1801.07539
- Draine (1978) Draine, B. T. 1978, ApJS, 36, 595
- Fayolle et al. (2016) Fayolle, E. C., Balfe, J., Loomis, R., et al. 2016, ApJ, 816, L28
- Fontani et al. (2015) Fontani F., Caselli P., Palau A., Bizzocchi L., & Ceccarelli C., 2015, ApJ, 808, L46
- Füri & Marty (2015) Füri, E. & Marty, B. 2015, Nature Geoscience, 8, 515
- Furuya et al. (2015) Furuya, K., Aikawa, Y., Hincelin, U., et al. 2015, A&A, 584, 124
- Furuya et al. (2017) Furuya, K., Drozdovskaya, M. N., Visser, R., et al. 2017, A&A, 599, A40
- Furuya & Persson (2018) Furuya, K., & Persson, M. V. 2018, arXiv:1802.08494
- Garrod & Herbst (2006) Garrod, R. T., & Herbst, E. 2006, A&A, 457, 927
- Garrod et al. (2007) Garrod, R. T.,Wakelam, V., & Herbst, E. 2007, A&A, 467, 1103
- Gerin et al. (2009) Gerin, M., Marcelino, N., Biver, N., et al. 2009, A&A, 498, L9
- Hama et al. (2010) Hama, T., Yokoyama, M., Yabushita, A., et al. 2010, The Journal of Chemical Physics, 132, 164508
- Hasegawa & Herbst (1993a) Hasegawa, T. I., & Herbst, E. 1993a, MNRAS, 261, 83
- Hasegawa & Herbst (1993b) Hasegawa, T. I., & Herbst, E. 1993, MNRAS, 263, 589
- Hassel et al. (2010) Hassel, G. E., Herbst, E., & Bergin, E. A. 2010, A&A, 515, 66
- He et al. (2016) He, J., Acharyya, K., & Vidali, G. 2016, ApJ, 823, 56
- Heays et al. (2014) Heays, A. N., Visser, R., Gredel, R., et al. 2014, A&A, 562, 61
- Hily-Blant et al. (2013a) Hily-Blant, P., Bonal, L., Faure, A., & Quirico, E. 2013a, Icarus, 223, 582
- Hily-Blant et al. (2013b) Hily-Blant, P., Pineau des Forˆets, G., Faure, A., Le Gal, R., & Padovani, M. 2013b, A&A, 557, 65
- Honvault et al. (2011) Honvault, P., Jorfi, M., González-Lezana, T., Faure, A., & Pagani, L. 2011, Phys. Rev. Lett., 107, 023201
- Hugo et al. (2009) Hugo, E., Asvany, O., & Schlemmer, S. 2009, J. Chem. Phys., 130, 164302
- Knauth et al. (2004) Knauth, D. C., Andersson, B.-G., McCandliss, S. R., & Warren Moos, H. 2004, Nature, 429, 636
- Li et al. (2013) Li, X., Heays, A. N., Visser, R., et al. 2013, A&A, 555, 14
- Ligterink et al. (2015) Ligterink, N. F. W., Paardekooper, D. M., Chuang, K.-J., Both, M. L. and Cruz-Diaz, G. A., van Helden, J. H., & Linnartz, H., A&A, 584, 56
- Lucas & Liszt (1998) Lucas, R., & Liszt, H. 1998, A&A, 337, 246
- Inoue & Inutsuka (2012) Inoue, T., & Inutsuka, S. 2012, ApJ, 759, 35
- Liang et al. (2007) Liang, M.-C., Heays, A. N., Lewis, B. R., Gibson, S. T., & Yung, Y. L. 2007, ApJ, 664, L115
- Linsky (2003) Linsky, J. L. 2003, Space Sci. Rev., 106, 49
- Loison et al. (2014) Loison, J.-C., Wakelam, V., & Hickson, K. M. 2014, MNRAS, 443, 398
- Maret et al. (2006) Maret, S., Bergin, E. A., & Lada, C. J. 2006, Nature, 442, 425
- Marty et al. (2011) Marty B., Chaussidon M., Wiens R. C., Jurewicz A. J. G., & Burnett D. S. 2011, Science, 332, 1533
- Martin-Domenech et al. (2017) Martin-Domenech, R. and Cruz-Diaz, G. A. & Munoz Caro, G. M. 2017, arXiv:1710.06467
- Minissale et al. (2016) Minissale, M., Congiu, E., & Dulieu, F. 2016, A&A, 585, 146
- Mumma & Charnley (2011) Mumma, M., & Charnley, S. B. 2011, ARA&A, 49, 471
- Noble et al. (2012) Noble, J. A., Congiu, E., Dulieu, F., & Fraser, H. J. 2012, MNRAS, 421, 768
- Öberg et al. (2011) Öberg, K. I., Boogert, A. C. A., Pontoppidan, K. M., et al. 2011, ApJ, 740, 109
- Öberg et al. (2005) Öberg, K. I., van Broekhuizen, F., Fraser, H. J., et al. 2005, ApJ, 621, L33
- Pauly & Garrod (2016) Pauly T., Garrod R. T., 2016, ApJ, 817, 146
- Pezzuto et al. (2012) Pezzuto, S., Elia, D., Schisano, E., et al. 2012, A&A, 547, 54
- Ritchey et al. (2015) Ritchey, A. M., Federman, S. R., & Lambert, D. L. 2015, ApJ, 804, L3
- Rodgers & Charnley (2008a) Rodgers, S. D., & Charnley, S. B. 2008a, MNRAS, 385, L48
- Rodgers & Charnley (2008b) Rodgers, S. D., & Charnley, S. B. 2008b, ApJ, 689, 1448
- Romano et al. (2017) Romano, D., Matteucci, F., Zhang, Z.-Y., Papadopoulos, P. P., & Ivison, R. J. 2017, MNRAS, 470, 401
- Roueff et al. (2015) Roueff, E., Loison, J. C., & Hickson, K. M. 2015, A&A, 576, 99
- Shinnaka et al. (2016) Shinnaka, Y., Kawakita, H., Jehin, E., Decock, A., Hutsemékers, D., Manfroid, J., & Arai, A. 2016, MNRAS, 462, 195
- Taquet et al. (2014) Taquet V., Charnley S. B., Sipilä O. 2014, ApJ, 791, 1
- Terzieva & Herbst (2000) Terzieva, R., & Herbst, E. 2000, MNRAS, 317, 563
- Wakelam et al. (2017) Wakelam, V., Loison, J. C., Mereau, R., Ruaud, M. 2017, arXiv:1701.06492
- Wakelam et al. (2013) Wakelam, V., Smith, I. W. M., Loison, J.-C., et al. 2013, arXiv:1310.4350
- Watanabe et al. (2010) Watanabe, N., Kimura, Y., Kouchi, A., et al. 2010, ApJ, 714, L233
- Westley et al. (1995) Westley, M. S., Baragiola, R. A., Johnson, R. E., & Baratta, G. A. 1995, Nature, 373, 405
- Wirström et al. (2012) Wirström, E. S., Charnley, S. B., Cordiner, M. A., & Milam, S. N. 2012, ApJ, 757, L11
- Wirström & Charnley (2017) Wirström, E. S. & Charnley, S. B. 2017, arXiv:1711.08254
- Yurimoto & Kuramoto (2004) Yurimoto, H., & Kuramoto, K. 2004, Science, 305, 1763