INFERENCE ON A DISTRIBUTION FROM NOISY DRAWS
Abstract
We consider a situation where the distribution of a random variable is being estimated by the empirical distribution of noisy measurements of that variable. This is common practice in, for example, teacher value-added models and other fixed-effect models for panel data. We use an asymptotic embedding where the noise shrinks with the sample size to calculate the leading bias in the empirical distribution arising from the presence of noise. The leading bias in the empirical quantile function is equally obtained. These calculations are new in the literature, where only results on smooth functionals such as the mean and variance have been derived. We provide both analytical and jackknife corrections that recenter the limit distribution and yield confidence intervals with correct coverage in large samples. Our approach can be connected to corrections for selection bias and shrinkage estimation and is to be contrasted with deconvolution. Simulation results confirm the much-improved sampling behavior of the corrected estimators. An empirical illustration on heterogeneity in deviations from the law of one price is equally provided.
JEL Classification: C14, C23
Keywords: bias correction, estimation noise, nonparametric inference, measurement error, panel data, regression to the mean, shrinkage.
1 Introduction
Let be a random sample from a distribution that is of interest. Suppose that we only observe noisy measurements of these variables, say . A popular approach is to do inference on and its functionals using the empirical distribution of . This is common practice when analyzing panel data with heterogenous coefficients. In the literature on student achievement, for example, is a teacher effect, is an estimator of it obtained from data on student test scores, and we care about the distribution of teacher value-added (see, e.g., Jackson, Rockoff and Staiger 2014 for an overview). In the same vein, Guvenen (2009), Browning, Ejrnæs and Alvarez (2010), and Magnac and Roux (2021) estimate heterogenous earning profiles, while Ahn, Choi, Gale and Kariv (2014) find substantial heterogeneity in ambiguity aversion In a nonlinear fixed-effect model, the marginal effect is heterogenous across units and interest lies in the distribution of these effects as well as its functionals (Chamberlain 1984, Hahn and Newey 2004). Although the plug-in approach is popular, using rather than introduces bias that is almost entirely ignored in practice. Barras, Gagliardini and Scaillet (2021), who are interested in the distribution of the skill of fund managers, find that not accounting for bias leads to substantial overestimation of tail mass and misses to pick up the substantial asymmetry in the skill distribution.
We analyze the properties of the plug-in estimator of in a location-scale setting where
where is a parameter that grows with . As the variance of the (heteroskedastic) noise is , this device shrinks the noise as the sample size grows. This is a very natural asymptotic embedding in settings where is an estimator of obtained from a sample of size , as in a panel data setting or meta-analysis (Vivalt, 2015). It is related to, yet different from, an approach based on small measurement-error approximations as in Chesher (1991, 2017),333 Chesher (1991) provides expansions for densities, while we focus on distribution and quantile functions. Chesher (2017) discusses the impact of noise in the explanatory variables in a quantile-regression model; this is a different setup than the one considered here. Evdokimov and Zeleneev (2020) use our device of measurement error that shrinks with the sample size to correct inference in generalized method-of-moment problems. and has precedent in the analysis of fixed-effect models for panel data, although for different purposes, as discussed in more detail below (see, e.g., Hahn and Kuersteiner 2002 and Alvarez and Arellano 2003).
Efron (2011) essentially entertains the homoskedastic setting with normal noise, where
and defines selection bias as the tendency of the ’s associated with the (in magnitude) largest ’s to be larger than their corresponding . He proposes to deal with selection bias by using the well-known Empirical Bayes estimator of Robbins (1956), which here is equal to
where is the marginal density of the and denotes the first-derivative operator. For example, when this expression then yields the (infeasible) shrinkage estimator
a parametric plug-in estimator of which would be the James and Stein (1961) estimator. More generally, non-parametric implementation would also require estimation of and its first derivative. Shrinkage to the overall mean (in this case zero) is intuitive, as selection bias essentially manifests itself through the tails of the empirical distribution of the being too thick.444The same shrinkage factor is applied to each , a consequence of the noise being homoskedastic. How to deal with heteroskedastic noise in an Empirical Bayes framework is not obvious. Discussion and a recent contribution can be found in and Weinstein, Ma, Brown and Zhang (2018). Shrinkage is commonly-applied in empirical work (see, e.g., Rockoff 2004; Chetty, Friedman and Rockoff 2014). It should be stressed, though, that, while shrinkage improves on in terms of estimation risk, it does not lead to preferable estimators of the distribution or its moments.
The approach taken here is different from Efron (2011). Without making parametric assumptions on , we calculate the (leading) bias of the naive plug-in estimator of the distribution,
This calculation allows to construct estimators that correct for the bias directly. In the James-Stein problem, where , for example, the bias under homoskedastic noise equals
Thus, the empirical distribution is indeed upward biased in the left tail and downward biased in the right tail. A bias order of implies incorrect coverage of confidence intervals unless . We present plug-in and jackknife estimators of the leading bias and show that the bias-corrected estimators are asymptotically normal with zero mean and variance as long as . So, bias correction is preferable to the naive plug-in approach for typical data sizes encountered in practice, where tends to be quite small relative to . We also provide corresponding bias-corrected estimators of the quantile function of .
If the distribution of is fully known, recovering is a (generalized) deconvolution problem that can be solved for fixed . Deconvolution-based estimators are well studied (see, e.g., Carroll and Hall 1988 and Delaigle and Meister 2008). However, they have a very slow rate of convergence and it is well documented that they can behave quite poorly in small samples.555There are also solutions to the measurement-error problem based on repeated measurements (or instrumental variables), coupled with suitable independent restrictions (see, for example, Horowitz and Markatou 1996, Li and Vuong 1998, Hu 2008, Hu and Schennach 2008, and Bonhomme, Jochmans and Robin 2016a, b). These can be useful alternatives in static models for panel data, where the object of interest is the distribution of the random intercept, as in the work of Horowitz and Markatou (1996), for example. In response to this, Efron (2016) has recently argued for a return to a more parametric approach. Our approach delivers intuitive estimators that enjoy the usual parametric convergence rate and are numerically well behaved. Although it does not deliver a fixed- consistent estimator, bias correction further ensures that size-correct inference can be performed, provided that is small. It is not clear how to conduct inference based on deconvolution estimators.
Working out the statistical properties of (and of its quantile function) is non-trivial because is a non-smooth function of the data . As such, the approach taken here is different from, and complementary to, recent work on estimating average marginal effects in panel data models, which only looks at smooth functionals such as the mean and variance (see, e.g., Fernández-Val and Lee 2013; Okui and Yanagi 2019). The impact of noise on smooth transformations of the can be handled using conventional methods based on Taylor-series expansions. We contrast such an approach with our derivations below. How to perform inference on the quantiles of marginal effects in nonlinear panel models is a long-standing open question (Dhaene and Jochmans, 2015), and the current work can be seen as a first step in that direction.
In work contemporaneous to our own, Okui and Yanagi (2020) derive the bias of a kernel-smoothed estimator of and its derivative. Such smoothing greatly facilitates the calculation of the bias, making it amenable to conventional analysis. However, it also introduces additional bias terms that require much stronger moment conditions as well as further restrictions on the relative growth rates of , , and the bandwidth that governs the smoothing. Nevertheless, the (leading) bias term obtained in Okui and Yanagi (2020, Theorem 3) coincides with ours in Proposition 1 below. Additional discussion on and comparison between the two different approaches is given in Okui and Yanagi (2020, p. 169–170).
2 Large-sample properties of plug-in estimators
Let be a univariate distribution on the real line. We are interested in estimation of and inference on and its quantile function If a random sample from would be available this would be a standard problem. We instead consider the situation where themselves are unobserved and we observe noisy measurements , with variances for a positive real number which, in our asymptotic analysis below, will be required to grow with . We assume the following.
Assumption 1.
The variables are i.i.d. across , with
and for all .
Our setup reflects a situation where the noisy measurements converge in squared mean to at the rate . A leading case is the situation where is an estimator of obtained from a sample of size that converges at the parametric rate.666 Everything to follow can be readily modified to different convergence rates as well as to the case where with for a random variable . It suffices to redefine as . When the represent estimators this device allows for the sample size to vary with . For example, in a panel data setting, it would cover unbalanced panels under a missing-at-random assumption. Further, the requirement that is unbiased can be relaxed to allow for standard non-linearity bias of order . We do not do this here as it is possible quite generally to reduce the bias down to , for example via a jackknife or bootstrap correction, making it negligible in our analysis below. Furthermore, the split-sample jackknife approach to bias correction that we discuss below would automatically take care of this additional bias without modification. We allow and to be correlated, implying that the noise is not independent of . Hence, we allow for measurement error to be non-classical. Recovering the distribution of from a sample of is, therefore, not a standard deconvolution problem.
It is common to estimate by
the empirical distribution of the at . As we will show below, under suitable regularity conditions, such plug-in estimators are consistent and asymptotically normal as provided that grows with so that converges to a finite constant. The use of rather than introduces bias of the order , in general. This bias implies that test statistics are size distorted and the coverage of confidence sets is incorrect unless converges to zero.
The bias problem is easy to see (and fix) when interest lies in smooth functionals of ,
for a (multiple-times) differentiable function . An (infeasible) plug-in estimator based on would be
Clearly, this estimator is unbiased and satisfies as soon as exists. For the feasible plug-in estimator of ,
under standard regularity conditions, a Taylor-series expansion of around yields
and
Hence, letting , we have
as when . The noise in introduces bias unless is linear. It can be corrected for by subtracting a plug-in estimator of from . Doing so, again under regularity conditions, delivers and estimator that is asymptotically unbiased as long as .
2.1 Distribution function
The machinery from above cannot be applied to deduce the bias of as it is a step function and, hence, non-differentiable. We will derive its leading bias under the following conditions. To state them, we let
and write for the density function of .
Assumption 2.
The variables are independent of , their distribution is absolutely continuous and has finite fourth-order moment. The function is three times differentiable with uniformly bounded derivatives, and one of the following two sets of conditions holds:
A. The function is -times differentiable for , the joint density of exists, the conditional density function of given is twice differentiable with respect to and the derivatives are bounded in absolute value by a function such that .
B. There exists a deterministic function so that for all ; and (ii) is three times differentiable and has uniformly-bounded derivatives.
Assumption 2 imposes smoothess on certain densities and conditional expectations but not on the estimator of .
Define the function
which is well-behaved under Assumption 2, and let
be its derivative. We also introduce the covariance function
where we use to denote . Proposition 1 summarizes the large-sample properties of .
Proposition 1.
Proof.
The proof is in Appendix A. ∎
To illustrate the result suppose that is independent of and that has density function
as in the James and Stein (1961) problem. Letting denote the mean of the an application of Proposition 1 yields
Thus, is upward biased when and is downward biased when . This finding is a manifestation of the phenomenon of regression to the mean (or selection bias, or the winner’s curse; see Efron 2011). It implies that the empirical distribution tends to be too disperse.
2.2 Quantile function
The bias in translates to bias in estimators of the quantile function. A natural estimator of the quantile function is the left-inverse of . With this definition, the plug-in estimator of the th-quantile is
where is the th order statistic of our sample, where delivers the smallest integer at least as large as .
To calculate the leading bias in observe that it is an (approximate) solution to the empirical moment condition
(with respect to ). From Proposition 1 we know that
uniformly in , so the moment condition that defines the estimator is biased. Letting
we obtain the following result.
Proposition 2.
Proof.
The proof is in Appendix A. ∎
As an example, when , independent of , we have
which, in line with our discussion on regression to the mean above, is positive for all quantiles below the median and negative for all quantiles above the median. The median itself is, in this particular case, estimated without plug-in bias of order . It will, of course, still be subject to the usual bias arising from the nonlinear nature of the estimating equation.
3 Estimation and inference
Propositions 1 and 2 complement the existing results on the bias in smooth functionals (Fernández-Val and Lee 2013; Okui and Yanagi 2019) of the distribution of heterogenous parameters in panel data models. Our calculations confirm that the order of the bias in the empirical distribution and in the quantile function is of the same order as in the smooth case, .
3.1 Split-panel jackknife estimation
Importantly, our results validate a traditional jackknife approach to bias correction as in Hahn and Newey (2004) and Dhaene and Jochmans (2015). Such an approach exploits the fact that the bias is proportional to and is based on re-estimating from subsamples. The simplicity of such a method makes it very useful in panel data applications, for example.
To illustrate how the jackknife would work here, consider a stationary (balanced) panel. Let be an estimator of constructed from the subpanel consisting of the first cross sections only. Then
is the plug-in estimator of based on this subpanel alone. From Proposition 1 it follows that
Using the remaining cross sections from the full panel we can equally calculate estimators and subsequently construct
for which
follows in the same way. Consequently,
is a split-panel jackknife estimator of the leading bias term . Hence,
is a nonparametric bias-corrected estimator.
A jackknife estimator of the quantile function can be defined in the same way. Moreover, let and be the order statistic of the re-estimated quantities in the first and second subsample, respectively. Recall that is the (approximate) solution to and so is our estimator of as obtained from the information in the subpanel only. As before,
is a nonparametric estimator of that gives rise to a jackknife bias-corrected estimator of the quantile function.
The large-sample behavior of these jackknife estimators is the same as for the analytic corrections in Propositions 3 and 4 below. The split-sample jackknife is simple to implement but requires access to the original data from which were computed. This can be infeasible in meta-analysis problems, where each of the is an estimator constructed from a different data set that need not all be accessible. It can also be complicated in structural econometric models, where may be the solution to a cumbersome optimization programme that can be time-consuming to solve. We discuss an alternative bias-correction estimator next.
3.2 Analytic bias correction
We will formulate regularity conditions for a plug-in estimator of the bias to be consistent under the maintained assumption that the are known. We conjecture that, under suitable conditions, the results below will continue to go through when the are replaced by estimators.
A bias-corrected estimator based on Proposition 1 takes the form
where is the derivative of kernel function and is a non-negative bandwidth parameter. Thus, we estimate the bias using standard kernel methods. For simplicity, we will use a Gaussian kernel throughout, so .
We establish the asymptotic behavior of under the following conditions.
Assumption 3.
(i) The conditional density of given is five times differentiable with respect to and the derivatives are bounded in absolute value by a function such that
(ii) There exists an integer , and real numbers and so that and , and .
(iii) The density of , , satisfies for finite constant and .
Assumption 3 contains simple smoothness and boundedness requirements on the conditional density of given , as well as tail conditions on the marginal density of the and on the bias function .
We have the following result.
Proposition 3.
Proof.
The proof is in Appendix B. ∎
The implications of Proposition 3 are qualitatively similar to those for smooth functionals discussed above. Indeed, for any fixed , it implies that
as and with . Thus, the leading bias is removed from without incurring any cost in terms of (asymptotic) precision. Given the correction term, the sample variance of
is a more natural basis for inference in small samples than is that of .
A data-driven way of choosing is by cross validation. A plug-in estimator of the integrated squared error (up to multiplicative and additive constants) is
where we use the shorthand
See Appendix C for details on the derivation. The cross-validated bandwidth then is on the interval .
Now turn the bias-corrected estimation of the quantile function. Proposition 2 readily suggests a bias-corrected estimator of the form
using obvious notation. While (under suitable regularity conditions) such an estimator successfully reduces bias it has the unattractive property that it requires a non-parametric estimator of the density , which further shows up in the denominator.
An alternative estimator that avoids this issue is
The justification for this estimator comes from the fact that , where , and its interpretation is intuitive. Given the noise in the relative to the , the empirical distribution of the former is too heavy-tailed relative to the latter, and so estimates a quantile that is too extreme, on average. Changing the quantile of interest from to adjusts the naive estimator and corrects for regression to the mean.
Proposition 4.
Let the assumptions stated in Proposition 3 hold. For , assume that in a neighborhood of . Then,
as with .
Proof.
The proof is in Appendix B. ∎
The corrected estimator has the same asymptotic variance as the uncorrected estimator. It is well-known that plug-in estimators of can perform quite poorly in small samples (Maritz and Jarrett 1978). Typically, researchers rely on the bootstrap, and we suggest doing so here. Moreover, draw (many) random samples of size from the original sample and re-estimate by the bias-corrected estimator for each such sample. Then construct confidence intervals for using the percentiles of the empirical distribution of these estimates. Note that, again, this bootstrap procedure does not involve re-estimation of the individual .
4 Numerical illustrations
4.1 Simulated data
To support our theory we provide simulation results for a James and Stein (1961) problem where and we have access to an panel on independent realizations of the random variable
This setup is a simple random-coefficient model. It is similar to the classic many normal means problem of Neyman and Scott (1948). While their focus was on consistent estimation of the within-group variance, , for fixed , our focus is on between-group characteristics and the distribution of the as a whole. We estimate by the fixed-effect estimator, i.e.,
The sampling variance of is . Rather than assuming this variance to be known we implement our analytical bias correction using the estimator
We do not make use of the fact that the are homoskedastic in estimating the noise or in constructing the bias correction. Moreover, the implementation of our procedure is non-parametric in the noise distribution.
A deconvolution argument implies that
Thus, indeed, the empirical distribution of the fixed-effect estimator is too fat-tailed. In particular, the sample variance of ,
is a biased estimator of . To illustrate how this invalidates inference in typically-sized data sets we simulated data for (so is standard normal) and . The panel dimensions reported on are , , and . Table 1 shows the bias and standard deviation of as well as the empirical rejection frequency of the usual two-sided -test for the null that . The nominal size is set to . In practice, however, the test rejects in virtually all of the replications. The table provides the same summary statistics for the bias-corrected estimator
The adjustment reduces the estimator’s bias relative to its standard error and brings down the empirical rejection frequencies to just over their nominal value for the sample sizes considered.
| bias | std | se/std | size () | ||||||
|---|---|---|---|---|---|---|---|---|---|
| 50 | 3 | 1.616 | -0.054 | 0.525 | 0.577 | 0.964 | 0.971 | 0.973 | 0.082 |
| 100 | 4 | 1.224 | -0.028 | 0.321 | 0.337 | 0.966 | 0.969 | 0.997 | 0.073 |
| 200 | 5 | 0.989 | -0.010 | 0.199 | 0.205 | 0.985 | 0.985 | 1.000 | 0.062 |
Table notes. is the plug-in estimator of . is its (analytically) bias-corrected version constructed using estimators of the variance of the noise distributions. The table reports the bias and standard deviation of these estimators, along with the ratio of the average standard error to the standard deviation and empirical rejection frequencies of a two-sided -test for the null that , which is the value with which the data were generated.
A popular approach in empirical work to deal with noise in is shrinkage estimation (see, e.g., Chetty, Friedman and Rockoff 2014). This procedure is not designed to improve estimation and inference of or its moments, however. In the current setting, the (infeasible, parametric) shrinkage estimator is simply
Its exact sampling variance is
It follows that the sample variance of the shrunken has a bias that is of the same order as that in the sample variance of . Interestingly, note that, here, this estimator overcorrects for the presence of noise, and so will be underestimating the true variance, , on average.
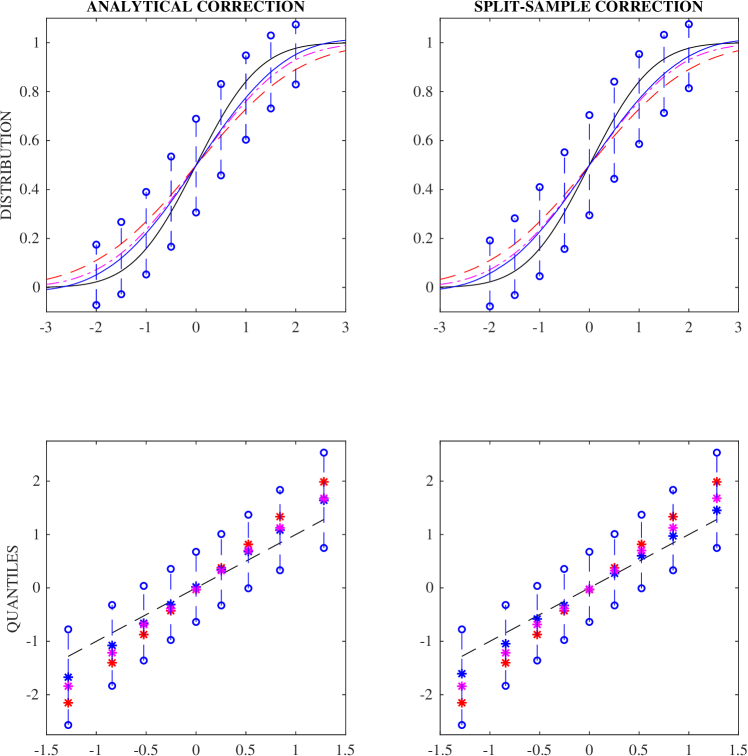
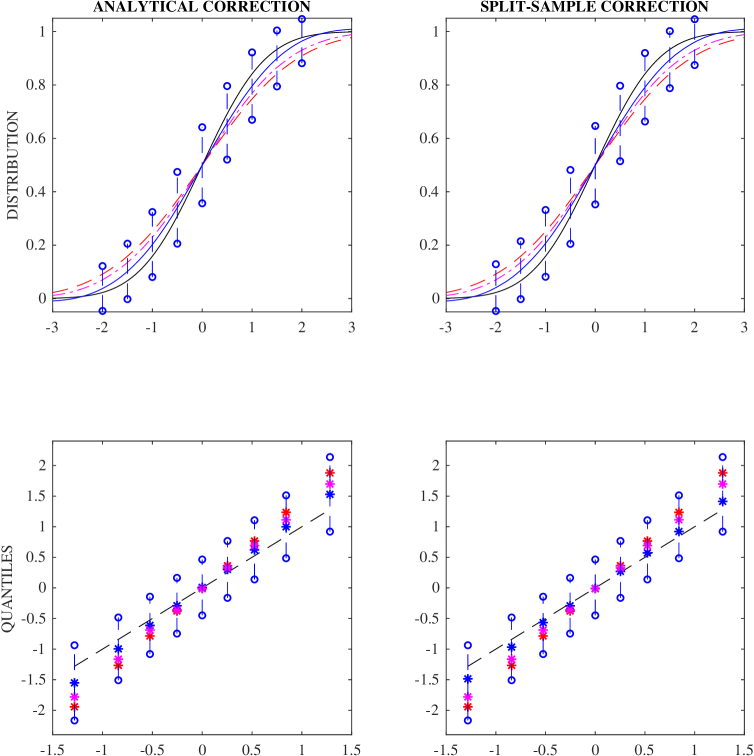
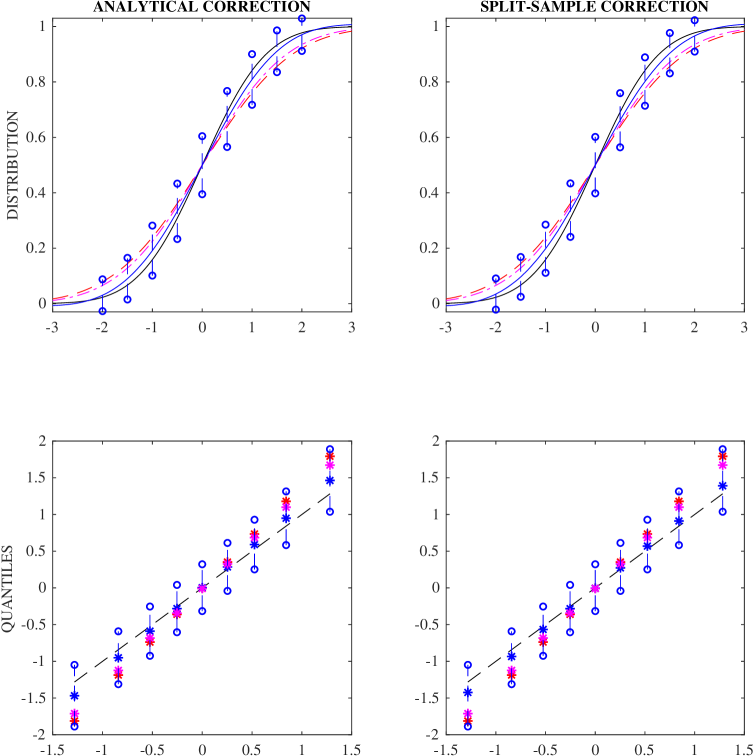
The upper two plots in Figures 1, 2, and 3 provide simulation results for the distribution function for the same Monte Carlo designs. The figures deal with the sample sizes , , , respectively. The left plots contain (the average over the Monte Carlo replications of) the analytically bias-corrected estimator (solid blue line), with the bandwidth chosen according to a cross-validation procedure, together with confidence bands placed around in. Each of the plots also provide the average of the naive plug-in estimator (dashed red line), the empirical distribution of the Empirical-Bayes point estimates (dashed-dotted purple line), and the actual standard-normal distribution that is being estimated (solid black line).777Empirical Bayes was implemented non-parametrically (and correctly assuming homoskedasticity) based on the formula stated in the introduction using a kernel estimator and the optimal bandwidth that assumes knowledge of the normality of the target distribution. The upper right plots in Figures 1, 2, and 3 have the same structure, only now the bias-corrected estimator being plotted is the split-sample jackknife.
The simulations clearly show the substantial bias in the naive estimator. This bias becomes more pronounced relative to its standard error as the sample size grows and, indeed, starts falling outside of the confidence bands (of the bias corrected estimator) as the sample size increases. The Empirical-Bayes estimator is less biased than . However, its bias is of the same order and so, as the sample size grows it does not move toward but, rather, towards .888Recall that the Empirical-Bayes estimator is not designed for inference on but, in stead, aims to minimize risk in estimating . In terms of RMSE it dominates . For the three sample sizes considered here, the RMSEs are , , and for the plug-in estimators and , , for Empirical Bayes. The confidence bands of and settle around as the sample grows. The results also show near identical performance of the split-sample approach and the analytical approach based on our bias formula. Indeed, the curves in the left and right plots are virtually indistinguishable.
 \floatfoot
Figure notes. The upper plots contain the average (over the Monte Carlo replications) distribution function (full blue line) obtained via analytical bias correction (left plot) and split-sample jackknife estimation (right plot) along with confidence intervals around them at each of the quantiles of (blue ). Each plot also contains the true curve (full black line) and the average of the empirical distribution function of the estimated (dashed red line) and of their Empirical Bayes adjustments (dashed-dotted purple line). The lower plots contain corresponding QQ-plots of the average bias-corrected quantile function (blue ) at each of the deciles of together with confidence intervals. The line (dashed black line) corresponds to the truth. Average estimates for the naive (red ) and Empirical Bayes (purple ) estimator are equally pictured.
The reduction in bias in our estimators of is again sufficient to bring the empirical size of tests in line with their nominal size. To see this Table 2 provides empirical rejection frequencies of two-sided tests at the level for at each of its deciles using both and . The rejection frequencies based on the naive estimator are much too high for all sample sizes and deciles and get worse as the sample gets larger. Empirical size is much closer to nominal size after adjusting for noise, and this improvement is observed at all deciles of the distribution.
| 0.4814 | 0.5518 | 0.3695 | 0.1530 | 0.0681 | 0.1598 | 0.3801 | 0.5610 | 0.4828 | |
| 0.0600 | 0.0928 | 0.1039 | 0.0785 | 0.0563 | 0.0745 | 0.1029 | 0.0891 | 0.0628 | |
| 0.6962 | 0.7304 | 0.5564 | 0.2280 | 0.0566 | 0.2312 | 0.5586 | 0.7352 | 0.7034 | |
| 0.0608 | 0.0848 | 0.0920 | 0.0664 | 0.0494 | 0.0734 | 0.0932 | 0.0782 | 0.0532 | |
| 0.926 | 0.902 | 0.7634 | 0.3288 | 0.0576 | 0.3212 | 0.7646 | 0.903 | 0.9146 | |
| 0.0536 | 0.0828 | 0.0996 | 0.0770 | 0.0496 | 0.0792 | 0.0978 | 0.0780 | 0.0554 | |
Table notes. is the empirical distribution of the . is its (analytically) bias-corrected version constructed using estimators of the variance of the noise distributions. The table provides, for several combinations of , rejection frequencies of the associated two-sided tests of the null that for a range of different quantiles ; the data were generated with set to the standard-normal distribution function.
The lower two plots in Figures 1, 2, and 3 provide corresponding simulation results for estimators of the deciles of . The presentation is constructed around a QQ-plot of the standard normal, pictured as the black dashed-dotted line in each plot. Along the QQ-plot, the average (over the Monte Carlo replications) of the naive estimator (red), Empirical Bayes (purple), and the bias-corrected quantiles (blue) are shown by symbols. Again, the left plots deal with the analytical correction and the right plots show results for the split-sample approach. Confidence intervals around the corrected estimators (in blue,-o) are also again provided. Like the naive estimator, the Empirical Bayes estimators reported are the appropriate order statistics of , after shrinkage has been applied to each. Visual inspection reveals that the results are in line with those obtained for the distribution function. As the sample size grows, only successfully adjusts for bias arising from estimation noise in . Here, the split-sample correction is slightly more effective than our analytical approach.
4.2 Empirical illustration
We use quarterly panel data on a set of 48 consumer price index items in 52 US cities. The data span the period 1990–2007, yielding 72 time series observations. They were used by Parsley and Wei (2001), Crucini, Shintani and Tsuruga (2015), and Okui and Yanagi (2019, 2020) to investigate the cross-sectional heterogeneity in deviations from the law of one price. Let be the price of item in city at time and define the random variable
for all city/item combinations apart from the reference city (which here is Albuquerque, New Mexico). For each city/item combination we estimate the mean, standard deviation and first-order autocorrelation of non-parametrically from the time dimension of our panel. Our interest lies in the distribution functions of their population counterparts. We estimate these three distributions by the empirical distributions of the cross-sectional estimates, and then correct for plug-in bias via the split-sample jackknife procedure. Our results complement the analysis of Okui and Yanagi (2020, Figure 1), which gives corresponding estimates of the associated density functions.
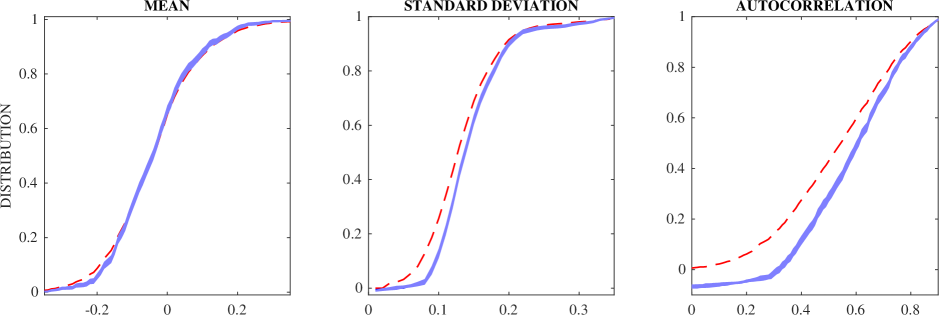
Figure notes. The empirical distribution functions of the means (left) standard deviations (middle) and autocorrelations (right) of the time series of for all city/item combinations (dashed red line) along with confidence bands constructed from the split-sample jackknife estimator of each of these distributions (shaded blue region).
The results are collected in Figure 4. The plots contain the empirical distribution functions (dashed red line) together with confidence bands based on the split-sample jackknife (shaded blue region). The correction for regression to the mean to the empirical distribution is clearly visible for the mean (left plot). It is also statistically significant, with the tails of the empirical distribution falling out of the confidence region. The sample standard deviation and autocorrelation obtained from the time series are biased estimators and so the empirical distribution function for these parameters (middle and right plot, respectively) suffer from an additional bias that is of the same order of magnitude as is the bias due to estimation noise (see the discussion on Footnote 4). The split-sample jackknife corrects for both these sources of bias automatically. Here, the bias adjustment leads to a pronounced shift of the empirical distribution; the corrected distribution functions all but stochastically dominate the naive plug-in estimators. The differences between the corrected and uncorrected functions are quantitatively large and, given the small standard error, they are also statistically significant.
5 Conclusions
In this paper, we have considered inference on the distribution of latent variables from noisy measurements. In an asymptotic embedding where the variance of the noise shrinks with the sample size, we have derived the leading bias in the empirical distribution function of the noisy measurements and suggested both an analytical and a jackknife correction. They provide a simple and numerically stable (approximate) solution to a generalized deconvolution problem that, in addition, yields valid inference procedures. The split-sample jackknife is particularly straightforward to implement and we recommend its use whenever possible.
Appendix A Appendix
Notational convention: we let denote the th derivative of with respect to its th argument. We omit the subscript for univariate .
A.1 Proof of Proposition 1
The following known result is useful to prove Proposition 1.
Lemma A.1 (Komlós, Major and Tusnády 1975).
Let denote the empirical cumulative distribution of an i.i.d. sample of size n from a uniform distribution on [0,1]. Let denote a sequence of Brownian bridges. Then
Proof of Proposition 1.
We begin with the bias calculation. Suppose, first, that Part A of Assumption 2 holds. Then have a joint density, , say. We will denote the marginal density of by and the conditional density of given by . For any real number let
Note that and that
| (A.1) |
Assumption 2 implies that is smooth and differentiable in its second argument. By definition of the function ,
| (A.2) |
which equals and is finite by assumption. Therefore, by (A.1) and a third-order expansion of in its second argument around zero we find that
where is some value between zero and , and where, in addition to (A.2), we have used that and by construction and that by assumption. By direct calculation,
Therefore,
as claimed.
Suppose, next, that Part B of Assumption 2 holds. Then we have a deterministic relationship between and . We may define as above but have to take care when Taylor expanding in , as the function may be non-continuous. A non-continuity occurs whenever the number of solutions (on the real line) to the equation changes. However, at the only solution to this equation is , and because we assume that the function has uniformly bounded derivative , there always exists such that for all and all real the equation has a unique solution in on the real line. We denote this solution by , that is, we have . Using this we find that for we have
where the last equation is obtained by taking derivatives of with respect to and then solving for the derivative. Because we have that we then find
Differentiating further we see that , and are functions of the derivatives of and up to third order. Our assumption that these derivatives are uniformly bounded implies that
| (A.3) |
The only obstacle that now prevents us from proceeding with an expansion as we did under Assumption 2.A is that the bound (A.3) is restricted to a neighborhood around zero. To complete the derivation of the bias we argue that the restriction that relaxes sufficiently fast as grows. We do so as follows. Note, first, that, by Markov’s inequality,
Then
uniformly in , because,
noting that by definition of the function . Next, a Taylor expansion of around gives
where we have used that , that and that , and have introduced the notational shorthand
for
and
here, lies in between zero and . To validate our bias expression it remains only to establish that . To do so we show that and that in turn. By Hölder’s inequality,
In the same way,
follow. Consequently,
using that all relevant derivatives on the right-hand side are bounded. Next, noting that, as , the event implies that , we have
because of (A.3). Therefore, , and so
as before.
Now turning to the result on the covariance, note that
depends only on which, up to and uniformly in , has been calculated above. Moreover,
as stated in the proposition.
To complete the proof it remains only to verify the limit distribution of the scaled empirical distribution function. Let , the distribution function of . Our assumptions imply that is continuous and that it has no mass points. With , we therefore have that is i.i.d. uniformly distributed on by the probability integral transform. An application of Lemma A.1 with and exploiting monotonicity of distribution functions then gives
We have already shown that, uniformly in ,
Therefore, using that if as ,
holds uniformly in . Furthermore, our bias calculation implies that converges to zero uniformly in as , so that applying Lévy’s modulus-of-continuity theorem, that is,
to our problem yields as . We thus have that . Putting everything together and noting that, by definition, , we obtain
which completes the proof of the proposition. ∎
Proof of Proposition 2
Lemma A.2.
(i) ,
(ii) ,
(iii) ,
(iv) .
Proof.
From the argument in the proof of Proposition 1 we have
by a second-order expansion, where is a value between zero and and we introduce the function
where and are the density functions of given and of , respectively. Differentiating with respect to yields the first conclusion of the lemma as
which follows from the inequality
and the definition of the function in Assumption 2. The second conclusion of the lemma follows in the same manner, differentiating once more. Finally, the third and fourth conclusion are obtained similarly. The point of departure is now the following identity, which is derived in the proof of Proposition 1,
where
Repeated differentiation shows that
and so and follow. Furthermore,
follows because has uniformly bounded derivatives up to third order by assumption. This completes the proof. ∎
Proof of Proposition 2.
The are i.i.d. draws from the distribution which according to Lemma A.2 has non-degenerate density , that is, the are continuously distributed. Thus,
is the th order statistic of a uniform sample. We set for the rest of the proof. Then . Since by construction, it is well-known that
| (A.4) |
Let , the th-quantile of . By expanding the function around we find that
for remainder term
where is a value between and . From (A.4) we have . This implies that . Using Lemma A.2 we may conclude that , and, therefore, that . We thus have
Again using Lemma A.2 and our assumption that in a neighborhood of we have , and therefore
| (A.5) |
From Proposition 1 we know , and therefore
| (A.6) |
Combining (A.4), (A.5), and (A.6) gives the statement of the theorem. ∎
Proof of Proposition 3
Lemma A.3.
Let the assumptions of Proposition 3 hold. Then,
-
(i)
-
(ii)
-
(iii)
Lemma A.4.
The proof of those two lemmas is provided below, after the proof of the main text results.
Proof of Proposition 3.
We first show that
The result of the proposition then follows readily. For a finite , introduce the function
Note that maps to the finite interval and is monotone increasing; moreover, . Now consider the reparametrization ; note that lives in a bounded interval. From Lemma A.3(iii), using the chain rule of differentiation, it follows that
| (A.7) |
where we use the notation to indicate derivatives with respect to . We therefore have that , as a function , has a uniformly-bounded Lipschitz constant. Now let be a partition of with subintervals that are (approximately) of length . Then (A.7) implies that
is equal to
| (A.8) |
Here, the order of the remainder terms follows from the choice of . Now introduce the shorthand
Then
and so Lemma A.3(i) implies that
Moving on, observe that the number of subintervals making up is equal to , where delivers the smallest integer at least as large as . We therefore have
| (A.9) |
Let and . We may then write . Notice that are independent and mean zero. By Rosenthal (1970, Theorem 3) we therefore have that
is bounded from above by
where the constant only depends on . Using Lemma A.3(ii) we obtain
Using Lemma A.4 we obtain
where in the last step we used the condition that . We can therefore conclude from Rosenthal’s inequality above that
Using this and (A.9) we obtain
where . Combining this with (A.8) and (A.9) we thus conclude
as claimed.
Proof of Proposition 4
Let be the empirical distribution function of the i.i.d. sample . Lemma A.1 and Theorem 1 in Doss and Gill (1992) give
| (A.10) |
where again denotes the left inverse of is the sequence of Brownian bridges that previously appeared in Lemma A.1.
Equation (A.10) yields
Also, follows from the results above. Lévy’s modulus-of-continuity theorem then implies that . Therefore,
By definition we have and , and also that . Substituting this into the last displayed equation yields
Lemma A.2 and our assumptions guarantee that has a density that is bounded from below in a neighborhood of for the quantile of interest . The last result therefore also implies that
| (A.11) |
Next, The result (A.10) implies for a Brownian bridge . For we have , and therefore
From Proposition 1 we know that , uniformly in . We then find
From the proof of Proposition 3 we also know that and therefore
Smoothness of the function and (A.11) imply We thus obtain An application of the delta method with transformation then gives the result. This completes the proof. ∎
Appendix B Proof of Lemmas A.3 and A.4
Before proving Lemmas A.3 and A.4 we first state one known result and establish two further intermediate lemmas.
Lemma B.1 (Mason 1981).
Let be the empirical cumulative distribution of an i.i.d. sample of size n from a uniform distribution on [0,1]. Then, as ,
almost surely, for any .
Lemma B.2.
Proof.
The conditional density of given evaluated in is
We thus have
Without loss of generality we will take the value to be positive throughout. We have the bound
| (B.1) |
Consider the second term on the right-hand side in (B.1). by assumption and so it suffices to show that the integral is finite for all . To see that this is so, observe that
and use the change of variable
Next, for the first right-hand side term in (B.1), recall that , and so we need to show that the integral vanishes sufficiently fast as . To see that this is the case we proceed as before by observing that
to obtain
Thus, as long as and we have
uniformly in , as claimed. This completes the proof of the lemma. ∎
Lemma B.3.
Proof.
Fix throughout the proof. First note that, by Bayes’ rule and Assumption 1, we may write
A change of variable from to then allows to write
Observe that . Now, by a Taylor expansion,
Also, as
for any pair of integers , we have that
which is finite. Therefore, uniformly in ,
as claimed. This completes the proof. ∎
Proof of Lemma A.3.
Part (i): With
a change of variable and integration by parts yield
Taylor expanding around and using our assumptions of the distribution of we obtain
where lies between and zero. From Lemma B.3 we have
uniformly in , and . Therefore,
as claimed.
Part (ii): Note that
Now, with
we have
which is uniformly in as because is finite and is bounded, and
independent of . This completes the proof.
Part (iii): First observe that
so that follows directly from Assumption 3. What is left to show is that
Note that
By Hölder’s inequality,
where . The first term in braces is bounded in probability because the are finite. For the second term in braces, write for the empirical cumulative distribution of an i.i.d. sample of size from the uniform distribution on and let where is Dirac’s delta at . Then, writing for the derivative with respect to , we get
| (B.2) |
where we have used integration by parts in the first step and replaced by in the second step. We now consider each of the integrals on the right-hand side in turn. First, integrating by parts,
| (B.3) |
Clearly, this term is bounded uniformly on any finite interval. To evaluate it for large values of , observe that
Here,
because and is bounded. Further, because
and as by Lemma B.2, we have
Then, as
we may conclude that the term in (B.3) is uniformly in . Next, for the second term in (B.2) we use Lemma B.1 to establish that, for any , we have
where the term is independent of . The integral term can be bounded in the same way as (B.3). Hence,
uniformly in . We therefore have that
For any it then follows that
Here, our assumption guarantees that we can find such that holds. This concludes the proof. ∎
Proof of Lemma A.4.
First observe that, for any ,
Therefore,
where we have used the definition of in the first step, boundedness of the and in the second step, and the fact that
independent of , in the final step. This completes the proof. ∎
Appendix C Least-squares cross validation
The integrated squared error of
is
Using the definition of and expanding the square the first right-hand side term can be written as
and using properties of the normal distribution we calculate
Next, exploiting that and using well-known results on the truncated normal distribution
Omitting terms for which in the last expression is justified by the fact that . Finally, for the last term, integrating by parts shows that
The integral in the right-hand side expression represents an expectation taken with respect to . A leave-one-out estimator of the entire term is
Combining results and multiplying the entire expression through with yields the cross-validation objective function stated in the main text.
References
- Ahn, Choi, Gale and Kariv (2014) Ahn, D., S. Choi, D. Gale, and S. Kariv (2014). Estimating ambiguity aversion in a portfolio choice experiment. Quantitative Economics 5, 195–223.
- Alvarez and Arellano (2003) Alvarez, J. and M. Arellano (2003). The time series and cross-section asymptotics of dynamic panel data estimators. Econometrica 71, 1121–1159.
- Barras, Gagliardini and Scaillet (2021) Barras, L., P. Gagliardini, and O. Scaillet (2021). Skill, scale, and value creation in the mutual fund industry. Forthcoming in Journal of Finance.
- Bonhomme, Jochmans and Robin (2016a) Bonhomme, S., K. Jochmans, and J.-M. Robin (2016a). Estimating multivariate latent-structure models. Annals of Statistics 44, 540–563.
- Bonhomme, Jochmans and Robin (2016b) Bonhomme, S., K. Jochmans, and J.-M. Robin (2016b). Nonparametric estimation of finite mixtures from repeated measurements. Journal of the Royal Statistical Society, Series B 78, 211–229.
- Browning, Ejrnæs and Alvarez (2010) Browning, M., M. Ejrnæs, and J. Alvarez (2010). Modeling income processes with lots of heterogeneity. Review of Economic Studies 77, 1353–1381.
- Carroll and Hall (1988) Carroll, R. J. and P. Hall (1988). Optimal rates of convergence for deconvoluting a density. Journal of the American Statistical Association 83, 1184–1186.
- Chamberlain (1984) Chamberlain, G. (1984). Panel data. In Z. Griliches and M. Intriligator (Eds.), Handbook of Econometrics, Volume 2 of Handbook of Econometrics, Chapter 22, pp. 1247–1315. Elsevier.
- Chesher (1991) Chesher, A. (1991). The effect of measurement error. Biometrika 78, 451–462.
- Chesher (2017) Chesher, A. (2017). Understanding the effect of measurement error on quantile regressions. Journal of Econometrics 200, 223–237.
- Chetty, Friedman and Rockoff (2014) Chetty, R., J. N. Friedman, and J. E. Rockoff (2014). Measuring the impacts of teachers I: Evaluating bias in teacher value-added estimates. American Economic Review 104, 2593–2632.
- Crucini, Shintani and Tsuruga (2015) Crucini, M. J., M. Shintani, and T. Tsuruga (2015). Noisy information, distance and law of one price dynamics acros US cities. Journal of Monetary Economics 74, 52–66.
- Delaigle and Meister (2008) Delaigle, A. and A. Meister (2008). Density estimation with heteroscedastic error. Bernoulli 14, 562–579.
- Dhaene and Jochmans (2015) Dhaene, G. and K. Jochmans (2015). Split-panel jackknife estimation of fixed-effect models. Review of Economic Studies 82, 991–1030.
- Doss and Gill (1992) Doss, H. and R. D. Gill (1992). An elementary approach to weak convergence for quantile processes, with applications to censored survival data. Journal of the American Statistical Association 87(419), 869–877.
- Efron (2011) Efron, B. (2011). Tweedie’s formula and selection bias. Journal of the American Statistical Association 106, 1602–1614.
- Efron (2016) Efron, B. (2016). Empirical Bayes deconvolution estimates. Biometrika 103, 1–20.
- Evdokimov and Zeleneev (2020) Evdokimov, K. and A. Zeleneev (2020). Simple estimation of semiparametric models with measurement errors. Mimeo.
- Fernández-Val and Lee (2013) Fernández-Val, I. and J. Lee (2013). Panel data models with nonadditive unobserved heterogeneity: Estimation and inference. Quantitative Economics 4, 453–481.
- Guvenen (2009) Guvenen, F. (2009). An empirical investigation of labor income processes. Review of Economic Dynamics 12, 58–79.
- Hahn and Kuersteiner (2002) Hahn, J. and G. Kuersteiner (2002). Asymptotically unbiased inference for a dynamic panel model with fixed effects when both and are large. Econometrica 70, 1639–1657.
- Hahn and Newey (2004) Hahn, J. and W. K. Newey (2004). Jackknife and analytical bias reduction for nonlinear panel models. Econometrica 72, 1295–1319.
- Horowitz and Markatou (1996) Horowitz, J. L. and M. Markatou (1996). Semiparametric estimation of regression models from panel data. Review of Economic Studies 63, 145–168.
- Hu (2008) Hu, Y. (2008). Identification and estimation of nonlinear models with misclassification error using instrumental variables: A general solution. Journal of Econometrics 144, 27–61.
- Hu and Schennach (2008) Hu, Y. and S. M. Schennach (2008). Instrumental variable treatment of nonclassical measurement error models. Econometrica 76, 195–216.
- Jackson, Rockoff and Staiger (2014) Jackson, C. K., J. E. Rockoff, and D. O. Staiger (2014). Teacher effects and teacher related policies. Annual Review of Economics 6, 801–825.
- James and Stein (1961) James, W. and C. Stein (1961). Estimation with quadratic loss. In Proceedings of the Fourth Berkeley Symposium on Mathematical Statistics and Probability, Volume I, pp. 361–379.
- Komlós, Major and Tusnády (1975) Komlós, J., P. Major, and G. Tusnády (1975). An approximation of partial sums of independent RV’-s, and the sample DF. i. Zeitschrift für Wahrscheinlichkeitstheorie und verwandte Gebiete 32, 111–131.
- Li and Vuong (1998) Li, T. and Q. Vuong (1998). Nonparametric estimation of measurement error models using multiple indicators. Journal of Multivariate Analysis 65, 139–165.
- Magnac and Roux (2021) Magnac, T. and S. Roux (2021). Heterogeneity and wage inequalities over the life cycle. European Economic Review 134, 103715.
- Maritz and Jarrett (1978) Maritz, J. S. and R. G. Jarrett (1978). A note on estimating the variance of the sample median. Journal of the American Statistical Association 73, 194–196.
- Mason (1981) Mason, D. M. (1981). Bounds for weighted empirical distribution functions. Annals of Probability 9, 881–884.
- Neyman and Scott (1948) Neyman, J. and E. Scott (1948). Consistent estimates based on partially consistent observations. Econometrica 16, 1–32.
- Okui and Yanagi (2019) Okui, R. and T. Yanagi (2019). Panel data analysis with heterogeneous dynamics. Journal of Econometrics 212, 451–475.
- Okui and Yanagi (2020) Okui, R. and T. Yanagi (2020). Kernel estimation for panel data with heterogenous dynamics. Econometrics Journal 23, 156–175.
- Parsley and Wei (2001) Parsley, D. C. and S.-J. Wei (2001). Convergence to the law of one price without trade barriers or currency fluctuations. Quarterly Journal of Economics 111, 1211–1236.
- Robbins (1956) Robbins, H. (1956). An empirical Bayes approach to statistics. In Proceedings of the Third Berkeley Symposium on Mathematical Statistics and Probability, Volume I, pp. 157–163.
- Rockoff (2004) Rockoff, J. E. (2004). The impact of individual teachers on student achievement: Evidence from panel data. American Economic Review: Papers & Proceedings 94, 247–252.
- Rosenthal (1970) Rosenthal, H. P. (1970). On the subspaces of () spanned by sequences of independent random variables. Israel Journal of Mathematics 8, 273–303.
- Vivalt (2015) Vivalt, E. (2015). Heterogeneous treatment effects in impact evaluation. American Economic Review: Papers & Proceedings 105, 467–470.
- Weinstein, Ma, Brown and Zhang (2018) Weinstein, A., Z. Ma, L. D. Brown, and C.-H. Zhang (2018). Group-linear Empirical Bayes estimates for a heteroscedastic normal mean. Journal of the American Statistical Association 113, 698–710.