MNRAS LaTeX 2ε template – title goes here
Manufacturing cosmic rays in the evolving dynamical states of galaxy clusters
Abstract
Galaxy clusters are known to be reservoirs of Cosmic Rays (CRs), as inferred from theoretical calculations or detection of CR-derived observables. CR acceleration in clusters is mostly attributed to the dynamical activity that produces shocks. Shocks in clusters emerge out of merger or accretion, but which one is more effective in producing CRs? at which dynamical phase? and why? To this aim, we study the production or injection of CRs through shocks and its evolution in the galaxy clusters using cosmological simulations with the enzo code. Particle acceleration model considered here is primarily the Diffusive Shock Acceleration (DSA) of thermal particles, but we also report a tentative study with pre-existing CRs. Defining appropriate dynamical states using the concept of virialization, we studied a sample of merging and non-merging clusters. We report that the merger shocks (with Mach number ) are the most effective CR producers, while high-Mach peripheral shocks (i.e. ) are mainly responsible for the brightest phase of CR injection in clusters. Clusters once merged, permanently deviate from CR and X-ray mass scaling of non-merging systems, enabling us to use it as a tool to determine the state of merger. Through a temporal and spatial evolution study, we found a strong correlation between cluster merger dynamics and CR injection. We observed that the brightest phase of X-ray and CR injection from clusters occur respectively at about 1.0 and 1.5 Gyr after every mergers, and CR injection peaks near to the cluster virial radius (i.e ). Delayed CR injection peaks found in this study deserve further investigation for possible impact on the evolution of CR-derived observables from galaxy clusters.
keywords:
galaxies: clusters: cosmic ray: clusters mergers - dynamical states - hydrodynamics - methods: numerical1 Introduction
Being on the top of the large-scale structure mass hierarchy, galaxy clusters, during its emergence and Giga years (Gyr) of evolution time, witness a cascade of dynamical events. Studies have confirmed that the galaxy clusters had emerged out of the aggregation of structures like galaxies, groups of galaxies, hot inter-cluster medium and warm hot materials from the filaments (Bykov et al., 2015; Yu et al., 2015; Springel et al., 2006). The energy budget of galaxy clusters is thus the cumulative effect of all possible dynamical events such as star formation, supernova activity, AGN activity, galaxy formation and structure mergers at all levels (galaxy, groups, clusters). Recently, a possible role of Dark Matter (DM) annihilation has been claimed (Planck Collaboration et al., 2013; Huber et al., 2013; Berezinsky et al., 1997). So, galaxy clusters are among the best available cosmic laboratories (Blasi, 2004; Berezinsky et al., 1997; Huber et al., 2013) to test the energy evolution of the universe. Though a major fraction of the energy in the clusters is thermal in nature, a non-negligible non-thermal component is also present (Brunetti & Jones, 2014; Petrosian & Bykov, 2008). The observations of cluster-scale radio emission provide the most important evidence for non-thermal components in galaxy clusters (Brunetti & Jones, 2014; van Weeren et al., 2019).
Galaxy clusters usually grow by continuous accretion and mergers of smaller and bigger groups of galaxies. Mergers of galaxy clusters in the mass range between and release an enormous binding energy of about to ergs. It has been proposed that the energy released during these mergers creates huge pressure gradient in the cluster core (see e.g. Paul (2012)). As a result, the medium starts expanding supersonically inducing strong shocks in the baryonic gas (Kang et al., 1996; Miniati, 2000; Paul et al., 2011; Kang & Ryu, 2013). Merger energy then gets dissipated mainly through shock heating and turbulence stirring in the medium (Sarazin & White, 1987; Dolag et al., 2005; Iapichino et al., 2010; Bourdin et al., 2013). Moreover, due to shock acceleration, a significant amount of charged particles gains energy and reaches the non-thermal regime by converting the shock energy and thus contributing to the CR population (Berrington & Dermer, 2003; Sarazin, 2001; Jones et al., 2001). As energy gets dissipated, clusters tend to attain a state of virialisation. At the point of virialisation, almost an equipartition of gravitational energy to kinetic energy can be observed. Roughly a thermodynamic equilibrium is also expected to be established in the cluster medium, if a sufficiently long time is elapsed before it reaches the virialisation (Ballesteros-Paredes, 2006). Clusters deviating from this equilibrium are either having more potential energy (usually this is the phase of a rapid mass accretion/merger) or having more kinetic energy in the course of relaxation (i.e. a state of disturbance or higher entropy) (Barsanti et al., 2016).
Usually shocks due to mergers emerge at the central core of the newly formed clusters and travels radially as spheroidal wave-front towards the virial radius and beyond (Paul et al., 2011; Iapichino et al., 2017; van Weeren et al., 2011; Paul, 2012; Bagchi et al., 2006, 2011). Time-scale of such dissipation for a single merger is found to be about 1-2 Gyr (Paul et al., 2011; Roettiger et al., 1999) indicating an energy dissipation rate of the order of 1047 erg s-1. In this process, the thermal particles in the medium are injected at the shocks and a fraction of them gets accelerated to high energy CR particles through collision-less shock energy dissipation (Malkov, 1998; Ellison & Ramaty, 1985). Also, pre-existing high-energy particles originated from other processes such as numerous star-formation events, supernovae explosions, AGN activity etc., can further be accelerated to very high energies through multiple shock crossings (Kang & Jones, 2007). So, it is quite evident that a fraction of these particles from the thermal pool gets converted into non-thermal CRs, mainly via diffusive shock acceleration (DSA; Blandford & Eichler 1987, Malkov & O’C Drury 2001). The cosmic ray production due to shock acceleration is then expected to be more prominent during the post-merger violent relaxation phase. This indicates a possible strong connection of CR injection and the dynamical state of the cluster systems (Brunetti & Jones, 2014).
Compared to CR electrons, CR protons have larger radiative cooling time, quantitatively by the square of the mass ratio, and are estimated to be of the order of 3-30 Gyr. Having such a high cooling time, protons accelerated by accretion shocks at the outskirts of the cluster can accumulate in the galaxy clusters spanning the Hubble time (Hong et al., 2014; Völk et al., 1996). So, clusters are expected to be major source of high-energy CRs. But surprisingly, no firm detection of gamma rays from clusters are reported yet. However, the non detection of gamma-ray emission from galaxy clusters (for the most recent data, see Ackermann et al. 2016) puts constraints on the content of CR protons in the cluster centres (Brunetti et al. 2017 and references therein).
In this paper, we study the production and evolution of CR particles in the merging and non-merging galaxy clusters to understand the brightest phase of CR injection in clusters. Specifically, we try to understand what are the main factors that control the CR injection in clusters, in terms of the link between dynamical states of clusters to their energy distribution, and to observable diagnostics like the X-ray luminosity. We use the concept of virialisation (see Section 4.1.2) and merger energy distribution (see Section 5.1) to characterise the dynamical state of the simulated galaxy clusters. The simulations, run with the Enzo code (Bryan et al., 2014) includes the effects of star formation, supernova (SN) feedback and cooling due to radiative processes. For our cosmological simulations of structure formation, AGN feedback has not been considered as it is unlikely to have significant impact on scales of high-mass objects like galaxy clusters (Le Brun et al., 2014; McCarthy et al., 2010). Also, the only mechanism considered for CR acceleration in this work is the first-order Fermi process, primarily for thermally accelerated particles. Though keeping in mind the possible effect of pre-existing CRs (preCR hereafter), we also present a special case of acceleration of preCRs as a tentative study. In all our calculations, we neglect the second-order Fermi acceleration and explicit contribution from SNs and AGNs.
Our paper is organised as follows. After giving the introduction in Section 1, we will start with the description of our simulations in Section 2. Modelling thermal and non-thermal energies is described in Section 3 and sample selection will be introduced in Section 4. Evolution of dynamical parameters is explained in Section 5. In Section 6, we report the findings and discuss the results. Linking energetics of clusters with merging events and to the dynamical states will also be reported in this section. Finally, we will summarise the outcomes in Section 7.
2 Simulations of cluster mergers and its analysis details
To create a sample of galaxy clusters, simulations were performed with the Adaptive Mesh Refinement (AMR), grid-based hybrid (N-body plus hydrodynamical) code Enzo v. 2.2 (O’Shea et al., 2005; Bryan et al., 2014). This code uses adaptive refinement in space and time, and introduces non-adaptive refinement in mass by multiple child grid insertions. A flat -CDM background cosmology with specific cosmology parameters = 0.7257, = 0.2743, = 0.0458, h = 0.702 and primordial power spectrum normalisation = 0.812 has been used. Cosmology parameters are obtained from -CDM cosmology, derived from WMAP (5-years data) combined with the distance measurements from the Type Ia supernovae (SN) and the Baryon Acoustic Oscillations (BAO) (see Komatsu et al. (2009)). Simulations have been initialised at redshift using the Eisenstein & Hu (1999) transfer function, and evolved up to . An ideal equation of state was used for the gas, with .
Our research mainly focuses on the production of CRs through Diffusive Shock Acceleration (DSA), which is a strong function of shock strength (Blandford & Eichler, 1987; Ryu et al., 2003). Detection and quantification of shocks is thus an important part of this project. Merger shocks compress the medium near to the shock front, but post shock medium suffers rapid expansion and can induce adiabatic as well as radiative cooling (Akahori & Yoshikawa, 2012; Medvedev & Spitkovsky, 2009; Choi et al., 2004). We have thus used the cooling and heating model of Sarazin & White (1987) that takes into account the effect of radiative cooling due to X-ray emissions and heating due to star formation, star motions and SN. Futher, we have used the star formation and feedback schemes of Cen & Ostriker (1992) with a feedback of 0.25 solar. We have named this model with additional physics as ‘coolSF’ runs (for details, see Paul et al. (2017)). Shocks have been detected in our simulations using un-split velocity jump method of Vazza et al. (2011); Vazza et al. (2009); Skillman et al. (2008) with a temperature floor of K which is found to give better results in AMR simulations (Vazza et al., 2011).
Since shocks are a vital component of our study, in our adaptive mesh refinement strategy, we have used the refinement criteria based on shocks along with the over-density. Over-density criteria has been used on both the DM and the baryon component. The cells will be flagged for refinement if the local density , where ‘i’ can indicate either baryons or DM, fulfils the following criterion:
| (1) |
where is the critical density, is the Hubble parameter at the present epoch, are the cosmological density parameters for either baryons or DM, and the refinement factor is . Here is the refinement level (for root grid, ). In the current work we set for both the overdensities . Since density is very low on the outskirts of the large-scale objects compared to their innermost parts, the AMR based on overdensity is not suitable for refining the flow there (Iapichino et al., 2017). For this reason we also require an additional AMR criterion, whose effectiveness does not depend strongly on density. We use therefore the refinement on shocks as additional AMR criterion. The Mach number of a shock is not a direct function of density, but it depends on the ratio of post and pre-shock densities. This is the reason why, even at regions far away from the centre, where density is very low, we could still reach up to the highest level of refinement at the shocked regions. Enstrophy, derived from vorticity field has been earlier used by Iapichino et al. (2017) for similar purposes.
We have first produced several low-resolution, DM-only runs to select suitable clusters depending on their mass, size and dynamical history and re-simulated them at high resolutions with the full physics setup. The evolution and mass accretion of the forming structures have been followed by producing merger trees with the yt toolkit (Turk et al., 2011). Our main simulations are of (128 Mpc h volume and utilise a root grid with elements. We have introduced 2 nested child grids. Furthermore, 4 additional AMR levels are used in the central (32 volume. The effective spatial resolution is thus of about 30 kpc for the simulations of our reference set (‘RefRES’ hereafter). We have performed a resolution study using some lower and higher resolution and different root grid resolution simulations compared to our RefRES. For a detailed resolution study please refer Appendix B.
3 Modelling X-ray and cosmic ray emissions
3.1 Thermal X-ray emissions model
Merger-induced shocks, gas drag by the density clumps and other similar mechanisms can heat up the intra-cluster medium (ICM) up to few times K (Sarazin, 2002, 1986). The ICM consequently emits X-rays through thermal bremsstrahlung (for a review; Felten et al. 1966; Sarazin 1986), Inverse Compton Scattering of Cosmic Microwave Background Radiation photons by relativistic electrons present in the ICM (Costain et al., 1972; Brecher & Burbidge, 1972) and also by thermal synchrotron radiation. In our simulations, X-ray luminosity and emissivity for a given photon energy range are computed from the emission tables created by Smith et al. (2008) with the photoionization code cloudy (Ferland et al., 1998), that includes all the above mentioned emission processes. We have computed the emission fields for photon energy range from to , which is the typical range for most X-ray telescopes. This range also includes more than 99% of bolometric luminosity. From our simulations, using the above mentioned relations, we have computed the temperature-weighted X-ray emissions.
3.2 Non-thermal cosmic ray emission model
It is well known that collision-less shocks accelerate CRs mainly via the DSA process as studied extensively for supernovae remnant and inter-planetary shocks (Krymskii, 1977; Drury, 1983; Blandford & Eichler, 1987; Blasi, 2013). CR acceleration in galaxy clusters has been so far studied through simulations by solving the diffusion-convection equation explicitly for gas dynamical shocks (Pfrommer et al., 2008; Kang & Ryu, 2013; Kang et al., 2007), as post-processing models implemented in cosmological simulations (Hong et al., 2014) and with dynamical feedback and time evolution computations of CRs in cosmological setup (Vazza et al., 2016; Miniati et al., 2001). All these simulations as well as upper limits from observations (Ackermann et al., 2016, 2014; Huber et al., 2013) show that the CR pressure in ICM can go upto only a few percent of the gas thermal pressure of the systems.
In this work, we model the acceleration of CR protons by injection of available energised particles at the cluster shocks as a post process of cosmological hydrodynamic simulation. Cluster shocks are the collisionless shocks, mediating interactions of charged particles and magnetic fields in the tenuous and high cosmic plasmas (Kang et al., 2007), where and are the thermal and Magnetic pressure in the ICM. Injected particle population in our scheme contains particles from the thermal pool. It may as well contain the preCR particles due to historical energetic events in the system as discussed in the Section 1, which we have taken as a separate case at the end of this study (See Section 6.5). These energised charged particles get accelerated by the collision less shocks, mainly via Fermi I process or DSA. In this process, due to multiple crossings of charged particles across the shocks, the shock flow energy gets transferred to the shocked particles (Drury, 1983). A fraction of the shock kinetic energy flux is thus assumed to be transferred to the CR energy flux. The kinetic energy to CR energy flux conversion efficiency of the shocks is defined as which is a function of the Mach number of the shock . The CR energy flux at the shock surface can therefore be expressed as
| (2) |
where is the shock Mach number, is the kinetic energy flux and given by for a density and velocity of the medium. Expressing Mach number of the shock as with flow velocity and sound speed in the medium as , kinetic energy flux can be written as a function of shock Mach number . The CR energy flux then becomes a steep function of Mach number only and can be expressed as
| (3) |
Injection of ambient energetic particles, acceleration at collision-less shocks and their transport in the ICM are not very well understood processes. So, deriving an analytical form of is rather a complicated task. It has been recognised that a part of the supra-thermal particles available in the Maxwellian distribution tail successfully swim against the Alfvén waves further advecting downstream, and leak to the upstream across the shock and get injected as the CR population (Ryu et al., 2003; Kang & Jones, 2007; Kang & Ryu, 2013). This model is known as the “thermal leakage” injection model. Further, magnetic field amplification happens due to CR streaming instabilities in the shock precursor and the Alfvènic drift of scattering centers. This play a significant role in DSA at astrophysical shocks such as supernova remnant shocks (e.g., Lucek & Bell 2000; Bell 2004; Bykov et al. 2014). Self-amplification of magnetic fields and fast Alfvènic drift in the shock precursor has been implemented into the standard DSA model by Kang & Ryu (2013), who explored various parameters responsible for CR acceleration by solving 1-D diffusion-convection equation to generate the CR acceleration efficiency as a function of Mach number (i.e. ). It is found that the inclusion of magnetic field amplification in the acceleration model leads to a lower efficiency (saturated than the earlier reported value in Kang et al. (2007) (saturated ). Another model with hybrid-simulations by Caprioli & Spitkovsky 2014 shows further lower (about ) saturated efficiency for above Mach number . However they do not discuss the details of acceleration efficiency at low Mach numbers as well as re-acceleration scenario of preCRs.
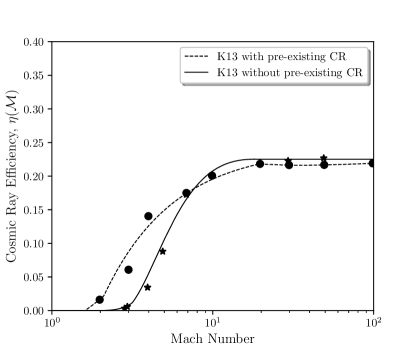
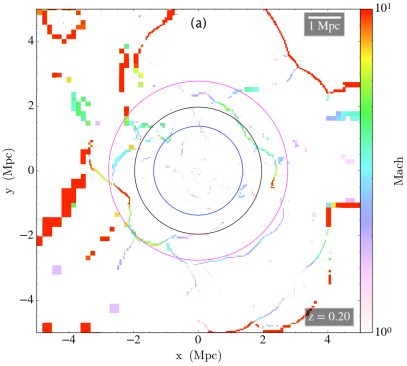
Our study focuses on Mach-dependent CR acceleration and evolution in galaxy clusters using the models of Kang & Ryu (2013). Piece-wise analytical functions of efficiencies with Mach numbers have been derived from Kang & Ryu (2013). A comparison plot of efficiencies of conversion of kinetic to CR flux at shocks according to this model have been provided for both acceleration of thermal particles as well as the re-acceleration of preCRs in Figure 1. It can be noticed in this plot, also, pointed out by Kang & Ryu (2013) that preCR particles contribute significantly more at low Mach numbers (). However, the acceleration efficiency converges to the same value at . Therefore, the role of preCRs would not be significant for high-Mach () shocks. Low-Mach shocks are mostly found well inside the clusters. Instead, cluster outskirts are dominated by shocks beyond Mach number , because of mergers of substructures as well as infall of gas along the filaments (Skillman et al., 2008; Vazza et al., 2009; Paul, 2012). This is visually shown in Figure 2(a) (see also Ryu et al. 2003; Miniati et al. 2001). These are the shocks that are also known for producing the highest energy CRs (Hong et al., 2014).
To study the possible connection of dynamical states with CR injection, an important factor is to understand the brightest phase of CR production in clusters. Our study therefore mainly focuses on the particles accelerated from the thermal pool by the strong shocks. Further, to asses the importance of preCR in this context, in the absence of time evolution process in our simulations, only a special case of re-acceleration of preCRs is discussed. We would also like to stress that in our model, we consider the acceleration as an instantaneous process. The acceleration is treated as a model ingredient but still in post-processing, because we do not implement any physical model to properly follow the time evolution of CRs in our simulations.
The energy of the CRs injected into the cluster medium after shock acceleration has been computed as the fraction of shock kinetic energy flux
| (4) |
whereas thermal energy of the cell is defined as
| (5) |
where is the width of each computed cell, and are respectively the number of particles and temperature of the cell. CR injection to gas thermal pressure is further computed by taking ratio of average CR pressure and gas pressure within increasing radii i.e.
| (6) |
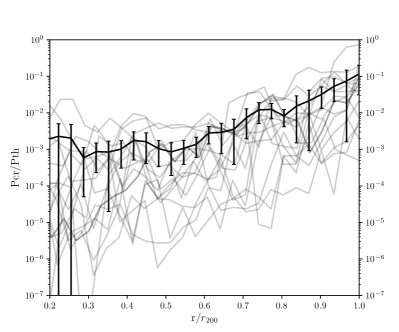
where the pressure of CRs is with as 4/3 for a ultra-relativistic equation of state for CRs. Similarly, with equation of state of an ideal gas as 5/3. The ratio has been plotted for the simulated high mass (final mass ) merging clusters during their evolution after the first merger in Figure 3. It can be noticed in our plot that the ratio goes to as high as 70% at maximum and beyond radius at almost near to . The average profile shows that till , the CR injection pressure is much below 1% of the thermal pressure, but beyond it increases fast and it reaches almost 11% at the outskirts (near to ) of the clusters. Although we are aware that our assumption of an instantaneous CR acceleration in post-processing might be flawed when the CR energy content gets large, compared to the thermal one, here we see that in most of the inner regions of the clusters, this is not the case.
3.2.1 Procedure of CR emission computation in our simulations
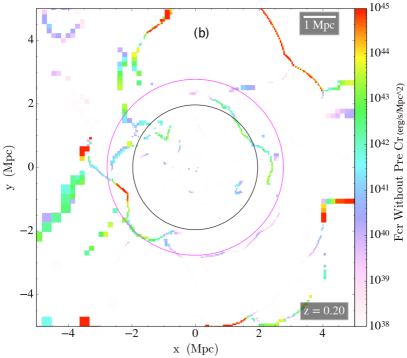
Shocked cells in our simulations have been flagged using the un-split velocity jump method described in Vazza et al. (2011); Vazza et al. (2009); Skillman et al. (2008). The CR energy flux in the cell is computed from Equation 3 using the cell values for the required variables. For typical clusters, the roughly estimated value for cosmic ray flux () from a shocked cell will be almost erg s (see Fig. 2(b)). This corresponds to a CR luminosity of about erg s-1 from the total surface area of a typical merger shock in our simulation, corroborating the estimation by Sarazin (2003). This calculation is valid for an ideal case where a single shock has emerged from a major merger of two groups. In the more realistic scenario probed by the numerical simulations, most of the mergers either pass through the phase of core oscillations producing multiple shocks or multiple mergers take place within a short period of time producing numerous shock surfaces inside the clusters. Moreover, we consider only the shock surfaces that contains shocks with Mach number . To capture all these shocks and their contribution to the CR production, we have considered all those shock surfaces and computed the cell volume weighted average CR flux over the whole volume of the cluster. Finally, we have computed the total CR luminosity for the whole virial volume of the clusters using the relation
| (7) |
Where is the virial radius at over density 200 of each clusters. This will capture all the shocks within the virial () volume while computing the total luminosity. To nullify the effect of our complicated distribution of AMR cell sizes, luminosities within the said regions are computed as weighted average quantities using
| (8) |
where is the volume of the cell.
In rare cases ( cases), filamentary inroads are observed within (e.g. Fig. 2) of the clusters as the virial radius is computed assuming a spherical symmetry. These filamentary entries being placed near to almost voids, bring previously unprocessed materials inside these virial spheres. In absence of photoionization process in our simulation, this may produce extremely high Mach numbers () in few cells. Such cells observed to produce unphysical CR flux () (see Fig. 2, ). Preliminary numerical tests have suggested us to suppress the CR acceleration above a Mach number threshold of M=50. Therefore, the shocked cells with Mach number above that value are removed from our calculations.
4 Sample selection
| Run | Virial Mass (T) | Virial Mass (B) | Virial Radius | Virial Temperature | Merging State |
|---|---|---|---|---|---|
| () | () | (Mpc) | (K) | ||
| 24.81/21.03 | 3.62/3.05 | 3.70/2.76 | 4.73/6.21 | Non-merging | |
| 15.67/12.58 | 2.23/1.76 | 3.17/2.27 | 4.13/5.05 | Merging | |
| 9.08/7.78 | 1.34/1.12 | 2.64/1.96 | 2.87/3.74 | Merging | |
| 9.41 /7.57 | 1.29/1.05 | 2.74/1.97 | 2.58/3.06 | Merging | |
| 9.41/7.33 | 1.31/1.04 | 2.70/1.97 | 2.70/3.41 | Non-merging | |
| 7.26/6.67 | 0.96/0.86 | 2.57/1.83 | 2.46/3.91 | Merging | |
| 6.99/5.77 | 0.97/0.81 | 2.42/1.80 | 2.24/2.82 | Merging | |
| 6.72/5.55 | 0.94/0.75 | 2.47/1.74 | 1.84/2.73 | Non-merging | |
| 0.89/0.78 | 0.11/0.09 | 1.21/0.91 | 0.59/0.73 | Merging | |
| 0.88/0.72 | 0.12/0.10 | 1.23/0.88 | 0.58/0.82 | Non-merging |
For this study, we have simulated ten galaxy clusters with ‘CoolSF’ physics (Section 2). From five different realisations of the low-resolution, DM-only setup, we have chosen the objects that in our judgement seemed to be better representative of different mass ranges and dynamical states. The cluster mass in our samples ranges from a lowest of to the highest of , providing almost two orders of magnitude in mass to study a wide range of systems (for details of these simulated clusters see Table 1).
For identifying objects in our simulations, we have used virial radius as a delimiter, where ‘virial’ refers to the quantity at over density of 200 to the critical density of the universe at that redshift. In the following, over density should be understood as compared to the critical density only. Though we have focused on a central cluster in each high-resolution run, a large number of smaller objects are available within the (32 central volume of our simulations where AMR has been allowed. So, along with the main 10 clusters, for statistical studies, we have a few hundred clusters with the same resolution by combining the data from different sets of simulations. The number has further been increased by considering the output snapshots from various redshifts. We made sure that the DM particles and baryon gas that forms the objects of interest are mostly coming from the well refined Lagrangian region. To do so, we have taken the objects that are placed only within the central (20 volume. Though in our simulations, we have galaxy groups with mass about 10, it has been observed that low mass systems does not follow the cluster mass scaling and possibly needs physical modelling of smaller scales (Bharadwaj et al., 2015; Paul et al., 2015, 2017). So, to ensure roughly the cluster properties of these systems as well as enough statistics and mass range, the minimum mass we have considered for our study is . We did not put any cut-off on highest mass and our list contains mass upto . Mass resolution at the innermost child grid in our simulations is less than i.e. with more than particles provide enough resolution for even the smallest objects used. Also, with 30 kpc effective resolution, systems above having above 500 kpc, get adequately resolved in space.
4.1 Sampling by dynamical activities
4.1.1 Merging and non-merging systems
In our high resolution simulation sample of 10 clusters ( to in Table 1), we have chosen 6 merging systems and 4 non-merging systems. We have computed the merger trees for these objects and accordingly indicated the merging and non-merging systems. A non-merging, relaxed galaxy cluster is a system that has not experienced any merger with a mass ratio larger than 0.1 almost for the last 8 Gyr (from redshift to the current epoch (). i.e. almost all its evolution time (e.g. see the column 6 in Table 1). All other systems are labelled as mergers. Merging systems are spanning from small mergers (ratio more than 0.1 but less than 0.3) to major mergers (ratio more than 0.3, for definition see: Paul et al. (2011) and references therein). Also, there is a cluster that got merged only once (e.g. ) and a system with multiple mergers (e.g. ). We have chosen the biggest two i.e. (non-merging) and (merging) as the primary representative of non-merging and merging samples as their final mass is almost identical (about ). The masses of all other clusters in the list are chosen very carefully to compare them well. Each of the non-merging systems has at least one comparable merging system with similar mass. These clusters are mainly used to study the time evolutions of different physical parameters. We have used different pairs of systems for comparing different parameters depending upon requirements (e.g. mass range, number of mergers etc.).
4.1.2 Dynamical states of galaxy clusters using the concept of virialisation
Evolving galaxy clusters are dynamically very active and cannot attain virial equilibrium in a time shorter than their dynamical time-scale (Ballesteros-Paredes, 2006). For a self gravitating system like the clusters, the corrected form of virial theorem can be expressed as below (Davis et al., 2011).
| (9) |
Where is the moment of inertia of the system and and represent the kinetic energy and gravitational potential energy of the system respectively. For the systems like the galaxy clusters, where influence of external potential (i.e. outside the virialised radius) is significant, can be expressed as , where is the internal potential of the studied system and is due to the mass outside the cluster radius (here, ), but whose tidal effect can be felt. The surface pressure term comes from the velocity dispersion of the galaxies that creates an extra outwards force on the cluster virial surface. At the time when the second derivative of vanishes, the system said to have attained the virial equilibrium (Ballesteros-Paredes, 2006; Davis et al., 2011).
To study the virialisation of galaxy clusters, we define virial ratio as
| (10) |
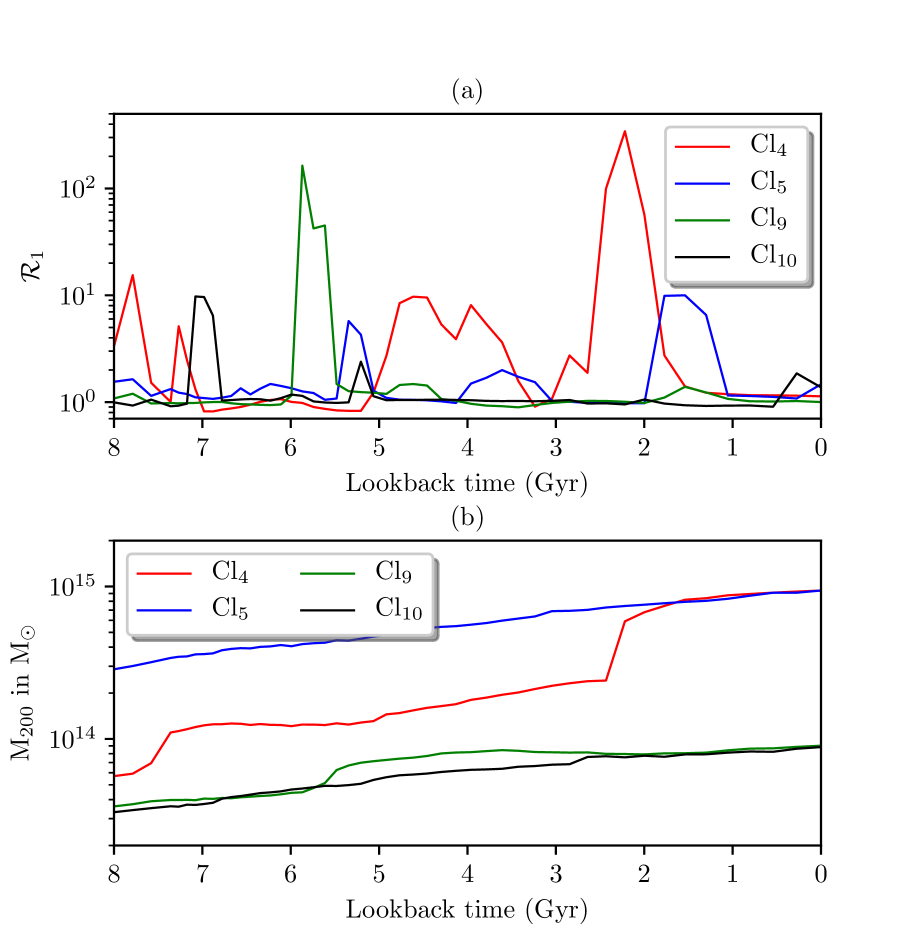
The ratio should be unity for a perfect virialised system. We plot the evolution of this ratio for pairs of clusters of similar mass but different dynamical state, namely ( and ) and ( and ) in Figure 4. Here, we have also shown single () and multiple ( merging systems. From a comparison of the two panels of Figure 4 one can clearly see that, during mergers (visible as a steep mass increase in Fig. 4(b)), the virial ratio has boosts (Fig. 4(a)) too, because the system gains potential energy very fast and also dissipates to various other energy forms in about a Gyr time. In contrast to merger, non-merging systems (i.e. and ) mostly remained virialised for the whole life span. Fig 4, clearly shows that a moderate change in the mass is hugely reflected in virial ratio (), making it clearly identifiable. From a qualitative analysis of Figure 4(a) one can see that, for merging clusters, about one third of the life span remain out of virialisation.
The systems with values much larger or smaller than 1 are respectively either in rapid mass accretion phase or in a phase of relaxation. So, the dynamical state of any system can be determined very accurately, if we know how far a system is from . So, it would be interesting to characterise the dynamical state of the clusters in our sample, in terms of the virialisation parameter defined in Equation 10.
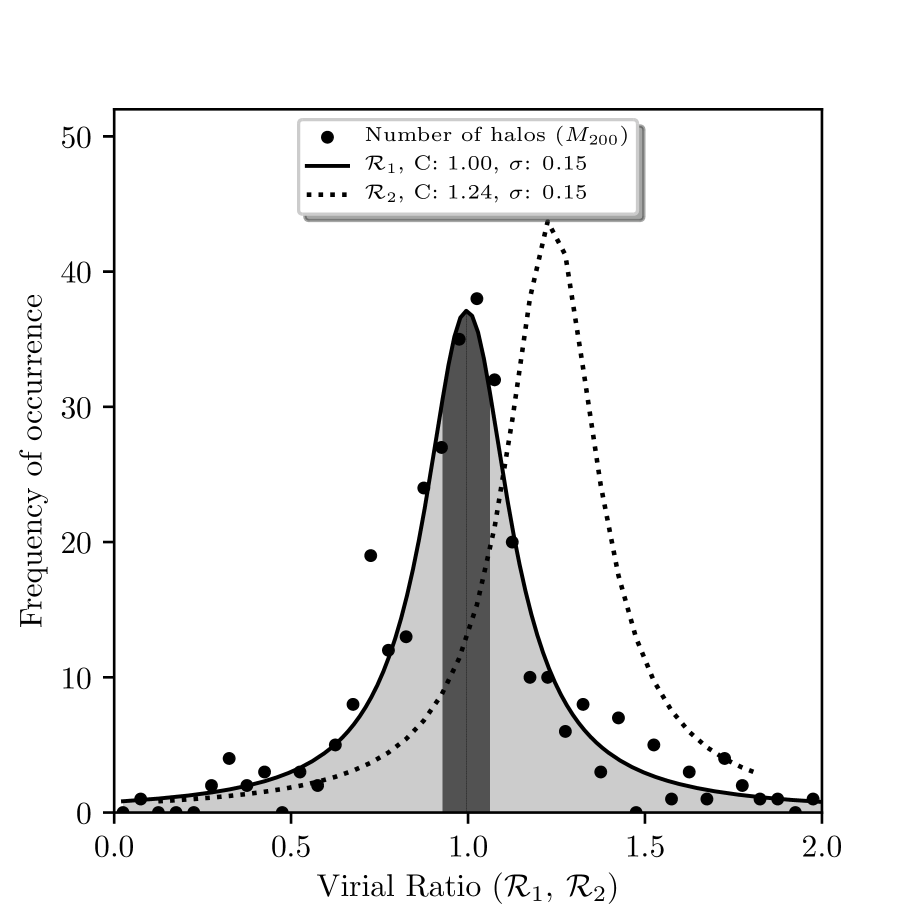
We have chosen about 384 galaxy clusters from different snapshots of our ten realisations. Chosen clusters are in the mass range (virial mass at ) of to in between redshift to . Our simulations though show a statistical mean of this ratio as 0.996, considering a Lorentzian distribution to accommodate the slight asymmetry in the distribution (see Fig 5). For the same systems, if we compute the ratio , the statistical mean comes at 1.23 (Fig 5, dotted line), more than 20% away from . This deviation is known to occur if the surface pressure term arising due to the kinetic stresses at the surface of the collapsing clouds and the external potential due to mass outside the virial radius are not considered for calculating virial ratio (Ballesteros-Paredes, 2006; Shaw et al., 2006).
Wen & Han (2013) found that, in their sample, there are 28% of relaxed clusters. Motivated by analogy with observations, we see that in our sample has about the same fraction of clusters within 10% from 1.0. Thus we define these objects as “virialised”. The clusters that are either having low virial ratio or high ratio will be called as non-virialised clusters in our paper. We have found 278 objects i.e. about 2/3 of the all considered galaxy clusters as non-virialised. A high number of non virialised objects could have been resulted due to inclusion of low mass systems (i.e. less than ) as smaller clusters are expected to be unstable to dynamical activity or mostly non-virialised (Diaferio et al., 1993; Paul et al., 2015, 2017). Non-virialised objects are further divided in to two categories, namely, ‘HighPE’ i.e. objects with higher potential energy (i.e. PE greater than ) and the objects with higher kinetic energy as ‘HighKE’ (i.e. greater than PE).
4.2 Cluster scaling test of the samples
After categorising our sample, we have computed the virial mass (total) and temperature for all virialised clusters. Assuming that for virialised clusters the assumption of hydrostatic equilibrium holds, we aim to check to which extent the well-known scaling relations are valid for them. Self similar relations between the mass, temperature and the virial radius of cluster are given by and i.e. and (e.g., Peebles (1980); Kaiser (1986)). However, observation does not favour this, rather it shows a steeper slope (Maughan et al., 2012). Pre-heating of ICM, non-uniform shock heating, loss of energy to star-formation, non-thermal emissions and so on. i.e. all non-hydrostatic parameters are the major reason for deviation from self similarity (Finoguenov et al., 2001; Nevalainen et al., 2000; Ponman et al., 1999). Also, as these are connected to the dynamical activity of the clusters, they are the prime reasons for many clusters being non-virialised (Aguerri & Sánchez-Janssen, 2010). Since deviation from cluster scaling are mainly attributed to dynamical activities, we expect to find the relation to be close to the theoretical value for perfectly virialised objects, but total sample should show a value close to observed value.

A simple check would help us to validate our choice of virialised objects by testing its relation. To do so, we have plotted these parameters and fitted scaling laws (see Fig. 6). The statistical fit of the parameters of the chosen virialised clusters in our simulations (Fig 6, black dots and fitted line) shown to obey almost the expected theoretical value of and . The scattered points found in the plots are indicating slight deviation from the exact virial condition. Whereas, when we take all the objects from our sample list (Fig 6, all points and grey fitted line), it closely matches with the observational values of and (Finoguenov et al., 2001; Shimizu et al., 2003; Arnaud
et al., 2005; Vikhlinin
et al., 1999). Other scaling laws such as , etc. are presented and discussed in Paul
et al. (2017).
5 Understanding the dynamical states of the simulated systems
5.1 Kinetic and potential energy and the dynamical states of the systems
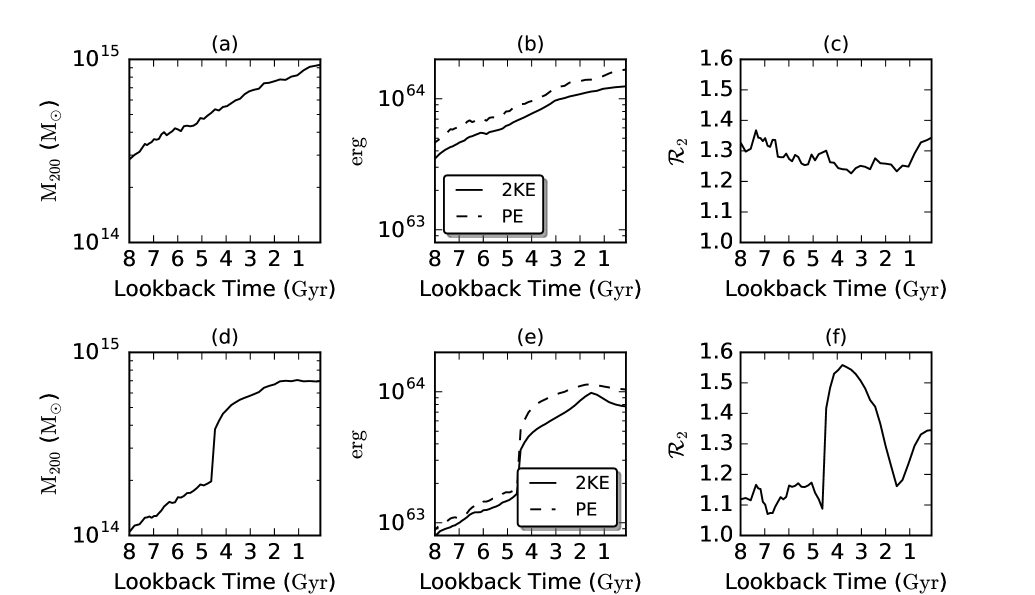
In this section we will further elaborate on the difference between merging and non merging clusters, by studying the time evolution of kinetic and potential energy during the cluster history. We base our analysis on a representative cluster of each category ( and for the non-merging and merging sample , respectively), although our considerations apply to the whole group in general. In Figure 7 one can see that, during the whole time span and for both representative clusters, the potential energy is larger than the kinetic component. In the upper row of the Figure 7, evolution of different quantities is plotted for a cluster ( in our Table 1) that has not experienced any prominent merger during the last 8 Gyr of its evolution. Though the Figure 7(a) and Figure 7(b) show that mass and energies of the system have grown almost 3 times during this period, the ratio of energies (i.e. ) has not changed significantly, rather it remained almost constant (Fig. 7(c)). This indicates that a relaxed system, when accreting mass smoothly or through minor mergers, gets enough time to adjust the energy fraction to hold its hydrostatic equilibrium. In the lower row of Figure7, we have plotted the time evolution of the same quantities for , a cluster that has gone through one significant merger during the same evolution time of 8 Gyr. Figure 7(d) shows a sudden tripling of mass and subsequent slower mass accretion onto the newly formed system which resulted in rapid increment of potential energy within half a Gyr time (in Fig. 7(e)). The growth of the kinetic energy has some time delay with respect to the potential energy. Energy ratio rises very fast, but rate of fall in the energy ratio is much slower and the system takes about 2 Gyr to come back to its pre-merger state (see Fig. 7(f)).
Further, to study the spatial evolution of different energies within a cluster at different dynamical conditions, the radial profile of virial ratio has been plotted (see Fig 8). For this study, our virial ratio definition has been modified slightly from what is defined in Section 4.1.2. External potential by definition is the potential due to the mass outside virial radius i.e., mass residing between to at most the second turn around radius. So, inside the virial radius, the quantity becomes ill defined and show spurious results. Considering this fact, for radial profiles we have modified the virial ratio definition as
| (11) |
To make it easier to understand, in Figs. 8(b) and (c) we plot the over-density ratio on the -axis. Virial radius in this scale would be plotted as . Use of this scale makes it easier as it automatically normalises the axis for comparing a cluster at different times of its evolution. The radial profiles of this quantity have been plotted in Fig. 8(b) at selected times during the evolution of the cluster . Each of these times have been chosen to correspond to specific phases during the merger and subsequent relaxation, as visualised and marked in the evolution of (Fig. 8(a)). A merger event in has started at look back time of Gyr which is depicted by dashed vertical lines. The next one shows the time at Gyr when potential energy gained due to mergers has mostly been converted to kinetic energy i.e. highest kinetic energy phase and shown as dot-dash line. Finally, at 1.54 Gyr, when the cluster has again come to relaxed condition, has been shown as dotted line.
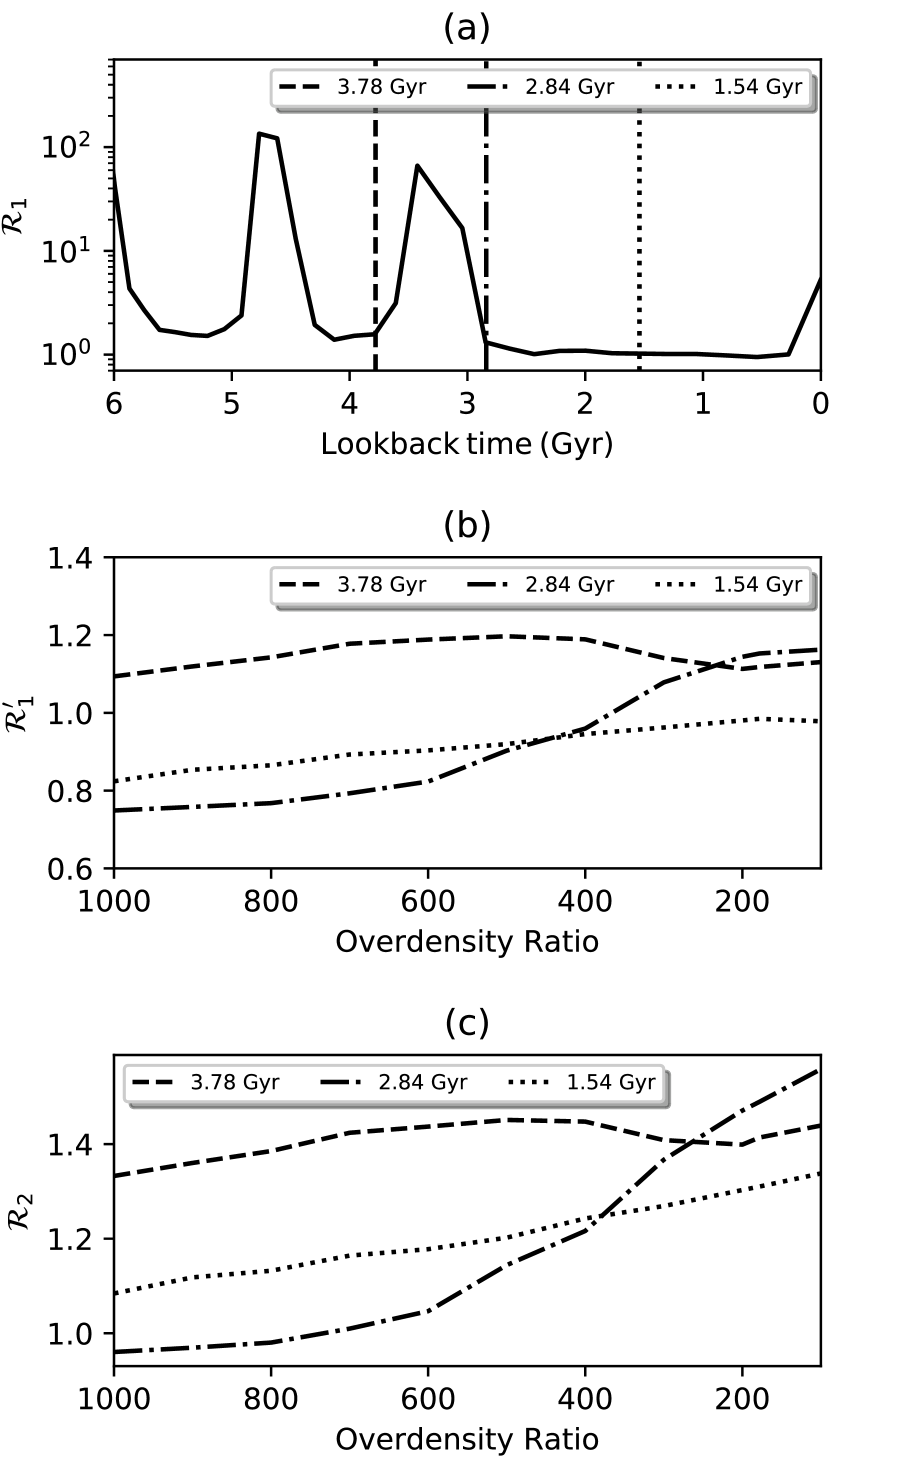
Fig 8(b) shows a possible deviation from the well known spherical accretion model. The cluster core in our simulations never seem to remain in virial equilibrium. Though in relaxed phase, virial ratio makes up to almost 1 at , both merging and relaxing phases show a significant deviation from unity. As we go inside the cluster, the merging state is dominated by potential energy, while the relaxing state is mostly dominated by kinetic energy (see Fig. 8(c)). But only in case of relaxed condition, maximum range of -axis of the cluster till has values near to unity.
5.2 Shocking the cluster medium
In this Section we study the shock properties inside the clusters, mainly the representative parameters of shocks such as shock strength and area that determines the CR emission in the cluster medium. For this, we considered the region inside the virial radius (i.e. r200). Within this cluster volume, shocks have been identified with means of unsplit velocity jumps across the cells (Vazza et al., 2009; Vazza et al., 2011; Skillman et al., 2008).
In the simulated clusters, in general the shock Mach numbers are in the range in the core region i.e . The Mach number goes to almost in regions beyond the core but inside virial radius (i.e. ) (Fig. 2, panel 1, is shown as a representative map). It rarely reaches as high as . Outside the radius (i.e. ) it goes beyond . The shocks inside the virial radius are usually called the internal shocks (Miniati et al., 2000; Skillman et al., 2008).
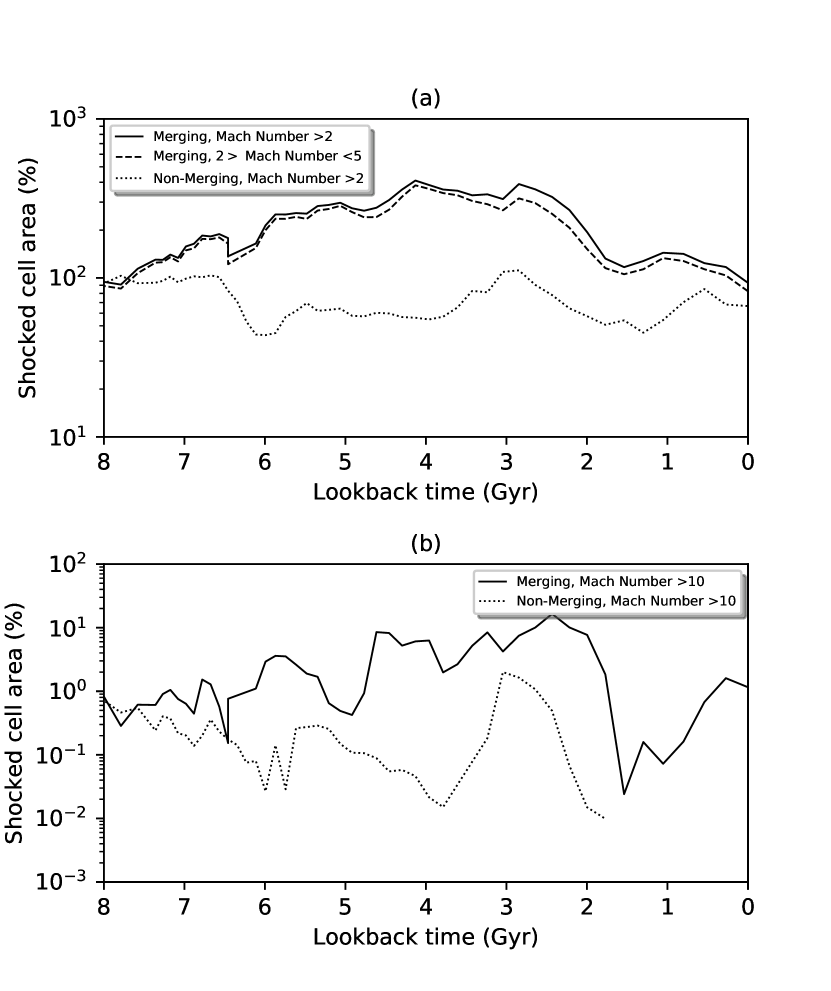
Numerical shocks in grid-based schemes are typically smeared over 3 cells in the direction of shock normal. The shocked surface area has been approximated as the sum of the face area of the cells tagged as shocked (See Vazza et al. (2017)). We have further plotted the percentage of area of shocked cell surfaces (SCS) to the total surface area at for the cluster Cl2 for Mach numbers above and for the last 8 Gyr of its evolution (see Fig. 9). It is also seen in the merging clusters that most of the shocked cell area is actually occupied by the shocks with Mach number between (dashed line in Fig. 9(a)). This plot clearly reveals that during merger, SCS area occupies more than 200 and reaches as much as 111Since luminosity has been calculated from all shocked cells emerged inside the cluster virial volume and there can be many shocks (as seen in Fig. 2, panel 1) filling most part of the volume with multiple layers, we can get more than the surface area of the cluster as shocked. 400% in certain most active phases of the total virial surface area of the cluster, with a sharp contrast to the usual SCS of 100 percent or less in the cluster in relaxed condition (Fig. 9(a), dotted line). Another important observation is that, at low redshift, the SCS rapidly falls down by about an order of magnitude. In a relaxed system, Mach number beyond is hardly reached, whereas, during mergers, surface of strong shocked cells sometimes increase by about folds than that of a relaxed system (see Fig. 9(b)).
6 Dynamical states and its connection to energy evolution
In this section, we combine both the defined diagnostics for the dynamical states of clusters and the proxies to observable quantities to get an overall impression on their correlations, during the cluster evolution . We begin with the CR production due to the acceleration of thermal particles by DSA mechanism.
6.1 Energetics of evolving dynamical states of galaxy clusters
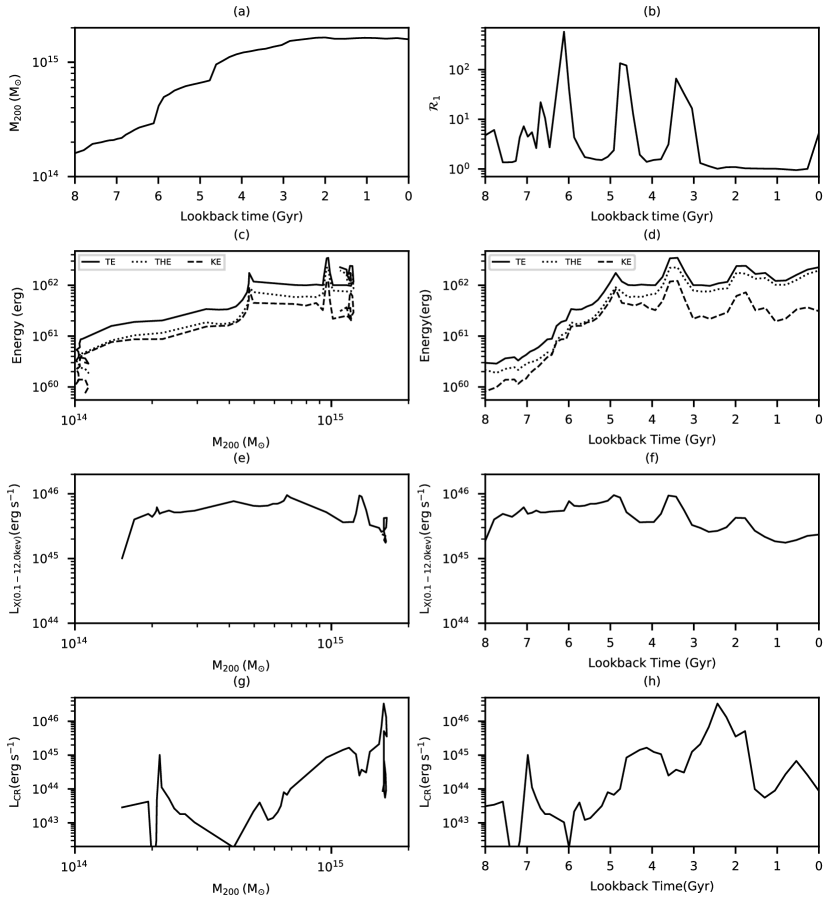
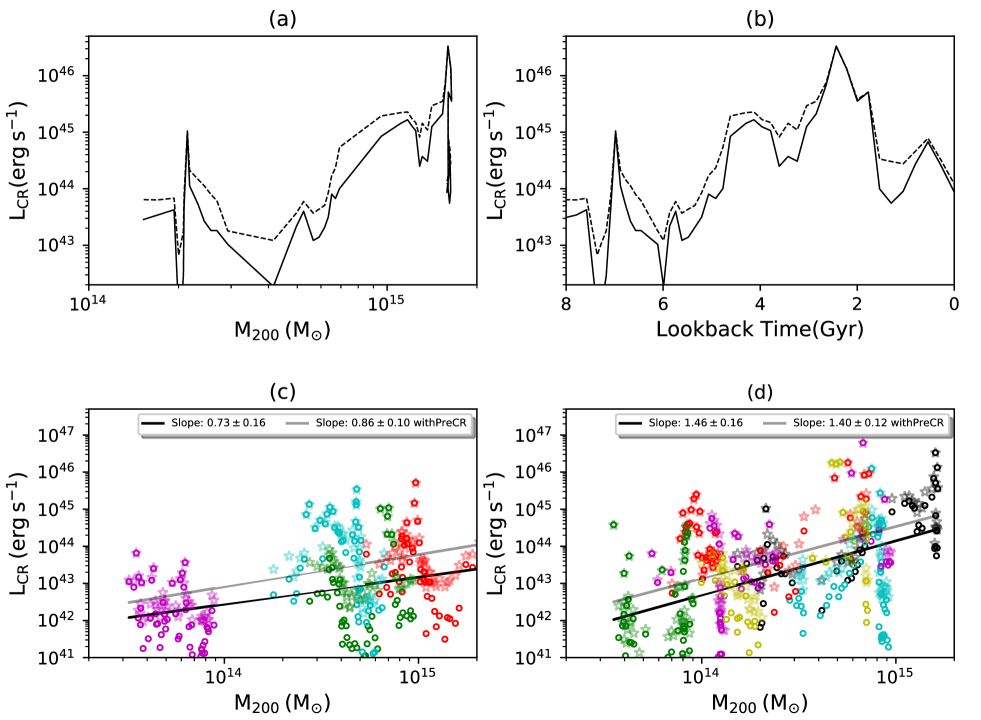
In our simulations, the main representative merging cluster i.e. has gone through multiple mergers during its 8 Gyr of evolution time as shown using the total mass plot in Figure 10(a). This clearly indicates three major mergers roughly at look-back time of 6, 4.5 and 3 Gyr with merging mass ratio varying in the range of 1:1 to 1:3. Virial ratio (see Section 4.1.2) which represents the dynamical state of the system (see Section 4.1.2 and 5.1) peaks at these points indicating a significant change in dynamics of the system (see Fig. 10(b)). On each merger, the total energy (computed as the sum of radial averaged quantities) of the system (thermal energy plus kinetic energy of baryons) increases substantially (see Fig. 10(d)). It is important to stress that the total energy of the system peaks almost a Gyr after each merger as indicated in mass (Fig. 10(a)) and in the virial ratio (Fig. 10(b)). At each instance the time delays of energy are almost the same (i.e. about one Gyr); at about look-back time 5, 3.5 and 2 Gyr respectively (Fig. 10(d)). These are at the same point of time when virial ratio has become lowest after each merger (Fig. 10(b)). The baryon kinetic energy also peaks almost at the same time. This is consistent with theory as these are the phases where most of the potential energy is supposed to be converted to kinetic energy. It is also noticed that relative increment in gas thermal energy is slightly more than the relative increment in total energy. This is due to the gas gaining energy by interaction of baryon particles as well as the additional PdV work by the shocks (Sarazin, 2001). The intracluster medium dissipates a fraction of this energy through different radiation processes within less than a Gyr. Through bremsstrahlung X-rays emission, the system loses its thermal energy while the kinetic energy gets used up to produce cosmic rays by shock acceleration of charged particles. Our results (Fig. 10(f)) show that the phase of X-ray luminosity gain coincides with the gas thermal energy gain due to mergers. Though the cluster starts emitting X-rays in plenty almost a Gyr year after the mergers, cosmic rays take more than one and half Gyr year to reach the peak (Fig 10(h)). The time delays of X-ray and CR injection peaks are consistent in all three mergers for as well as in all other merging clusters (Table 1). The brightest phase of CR injection occurs about 1.5 Gyr after the merger has taken place.
Though the total energy of the system due to mergers increases only by few times in magnitude, the CR injection energy shoots up to almost two orders in magnitude. CR injection and X-ray luminosity both decrease at the low redshift, although the total energy of the cluster keeps growing (see Fig. 10(f) and Fig. 10(h)). The outcome is also supported by the fact that at lower redshift shocked cell area consistently decreases (see Fig 9(a)) reducing both shock heating and CR acceleration efficiency. It is also noticed that percentage of fall of total CR luminosity is more compared to x-ray luminosity (see Figure 10, panel (f),(h)). From the figure 10(e),(g) it can be seen that though merger happens due to rapid accumulation of mass, X-ray emission and CR injection are not correlated with mass.
6.2 Merging state and its connection to cluster energetics
In Figure 11 we compare the mass accretion history and the luminosities in X-rays and CRs of merging and non-merging systems (see Section 4.1.1). Different colours represent different clusters. We have observed that a single significant merger can alter the energy distribution of the system and can dominate for over 2 Gyr (see Fig 7). A major merger can induce turbulence in the system that persists for more than 2 Gyr and up to 4 Gyr in case of core oscillations (Paul et al., 2011) i.e. almost half of its evolution time scale. Cluster mergers are also capable of altering energy budget up to few virial radii from the centre (Iapichino et al., 2017). If this point is considered in terms of cluster scaling laws, it brings to the suggestion that a system once merged may permanently deviate from the scaling that a non-merging system would follow (Ascasibar et al., 2006; Krause et al., 2012). Scaling laws in X-rays (thermal) and CRs (non-thermal) would then indicate it.
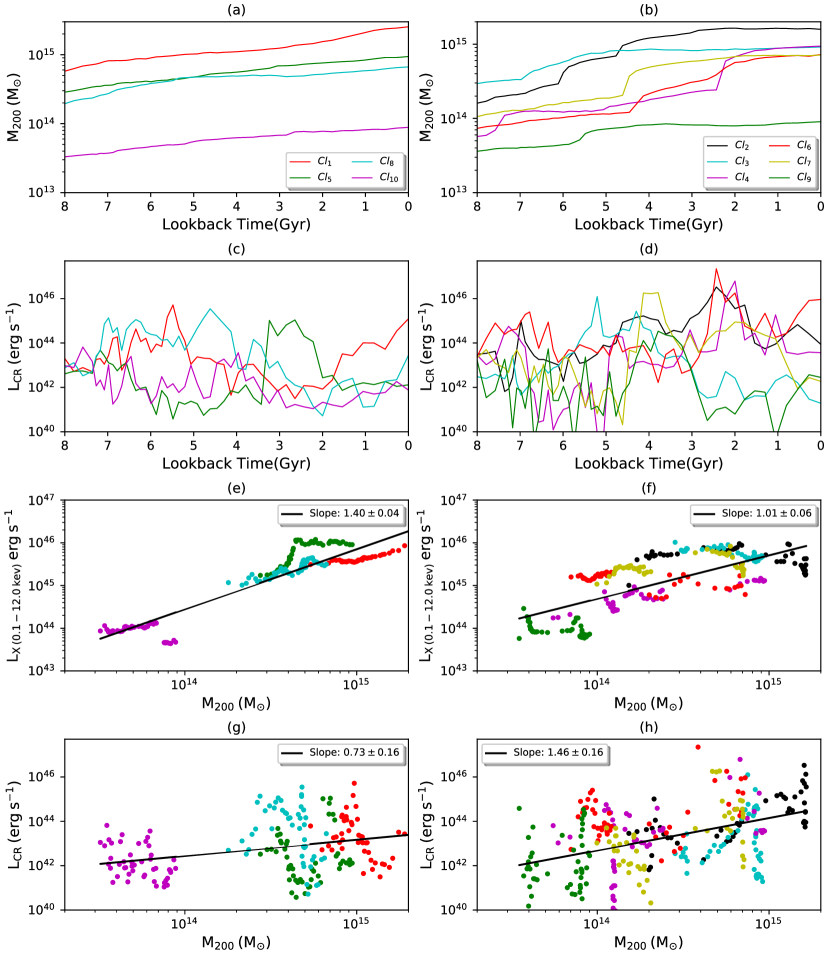
In Figure 11, the left column shows different features of non-merging systems and the right column shows that of merging systems. In Figure 11(a), four non-merging systems have been plotted that show a smooth increment of mass during an evolution time of 8 Gyr. On the other hand Figure 11(b) shows six merging clusters having one or multiple jumps in total mass, indicating that a merger has occurred in the system. In Figure 11(c) and (d), we have plotted the corresponding CR emission luminosity. Though the time evolution of mass looks rather smooth outside merger events, so is not for the evolution of . The evolution of this quantity shows numerous fluctuations with time, pointing to the extreme sensitivity of the CR acceleration to even minor variations of the shock location and strength in the ICM. The cosmic ray emission shows a jump of several orders of magnitude each time a cluster goes through a significant merger. This behaviour can be observed for all the merging systems as plotted in panel (d). The finding described in the Section 6.1 found stronger support in Figure 11(b) and (d), where it can also be noticed that the major CR production peaks come approximately after 1.5 Gyr from every significant mass jump i.e. the mergers. While looking at a large number of systems in our sample, we have noticed (in Fig. 11(g) and (h)) that the clusters with same masses, the average CR luminosity of a non-merging system is almost an order of magnitude less than that of a merging system (compare Fig. 11(c) and (d)). From the same figure, a key conclusion can be drawn about the non-efficient CR acceleration in the high mass systems. It shows that though the initial mergers bring up the injected CR population to several orders of magnitude higher than its value at relaxed condition, injected CR population falls to the level of almost same as the non-merging systems in the final stage of its evolution. For a possible explanation of this feature, we speculate that a cluster that goes through earlier mergers is hotter than the usual clusters. This hot medium will reduce the Mach number of the internal shocks and therefore the shocked surface area and as a consequence DSA becomes less effective.
6.2.1 Scaling relations for merging and non-merging systems
In figure 11(e) to (h), we show the evolution of X-ray and CR luminosity in six merging clusters and four non-merging systems. The points in the plots with same colour represent the same cluster at different times during its evolution. The comparison of the resulting scaling laws and show a clear difference between the merging and non-merging systems. While merging systems show a steeper slope 1.46 for CR luminosity with scatter value of = 0.16, non-merging systems are following much flatter slope of 0.73 with scatter value of = 0.16. The situation got just reversed in case of X-ray emission where merging clusters have much flatter slope of 1.02 (with = 0.06) than the non-merging one which is 1.40 (with = 0.04). This shows that merging significantly changes the energetics of the galaxy clusters. Moreover, a much higher dispersion value found in CR luminosities compared to X-rays is indicative of a transient nature of CR injection connected to cluster dynamics.
6.3 Virialisation and its connection to cluster energetics
In Section 4.1.2 and 5.1, other than the mergers, we have devised another method of determining the dynamical phase of galaxy clusters using virialisation as yardstick. Figure 5 and 8 clearly indicate a difference in the dynamics of the clusters according to its state of virialisation. As discussed in the last paragraph of Section 4.1.2, we have classified systems as virialised and non-virialised and further the non-virialised systems to HighPE and HighKE. We have already discussed in Section 5.1 and 6.1 about how this categorisation helped us in understanding the energy evolution in individual clusters. Further, we will try to use this method for distinguishing objects using the large sample set.
We have noticed that the clusters in merging state gain high potential energy very rapidly. But significant heating of the medium along with increment in kinetic energy happens in the post-merger phase when the medium tries to attain equilibrium through generation of shocks, a phenomenon called as ‘violent relaxation’ (Wise & Abel, 2007). Heating continues till the cluster again comes to relaxed state. This can be understood from the thermal X-ray emission shown in Figure 10(f) and in a large sample in Figure 11(f). Further, CR acceleration, as by-product of shocks, sets in only after a Gyr from the merger i.e. in the post-merger phase. Since the central part of the cluster is the hottest, Mach number of the shock is usually low there i.e. below (within ). Shock becomes stronger beyond the cluster core where the medium is relatively colder. Most of the shocks with Mach number are found between and the virial radius of the cluster (see Fig 2(a)). This tells us that the thermalisation and particle acceleration actually takes place only in the post-merger phase (i.e. HighKE) indicating the introduction of a significant change in energy distribution in the ICM at post-merger compared to the virialised and to the merger phases (i.e. HighPE).
6.3.1 Scaling relations from the state of virialisation
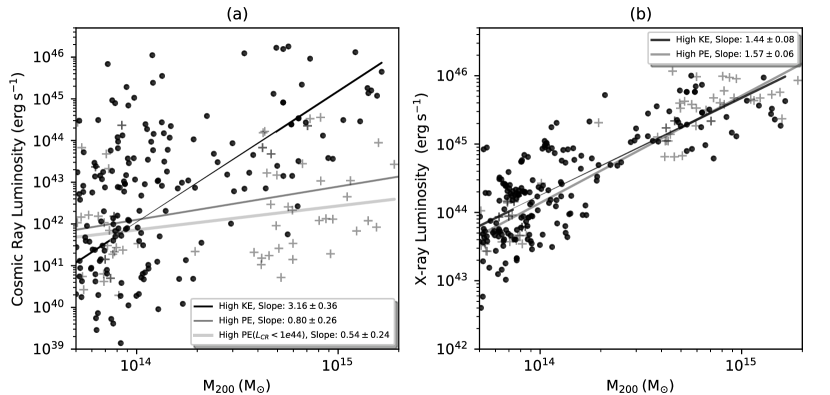
Since dynamical activity in the galaxy clusters modifies the energy budget of the clusters, the contribution to luminosity from the thermal and non-thermal components are expected to change during the cluster evolution. In Figure 12, we have plotted X-ray and CR luminosity of HighKE and HighPE objects against mass. Figure 12(a) shows that highKE clusters have very steep scaling of cosmic ray luminosity with mass i.e. with . The scaling exponent of the HighPE clusters is much flatter, namely . It can be noticed that most of the HighPE objects () have at least an order of magnitude lower than the HighKE objects, therefore, removing few outliers ( erg s-1) the slope becomes even flatter (). X-ray emission from HighKE has a scaling relation of with which does not show much difference with the HighPE objects (), but the marginal change of the scaling slope is in the opposite direction to CRs which is in well agreement with the finding in Section 6.2.1. Importantly, it can also be noticed from these slopes that the average CR energy is less than % of the X-ray energy in all mass ranges for HighPE objects (see Figure 12(a) and (b)). However, objects at the high mass (), in the HighKE group have larger than the ones of the HighPE group. The difference is more than an order of magnitude, and HighKE clusters have almost as large as their . This becomes an indicator of post-merger and non-virialised systems for the high mass objects.
6.4 Mach number distribution and its connection to CR emissions
Cosmic ray injection due to particle acceleration is usually known to be a steep function of shock strength (Ryu et al., 2003). In Figure 13, the evolution of the CR flux as a function of the shock Mach number for the representative merging cluster is shown. The plot clearly shows that the most CR acceleration is happening for the Mach number ranging (peak at about ) during the evolution of the merging clusters, in agreement with the work of Hong et al. (2014). We have also found that the peak of cosmic ray emission is seen to move towards higher number starting from as the time passes after a merger. This happens on a time scale of Gyr during each mergers. Similar plots as Figure 13 for other merging clusters, not shown here, demonstrate that the range and the peak slightly varies in different merging clusters in our sample but the basic trend holds for all mergers. This also indicates that most of the CR acceleration is probably happening due to the main merger shock (see Section 5.2), which increases its Mach number while propagating in a colder medium towards the cluster outskirts.
We further notice that this variation of range and the peak of effective Mach number is a steep function of the shock area. Figure 9(a) shows the differential area with Mach number ranges. It is evident from this plot that almost all shocked cells are associated to shocks with Mach number in the range , while, Mach number above is occupying very minor fraction of the virial surface area (about 10% only, see Fig. 9(b)). Shocked area in , the non-merging cluster, is seen to be almost flat and stays at a level of 100% or below throughout the cluster evolution. The same behaviour is also shown by the CR luminosity which has a rather flat evolution with time and stays at a level of 1042-43 ergs-1 (Fig. 11(c)). It has also been noticed that at low redshift, the shocked area in the merging cluster has decreased to a value typical of non-merging clusters. As a consequence, also its CR luminosity decreases to a value typical of non-merging objects 1043 ergs-1, Fig 11(d).
6.5 Re-acceleration of pre-existing Cosmic Rays
So far, we discussed about CR production by the acceleration of thermal particles. However, it is well known that clusters host a significant amount of preCRs that may affect the CR injection. Re-acceleration of preCRs is more efficient at low Mach shocks (Kang & Ryu, 2013), seen in plenty inside the cluster virial radius, and during the initial stage of mergers as shown in Figure 2(a) in this study, as well as reported in several simulation studies (Miniati et al., 2001; Hong et al., 2014). For this reason it is important to discuss the role of the re-acceleration of preCRs in clusters. The acceleration of preCR is very sensitive to the pre-existing CR pressure in the medium. This would need to be properly computed at runtime in the simulation. This is not the case in our approach, however we mimic the presence of preCRs in a test where an initial CR to thermal pressure ratio of 0.05 and a slope of CR proton s = 4.5 in each of the cells inside the cluster volume are assumed. Then the piecewise fitting formula from Kang & Ryu (2013) is implemented.
In this test, preCRs are found to alter the particle acceleration significantly at low Mach numbers as shown by the comparison of Figure 1 and Figure 15. CR acceleration efficiency for preCRs peaks at lower Mach shocks i.e. (Appendix A) as compared to for thermal particles (Fig 13). Shocks when emerged and propagated in the cluster central region (i.e. at ) have a low Mach number and efficiently re-accelerate preCRs during early stages of mergers as seen in a representative slice plot in Figure 17 and 16. It is also noticed that on an average, the CR pressure is much higher inside of the clusters as discussed in Appendix A, Figure 16. Figure 14 presents the comparison of a few crucial results obtained for CR acceleration of thermal particles and the re-acceleration of preCRs. With the example of our reference merging cluster (), we recognise no significant difference in the basic nature of production, temporal and spatial evolution of CRs using these two schemes. However, in Figure 14(a) and (b), we notice that the level of CR luminosity during non-merging as well as the early period of merger is highly dominated by preCRs, though at the peak, we found no difference. Finally, as indicated by a single system in the first two panels, no significant difference is observed in evolution pattern when several systems are studied (see Figure 14(c) and(d)). However, the average value of CR luminosity combining all these systems seems to have altered significantly with a change of almost half an order of magnitude. Notably, the change is similar in both merging and non-merging systems as shown in Figure 14(c) and (d).
6.6 Limitations of this study
Since DSA is widely accepted to be the main mechanism behind cosmic ray acceleration in the large scale structures (Kang et al., 1997; Miniati et al., 2001), our study considers only DSA as the particle acceleration mechanism. In this context, other works motivated by the observed cluster scale radio emissions have also pointed out about the contribution from turbulent re-acceleration (Brunetti, 2016; Brunetti & Lazarian, 2011; Eckert et al., 2017). We are well aware of the important role of AGN activity and SN explosion in the CR acceleration, especially for providing a pristine CR pool for both DSA and re-acceleration model (Kang et al., 2007; Brunetti & Lazarian, 2011).
Primarily, our study is based on the acceleration of thermal particles by DSA. We also present a constraint model of CR acceleration by DSA that considers preCR population (Kang & Ryu, 2013). But, we did not work at all on turbulent re-acceleration of preCR or their (AGN and SN) direct contribution. Further, our computation of CR acceleration is done using the piece-wise fitting function of CR acceleration efficiency from Kang & Ryu (2013) as the post process of the snapshots taken from our hydrodynamics plus N-body simulations. So, our calculations consider only instantaneous CR acceleration or injection, and no time evolution solutions. However, the peak of CR luminosity for merging clusters is, in some cases, one order of magnitude or more larger than the pre-merger value, partly justifying the instantaneous approach for the CR acceleration in those cases. CR transport mechanism has also been ignored here.
Study with preCR as discussed in Section 6.5 is a tentative study that only shows a possible picture of the effect of re-acceleration of preCRs in overall CR production and evolution scenario. Diagnostic used here is indicative only and prone to over or underestimate the physical parameters, therefore, should not be taken as a generic case while using it as a benchmark to explain any theoretical or observational upper limits.
Since the physical process of CR emission evolves with time and transport of high energy particles alters its energy and distribution, to obtain a more realistic picture one has to implement all the above mentioned physics in the calculations as well as a computation scheme that takes care of time evolution. Therefore, this study is aimed only to understand the CR injection properties i.e. transient nature of CR emission rather than the total accumulation of CRs inside the clusters.
7 summary
In this paper, we report an extensive study on the cluster dynamics and energetics as well as origin, injection and temporal and spatial evolution of cosmic rays in merging and non-merging galaxy clusters. We have performed cosmological simulations with the AMR code Enzo (Bryan
et al., 2014). The cosmic ray production in space and time is elucidated in detail (see Section 6.2) as a post-processing steps of cosmological simulations using the CR acceleration efficiency models of Kang &
Ryu (2013). We have primarily considered the acceleration of thermally energised particles by DSA, as well as discussed in brief, a special case of re-acceleration of preCRs, improving over the works of Hong
et al. (2014). We find a strong connection between the dynamical states of galaxy clusters and the production of CRs. Energy distribution in clusters are shown to be directly related to merger activity, fractional area covered by shocks and on how far a cluster is away from virialisation (according to the definition of virialisation in Section 4.1.2). The main outcomes of this study are the following:
-
•
We show that the percentage of shocked surface area in a cluster is crucial for CR emission efficiency. In most of the clusters, Mach number in the range between captures the most of the shocked area and is therefore the most effective generator of CRs. Since this is the Mach number range of internal or merger shocks, it can be inferred that merger events are the most effective engines for CR acceleration from clusters. But, the high Mach number () merger and accretion shocks at cluster periphery are found to be important for deciding the brightest phase of CR injection i.e. emission peaks in the clusters.
-
•
Our study shows that there is a consistent time delay in the peaks of X-ray emission and CR injection, considered to be the tracers of thermal and non-thermal energy production during merger events. The X-ray luminosity and total energy of merging galaxy clusters are observed to attain a maximum after 1 Gyr of the merging event, whereas, luminosity of CR injection reaches its peak after about 1.5 Gyr after the merger. The same pattern is noticed in both the cases of acceleration of thermal as well as preCR particles. This non-concurrence of the thermal and non-thermal injection peaks found in this study needs further investigation for its impact on the evolution of CR-derived observables from galaxy clusters.
-
•
Clusters with merging history permanently deviates from the mass scaling laws for X-ray and CR injection luminosity of non-merging systems (see Section 6.2.1 and Figure 11 (e) to (h)). For non-merging clusters, it is observed that slope is flatter for CRs (i.e. ) but steeper in X-rays (). The contrary can be seen in case of merging clusters, where CR luminosity increases very steeply with mass (), while X-ray luminosity scales linearly (). Interestingly, it is observed in the time evolution study in Fig 10 that the mass of clusters is not correlated to luminosity during the mass accretion history, especially as far as is concerned.
-
•
Virial ratio as defined in Section 4.1.2 has been found to be useful tool for determining the dynamical state of galaxy clusters. From an observational viewpoint, it is sufficient to get the information on velocity dispersion of the constituent galaxies in a cluster, mass of the system, its size, namely the virial radius and second turn over radius to compute its state of virialisation. This quantity exhibits a distinct peak at the time of merger (see Fig. 4 and Fig.10) enabling it to be used as a tool to determine the actual dynamical state.
-
•
Simulated merging clusters in our sample do not show virialisation inside the overdensity ratio of r200 (see Fig. 8). During the merger phase, the core is dominated by the potential energy, whereas, during the violent relaxation phase, it is mostly dominated by the kinetic energy. A similar finding has been reported in Shaw et al. (2006). The apparent discrepancy with the simplified case of the spherical collapse model can be attributed to the complexity of cosmological setup with the presence of filaments and numerous sub-structures and their merger activities.
-
•
To better study the properties of non-virialised objects, we divide them into two categories, HighKE and HighPE (see Section 4.1.2 last paragraph for the definitions) the cosmic ray production grows non linearly with mass for HighKE objects () compared to HighPE objects ( and with removed outliers). Conversely, the mass scaling of does not show any substantial difference between the two groups. Observed difference of magnitude in HighPE compared to HighKE clusters is a clear indicator of activity for high mass clusters (for mass ).
-
•
CRs produced from the acceleration of injected thermal particles, and the specific case of injection of preCRs described in this study, show a similar nature of production and evolution (both temporal and spatial). PreCR seems important for CR injection by low Mach shocks, during the early stages of mergers and CR content of the inner part () of the clusters. PreCR may also be vital for accounting the total CR injection in clusters, which in our special case, show an average increment of half an order in magnitude over the injection from the thermal pool.
Acknowledgements
This project is funded by DST-SERB, Govt. of India, under the Fast Track scheme for young scientists, Grant No. SR/FTP/PS-118/2011. We are thankful to The Inter-University Centre for Astronomy and Astrophysics (IUCAA) for providing the HPC facility. Computations described in this work were performed using the Enzo code developed by the Laboratory for Computational Astrophysics at the University of California in San Diego (http://lca.ucsd.edu) and data analysis is done with the yt-toolkit (http://yt-project.org/). We would like to thank the anonymous referee for making the most useful comments that helped us to improve the content of the paper significantly. Thanks to Prof. Heysung Kang as well for her valuable suggestions and help regarding the current status of CR acceleration computation.
References
- Ackermann et al. (2014) Ackermann M., Ajello M., Albert A., Allafort A., Atwood W. B., Baldini L., Ballet J., et al. F., 2014, ApJ, 787, 18
- Ackermann et al. (2016) Ackermann M., Ajello M., Albert A., Atwood W. B., Baldini L., Ballet J., Barbiellini G., Bastieri D., Bechtol K., Bellazzini R., Fermi-LAT Collaboration Rephaeli Y., 2016, ApJ, 819, 149
- Aguerri & Sánchez-Janssen (2010) Aguerri J. A. L., Sánchez-Janssen R., 2010, A&A, 521, A28
- Akahori & Yoshikawa (2012) Akahori T., Yoshikawa K., 2012, PAJS, 64, 12
- Arnaud et al. (2005) Arnaud M., Pointecouteau E., Pratt G. W., 2005, A&A, 441, 893
- Ascasibar et al. (2006) Ascasibar Y., Sevilla R., Yepes G., Müller V., Gottlöber S., 2006, MNRAS, 371, 193
- Bagchi et al. (2006) Bagchi J., Durret F., Neto G. B. L., Paul S., 2006, Science, 314, 791
- Bagchi et al. (2011) Bagchi J., Sirothia S. K., Werner N., Pandge M. B., Kantharia N. G., Ishwara-Chandra C. H., Gopal-Krishna Paul S., Joshi S., 2011, ApJ, 736, L8
- Ballesteros-Paredes (2006) Ballesteros-Paredes J., 2006, MNRAS, 372, 443
- Barsanti et al. (2016) Barsanti S., Girardi M., Biviano A., Borgani S., Annunziatella M., Nonino M., 2016, A&A, 595, A73
- Bell (2004) Bell A. R., 2004, MNRAS, 353, 550
- Berezinsky et al. (1997) Berezinsky V. S., Blasi P., Ptuskin V. S., 1997, ApJ, 487, 529
- Berrington & Dermer (2003) Berrington R. C., Dermer C. D., 2003, ApJ, 594, 709
- Bharadwaj et al. (2015) Bharadwaj V., Reiprich T. H., Lovisari L., Eckmiller H. J., 2015, A&A, 573, A75
- Blandford & Eichler (1987) Blandford R., Eichler D., 1987, Phys. Rev., 154, 1
- Blasi (2004) Blasi P., 2004, Journal of Korean Astronomical Society, 37, 483
- Blasi (2013) Blasi P., 2013, A&ARv, 21, 70
- Bourdin et al. (2013) Bourdin H., Mazzotta P., Markevitch M., Giacintucci S., Brunetti G., 2013, ApJ, 764, 82
- Brecher & Burbidge (1972) Brecher K., Burbidge G. R., 1972, ApJ, 174, 253
- Brunetti (2016) Brunetti G., 2016, Plasma Physics and Controlled Fusion, 58, 014011
- Brunetti & Jones (2014) Brunetti G., Jones T. W., 2014, International Journal of Modern Physics D, 23, 30007
- Brunetti & Lazarian (2011) Brunetti G., Lazarian A., 2011, MNRAS, 410, 127
- Brunetti et al. (2017) Brunetti G., Zimmer S., Zandanel F., 2017, MNRAS, 472, 1506
- Bryan et al. (2014) Bryan G. L., Norman M. L., O’Shea B. W., Abel T., Wise J. H., Turk M. J., Reynolds D. R., Enzo Collaboration 2014, ApJS, 211, 19
- Bykov et al. (2015) Bykov A. M., Churazov E. M., Ferrari C., Forman W. R., Kaastra J. S., Klein U., Markevitch M., de Plaa J., 2015, SSRv, 188, 141
- Bykov et al. (2014) Bykov A. M., Ellison D. C., Osipov S. M., Vladimirov A. E., 2014, ApJ, 789, 137
- Caprioli & Spitkovsky (2014) Caprioli D., Spitkovsky A., 2014, ApJ, 783, 91
- Cen & Ostriker (1992) Cen R., Ostriker J. P., 1992, ApJL, 399, L113
- Choi et al. (2004) Choi Y.-Y., Reynolds C. S., Heinz S., Rosenberg J. L., Perlman E. S., Yang J., 2004, ApJ, 606, 185
- Costain et al. (1972) Costain C. H., Bridle A. H., Feldman P. A., 1972, ApJ, 175, L15
- Davis et al. (2011) Davis A. J., D’Aloisio A., Natarajan P., 2011, MNRAS, 416, 242
- Diaferio et al. (1993) Diaferio A., Ramella M., Geller M. J., Ferrari A., 1993, AJ, 105, 2035
- Dolag et al. (2005) Dolag K., Vazza F., Brunetti G., Tormen G., 2005, MNRAS, 364, 753
- Drury (1983) Drury L. O., 1983, Reports on Progress in Physics, 46, 973
- Eckert et al. (2017) Eckert D., Gaspari M., Vazza F., Gastaldello F., Tramacere A., Zimmer S., Ettori S., Paltani S., 2017, ApJ, 843, L29
- Eisenstein & Hu (1999) Eisenstein D. J., Hu W., 1999, ApJ, 511, 5
- Ellison & Ramaty (1985) Ellison D. C., Ramaty R., 1985, ApJ, 298, 400
- Felten et al. (1966) Felten J. E., Gould R. J., Stein W. A., Woolf N. J., 1966, ApJ, 146, 955
- Ferland et al. (1998) Ferland G. J., Korista K. T., Verner D. A., Ferguson J. W., Kingdon J. B., Verner E. M., 1998, PASP, 110, 761
- Finoguenov et al. (2001) Finoguenov A., Reiprich T. H., Böhringer H., 2001, A&A, 368, 749
- Hong et al. (2014) Hong S. E., Ryu D., Kang H., Cen R., 2014, APJ, 785, 133
- Huber et al. (2013) Huber B., Tchernin C., Eckert D., Farnier C., Manalaysay A., Straumann U., Walter R., 2013, A&A, 560, A64
- Iapichino et al. (2017) Iapichino L., Federrath C., Klessen R. S., 2017, MNRAS, 469, 3641
- Iapichino et al. (2010) Iapichino L., Maier A., Schmidt W., Niemeyer J., 2010, in AIP Conference Proceedings Vol. 1241, Turbulence modeling and the physics of the intra-cluster medium. pp 928–934
- Jones et al. (2001) Jones T. W., Miniati F., Ryu D., Kang H., 2001, in Aharonian F. A., Völk H. J., eds, American Institute of Physics Conference Series Vol. 558 of AIP Conference Proceedings, Winds and shocks in galaxy clusters: Shock acceleration on an intergalactic scale. pp 436–447
- Kaiser (1986) Kaiser N., 1986, MNRAS, 222, 323
- Kang & Jones (2007) Kang H., Jones T. W., 2007, Astroparticle Physics, 28, 232
- Kang et al. (1997) Kang H., Rachen J. P., Biermann P. L., 1997, MNRAS, 286, 257
- Kang & Ryu (2013) Kang H., Ryu D., 2013, ApJ, 764, 95
- Kang et al. (2007) Kang H., Ryu D., Cen R., Ostriker J. P., 2007, ApJ, 669, 729
- Kang et al. (1996) Kang H., Ryu D., Jones T. W., 1996, ApJ, 456, 422
- Komatsu et al. (2009) Komatsu E., Dunkley J., Nolta M. R., Bennett C. L., Gold B., Hinshaw G., Jarosik N., Larson D., Limon M., Page L., Spergel D. N., Halpern M., Hill R. S., Kogut A., Meyer S. S., Tucker G. S., Weiland J. L., Wollack E., Wright E. L., 2009, ApJS, 180, 330
- Krause et al. (2012) Krause E., Pierpaoli E., Dolag K., Borgani S., 2012, MNRAS, 419, 1766
- Krymskii (1977) Krymskii G. F., 1977, Akademiia Nauk SSSR Doklady, 234, 1306
- Le Brun et al. (2014) Le Brun A. M. C., McCarthy I. G., Schaye J., Ponman T. J., 2014, MNRAS, 441, 1270
- Lucek & Bell (2000) Lucek S. G., Bell A. R., 2000, MNRAS, 314, 65
- Malkov (1998) Malkov M. A., 1998, PhRvE, 58, 4911
- Malkov & O’C Drury (2001) Malkov M. A., O’C Drury L., 2001, Reports on Progress in Physics, 64, 429
- Maughan et al. (2012) Maughan B. J., Giles P. A., Randall S. W., Jones C., Forman W. R., 2012, MNRAS, 421, 1583
- McCarthy et al. (2010) McCarthy I. G., Schaye J., Ponman T. J., Bower R. G., Booth C. M., Dalla Vecchia C., Crain R. A., Springel V., Theuns T., Wiersma R. P. C., 2010, MNRAS, 406, 822
- Medvedev & Spitkovsky (2009) Medvedev M. V., Spitkovsky A., 2009, ApJ, 700, 956
- Miniati (2000) Miniati F., 2000, PhD thesis, University of Minnesota, USA
- Miniati et al. (2001) Miniati F., Ryu D., Kang H., Jones T. W., 2001, ApJ, 559, 59
- Miniati et al. (2000) Miniati F., Ryu D., Kang H., Jones T. W., Cen R., Ostriker J. P., 2000, ApJ, 542, 608
- Nevalainen et al. (2000) Nevalainen J., Markevitch M., Forman W., 2000, ApJ, 532, 694
- O’Shea et al. (2005) O’Shea B. W., Bryan G., Bordner J., Norman M. L., Abel T., Harkness R., Kritsuk A., 2005, in Adaptive Mesh Refinement – Theory and Applications. Springer, Berlin, New York Vol. 41 of Plewa T., Linde T., Weirs V.G, eds, Lecture Notes in Computational Science and Engineering, Introducing Enzo, an AMR Cosmology Application. p. 341
- Paul (2012) Paul S., 2012, in Pal S., Basu B., eds, International Conference on Modern Perspectives of Cosmology and Gravitation (COSGRAV12), Journal of Physics: Conference Series, Volume 405 Vol. 405 of Journal of Physics: Conference Series, Cluster merger blast wave and the mystery of ringlike radio-relic formation around some galaxy clusters. p. 012026
- Paul et al. (2015) Paul S., Gupta P., John R. S., Punjabi V., 2015, in The Many Facets of Extragalactic Radio Surveys: Towards New Scientific Challenges Uniqueness of galaxy groups in the structural hierarchy from its radio signature. p. 65
- Paul et al. (2011) Paul S., Iapichino L., Miniati F., Bagchi J., Mannheim K., 2011, ApJ, 726, 17
- Paul et al. (2017) Paul S., John R. S., Gupta P., Kumar H., 2017, MNRAS, 471, 2
- Peebles (1980) Peebles P. J. E., 1980, The large-scale structure of the universe
- Petrosian & Bykov (2008) Petrosian V., Bykov A. M., 2008, SSRv, 134, 207
- Pfrommer et al. (2008) Pfrommer C., Enßlin T. A., Springel V., 2008, MNRAS, 385, 1211
- Planck Collaboration et al. (2013) Planck Collaboration Ade P. A. R., Aghanim N., Arnaud M., Ashdown M., Atrio-Barandela F., Aumont J., Baccigalupi C., Balbi A., Banday A. J., et al. 2013, A&A, 550, A134
- Ponman et al. (1999) Ponman T. J., Cannon D. B., Navarro J. F., 1999, Nature, 397, 135
- Roettiger et al. (1999) Roettiger K., Burns J. O., Stone J. M., 1999, ApJ, 518, 603
- Ryu et al. (2003) Ryu D., Kang H., Hallman E., Jones T. W., 2003, ApJ, 593, 599
- Sarazin (1986) Sarazin C. L., 1986, Reviews of Modern Physics, 58, 1
- Sarazin (2001) Sarazin C. L., 2001, in Neumann D. M., Tran J. T. V., eds, Clusters of Galaxies and the High Redshift Universe Observed in X-rays Merger shocks and nonthermal processes in clusters of galaxies *
- Sarazin (2002) Sarazin C. L., 2002, in Feretti L., Gioia I. M., Giovannini G., eds, Merging Processes in Galaxy Clusters Vol. 272 of Astrophysics and Space Science Library, The Physics of Cluster Mergers. pp 1–38
- Sarazin (2003) Sarazin C. L., 2003, Physics of Plasmas, 10, 1992
- Sarazin & White (1987) Sarazin C. L., White III R. E., 1987, ApJ, 320, 32
- Shaw et al. (2006) Shaw L. D., Weller J., Ostriker J. P., Bode P., 2006, ApJ, 646, 815
- Shimizu et al. (2003) Shimizu M., Kitayama T., Sasaki S., Suto Y., 2003, ApJ, 590, 197
- Skillman et al. (2008) Skillman S. W., O’Shea B. W., Hallman E. J., Burns J. O., Norman M. L., 2008, ApJ, 689, 1063
- Smith et al. (2008) Smith B., Sigurdsson S., Abel T., 2008, MNRAS, 385, 1443
- Springel et al. (2006) Springel V., Frenk C. S., White S. D. M., 2006, Nature, 440, 1137
- Turk et al. (2011) Turk M. J., Smith B. D., Oishi J. S., Skory S., Skillman S. W., Abel T., Norman M. L., 2011, ApJS, 192, 9
- van Weeren et al. (2011) van Weeren R. J., Brüggen M., Röttgering H. J. A., Hoeft M., 2011, MNRAS, 418, 230
- van Weeren et al. (2019) van Weeren R. J., de Gasperin F., Akamatsu H., Brüggen M., Feretti L., Kang H., Stroe A., Zandanel F., 2019, Space Sci Rev, 215, 16
- Vazza et al. (2016) Vazza F., Brüggen M., Wittor D., Gheller C., Eckert D., Stubbe M., 2016, MNRAS, 459, 70
- Vazza et al. (2009) Vazza F., Brunetti G., Gheller C., 2009, MNRAS, 395, 1333
- Vazza et al. (2011) Vazza F., Dolag K., Ryu D., Brunetti G., Gheller C., Kang H., Pfrommer C., 2011, MNRAS, 418, 960
- Vazza et al. (2017) Vazza F., Jones T. W., Brüggen M., Brunetti G., Gheller C., Porter D., Ryu D., 2017, MNRAS, 464, 210
- Vikhlinin et al. (1999) Vikhlinin A., Forman W., Jones C., 1999, ApJ, 525, 47
- Völk et al. (1996) Völk H. J., Aharonian F. A., Breitschwerdt D., 1996, SSRv, 75, 279
- Wen & Han (2013) Wen Z. L., Han J. L., 2013, MNRAS, 436, 275
- Wise & Abel (2007) Wise J. H., Abel T., 2007, ApJ, 665, 899
- Yu et al. (2015) Yu L., Nelson K., Nagai D., 2015, ApJ, 807, 12
Appendix A Re-acceleration of pre-existing CRs
As mentioned in Section 6.5, we have computed CR efficiency as a function of Mach number at different state of evolution of our reference cluster , similar to Figure 13. At low Mach numbers (i.e. ), preCRs contributions to CR flux is much higher than from only thermal particles. Though the overall nature of the CR flux curves at various stages of mergers is quantitatively similar, with preCRs, clusters produce much higher flux and peaks at lower Mach numbers. While, with preCRs production is most effective between Mach number and peak shifts between . Without preCRs the range is and the effective range is . For strong shocks (beyond ), there is no difference in total luminosity for thermal particles and with preCRs.
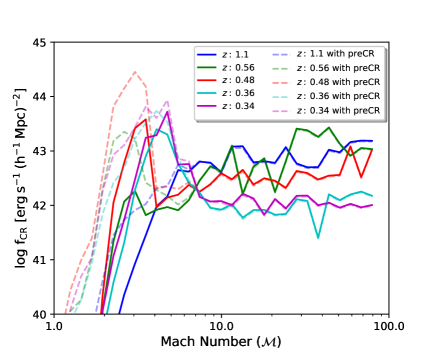
The radial pressure ratio (as defined in Section 3.2 last paragraph) is plotted for the simulated high mass (final mass ), merging clusters during their evolution after the first merger in Figure 16. It can be noticed in this plot that similar to Figure 3, the ratio goes to as high as 70% at maximum and beyond radius at almost near to . But, the average profile shows that CR injection pressure is below 1% in the core and goes to just above 1% after about 0.3 till 0.7. Though assumed initial CR to thermal pressure ratio was 0.05, we see much less radial fraction in the central part of the clusters. This is because of the fact that the CR injection happens only in the effective cells i.e. with Mach number (see section 3.2.1) and radial profile depends on volume filling as well as strength of shocks, both of which is much less in the core region. Beyond 0.7 (i.e. beyond ), as shock strength as well as volume increase, the ratio rises very fast and it reaches almost 15% at the outskirts (near to ) of the clusters. When compared the results of preCR with the non-preCR cases as shown in Figure 3, we notice that non-preCR is only effective beyond 0.7 times the virial radius when it crosses 1% and at virial radius (i.e. ) reaches 10%. In between 0.3 to 0.7 times the virial radius, preCRs calculation shows the pressure ratio () to be at least a factor of ten larger.
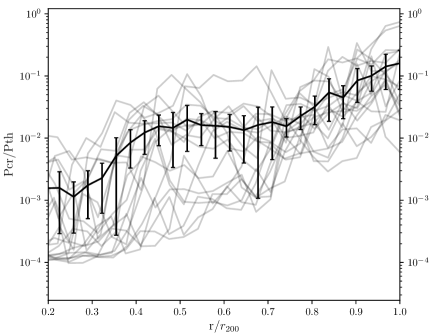
Figure 17 is a slice plot of a cluster showing cosmic ray flux when preCRs model is considered. Circles drawn in the image are at and at . A significantly higher flux covering more area can be noticed inside compared to non-preCRs model as seen in Figure 2, though the fluxes and emission area are almost the same beyond .
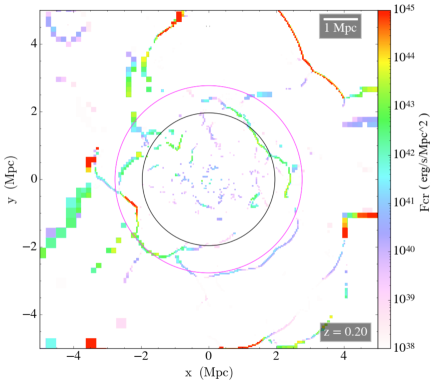
Appendix B Resolution study
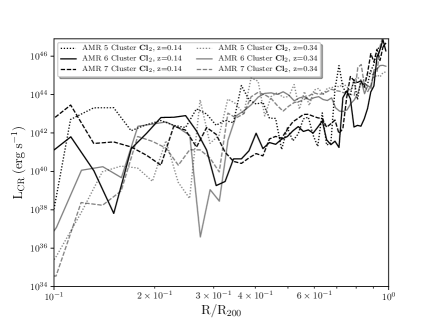
We show here some resolution studies to test the convergence of our results. The main runs that are used for this study are performed with the cosmological and simulation parameters described in Section 4 with 6 levels of total (uni-grid + AMR) refinement leading to a resolution of about 30 kpc. Keeping all other parameters same, we have further simulated some of our objects with different AMR levels to achieve different levels of resolutions. We have produced a lower resolution (‘LOWRES’ hereafter, resolution is about 60 kpc) and a higher resolution (‘HighRES’ hereafter, resolution is about 15 kpc) simulations. Further, to test the convergence of our results, we have performed other two sets of simulations with two different root grids besides the ‘RefRES’. The one with high resolution root grid i.e. 1283 is named as ‘RootHIRES’ and one with 323 root grid as ‘RootLOWRES’. In these test runs, the AMR setup is so chosen that the effective spatial resolution is same as that in reference runs. Finally, we have compared the physical parameters obtained from these simulations.
In Figure 18 radial profiles of CR luminosity due to acceleration of thermal particles has been plotted for the clusters (merging) and (non-merging) in different runs. It can be noticed that the results for the REFRES simulation are almost the same as for the HIGHRES run with minor deviation, though LOWRES data are little away. Small spatial variation that can be noticed among the different resolution plots occurs due to resolution sensitivity of transient phenomena like shocks. It can also be noticed that the merging phases have better convergent results. These results show that our simulated quantities have good convergence with the resolution taken as the reference set of simulations i.e. about 30 kpc with 6 levels of refinement. For further details of resolution study of our data sets, we refer the reader to Paul et al. (2017).
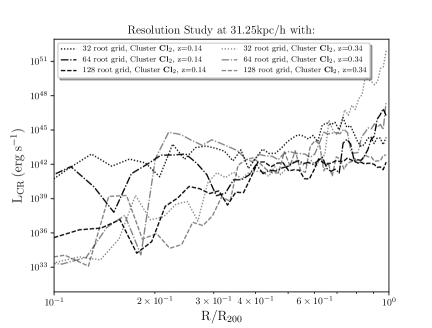
As we mentioned above, other two tests with different root grid resolution namely RootLOWRES and RootHiGHRES have been performed. We have then chosen appropriate merging and non-merging states (as indicated by virial radio ) and plotted the CR luminosity at those states. The tests with different root grid resolution show a reasonable convergence in CR luminosity (see Figure 19).