Nuclear-recoil energy scale in CDMS II silicon dark-matter detectors
Abstract
The Cryogenic Dark Matter Search (CDMS II) experiment aims to detect dark matter particles that elastically scatter from nuclei in semiconductor detectors. The resulting nuclear-recoil energy depositions are detected by ionization and phonon sensors. Neutrons produce a similar spectrum of low-energy nuclear recoils in such detectors, while most other backgrounds produce electron recoils. The absolute energy scale for nuclear recoils is necessary to interpret results correctly. The energy scale can be determined in CDMS II silicon detectors using neutrons incident from a broad-spectrum 252Cf source, taking advantage of a prominent resonance in the neutron elastic scattering cross section of silicon at a recoil (neutron) energy near 20 (182) keV. Results indicate that the phonon collection efficiency for nuclear recoils is % lower than for electron recoils of the same energy. Comparisons of the ionization signals for nuclear recoils to those measured previously by other groups at higher electric fields indicate that the ionization collection efficiency for CDMS II silicon detectors operated at 4 V/cm is consistent with 100% for nuclear recoils below 20 keV and gradually decreases for larger energies to 75% at 100 keV. The impact of these measurements on previously published CDMS II silicon results is small.
keywords:
dark matter , detector calibration , nuclear-recoil energy scale , ionization yield1 Introduction
Strong evidence indicates that 80% of the matter in the Universe is non-luminous and non-baryonic [1]. Weakly Interacting Massive Particles (WIMPs) are a leading class of theoretically motivated candidates for this dark matter [2]. These particles are expected to interact with normal matter through the weak nuclear force and to cluster gravitationally. If WIMPs do constitute our galaxy’s dark matter, they may be detectable through their elastic scattering off atomic nuclei in terrestrial detectors [3]. Under standard galactic halo assumptions [4] for a WIMP mass of /, the recoiling nuclei have energies of tens of and ranges of 10–100 nm in solid matter.
The Cryogenic Dark Matter Search (CDMS II) experiment measured nuclear recoils using a target mass composed of high-purity silicon and germanium semiconductor crystals operated at . Each crystal was instrumented to simultaneously measure the electron-hole pairs (ionization) and athermal phonons created by particle interactions within the crystal [5].
A WIMP, or a neutron, may scatter off a nucleus producing a nuclear recoil (NR), while most other interactions produce an electron recoil (ER). Accurate determination of an event’s energy requires a systematic calibration of the recoil energy scale. This energy calibration is generally straightforward for electron recoils due to the availability of a variety of spectral lines from radioactive sources over a wide range of energies.
The calibration for nuclear recoils is more difficult. CDMS II used a 252Cf neutron source to perform nuclear-recoil calibrations, and the spectrum of recoil energies in CDMS II detectors resulting from exposure to this source decreases quasi-exponentially with increasing energy and is nearly featureless. For CDMS II detectors, knowledge of the nuclear-recoil energy scale to within 10% is sufficient to accurately interpret WIMP-search results for WIMP masses greater than a few tens of GeV/. For lower masses, however, a more accurate determination of the energy scale is important for a robust comparison of results from different experiments, particularly in light of interpretations of data from several experiments as possible evidence for a low-mass (</) WIMP [6, 7, 8, 9].
This paper describes the procedure used to calibrate the nuclear recoil response of CDMS II silicon detectors. Experimental data for this study are drawn from the final runs of these detectors at the Soudan Underground Laboratory, from July 2007 to September 2008, as described in Ref. [9]. In situ measurements of elastic neutron scatters in these detectors from a 252Cf source are compared to Monte Carlo simulations of recoiling nuclei in the detectors. A re-calibrated energy scale is derived, optimizing agreement between measured and simulated recoil spectra. This is used to adjust the published upper limits on the WIMP-nucleon spin-independent cross section, as well as the 90% C.L. acceptance region from the analysis of the final exposure of the silicon detectors [9].
2 CDMS II Detectors
The final configuration of CDMS II contained 11 silicon and 19 germanium Z-sensitive Ionization- and Phonon-mediated (ZIP) detectors. These were arrayed into five “towers,” each containing six detectors following the designation TZ where (1–5) is the tower number and (1–6) indicates the position within the stack (from top to bottom). We focus here on the silicon detectors used in Ref. [9], which were thick, in diameter, with a mass of each. Of the eleven silicon detectors, two were excluded due to wiring failures leading to incomplete ionization collection, and a third was excluded due to unstable phonon channel response.
Each detector was photolithographically patterned with sensors on both flat faces: two concentric ionization electrodes on one face and four independent phonon sensors on the opposite face. The ionization electrodes were biased to with respect to the phonon electrodes, creating an electric field of 4 V/cm in the bulk of the detector along its axis [10]. The electrons and holes generated by a particle interaction were separated and drifted across the crystal by the electric field, generating image currents in the electrodes detected by a JFET-based charge amplifier [11]. By careful neutralization of ionized trapping sites within the crystal with regular exposure to infrared LEDs (“flashing”), the detectors were operated in a metastable state in which trapping of charge carriers in the crystal bulk was low. The ionization collection efficiency for electron recoils was therefore high, despite the relatively modest applied electric field.
In semiconductor devices such as the ZIPs, phonon () energy is generated by three interactions: the initial recoil generates primary phonons, the work done on the charge carriers by the electric field generates Neganov-Trofimov-Luke (or NTL) phonons [12, 13, 14], and charge carrier relaxation to the Fermi level at the electrodes generates recombination phonons. When a particle interacts in a ZIP, it deposits a recoil energy in the crystal and generates electron-hole pairs. For electron recoils, this recoil energy , where is the average energy required to create one electron-hole pair.222For silicon, eV above [15] and is not expected to deviate significantly at lower temperatures. A portion of this energy is stored in the potential energy of the drifting charge carriers and is restored to the phonon system when they relax to the Fermi level at the electrodes, producing recombination phonons.
The work done by the electric field on the drifting charge pairs results in the Cherenkov-like radiation of an additional population of phonons at near-ballistic energies. These are the so-called NTL phonons which add a contribution to the total phonon signal proportional to the bias voltage across the detector: . The total phonon energy is therefore . It is convenient to express the ionization signal as an electron-equivalent energy and the total phonon energy as
| (1) |
where is the ionization yield. With these definitions, an ideal electron recoil has ionization yield . An event’s recoil energy is determined by rearranging Eqn. 1, where is estimated from the phonon channels and from the charge channels.
The remainder of the recoil energy is deposited directly into the phonon system as primary phonons. These high-frequency phonons undergo isotopic scattering and cannot travel far from their production sites before down-converting via anharmonic decay [16] into lower-frequency phonons with larger mean free paths, comparable to the thickness of the detector [17]. The lower-frequency ballistic phonons then interact with either the phonon sensors or un-instrumented material at the detector surfaces.
Details of the phonon collection mechanism in CDMS detectors are discussed in Ref. [18]. Past analyses assumed that all three phonon contributions are detected with equal efficiency. This is a plausible assumption because all three mechanisms generally inject energy into the phonon system above the ballistic propagation threshold. All three types down-convert until they become just barely ballistic, so their frequency distributions at the sensors are nearly the same. However, the relative fraction of phonons absorbed by the sensors (compared to other materials) may depend on details of the primary interaction, and even on the relative fractions of primary and NTL phonons. Consequently, although the differences are expected to be small, the phonon collection efficiency in CDMS II detectors for nuclear and electron recoils of a given energy need not be identical. This paper describes measurements of the small difference between these two efficiencies.
2.1 Electron-Recoil Calibration
The response of the ZIP detectors to phonons and ionization from electron recoils is calibrated in situ using a gamma-ray source. Event-selection cuts are applied to electron-recoil calibration data to remove events with pathologies, including electronic glitch events, anomalously shaped charge pulses, and periods of high baseline noise. From this sample, only those events occurring within a detector’s fiducial volume (or “bulk”) are selected, thereby avoiding surface events, which can suffer from incomplete ionization collection. We reject events outside the detector’s bulk by requiring the signal in the outer ionization electrode be consistent with noise, while the inner ionization signal must exceed a detector- and run-dependent threshold 4.5 above the noise mean (as described in Ref. [9]).
2.1.1 Ionization calibration of electron recoils
A 133Ba gamma source with spectral lines at 275, 303, 356, and was used to calibrate the ionization energy scale in the detectors. A significant number of these gamma rays are fully contained within a germanium detector, producing clear peaks in histograms of the ionization pulse amplitude. The reconstructed ionization pulse amplitude from the germanium detectors is thus calibrated to an electron-equivalent recoil energy (keV) by multiplying by a constant factor chosen such that the observed peaks lie at the appropriate Ba-line energies.
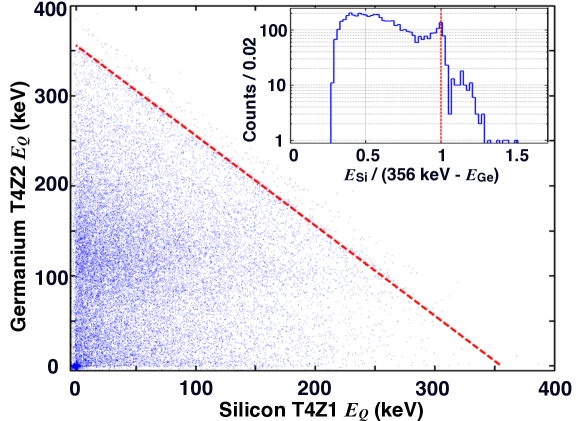
Because of their relatively low stopping power, silicon detectors of this size rarely contain the full energy of the 133Ba gamma rays, so the peaks are not visible. Silicon also has no intrinsic spectral lines at energies below . The ionization energy scales in the silicon detectors are therefore calibrated using shared events—a 133Ba gamma ray that deposits its energy within adjacent detectors. The 133Ba spectral lines are clearly visible in the sum of ionization energy in a silicon detector and its germanium neighbor, as shown in Fig. 1. Ionization energy scales are calibrated first for germanium detectors, and the calibration for silicon detectors is then set so that the shared event lines lie at the appropriate energies.
After confirming linearity in the germanium detectors across a wide range of spectral lines, linearity in the silicon detectors is checked implicitly by tracking the total energy of shared events as a function of the reconstructed ionization energy in the silicon detector. The position of this peak varies by less than 5%, demonstrating linearity up to .
2.1.2 Phonon Calibration
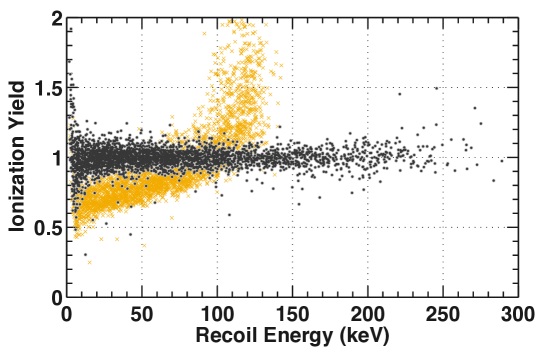
The energy scale for the phonon channels is calibrated using a sample of bulk electron recoils, which should have unity ionization yield; the reconstructed amplitude of the total phonon pulse is scaled so that the inferred recoil energy matches the ionization energy and thus gives (on average). The measured phonon signals have a significant position dependence that is removed in this process. Based on position-reconstruction parameters derived from the relative amplitudes and timings of the four phonon sensor signals, the broad continuum of 133Ba electron recoils is used to develop an empirical correction table as a function of position, amplitude, and phonon energy (as was done for the germanium detectors in Ref. [10]). Figure 2 shows how application of this position-correction table removes the energy dependence (and improves the resolution) of the ionization yield for electron recoils.
3 Constraining the Energy Scale for Nuclear Recoils
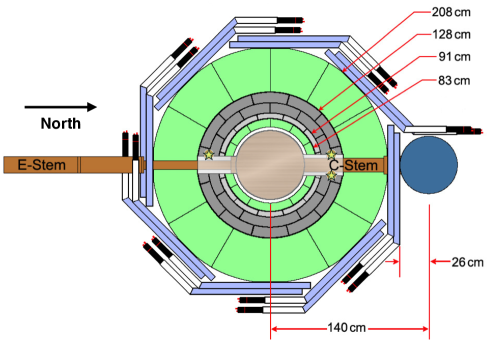
Nuclear recoils were provided by a 252Cf neutron source. Neutron capture causes temporary activation of the germanium detectors, so this calibration was performed less frequently than the 133Ba gamma-ray calibration. The period considered here contains six sequences of neutron calibration. During each of these sequences, several data sets were acquired with the source inserted into one of three plastic tubes running along straight paths through the polyethylene and lead shielding to within 10 cm of the copper cryostat cans that housed the detectors, as shown in Fig. 3. Each tube was labeled by its nearest inter-cardinal direction: southwest, northwest, or northeast. Because each source position illuminated the detectors with a different relative neutron flux, calibration data were grouped by position and the resulting spectra were normalized separately. Recoil energies for these events were calculated by subtracting the NTL phonon contribution, inferred from the ionization signal, from the total phonon energy. However, unlike the 133Ba data, neutron calibration data have no clear spectral lines. The resulting nuclear-recoil energy scale cannot be directly verified for correctness or linearity.
Instead, a Geant4 Monte Carlo simulation was performed with the goal of finding the linear energy scaling factor —interpreted as the phonon collection efficiency of nuclear recoils relative to that of electron recoils—that minimizes a test statistic comparing the simulated spectra of nuclear recoil energies to the measured spectra. The simulation geometry corresponded to the full experimental apparatus in the five-tower configuration used for CDMS II, including the detectors, support structure, and all shielding. A 252Cf source was simulated separately at the three locations depicted in Fig. 3. Neutrons from sources at these positions were moderated by part of the inner shielding before reaching the detectors.
A 252Cf input spectrum was used to simulate incident neutron energies, and this spectrum was degraded in energy by propagation through the inner shielding. Features in the input spectrum are washed out to the extent that an independent simulation with a Maxwellian input spectrum produced an identical recoil energy spectrum in the detectors, to within statistical uncertainties. It is therefore inferred that the spectrum of recoil energies for this configuration is largely independent of details of the input neutron energy spectrum and is thus sufficiently accurate. See A.2 for additional details. The angular dependence of the differential neutron-scattering cross section for silicon in Geant4 is known to be incorrect [19], but using the correct dipole anisotropy moment produces an identical nuclear recoil spectrum for neutrons scattering in silicon.
These simulated neutron calibration data sets were used to produce the expected energy spectra for nuclear recoil events for each detector and source position. The spectra from measured calibration data were then compared to these expected spectra. In the simulation, an event’s recoil energy in each detector was determined by directly summing the energy depositions to recoiling nuclei.
3.1 Data Selection Cuts and Efficiency Corrections
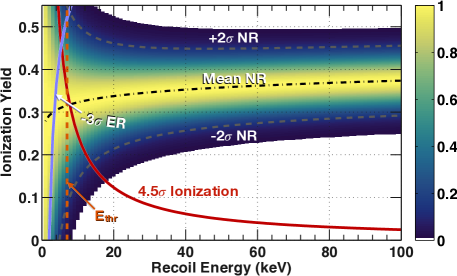
A sample of good recoil events was selected from the measured calibration data, as described in Sec. 2.1, with the addition of requiring that events fall within of the mean measured nuclear-recoil ionization yield (as shown in Fig. 4). To correspond to the energy range analyzed in Ref. [9], the reconstructed recoil energy of each event was restricted to lie below 100 keV and above a detector- and run-dependent threshold ranging from 7 to 15 keV, determined primarily by the ionization threshold of the detector for the run (also shown in Fig. 4).
There are four potentially important energy-dependent efficiencies in this analysis, the forms of which are shown for one detector in Fig. 5. The first is the efficiency of the hardware phonon trigger which is modeled as an error function, with a width determined by the resolution of the pulse measurement. The second is the efficiency of the ionization-threshold cut, which is the primary determinant of the overall analysis threshold. The cut’s main purpose is to remove sidewall surface events, which can result in no detected ionization [20]. Its efficiency is calculated analytically for a given recoil energy by finding the integrated fraction of the Gaussian probability distribution (as shown in Fig. 4) that remains within the bounds of the measured 2 nuclear-recoil band after removing the portion of the band that falls below the ionization threshold. The efficiency of this cut is estimated in combination with that of the cut requiring events to have ionization yield at least 3 below the mean of the electron-recoil band. The latter cut ensures that the sample of nuclear recoils is not significantly contaminated by electron recoils.
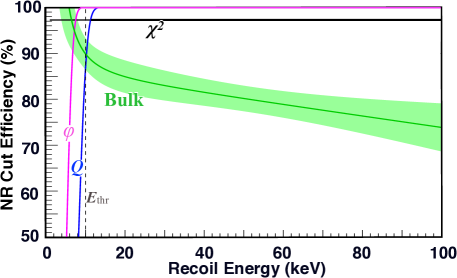
The remaining efficiencies are those of the goodness-of-fit and fiducial-volume cuts. The former rejects poorly shaped ionization pulses and has negligible energy dependence [21], and the latter excludes events occurring in the outer edge of the detector where incomplete ionization collection can cause electron recoils to mimic nuclear recoils [20]. The fiducial-volume cut efficiency is calculated for events in the nuclear-recoil band, including a correction based on an estimate of the number of electron recoils that leak into the nuclear-recoil band [22]. This efficiency has the strongest energy dependence of all the cuts.
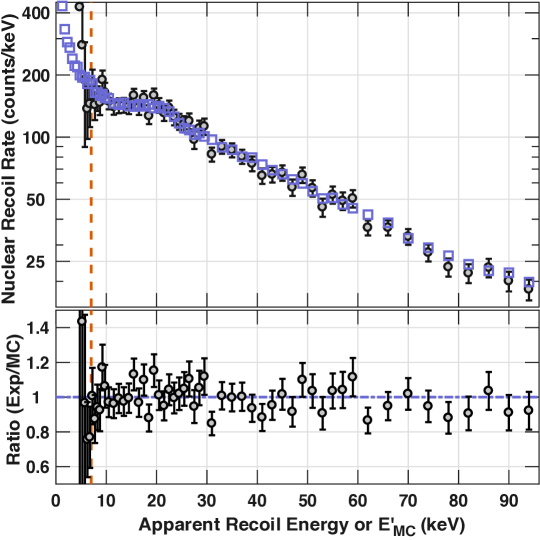
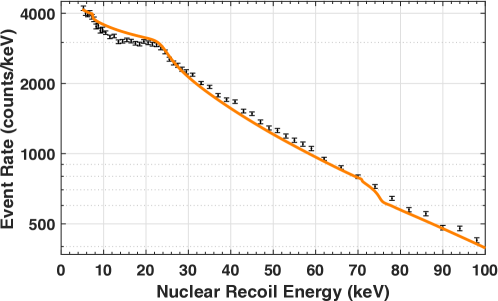
After applying these event selection criteria and efficiency corrections, and accounting for the detector masses, the resulting spectra give the raw nuclear recoil rate in counts , and as such are directly comparable to the spectra generated by the Monte Carlo simulation. Figure 6 shows an example.
3.2 Determining the Relative Phonon Collection Efficiency
The nuclear-recoil energy spectrum in CDMS II silicon detectors is characterized by a single smooth exponential in the energy range of interest with a prominent feature at 20 keV caused by a wide nuclear resonance with incident neutrons of keV, as discussed in A. This feature (shown in Fig. 6) breaks the degeneracy between the rate normalization and spectral hardness, making it possible to infer the phonon collection efficiency of nuclear recoils relative to that of electron recoils by comparing measured and simulated spectra without knowing the rate of nuclear recoils.
A test value for this energy rescaling factor is applied to the recoil energy of each event in the simulated data set prior to binning (as in, e.g., Fig. 6). A statistic is then constructed from each pair of binned spectra in a way that incorporates the Poisson errors for each energy bin of both the measured and simulated rates:
| (2) |
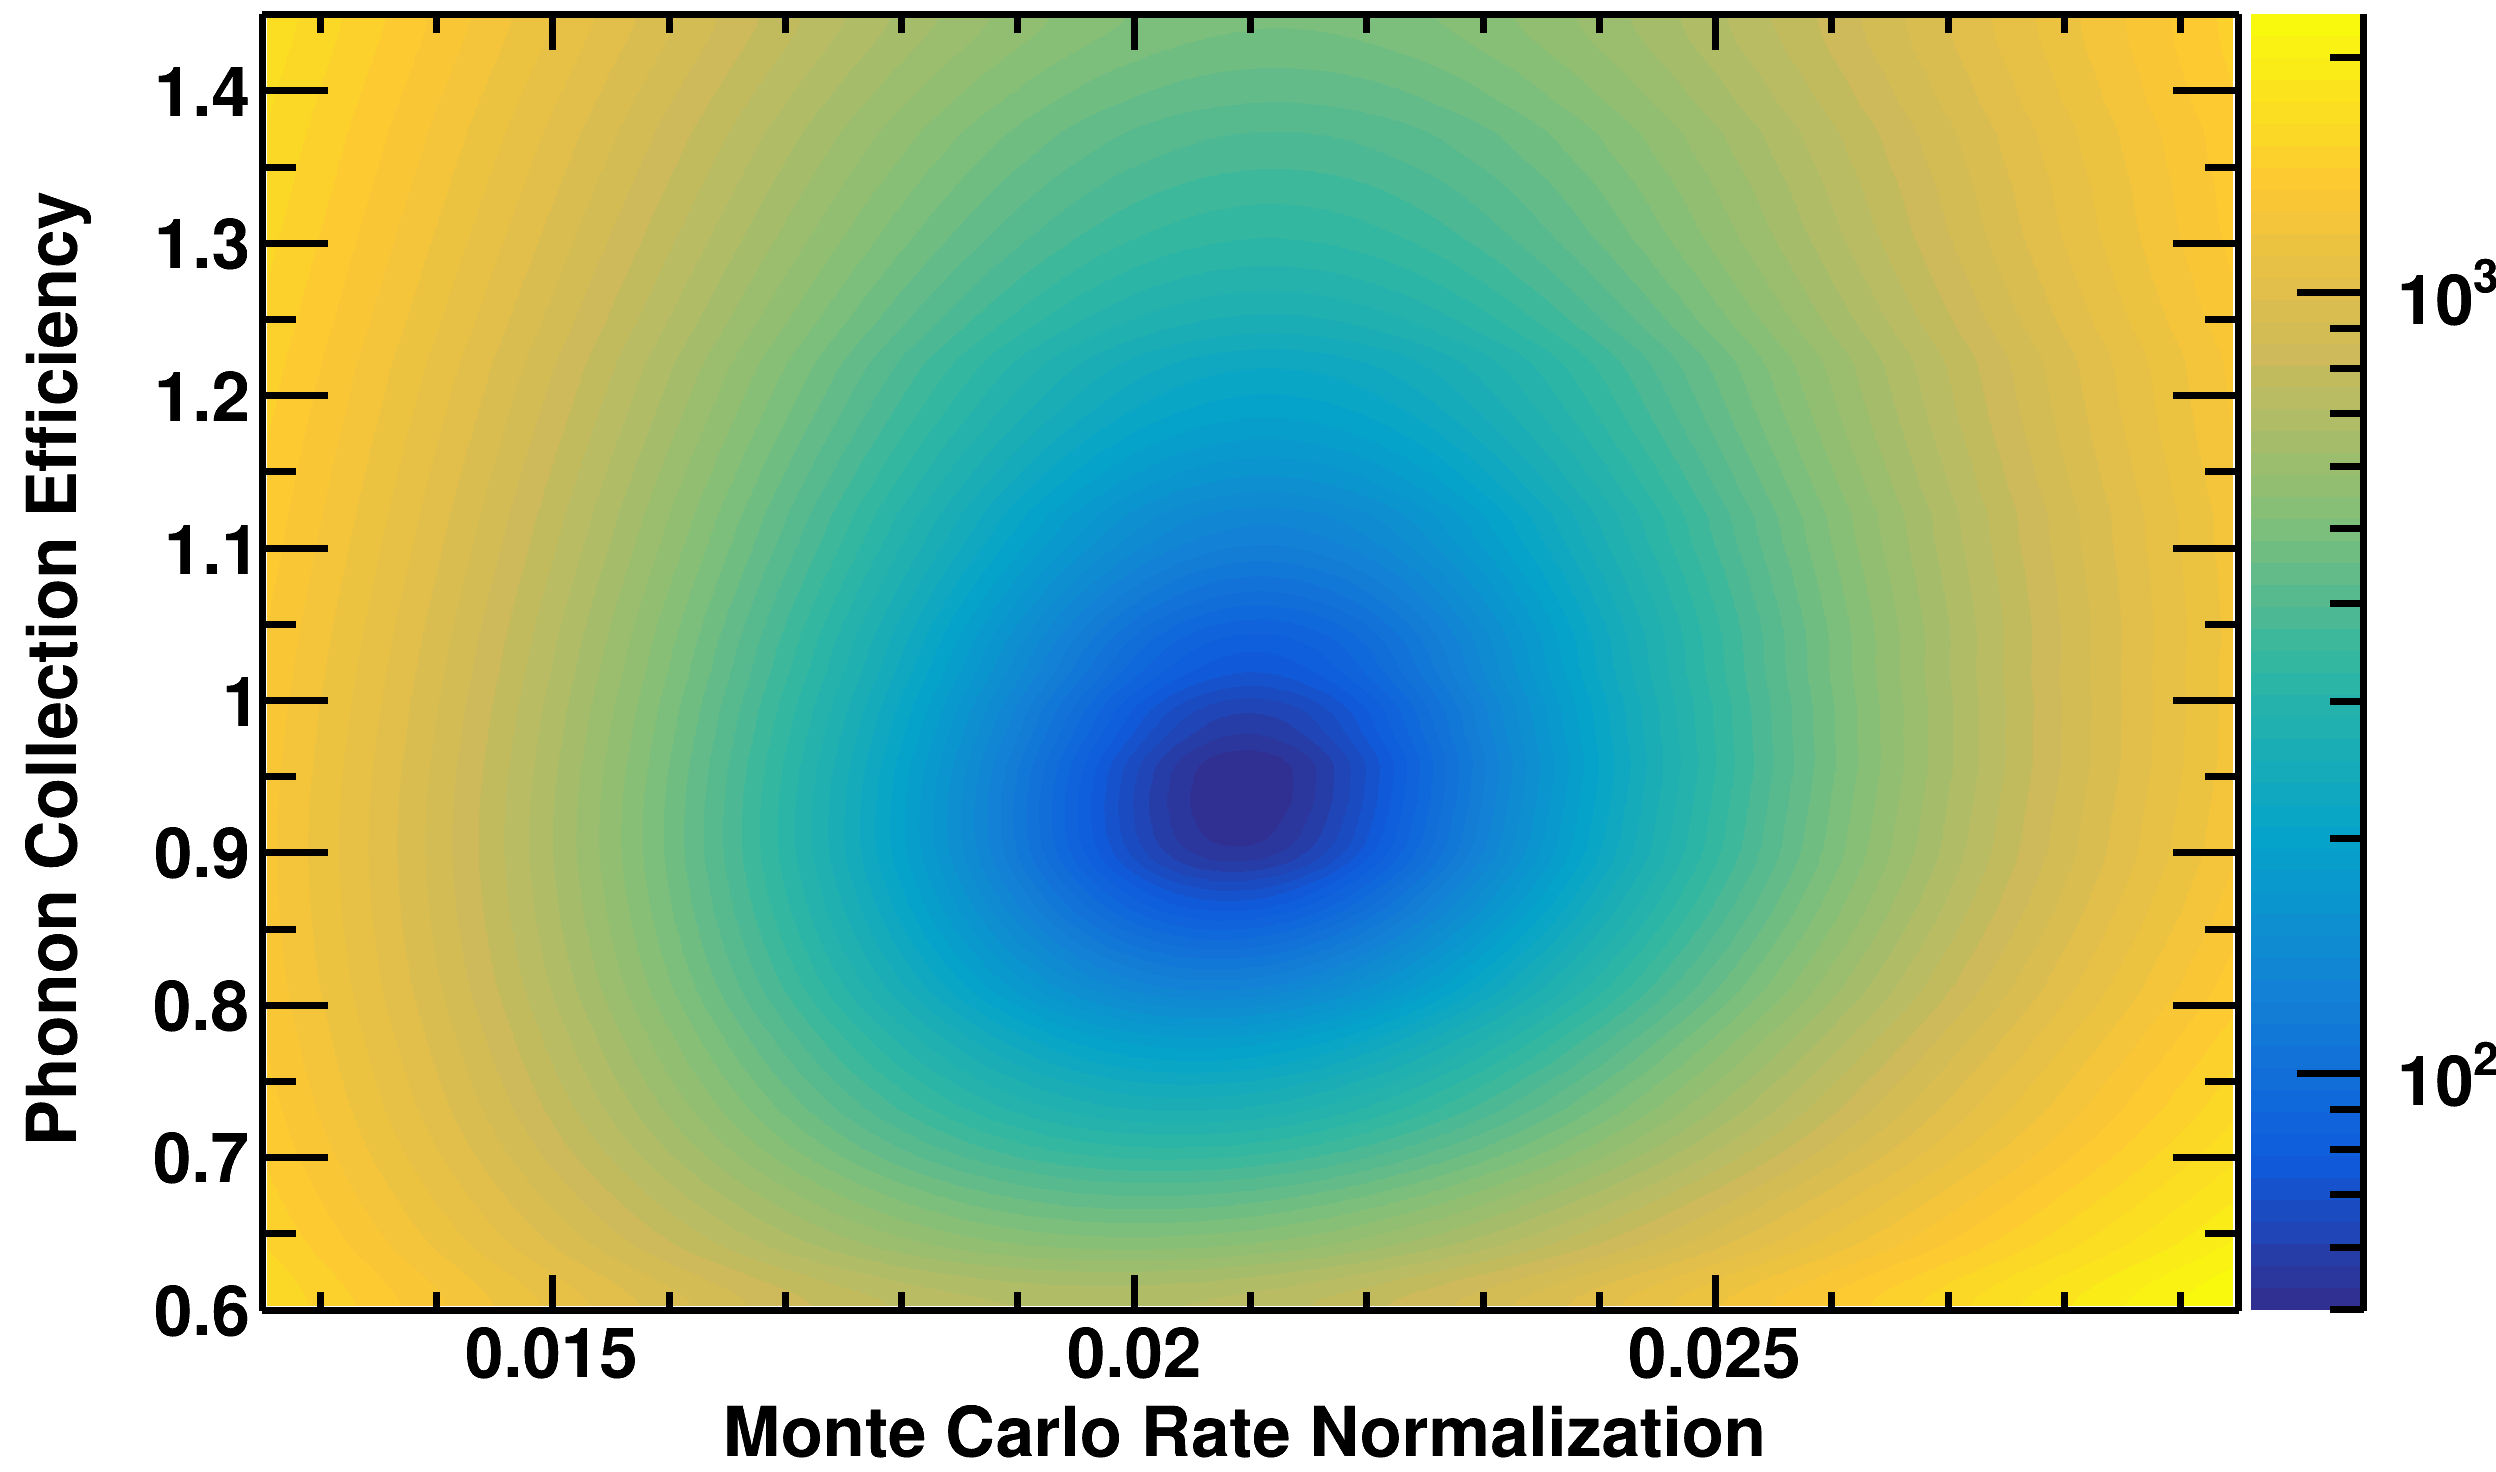
with in terms of the measured () and simulated () Poisson uncertainties. The energy rescaling is applied to the simulated, rather than the measured, data to avoid problems associated with event energies shifted above and below threshold and to simplify the accounting of energy-dependent efficiencies. The simulated nuclear-recoil energies are rescaled to (as in Fig. 6). For each combination of detector and source position, a two-dimensional minimization was performed, scanning over both and the normalization. An overall best-fit for each detector was also determined by performing an additional scan, after coadding data from all three source positions for both the measured and simulated spectra. This overall rescaling is used to scale the apparent nuclear recoil energies by 1/. Figure 7 shows the results of this minimization for a representative detector.
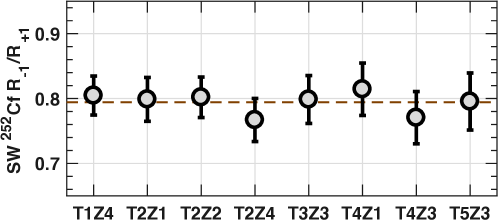
The overall neutron rate is not used as a constraint because it is not known sufficiently well, primarily due to uncertainty in the placement of the 252Cf source between each calibration. As shown in Fig. 8, variation in source placement of cm changes the rate in all detectors by approximately 10%. The placement of the source was done with no way to verify its location with more precision than a centimeter. The absolute rates measured by the detectors varied by as much as a factor of 3, even between good 252Cf calibrations (those for which the detectors were operating properly); however, the relative rates for good calibrations were consistent.
Because most detectors did not record good data throughout the entire exposure, care was taken in forming the overall normalization to account properly for periods of lost live time in detectors. This was done by compensating for lost live time during bad series by weighting the lost live time by the relative neutron rate inferred from periods of good neutron exposure from all detectors, using an iterative fitting procedure.
The best-fit relative normalizations from the minimization procedure agree at the 90% confidence level for data at two of the source positions, with slightly worse agreement at the third position. Moreover, as shown in Fig. 7, the best-fit energy rescaling factor is independent of the normalization, due to the feature in the spectrum; so the accuracy of the normalization is not important to the results. The good agreement between the data and rescaled Monte Carlo across the entire energy region of interest indicates that the overall best-fit phonon collection efficiency is close to 100%.
4 Results
The final result of the minimization is a best-fit phonon collection efficiency for nuclear recoils relative to electron recoils for each detector and source position, shown in Fig. 9. A weighted average across all silicon detectors, using the best-fit results from the individual-detector fits (coadded over source position), finds an overall phonon collection efficiency for nuclear recoils
relative to electron recoils of the same deposited energy. Table 1 lists the best-fit /d.o.f. and -value for each detector. The discrepancies in the best-fit between detectors cannot be explained by energy dependence in the relative collection efficiency , because the measured and simulated spectral data generally match well both at low energies near the prominent 20 keV feature, and at energies up to 100 keV, as shown in the bottom of Fig. 6.

| detector | T1Z4 | T2Z1 | T2Z2 | T2Z4 | T3Z3 | T4Z1 | T4Z3 | T5Z3 |
|---|---|---|---|---|---|---|---|---|
| /d.o.f. | 40.1/42 | 50.0/48 | 72.7/48 | 75.0/48 | 57.5/48 | 53.3/42 | 33.6/37 | 81.6/48 |
| -value | .554 | .394 | .012 | .008 | .164 | .113 | .629 | .002 |
4.1 Implications for Ionization Yield
The stopping power for charged particles in a target material can be divided into electronic and nuclear components, each with different energy dependence as reported in Ref. [23]. Slow-moving nuclear recoils are not stopped efficiently by electrons and so deposit most of their energy through interactions with the target’s nuclei. Because ionization is a product of electronic excitation, nuclear recoils have a reduced yield compared to electron recoils of the same energy. The ionization yield of a nuclear recoil varies with the partitioning of energy between electronic and nuclear modes. The energy dependence of the reduced yield as a function of atomic number and atomic mass was computed by Lindhard in Ref. [23]. The resulting expressions were simplified and reported in Ref. [4]. The expected ionization yield for a nuclear recoil under this Lindhard theory is given by
| (3) |
where for silicon, and the transformed energy , with the recoil energy given in keV. The function is well-fit by a polynomial in with empirically chosen coefficients, described by .
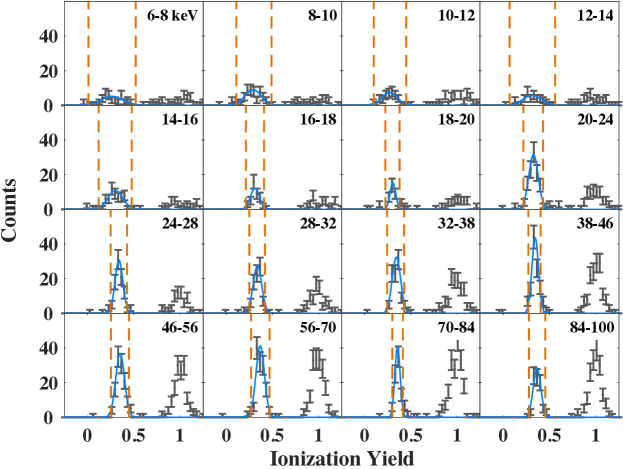
The same neutron calibration data discussed in Sec. 3 were used to infer the ionization yield of nuclear recoils in CDMS II silicon detectors. Figure 10 shows fits to the measured ionization yield in bins of recoil energy, corrected by the best-fit phonon collection efficiency ( = 0.952) for an example detector. The resulting inferred ionization yield as a function of recoil energy must be corrected for the small effect of neutron multiple scattering. While WIMPs have a negligible probability of scattering more than once in the apparatus, approximately 30% of neutrons from 2–100 keV scatter off nuclei at multiple locations in a single detector. The ionization yield of nuclear recoils increases with increasing recoil energy. Hence a multiple-site interaction, for which the ionization is divided among several lower-energy recoils, will produce less ionization (overall) than a single recoil of the same total recoil energy. These multiple-site scatters are not distinguishable from single-site interactions of the same total energy in the CDMS setup. The effect of multiple scattering was determined from Geant4 simulations of the 252Cf neutron calibrations. The shifts in yield are well-understood and are less than 3% for nuclear recoils between 10 and 100 keV.
In silicon, the yield has been measured previously by elastic scattering at 77 K [24, 25, 26], 130 K [27], 220 K [28], and 288 K [29], and by utilizing resonances in the scattering cross section to constrain the recoil energy [26]. The results of these previous measurements are summarized in Fig. 11.
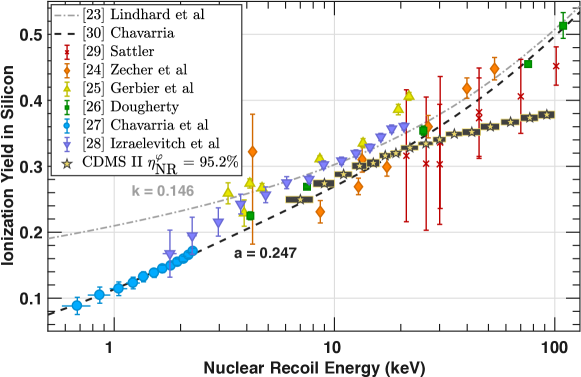
The light dot-dashed line shows the standard Lindhard theoretical prediction (from Eq. 3) for ionization yield in silicon from Ref. [23]. Standard Lindhard theory significantly over-estimates the ionization production for low-energy nuclear recoils reported in Ref. [27]. An improved functional form (black dashed) using a parameter [30] matches the Lindhard expectation for silicon at high energy and fits the data reported in Ref. [27] at low energy:
| (4) |
This parameterization was used to report the WIMP-nucleon sensitivity curves in Ref. [28]. CDMS II silicon data are consistent with this functional form for energies below 20 keV. At high energies, the measured ionization yield is smaller than previous measurements [24, 26, 29], with the size of the discrepancy increasing with energy.
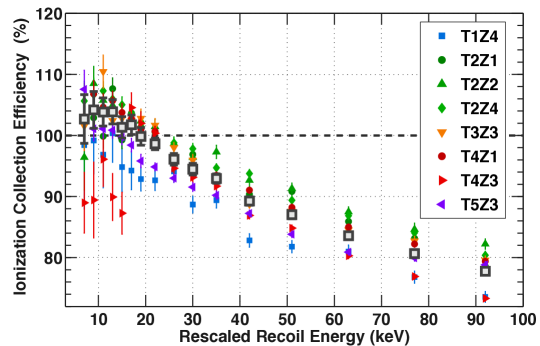
Figure 11 shows the ionization yield determined from the Gaussian fits to the nuclear-recoil distribution for each detector (as in Fig. 10, e.g.). Comparisons of the CDMS II measurements of the yield to the previous measurements shown in Fig. 11 constrain the nuclear-recoil ionization collection efficiency in CDMS II. Figure 12 shows the nuclear-recoil ionization collection efficiency for all CDMS II silicon detectors and their weighted mean, assuming the same parameterization [30] shown in Fig. 11. The individual detector fits are not consistent with each other within uncertainties. These detector-to-detector variations may correspond to true physical differences between the detectors. The average ionization collection efficiency for nuclear recoils in CDMS II silicon ZIPs is consistent with roughly 100% at energies below 20 keV. The fit is improved if the ionization-yield parameterization from Eq. 4 underestimates the true ionization yield by 5% from 10–20 keV.
There is a reasonable mechanism for producing the ionization collection efficiency observed in CDMS II silicon detectors. The detectors were operated with fields of a few V/cm, much lower than those described in Refs. [24, 25, 26, 27, 28, 29]. The electric fields reported in Refs. [24] and [26] are 60–500 larger than the 4 V/cm electric fields applied to the CDMS II ZIP detectors. Nuclear recoils produce a much denser initial composite of charge pairs than similar-energy electron recoils. It is plausible that the ionization produced by a low-energy nuclear recoil may be fully extracted at low fields, but the denser ionization produced by higher-energy nuclear recoils cannot be extracted completely at these low fields. The resulting ionization collection efficiency may decrease with increasing energy because the charges are increasingly self-shielded, thus allowing a larger fraction of charge pairs to recombine before they can be drifted across the detector. It is also possible that the lower temperature of the CDMS II detectors relative to those described in Refs. [24, 25, 26, 27, 28, 29] plays a role.
4.2 Recalculated WIMP Limits
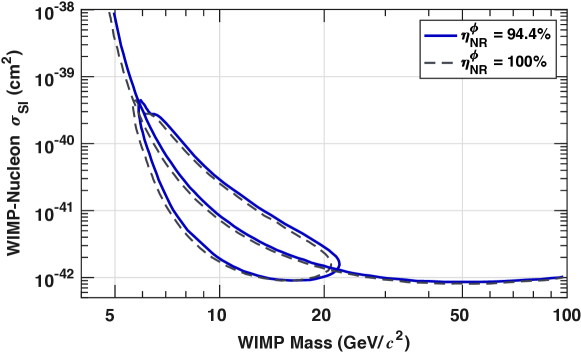
The revised nuclear-recoil energy scale has a small effect on published CDMS II WIMP sensitivity limits and contours. Figure 13 shows the shifts in both the spin-independent WIMP-nucleon cross-section exclusion curve and the best-fit WIMP mass region and cross section, both at 90% C.L., from Ref. [9]. The shifts are generally small. For WIMP masses above 10 GeV/, the shift is less than 20%, and for WIMP masses 5 GeV/ the upper limit increases by about a factor of two. The best-fit WIMP mass resulting from the revised nuclear-recoil energy scale shifts by 5%.
4.3 Conclusions
The measured spectral shape of neutron calibration data in CDMS II silicon detectors provides strong evidence that the phonon collection efficiency is almost, but not quite, the same for nuclear recoils as electron recoils. Results are consistent with phonon collection efficiency for all energies and detectors, with good agreement between measured and simulated spectra down to detector energy thresholds 10 keV. Any energy dependence in in the 10–100 keV energy range considered here cannot be large. Although similar analysis is possible in germanium, it is prone to systematic uncertainty because the spectrum for this range of nuclear-recoil energies is featureless and decays exponentially. As a result, there is an inherent degeneracy between the neutron rate and the energy scale that is difficult to break in the CDMS setup. Imperfect knowledge of the source strength and position make a simple comparison of the measured and simulated neutron rates infeasible. The low-energy nuclear resonance in 28Si provides a spectral feature that breaks the degeneracy, making the silicon analysis presented here possible.
The CDMS II silicon ionization measurements described in this paper support recent findings of Refs. [27, 28] that the Lindhard prediction for nuclear-recoil ionization yield at low energies ( 20 keV) is an over-estimate, and that the energy-dependent parameterization of Eq. 4 is a more accurate description for nuclear recoils in silicon. The CDMS data suggest that this parameterization may slightly underestimate the true ionization yield of nuclear recoils between 10 and 20 keV. Reduced ionization collection efficiency in CDMS II silicon detectors at recoil energies 20 keV may be due to the field-dependent self-shielding of charge carriers that prevents them from being drifted by the electric field. Planned calibration of SuperCDMS SNOLAB [31] silicon detectors will provide improved measurements of the phonon and ionization response, especially at lower energies.
The CDMS Collaboration gratefully acknowledges the contributions of numerous engineers and technicians; we would like to especially thank Dennis Seitz, Jim Beaty, Bruce Hines, Larry Novak, Richard Schmitt, and Astrid Tomada. In addition, we gratefully acknowledge assistance from the staff of the Soudan Underground Laboratory and the Minnesota Department of Natural Resources. This work is supported in part by the National Science Foundation, by the U.S. Department of Energy, by the Swiss National Foundation, by NSERC Canada, and by MULTIDARK. This document was prepared by the SuperCDMS collaboration using the resources of the Fermi National Accelerator Laboratory (Fermilab), a U.S. Department of Energy, Office of Science, HEP User Facility. Fermilab is managed by Fermi Research Alliance, LLC (FRA), acting under Contract No. DE-AC02-07CH11359. Pacific Northwest National Laboratory is operated by Battelle Memorial Institute under Contract No. DE-AC05-76RL01830 for the U.S. Department of Energy. SLAC is operated under Contract No. DE-AC02-76SF00515 with the U.S. Department of Energy.
Appendix A Numerical Derivation of 252Cf Spectral Shapes
We review here a numerical calculation of the spectral shapes expected from 252Cf neutrons scattering from CDMS II silicon ZIP detectors, adapted from Appendix E in [32]. Observation of a prominent bump near 20 keV in the silicon detectors’ 252Cf spectra in data and simulation prompted the ensuing calculations, both to verify the expectation and to check for other features. Obviously, any distinguishing features in the 252Cf spectra are useful for gauging the nuclear-recoil energy scale. In the following, we derive the precise recoil-energy shapes by using the same endf [33] neutron cross sections and angular probabilities that serve as inputs to the Geant4 simulations.
A.1 Differential scattering rate
The derivation of the differential scattering rate for neutrons scattering from nuclear targets is analogous to the standard framework for WIMP-nucleon scattering (see, e.g., [4]). However, the energy dependence is slightly different because the spectrum of incident energies is not defined according to a Maxwellian velocity distribution, but instead is determined (in this case) by transporting the distribution of neutron energies emitted by 252Cf through the CDMS II shielding layers. Treatment of the elastic-scattering cross section differs as well. In this section we outline a loose derivation aimed toward understanding the energy dependence. No attempt is made to derive the absolute normalization, with several (constant) multiplicative factors neglected or dropped along the way.
The differential scattering rate for neutrons to scatter from a nuclear target is given by
| (5) |
where is proportional to the transferred energy, is the relative neutron-nucleus velocity, is the velocity-dependent neutron number density, and is the energy- and velocity-dependent neutron-nucleus cross section. Note that Eq. 5 is true for a particular value of . To get the correct recoil-energy shape, the right-hand side of Eq. 5 must be integrated over all possible velocities:
| (6) |
where the right-hand side is obtained via a change of variables from to the incident neutron energy . At this point it is useful to recall the elastic-scattering relationship between the kinetic energy of the recoiling nucleus , the energy of the incident neutron, and the center-of-mass scattering angle :
| (7) |
where is a good approximation for the atomic mass of a silicon target.333We consider here only the stable isotopes present in laboratory-grown (non-enriched) silicon crystals with naturally occurring abundances 5%. For nonrelativistic scattering, , and the differential cross section can be rewritten as
| (8) |
because and . Noting that , and substituting the right-hand side of Eq. 8 into the right-hand side of Eq. 6, the differential scattering rate can be written as
| (9) |
where the integrand is now entirely in terms of and the center-of-mass scattering angle. For a given value of , the integral is restricted to combinations of and that satisfy Eq. 7. Specifically, because varies from -1 to 1, the integral runs from to .
Equation 9 and the limits of integration noted above provide the framework necessary to calculate the shape (or energy dependence) of the differential event rate for a spectrum of neutrons to scatter from a nuclear target. All that remains is to specify the differential number density and the differential cross section . The former is simply the spectrum of incident neutron energies, while the latter decomposes into two parts:
| (10) |
where is the elastic cross section as a function of incident neutron energy (analogous to the WIMP-nucleus form factor), and is the angular probability for a particular value of as a function of . Three inputs are thus required to perform the desired numerical calculation of .
A.2 Differential number density
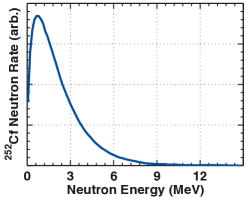
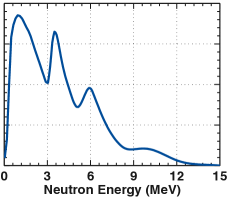
There appears to be some uncertainty regarding the high-energy tail of the spectrum of neutron energies emitted by 252Cf. The distribution used for the CDMS shallow-site Geant3 [34] simulations described in [35] (and used in [5]) is approximately given by
| (11) |
and is shown in the left panel of Fig. 14. A complicated multi-peaked spectrum was used for the Geant4 simulations described in this paper and is shown in Fig. 14. Fortunately, the presence (or lack) of the high-energy structure exhibited by the deep-site spectrum does not appear to significantly affect the ZIP detector’s nuclear-recoil response for recoil energies 100 keV. We explicitly confirmed with our Geant4 simulation that starting from either 252Cf spectrum yields differential event rates that are indistinguishable for recoil energies from a few to 100 keV.
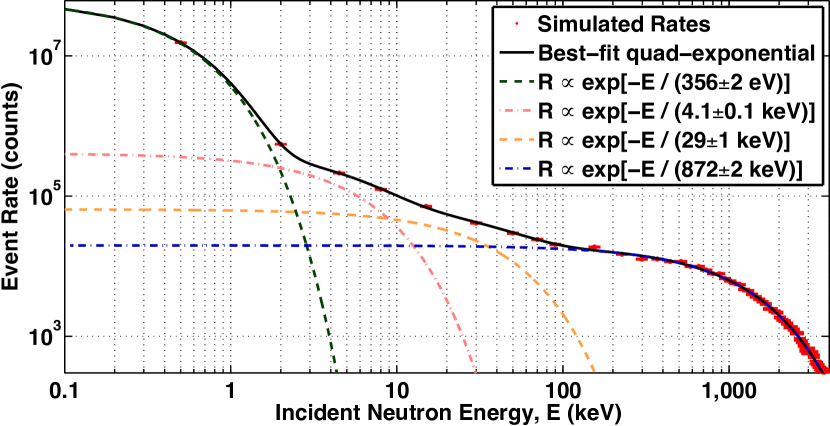
The spectrum of neutron energies directly emitted by the source is not quite what is needed for the numerical calculation. Neutron calibrations were typically conducted with the 252Cf source located such that the neutrons had to penetrate several layers of shielding in order to scatter from a ZIP detector. Consequently, the emitted energy spectrum must be transported through the CDMS II shield to obtain the differential number density required by Eq. 9. We use the results of our Geant4 simulation rather than attempt a quasi-analytic estimate of this part of the calculation. Simulated transport of the multi-peaked spectrum in Fig. 14 through the CDMS II shield yields the distribution shown in Fig. 15. For convenience, this ZIP-incident spectrum is modeled by a multi-exponential fit. The exponential with the largest decay constant contributes most of the events observed in the ZIP detectors and is given approximately by
| (12) |
The best-fit, eight-parameter (4 decay plus 4 normalization constants) multi-exponential indicated in Fig. 15 provides the first input needed to evaluate numerically.
A.3 Elastic-scattering cross section
The differential cross section for neutrons to elastically scatter from nuclei is composed of two parts. The first part, denoted , describes the dependence of the cross section on the incident neutron energy. Geant4 uses nuclear cross-section data from the endf database to model . For technical reasons, it was simpler to extract this information from the jendl database [36]. The jendl and endf databases for 28Si contain some very slight differences of for incident neutron energies greater than a few MeV. Additionally, the jendl cross sections cut off at 20 MeV, while the endf cross sections extend to 150 MeV. None of these differences are expected to significantly affect the recoil-energy spectra for keV; most events in the recoil-energy range of interest correspond to incident neutron energies less than a few MeV.
Due to the 20 MeV limitation of the jendl cross sections, the evaluation of Eq. 9 was restricted to energies 20 MeV. Consequently, relative to the Monte Carlo simulated recoil-energy spectra presented earlier in this paper, the numerical calculation excludes a range of incident neutron energies between 20 and 150 MeV (as well as any inelastic interactions). The contribution to the differential event rate due to high-energy neutrons falls off exponentially with increasing energy, as does the number density per keV of incident energy. The spectral shapes presented below are therefore expected to be trivially affected by this exclusion of the highest-energy incident neutrons.
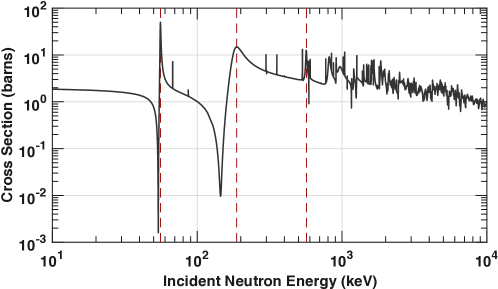
The jendl database files are available as text files in which is listed at several discrete energies between 110-5 eV and 20 MeV. To estimate to the desired precision, it was necessary to interpolate between these discrete values such that could be evaluated at arbitrary energies. The resulting interpolated cross sections for 28Si are shown in Fig. 16.
A.4 Elastic-scattering angular probabilities
The second part of the differential cross section, denoted , is the probability for a neutron of a given incident energy to scatter with a particular center-of-mass scattering angle. These angular probabilities are stored in the endf database files as Legendre polynomial coefficients. Coefficients are provided at several discrete energies between 110-5 eV and 150 MeV, and can be used to construct the angular probabilities according to
| (13) |
where is the Legendre polynomial, is the coefficient for incident energy , and the sum runs from to the highest-order nonzero term. If there are no nonzero coefficients at a given incident energy, the cross section is isotropic (i.e., all angles are equally likely). Similar to , interpolation was used to obtain the angular probabilities at arbitrary energies.
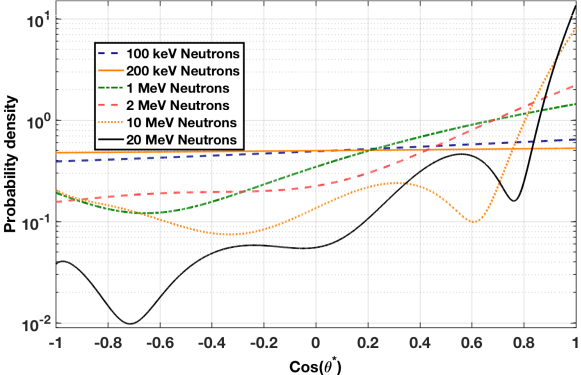
The angular scattering probability densities are provided for multiple incident neutron energies in Fig. 17. As the incident neutron energy increases, forward scattering () becomes increasingly likely.
A.5 Spectral shapes
With the differential number density and cross-section data specified as described above, Eq. 9 was evaluated for 28Si for –100 keV in steps of 0.1 keV. At each recoil energy considered, a range of incident neutron energies was calculated (between and 20 MeV) as a function of . The three inputs described above were either evaluated or interpolated at each incident neutron energy, to determine the differential event rate at each .
The resulting 28Si spectrum exhibits three bumps, shown in Fig. 18, due to the three most prominent resonances in the 28Si cross section (at , 183, and 550 keV; cf. Fig. 16). Figure 18 also compares the numerically calculated silicon spectrum to the high-statistics Geant4 simulation results. The discrepancy at low energy might be related to inelastic interactions and the tendency for neutrons to multiply scatter (in a single detector), neither of which was taken into account by the numerical calculation.
References
- [1] J. L. Feng. Dark Matter Candidates from Particle Physics and Methods of Detection. Ann. Rev. Astron. Astrophys., 48:495–545, 2010.
- [2] G. Steigman and M. S. Turner. Cosmological Constraints on the Properties of Weakly Interacting Massive Particles. Nucl. Phys. B, 253:375, 1985.
- [3] M. W. Goodman and E. Witten. Detectability of certain dark matter candidates. Phys. Rev. D, 31:3059–3063, 1985.
- [4] J. D. Lewin and P. F. Smith. Review of mathematics, numerical factors, and corrections for dark matter experiments based on elastic nuclear recoil. Astropart. Phys., 6:87–112, 1996.
- [5] D. S. Akerib, et al. Low-threshold analysis of CDMS shallow-site data. Phys. Rev. D, 82:122004, Dec 2010.
- [6] R. Bernabei, et al. New results from DAMA/LIBRA. Eur. Phys. J. C, 67:39–49, 2010.
- [7] C. E. Aalseth, et al. Results from a search for light-mass dark matter with a -type point contact germanium detector. Phys. Rev. Lett., 106:131301, Mar 2011.
- [8] G. Angloher, et al. Results from 730 kg days of the CRESST-II Dark Matter search. Eur. Phys. J. C, 72:1971, April 2012.
- [9] R. Agnese, et al. Silicon detector dark matter results from the final exposure of CDMS II. Phys. Rev. Lett., 111:251301, Dec 2013.
- [10] R. Agnese, et al. Improved WIMP-search reach of the CDMS II germanium data. Phys. Rev. D, 92:072003, Oct 2015.
- [11] D. S. Akerib, et al. Design and performance of a modular low-radioactivity readout system for cryogenic detectors in the CDMS experiment. Nucl. Instrum. Meth. A, 591:476–489, July 2008.
- [12] B. S. Neganov and V. N. Trofimov. Colorimetric method measuring ionizing radiation. Otkryt. Izobret., 146:215, 1985.
- [13] P. N. Luke. Voltage-assisted calorimetric ionization detector. J. Appl. Phys., 64:6858–6860, 1988.
- [14] B. S. Neganov and V. N. Trofimov. Possibility of producing a bulky supersensitive thermal detector at a temperature close to absolute zero. JETP Lett., 28:328–329, 1978.
- [15] R.W. Ogburn. A Search for Particle Dark Matter Using Cryogenic Germanium and Silicon Detectors in the One- and Two-Tower Runs of CDMS-II at Soudan. PhD thesis, Stanford University, 2008.
- [16] A. J. Anderson, et al. Simulations of Noise in Phase-Separated Transition-Edge Sensors for SuperCDMS. J. Low Temp. Phys., 167:135–140, May 2012.
- [17] S. A. Hertel. Advancing the Search for Dark Matter: from CDMS II to SuperCDMS. PhD thesis, Massachusetts Institute of Technology, 2012.
- [18] S. W. Leman. Invited Review Article: Physics and Monte Carlo techniques as relevant to cryogenic, phonon, and ionization readout of Cryogenic Dark Matter Search radiation detectors. Rev. Sci. Instrum., 83(9):091101–091101, September 2012.
- [19] A. E. Robinson. New libraries for simulating neutron scattering in dark matter detector calibrations. Phys. Rev. C, 89(3):032801, 2014.
- [20] Z. Ahmed, et al. Results from a Low-Energy Analysis of the CDMS II Germanium Data. Phys. Rev. Lett., 106(13):131302, April 2011.
- [21] J. P. Filippini. A Search for WIMP Dark Matter Using the First Five-Tower Run of the Cryogenic Dark Matter Search,. PhD thesis, University of California, Berkeley, 2008.
- [22] K. A. McCarthy. Detector Simulation and WIMP Search Analysis for the Cryogenic Dark Matter Search Experiment. PhD thesis, Massachusetts Institute of Technology, 2013.
- [23] J. Lindhard, et al. Mat. Fys. Medd. K. Dan. Vidensk. Selsk., 33:10, 1963.
- [24] P. Zecher, et al. Energy deposition of energetic silicon atoms within a silicon lattice. Phys. Rev. A, 41:4058–4061, Apr 1990.
- [25] G. Gerbier, et al. Measurement of the ionization of slow silicon nuclei in silicon for the calibration of a silicon dark-matter detector. Phys. Rev. D, 42:3211–3214, Nov 1990.
- [26] B. L. Dougherty. Measurements of ionization produced in silicon crystals by low-energy silicon atoms. Phys. Rev. A, 45:2104–2107, Feb 1992.
- [27] A. E. Chavarria, et al. Measurement of the ionization produced by sub-keV silicon nuclear recoils in a CCD dark matter detector. Phys. Rev. D, 94:082007, Oct 2016.
- [28] F. Izraelevitch, et al. A measurement of the ionization efficiency of nuclear recoils in silicon. JINST, 12(06):P06014, 2017.
- [29] A. R. Sattler. Ionization produced by energetic silicon atoms within a silicon lattice. Phys. Rev., 138:A1815–A1821, Jun 1965.
- [30] A. Chavarria. private communication, 2016.
- [31] R. Agnese, et al. Projected sensitivity of the SuperCDMS SNOLAB experiment. Phys. Rev. D, 95:082002, Apr 2017.
- [32] R. Bunker. A Low-Threshold Analysis of Data from the Cryogenic Dark Matter Search Experiment. PhD thesis, University of California, Santa Barbara, 2011.
- [33] M. B. Chadwick, et al. ENDF/B-VII.0: Next Generation Evaluated Nuclear Data Library for Nuclear Science and Technology. Nucl. Data Sheets, 107(12):2931–3060, December 2006.
- [34] R. Brun and F. Carminati. GEANT: detector description and simulation tool, long writeup W5013. CERN Program Library. CERN, Geneva, 1993.
- [35] S. Kamat. Extending the Sensitivity to the Detection of WIMP Dark Matter with an Improved Understanding of the Limiting Neutron Backgrounds. PhD thesis, Case Western Reserve University, 2005.
- [36] K. Shibata, et al. JENDL-4.0: A new library for nuclear science and engineering. J. Nucl. Sci. Technol., 48(1):1–30, 2011.
- [37] S. Agostinelli, et al and GEANT4 Collaboration. GEANT4: a simulation toolkit. Nucl. Instrum. Meth. A, 506:250–303, July 2003.