Heavy-element yields and abundances of Asymptotic Giant Branch models with a Small Magellanic Cloud metallicity
Abstract
We present new theoretical stellar yields and surface abundances for asymptotic giant branch (AGB) models with a metallicity appropriate for stars in the Small Magellanic Cloud (SMC, , [Fe/H] ). New evolutionary sequences and post-processing nucleosynthesis results are presented for initial masses between 1 and 7, where the 7 is a super-AGB star with an O-Ne core. Models above 1.15 become carbon rich during the AGB, and hot bottom burning begins in models . We present stellar surface abundances as a function of thermal pulse number for elements between C to Bi and for a selection of isotopic ratios for elements up to Fe and Ni (e.g., /), which can be compared to observations. The integrated stellar yields are presented for each model in the grid for hydrogen, helium and all stable elements from C to Bi. We present evolutionary sequences of intermediate-mass models between 4–7 and nucleosynthesis results for three masses () including -process elements for two widely used AGB mass-loss prescriptions. We discuss our new models in the context of evolved AGB stars and post-AGB stars in the Small Magellanic Clouds, barium stars in our Galaxy, the composition of Galactic globular clusters including Mg isotopes with a similar metallicity to our models, and to pre-solar grains which may have an origin in metal-poor AGB stars.
keywords:
nucleosynthesis, abundances — stars: AGB and post-AGB — ISM: abundances — galaxies: abundances – Magellanic Clouds1 Introduction
The Large and Small Magellanic Clouds (LMC and SMC, respectively) are two of the best studied satellite galaxies around the Milky Way Galaxy. They are both dwarf irregular galaxies with an average metallicity lower by about a factor of 2 and 5 respectively compared to the Milky Way thin disc, and show on-going star formation. Because of their proximity to the Milky Way Galaxy it is possible to perform detailed studies of the individual stars and the stellar populations within them (e.g., Cole et al., 2005; Mucciarelli et al., 2006, 2008; Mackey et al., 2008; Milone et al., 2009). Both the LMC and SMC harbour populations of young massive stars (e.g., the Tarantula nebula in the LMC, Evans et al., 2011) as well as thousands of evolved asymptotic giant branch stars including many carbon stars (Wood et al., 1983; Frogel et al., 1990; Sloan et al., 2008; Melbourne & Boyer, 2013).
The population of asymptotic giant branch (AGB) in the Magellanic Clouds are incredibly useful for studies of stellar evolution and nucleosynthesis. This is because the stars are at a known distance from us, so we can estimate their absolute brightness and luminosities. Furthermore, because the AGB population is so large, they span the entire range of AGB initial masses, which evolve from stars of 1 to about 8, allowing us to place important constraints on the physics of this most uncertain phase of stellar evolution (e.g., Smith & Lambert, 1989, 1990; Plez et al., 1993; Marigo et al., 1999; van Loon et al., 1999a; van Loon et al., 1999b; Maceroni et al., 2002; Groenewegen et al., 2009; García-Hernández et al., 2009; Gullieuszik et al., 2012; Kraemer et al., 2017). For reviews of the AGB phase of evolution we refer to Karakas & Lattanzio (2014) and Herwig (2005).
Many of the AGB stars in the Magellanic Clouds are in star clusters, allowing us to place firm constraints on their initial masses and ages (Kamath et al., 2010; Lebzelter & Wood, 2007), as well as compositions and evolutionary histories (Lebzelter et al., 2008; Lederer et al., 2009; Kamath et al., 2012). Recent surveys of the Magellanic Clouds have revealed populations of post-AGB stars (Kamath et al., 2014, 2015), which provide higher quality stellar abundance estimates than AGB stars because of their warmer atmospheres (van Winckel, 2003; Reyniers et al., 2007; De Smedt et al., 2012). Finally, we can also use the large population of planetary nebulae (PNe) in the LMC and SMC for studies of stellar evolution and nucleosynthesis (e.g., Vassiliadis et al., 1996; Dopita et al., 1997; Stanghellini et al., 2000; Marigo et al., 2003; Leisy & Dennefeld, 2006; Idiart et al., 2007; Bernard-Salas et al., 2008; Shaw et al., 2010; Ventura et al., 2016a).
The present day interstellar medium of the Large and Small Magellanic Clouds have metallicities of approximately a factor of 2 and 5 below solar (e.g., Russell & Dopita, 1992; Gordon et al., 2011). This means that the metallicity of young stars are [Fe/H]111we use the standard spectroscopic notation, [A/B] = . The ratio is the number ratio of elements and at the surface of the model star and is the solar number ratio, taken from Asplund et al. (2009). and [Fe/H] for the LMC and SMC. There are however large metallicity spreads in the stellar populations of the Magellanic Clouds. The median metallicity of the SMC is [Fe/H] , with a low-metallicity tail extending to [Fe/H] (e.g., Parisi et al., 2016).
The aim of this paper is to present new stellar evolutionary sequences calculated with the Monash stellar evolution code, abundances and stellar yields from models of or [Fe/H] when adopting for the solar metallicity. This is a follow-up to Karakas & Lugaro (2016), where we present new stellar abundances and yields of AGB stars of solar metallicity and a factor of two above and below solar (e.g., [Fe/H] = ). The new AGB models presented in this paper of [Fe/H] along with models presented in previous papers (Karakas & Lugaro, 2016; Fishlock et al., 2014b; Shingles et al., 2015; Lugaro et al., 2012) span most of the range of metallicities of stars in the thin and thick disk of the Milky Way, and in the Large and Small Magellanic Clouds.
The models presented here of [Fe/H] fill in the metallicity gap needed for studies of Galactic chemical evolution and the slow neutron capture process (the process). Busso et al. (2001) showed that the peak in [Ba/Fe] observed in AGB stars and related objects (e.g., barium stars, CH stars) lies at around [Fe/H] in the Galaxy. Previous models calculated at a similar metallicity (which adopted , based on a solar metallicity of ) with the Monash stellar evolution code did not include a full -process network, and presented surface abundances and yields of light-elements only (Karakas & Lattanzio, 2007; Karakas, 2010). Here we fill in this gap by providing surface abundance predictions and yields for elements from C through to Bi.
The outline of this paper is as follows. In Section 2 we provide a brief introduction to AGB stars and we introduce our methodology in Section 3. Section 4 presents the new stellar evolutionary sequences and in Section 5 we present the stellar abundances and yields. In Section 6 we compare our models to observations in the literature of a similar metallicity and discuss implications. We conclude in Section 7.
2 AGB stellar models
Stars with initial masses between about 0.8 to 8, depending on metallicity, will evolve through core hydrogen and helium burning before ascending the AGB (Busso et al., 1999; Herwig, 2005; Karakas & Lattanzio, 2014). It is during the AGB phase that the richest nucleosynthesis occurs, driven by He-shell instabilities. These instabilities or thermal pulses (TP) may drive third dredge-up mixing, which occurs when material from the H-exhausted core is mixed into the envelope. TDU will alter the composition of the envelope by bringing the products of He-shell burning and neutron-capture nucleosynthesis to the stellar surface. Prior to the AGB, the first and second dredge-up may occur; these mix the products of hydrogen burning from the main sequence to the envelope.
Low-mass AGB stars with initial masses have surface compositions that show enrichments in carbon, nitrogen, fluorine, and -process elements (e.g., Busso et al., 2001; Karakas et al., 2007; Weiss & Ferguson, 2009; Cristallo et al., 2015; Marigo et al., 2017). Intermediate-mass AGB stars on the other hand experience the second dredge-up (SDU) during the early AGB and hot bottom burning (HBB), the process by which the base of the envelope becomes hot enough for proton-capture nucleosynthesis (Karakas & Lattanzio, 2003a; Ventura et al., 2013). The surface chemistry of intermediate-mass stars shows the signature of proton-capture nucleosynthesis (e.g., nitrogen enhancements, McSaveney et al., 2007). The efficiency of third dredge-up and the contribution of He-shell nucleosynthesis to the surface chemistry of intermediate-mass stars is still debated (e.g., Karakas et al., 2012; Kalirai et al., 2014; Ventura et al., 2015).
Here we evolve models with masses between 1 and 7 from the main sequence to near the tip of the AGB. The mass range includes the full range of CO-core AGB stars and one super-AGB star with an O-Ne core: the 7 model, which experiences off-centre carbon ignition (e.g., Doherty et al., 2014).
3 Methodology
We employ the same methodology described in detail by Karakas (2014) and Karakas & Lugaro (2016). We first calculate stellar evolutionary sequences from the main sequence to the tip of the AGB using the Monash stellar evolution code (Karakas, 2014, and references therein). These stellar evolution models do not include rotation or non-standard mixing phenomena beyond convective overshoot at the base of the convective envelope during the thermally-pulsing AGB (see paragraph below). Rotation in stellar codes has been shown to increase the growth of the H-exhausted core and can promote mixing of internal layers with the surface regions, as shown by e.g., Decressin et al. (2009). Furthermore, rotation has been observationally discovered to be important in young LMC and SMC star clusters (Milone et al., 2016).
We calculate the low and intermediate-mass models with a scaled-solar composition and , where we adopt for the solar metallicity. This results in [Fe/H] = . Stars in the Milky Way Galaxy with a similar metallicity have some -enhancement (e.g., see Reddy et al., 2006) but usually only at a level of 0.2 dex. Furthermore, stars in the SMC with a similar metallicity of our models show either no or only a mild -enhancement (Russell & Dopita, 1992; Mucciarelli, 2014). We employ exactly the same input physics in the stellar evolutionary sequences to Karakas & Lugaro (2016) with the exception of AGB mass loss.
Here we adopt the Blöcker (1995) mass-loss law for intermediate-mass stars with (which is the same as used by Ventura et al., 2013). The Vassiliadis & Wood (1993) mass-loss law is used for lower mass models. We calculate evolutionary sequences for the 3.75, 4, 4.5, 5, 6 and 7 models with both the Vassiliadis & Wood (1993) and Blöcker (1995) mass-loss prescriptions in order to compare differences in the evolution and nucleosynthesis.
Our justification and reasons for these choices are as follows. Groenewegen et al. (2009) present mass-loss rates and luminosities of AGB stars in the LMC and SMC, respectively. They find that the Vassiliadis & Wood (1993) mass-loss law is a good approximation for the C-rich AGB stars but not for the intermediate-mass stars that experience HBB. For this reason we decide to experiment with the AGB mass-loss law for models with HBB. Furthermore, we noted previously in Karakas (2014) when using the Vassiliadis & Wood (1993) mass-loss law that lower metallicity models of with HBB experience many more thermal pulses than models of lower mass, with no HBB. We can see no physical reason why this should be the case and suspect it is caused by our implementation of the low-temperature opacities (or the opacities themselves) used in the calculations. Other studies have highlighted the dependence of HBB on the low-temperature opacities (Ventura & Marigo, 2010; Fishlock et al., 2014a; Constantino et al., 2014) although further investigation is required to find out if our implementation of the low-temperature molecular opacities from Marigo & Aringer (2009) is indeed the cause. However the main physical reason is that our intermediate-mass models of lower metallicity stay compact for longer, which delays the onset of the superwind owing to the fact that the Vassiliadis & Wood (1993) has a strong dependence on stellar radius.
We decide to adopt the Blöcker (1995) mass-loss rate for intermediate-mass stars because it is widely used by other authors (e.g., Ventura et al., 2013; Pignatari et al., 2016). Our reasons are that Ventura et al. (2000) showed that the high fraction of Li-rich stars above in the Magellanic Clouds demanded high mass-loss rates, and tentatively calibrated the free parameter in the Blöcker (1995) formulation applied to their models. With our choice of our intermediate-mass AGB models become rich in Li and remain so for years. The Blöcker (1995) mass-loss rate is strongly dependent on the stellar luminosity, which will be lower in our AGB models than in the Ventura et al. (2013) models, which means that rates of mass-loss in the intermediate-mass AGB models will not be the same. Our AGB luminosities are lower because we adopt the Mixing-Length Theory of convection (with a mixing-length parameter, ) which has been shown to reduce the luminosity in AGB models with HBB (Mazzitelli et al., 1999; Ventura & D’Antona, 2005a).
The surface abundances and yields for the intermediate-mass models are calculated with the Blöcker (1995) mass-loss except for the 3.75, 5 and 7 models, where we calculate nucleosynthesis for stellar evolutionary sequences calculated with Blöcker (1995) mass-loss and Vassiliadis & Wood (1993) mass-loss to allow a comparison of the stellar yields.
Similar to Karakas & Lugaro (2016) we include convective overshoot in low-mass AGB models (here ) in order that they experience third dredge-up after thermal pulses on the AGB. We include overshoot because observations of carbon-rich AGB stars in the Magellanic Clouds suggest that the present-day AGB mass of the lowest mass C-stars is around 1 (see Chapter 2 in Habing & Olofsson, 2004). These observations can only be reproduced with the inclusion of overshoot with the Monash code. The treatment of overshoot in the models is exactly the same as described in Karakas & Lugaro (2016) where we extend the base of the envelope by pressure-scale heights, where for both the 1.15 and 1.25 models.
For the detailed nucleosynthesis of elements between hydrogen through to bismuth, we use a post-processing code in the same manner to Karakas & Lugaro (2016). We employ the same nuclear network and initial solar abundances and we refer to that paper for full details.
3.1 The inclusion of 13C pockets
AGB stars and their progeny are observed to be enriched in -process elements by up to 1 dex at solar metallicity (see e.g., Busso et al., 2001; Abia et al., 2002). This implies that a large number of neutrons need to be released in the He-intershell by (,n) reactions. The main source of neutrons is the (,n) reaction, which requires a reservoir of in order to be activated. CNO cycling does not leave enough nuclei in the He-intershell to produce -process elements (e.g., Karakas et al., 2007). The usual solution to this problem is to assume that some partial mixing of protons occurs between the convective envelope and the He-intershell. This mixing is assumed to occur at the deepest extent of each TDU episode where a sharp discontinuity is present between the H-rich convective envelope and the He-rich radiative intershell. The protons mixed into the top of the He-intershell are captured by to produce a region rich in , the so-called “pocket”.
The formation of pockets in theoretical calculations of AGB stars is one of the most significant uncertainties affecting predictions of the process (see discussion in Busso et al., 1999; Herwig, 2005; Karakas & Lattanzio, 2014). A range of possibilities and models has been proposed to mix protons into the He-intershell at the deepest extent of each TDU episode. Among the most recent proposed mechanisms, Herwig (2000) and Cristallo et al. (2009) employed convective overshoot (see also Goriely & Siess, 2018, for a recent analysis), Denissenkov & Tout (2003) internal gravity waves, and Trippella et al. (2016) magnetic fields. Here we adopt the same techniques we have applied before (Fishlock et al., 2014b; Karakas & Lugaro, 2016) and outlined in detail in Karakas & Lugaro (2016) and Buntain et al. (2017).
Briefly, we include pockets by means of an artificial mixing profile driving the mixing of protons into the intershell. The mixing is modelled using an exponential function where the exponent is a linear function of the mass. This method produces -process results for low-mass AGB stars very close to those produced by the overshoot models of Cristallo et al. (2009), as discussed in detail in previous studies (Lugaro et al., 2012; Kamath et al., 2012; Fishlock et al., 2014b; Karakas & Lugaro, 2016). Here, we test different mass extents of the region affected by the mixing. Possible variations in the exponential function were analysed in detail by Buntain et al. (2017), who concluded that, typically, changing the shape of the mixing function or the mass extent produce similar results: they change the absolute yield values but do not affect the relative distribution of the -process elements.
As noted above, we do not include rotation in our models. Rotational mixing could strongly affect the -process by mixing , a neutron poison via the (n,p) reaction (Wallner et al., 2016), into the pocket (Herwig et al., 2003; Siess et al., 2004; Piersanti et al., 2013). Investigations are currently under way to establish the strength of this rotational effect and the link with the astereoseismology observational constraints that the cores of giant stars and white dwarfs have lower rotation periods than expected by stellar models (Cantiello et al., 2014).
In Table 1 we show the entire range of stellar nucleosynthesis models calculated for each stellar mass, where the value of is chosen as function of the stellar mass. Table 1 shows that we include pockets in all AGB models which experience TDU. Owing to variations in the distribution of -process elements in stars, we experiment with varying the parameter, , in a sample of the models as demonstrated by Table 1.
For intermediate-mass AGB models above 4.5 we do not include a pocket, which follows observational evidence that the neutron source is not present in intermediate-mass AGB stars (García-Hernández et al., 2013). Theoretical models also support this choice (Goriely & Siess, 2004) because the hot base of the envelope destroys protons during dredge-up, before they can be captured by in the intershell. The -process predictions of Cristallo et al. (2015) show activation of the neutron source in their intermediate-mass models, although, the signature at the stellar surface is very weak due to the low TDU efficiency. This could be because HBB is not very strong and protons are subsequently not destroyed during TDU.
| Mdot | 0 | |||||
|---|---|---|---|---|---|---|
| Stellar Mass () | ||||||
| 1.00 | VW93 | ✓ | ||||
| 1.15 | VW93 | ✓ | ✓ [ST] | ✓ | ||
| 1.25 | VW93 | ✓ [ST] | ✓ | |||
| 1.50 | VW93 | ✓ | ✓ [ST] | ✓ | ||
| 1.75 | VW93 | ✓ [ST] | ||||
| 2.00 | VW93 | ✓ | ✓ [ST] | ✓ | ||
| 2.25 | VW93 | ✓ [ST] | ||||
| 2.50 | VW93 | ✓ [ST] | ✓a | |||
| 2.75 | VW93 | ✓ [ST] | ||||
| 3.00 | VW93 | ✓ [ST] | ✓ | |||
| 3.25 | VW93 | ✓ [ST] | ||||
| 3.50 | VW93 | ✓ [ST] | ||||
| 3.75 | VW93 | ✓ | ✓ [ST] | |||
| 3.75 | B95 | ✓ | ||||
| 4.00 | B95 | ✓ [ST] | ✓ | |||
| 4.50 | B95 | ✓ [ST] | ✓ | |||
| 5.00 | B95 | ✓ [ST] | ||||
| 5.00 | VW93 | ✓ [ST] | ||||
| 5.50 | B95 | ✓ [ST] | ||||
| 6.00 | B95 | ✓ [ST] | ||||
| 6.50 | B95 | ✓ [ST] | ||||
| 7.00 | B95 | ✓ [ST] | ||||
| 7.00 | VW93 | ✓ [ST] |
(a) – in this case we used
4 AGB model results
In this section we focus on structural details of the AGB models that are relevant for the nucleosynthesis and therefore shape the stellar yields. These include the H-exhausted core mass at the beginning of the thermally-pulsing AGB, the number of thermal pulses on the AGB, the amount of material dredged up to the surface, along with the temperature of the hydrogen and helium shells and the temperature at the base of the convective envelope.
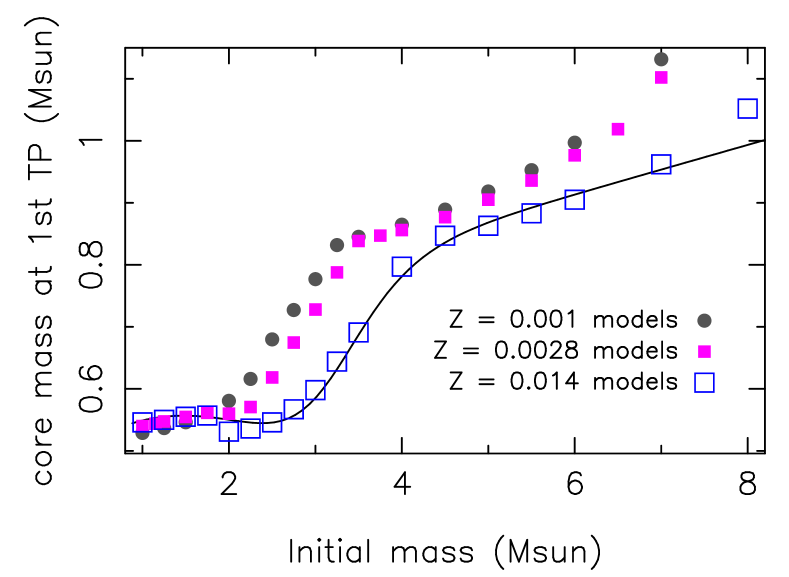
In Fig. 1 we show the H-exhausted core mass (hereafter core mass) at the beginning of the thermally-pulsing AGB for the models. We compare the core mass at this stage in the evolution to models of from Fishlock et al. (2014b), which while slightly lower metallicity are very similar to the models presented here. For comparison we show the core mass at the first thermal pulse for models of solar metallicity (), noting that the “knee" around 4 in the solar-metallicity models shifts to at lower metallicities. This means that the minimum mass for HBB, which strongly depends on this parameter, will shift to a lower initial mass. Note that we find no difference in core mass at the beginning of the AGB for models calculated with Vassiliadis & Wood (1993) mass-loss compared to models calculated with Blöcker (1995) mass-loss.
In Fig. 2 we show the number of thermal pulses from each calculation as a function of the initial mass. Results from models calculated with Vassiliadis & Wood (1993) mass-loss on the AGB are shown by the solid line while results for intermediate-mass models calculated with Blöcker (1995) are shown by the dashed line. Vassiliadis & Wood (1993) mass-loss results in TPs for models with but that number greatly increases in intermediate-mass models which experience efficient hot bottom burning. Fig. 2 shows that models with Vassiliadis & Wood (1993) experience roughly twice as many thermal pulses on the AGB compared to models calculated with Blöcker (1995) mass-loss with .
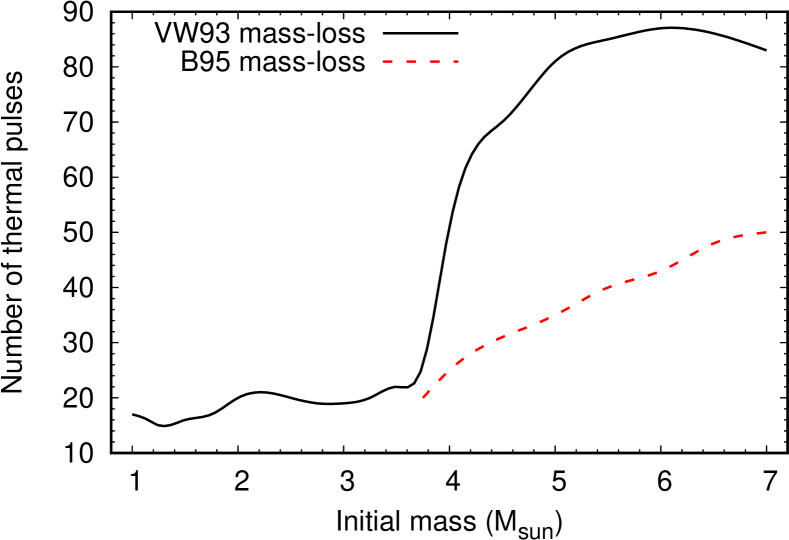
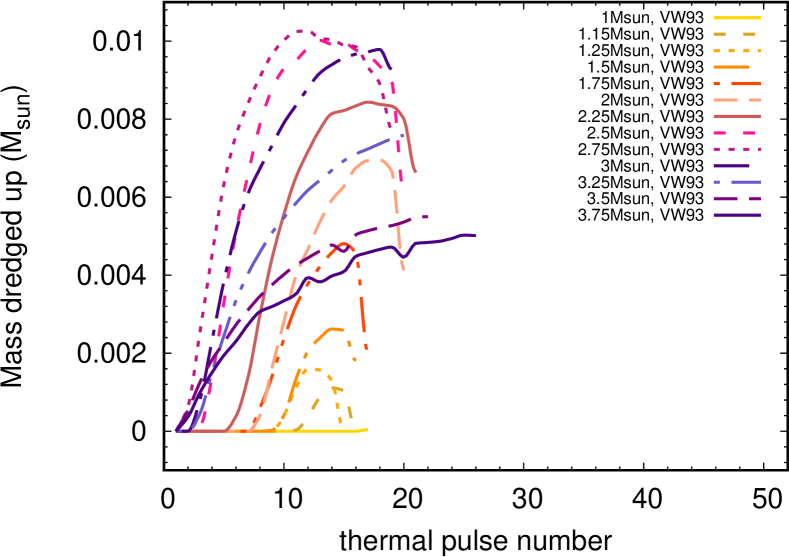
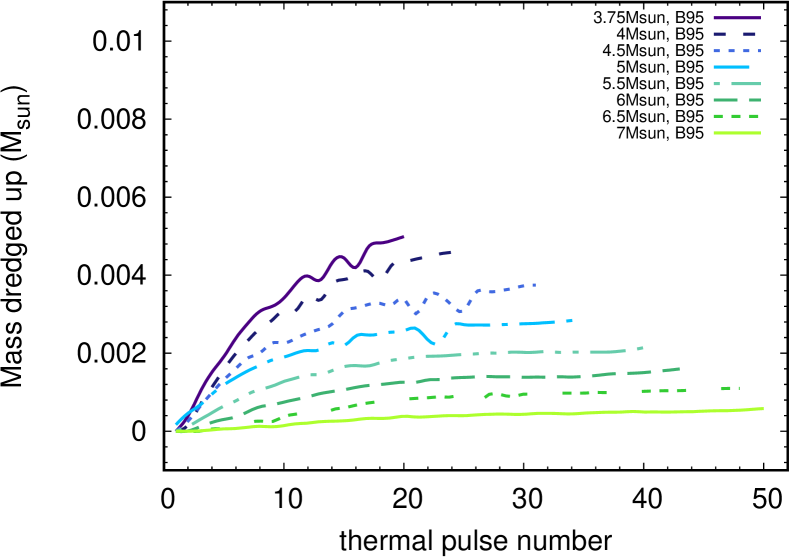
The amount of material dredged-up from the He-intershell is important for determining the surface composition during the AGB and the final yields. In Fig. 3 we show the mass dredged-up as a function of thermal pulse for each of the models for which we also present stellar yields. We do not show the amount of mass dredged up for the intermediate-mass models calculated with Vassiliadis & Wood (1993) mass-loss but as Fig. 2 illustrates, these models experience roughly twice as many thermal pulses and consequently dredge-up roughly twice as much. Using the 6 model as an example, the model with Vassiliadis & Wood (1993) dredges up 0.105 in total from the He-intershell, roughly twice that of the model calculated with Blöcker (1995) mass-loss which dredges up 0.0469.
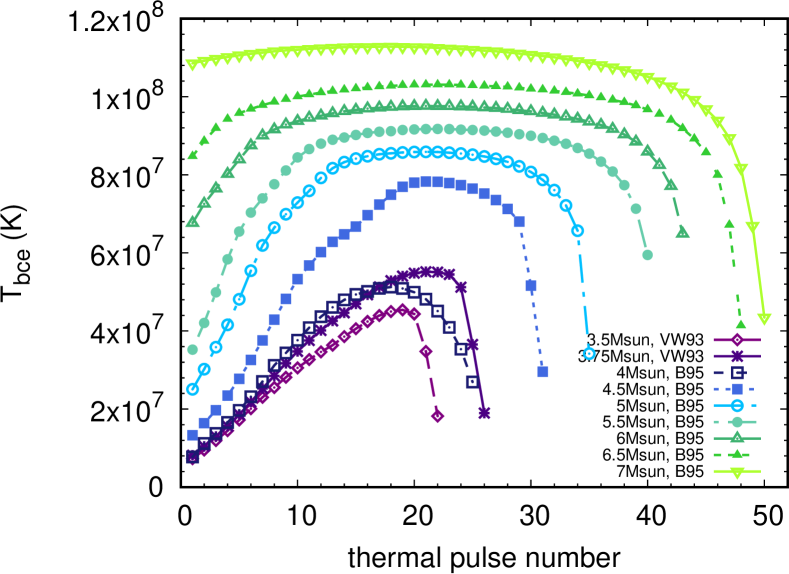
Fig. 4 shows the maximum temperature at the base of the envelope predicted for the intermediate-mass models (). When the temperature at the base of the envelope exceeds about K (hereafter MK; where the exact minimum mass depends also on the metallicity and hence structure of the envelope), proton-capture nucleosynthesis or HBB can occur. For the the minimum stellar mass for HBB with the Monash stellar evolution code is 3.75, which has a maximum HBB temperature of 55 MK.
The minimum mass depends on the mass-loss used on the AGB. With Blöcker (1995) mass-loss the minimum initial mass increases to 4 from 3.75. This is because models with Blöcker (1995) mass-loss lose their envelope masses faster, which consequently reduces the temperature at the base of the envelope. Fig. 4 shows that the 3.75 model with Vassiliadis & Wood (1993) mass-loss reaches a higher maximum temperature than the 4 model with Blöcker (1995) mass-loss on the AGB. To show just how much the maximum temperature depends on mass-loss, the 4 model with Vassiliadis & Wood (1993) has a maximum HBB temperature of 78.7 MK, about 50% higher, as a consequence of the envelope mass remaining higher for longer.
The minimum initial mass for HBB is also strongly dependent upon the treatment of convection in stellar envelopes as highlighted by Ventura & D’Antona (2005a) and subsequent papers (e.g., Ventura et al., 2015). The ATON code finds the minimum mass for HBB to be about 1 lower than models calculated with the Monash stellar evolution code. The FRUITY models by Cristallo et al. (2015) on the other hand find much milder HBB compared with the Monash models as discussed by those authors and Karakas & Lugaro (2016). The MESA/NuGrid models of Pignatari et al. (2016) predict HBB at a similar minimum mass to the Monash models, while the models by Weiss & Ferguson (2009) finds that HBB occurs 1 higher (e.g., 6 for solar metallicities whereas we find efficient HBB at 5). Marigo et al. (2013) obtains higher luminosities than models calculated with the Monash code, again highlighting the sensitivity of HBB to the input physics.
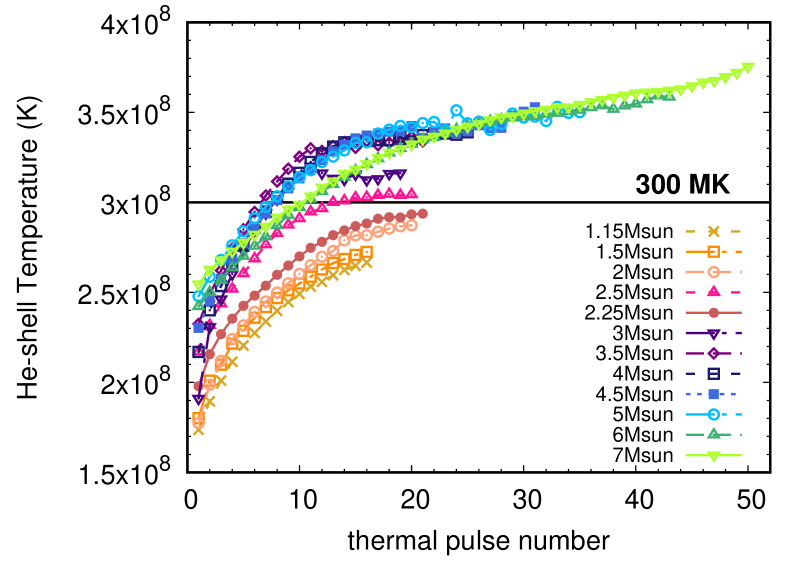
Fig. 5 shows the maximum temperature in the He-shell during thermal pulses for a selection of the models. We also include a line at 300 MK to show which models fall below and above, in terms of maximum He-shell temperatures. Models less than 2.5 do not reach peak He-shell temperatures above 300 MK, which means that the e(, n)g neutron source is never activated. For these low-mass models, neutrons are only released by the (, n) reaction. For models , He-shell temperatures exceed 300 MK, which means that there will be a burst of neutrons released at high density during thermal pulses. Fig. 5 illustrates that the 2.5 model only reaches temperatures of 300 MK during the last few TPs while for intermediate-mass models over 4 the majority of thermal pulses exceed 300 MK. Consequences of the e reactions include the production of g and g (e.g., Karakas & Lattanzio, 2003b) and the production of Rb over Sr, Zr (e.g., van Raai et al., 2012; Karakas et al., 2012).
5 Nucleosynthesis results
Here we present the results of the post-processing nucleosynthesis calculations.
5.1 Data tables
Similar to Karakas & Lugaro (2016) we provide on-line only data tables for download. There are three tables: 1) surf_z0028.dat, the elemental surface abundances as a function of thermal pulse number for all models shown in Table 1; 2) isotope_z0028.dat, the isotopic ratios of the elements up to Ni as a function of thermal pulse number; and 3) yields_z0028.dat, the integrated elemental yields. In this section we summarize the nucleosynthesis results and stellar yields. In Appendix A we provide examples of each of the datafile types available for download.
The surface abundance data tables start with the initial abundances used in the post-processing calculations and then include elemental abundances as a function of thermal pulse number. At each entry we include the thermal pulse number, the stellar mass, core mass and envelope mass at that thermal pulse (in ), and the surface luminosity (in ). After the abundances of each element are given, with one row per element, we then provide the ratios of He/H, C/O and N/O at that thermal pulse. The final entry for each () combination are the final surface abundances, taken at the last time step, which may fall on a thermal pulse or during the interpulse period.
Our surface abundance data tables (both elemental and isotopic) are in exactly the same format as in Karakas & Lugaro (2016). This means that for all elements except Li, Be and B we include the element name, the proton number, ; the abundance in the format where ; [X/H], [X/Fe], [X/O], and the mass fraction . The radioactive elements Tc and Pm may be non-zero in terms of , if they are produced by neutron captures and mixed to the surface.
We do not decay the abundances of radioactive isotopes, because key isotopes such as l and e, are produced in intermediate-mass stars and are observed in the isotopic grain data. Radioactive isotopes are assumed to have all decayed in the yield tables. In the surface abundance tables we do decay r to b because the element Nb obtains most of its production by this decay.
In the isotopic data tables we include the following ratios: /, /, /, g/g, l/l, i/i, l/l, r/r, /, a/a, i/i, r/r, e/e, and i/i.
The integrated elemental yields are in a similar format to those available in Karakas & Lugaro (2016) with the addition of the net yield, which is calculated according to
| (1) |
where is the net yield of species (in solar masses), is the current mass-loss rate, the current mass fraction of species at the surface, is the initial mass fraction, and is the stellar lifetime. The net yield can be negative, when the element is destroyed by stellar evolution and mixing processes (e.g., hydrogen is only consumed). We also provide the total mass expelled which is calculated according to
| (2) |
The yields from Equation 2 are the total amount of element expelled into the interstellar medium over the stellar lifetime (in ) and are always positive.
In Table 5 we show the first few lines of the yield tables for the 2, model. We include the initial and final mass along with the total expelled mass (1.341 in this case). The header for each combination also includes the used in the -process calculations. The columns include the element name, proton number , the average abundance in the wind ejected in the following formats: 1) which is defined according to , where is the ratio of element to hydrogen (by number); 2) [X/H]; 3) [X/Fe]; 4) , which is the average mass fraction in the wind; 5) Net calculated according to Equation 1; and 6) the total mass of element expelled calculated according to Equation 2.
5.2 Surface abundances on the AGB
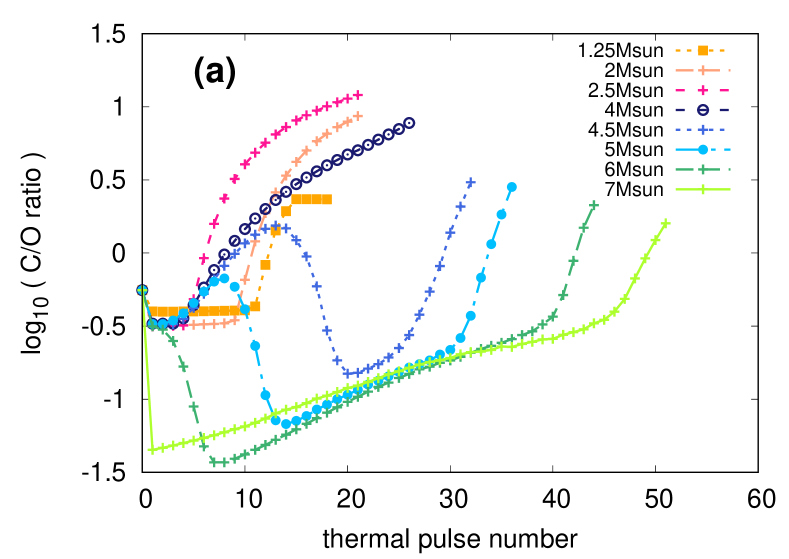
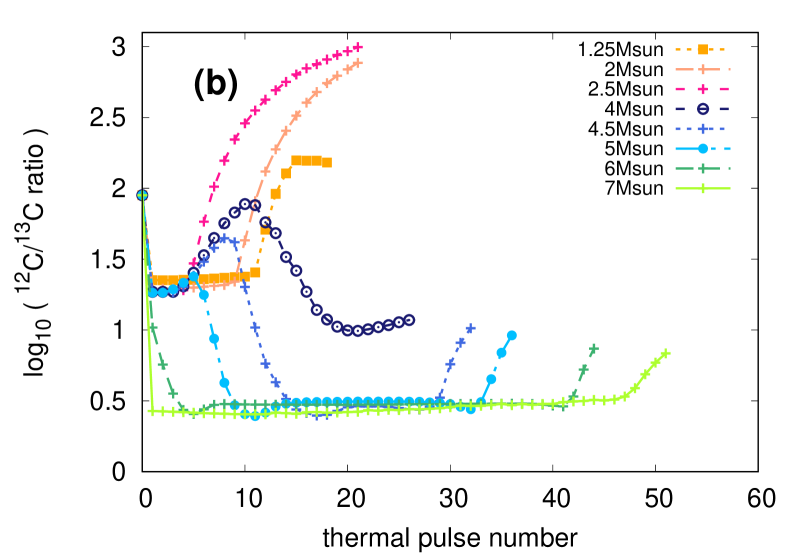
Here we summarize the evolution of the surface composition on the AGB. In the top panel of Fig 6 we show the evolution of the C/O ratio as a function of thermal pulse number for a selection of the models, while the bottom panel of Fig. 6 shows the evolution of the / ratio for the same set of models.
Fig. 6 illustrates the complex behaviour of the C/O and / ratios in models with both TDU and HBB. For intermediate-mass models with efficient HBB, the C/O during most of the thermally-pulsing AGB and it is only toward the end when sufficient mass-loss occurs that HBB is shut off and the C/O ratio increases and eventually exceeds unity.
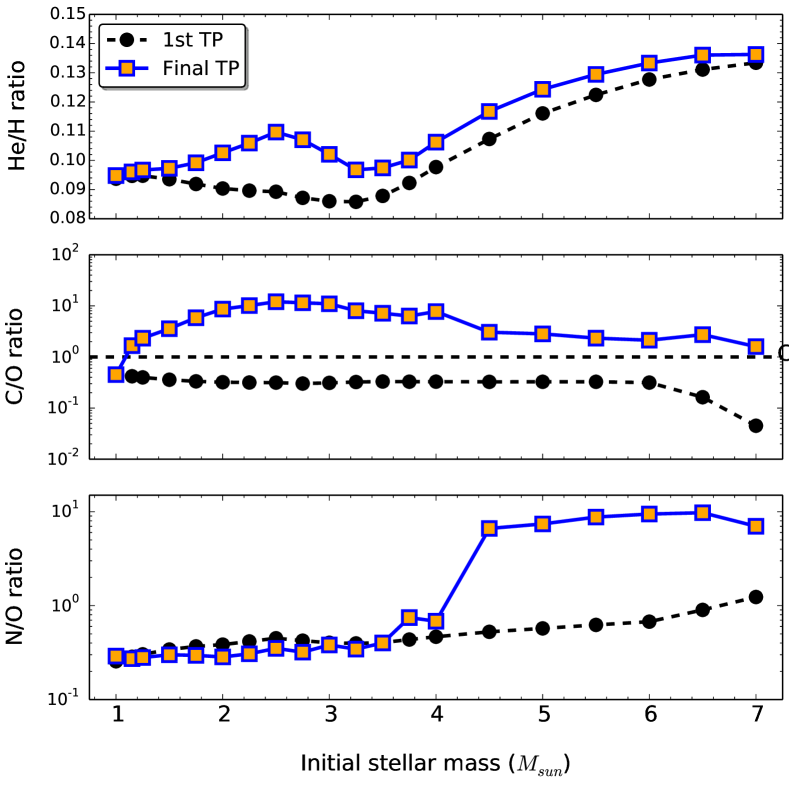
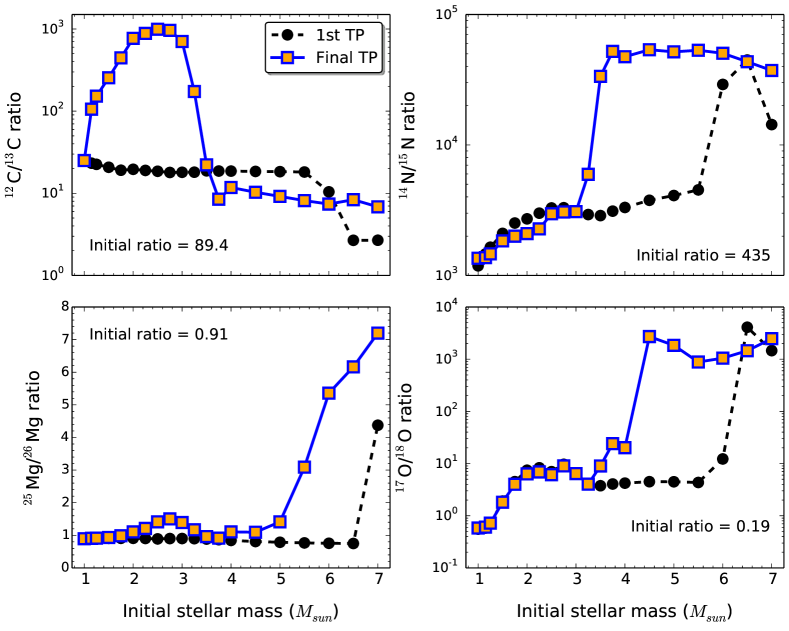
In Fig. 7 and 8 we show the ratios for He/H, C/O and N/O and /, /, g/g and / at the stellar surface. We include the ratios at the first thermal pulse and at the end of the AGB, at the last calculated time step. For most masses the ratios at the first thermal pulse reflect the post-first and second dredge-up abundances; the exceptions are the 6.5 and 7 models which begin HBB before the first thermal pulse. This is clear from the high N/O and / ratios which shows considerable CN processing, and from the low / ratio already evident at that stage.
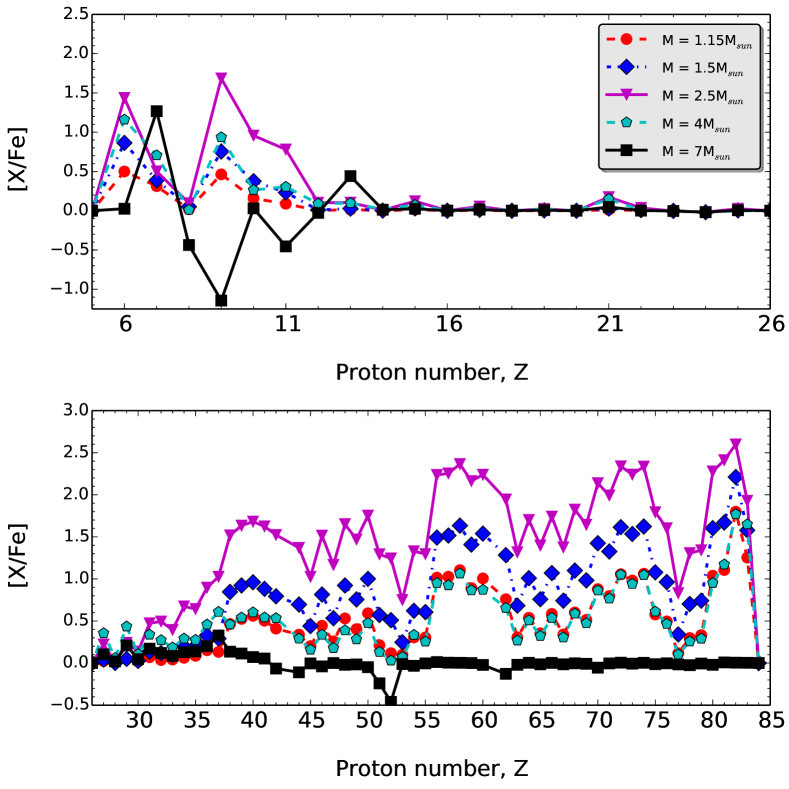
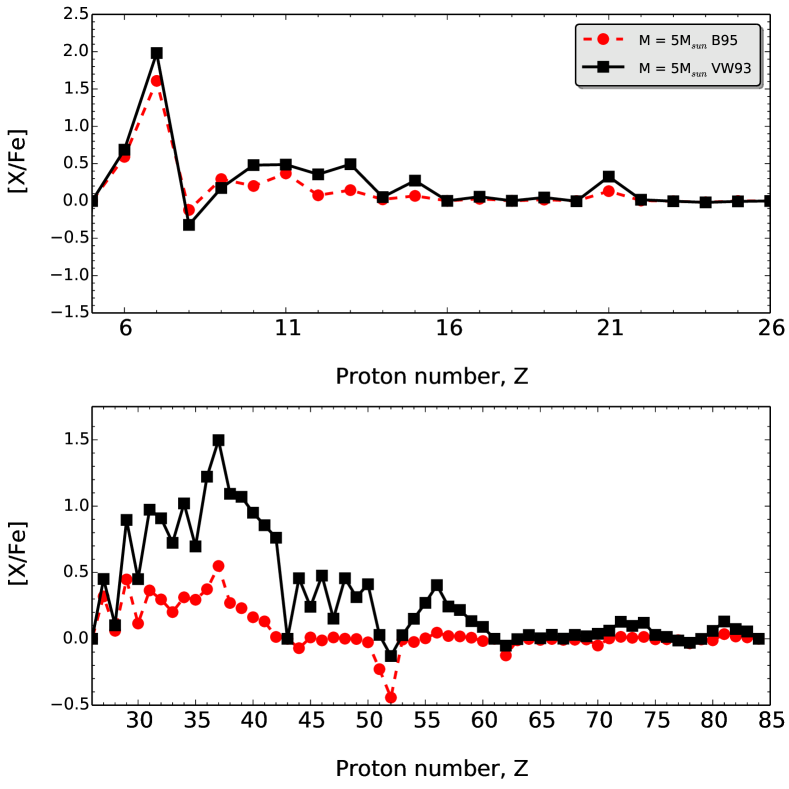
In Fig. 9 we show the final surface abundances for a selection of the models between 1.15 and 7. The top panel shows elements lighter than iron and the lower panel elements heavier than iron. The 7 experiences strong HBB and we can see considerable destruction of some light elements as a result of CNO cycling (e.g., the final [O/Fe] ), along with strong N production. There is very little production of neutron-capture elements at the surface of the 7 model, even though temperatures in the He-shell peak at 376 MK, strong enough to activate the e(,n)g reaction. An examination of the intershell during the final shell flash reveals strong enhancements of elements at the first -process peak including Sr, Rb and Y. The model does not dredge-up much material from the He-intershell (0.0176 in total over the whole AGB) and the massive envelope results in a strong dilution. In comparison, the 3 model dredges up a total of 0.124 over the entire AGB.
Fig. 9 shows that final surface abundance pattern for the lower mass models shows a strong enrichment in elements typically produced by AGB stars including C, F and -process elements. For the metallicity of [Fe/H] we see that the ratio of the second -process peak around Ba, La, and Ce dominates, although a similar amount of Pb production also occurs. In Table 2 we show the -process indicators defined according to Lugaro et al. (2012) for each calculation. We show [Rb/Zr], [ls/Fe] = (Sr+Y+Zr)/3, [hs/Fe] = (Ba+La+Ce)/3, [hs/ls], and [Pb/hs] and list the mass-loss formula used on the AGB and the size of the partial mixing zone (e.g, see Table 1).
| Mass/ | Mdot | [Rb/Zr] | [ls/Fe] | [hs/Fe] | [hs/ls] | [Pb/hs] | |
|---|---|---|---|---|---|---|---|
| 1.00 | VW93 | 0.0 | 0.014 | 0.001 | 0.001 | -0.002 | 0.001 |
| 1.15 | VW93 | 0.001 | 0.233 | 0.287 | 0.820 | 0.533 | 0.699 |
| 1.15 | VW93 | 0.002 | 0.420 | 0.504 | 1.031 | 0.528 | 0.749 |
| 1.15 | VW93 | 0.006 | 0.652 | 0.828 | 1.457 | 0.629 | 0.618 |
| 1.25 | VW93 | 0.002 | 0.504 | 0.643 | 1.126 | 0.484 | 0.782 |
| 1.25 | VW93 | 0.006 | 0.719 | 0.983 | 1.620 | 0.638 | 0.637 |
| 1.50 | VW93 | 0.001 | 0.554 | 0.639 | 1.300 | 0.661 | 0.659 |
| 1.50 | VW93 | 0.002 | 0.664 | 0.897 | 1.535 | 0.637 | 0.664 |
| 1.50 | VW93 | 0.006 | 0.821 | 1.294 | 1.924 | 0.630 | 0.508 |
| 1.75 | VW93 | 0.006 | 0.787 | 1.175 | 1.832 | 0.656 | 0.633 |
| 2.00 | VW93 | 0.001 | 0.754 | 1.098 | 1.834 | 0.736 | 0.503 |
| 2.00 | VW93 | 0.002 | 0.732 | 1.352 | 1.994 | 0.642 | 0.666 |
| 2.00 | VW93 | 0.006 | 0.771 | 1.776 | 2.366 | 0.590 | 0.352 |
| 2.25 | VW93 | 0.002 | 0.777 | 1.498 | 2.130 | 0.632 | 0.530 |
| 2.50 | VW93 | 0.002 | 0.656 | 1.591 | 2.262 | 0.671 | 0.326 |
| 2.50 | VW93 | 0.004 | 0.523 | 1.816 | 2.439 | 0.623 | 0.279 |
| 2.75 | VW93 | 0.002 | 0.398 | 1.592 | 2.251 | 0.660 | 0.278 |
| 3.00 | VW93 | 0.001 | 0.303 | 1.286 | 1.955 | 0.669 | 0.408 |
| 3.00 | VW93 | 0.002 | 0.141 | 1.478 | 2.128 | 0.650 | 0.439 |
| 3.25 | VW93 | 0.001 | 0.111 | 1.260 | 1.866 | 0.606 | 0.489 |
| 3.50 | VW93 | 0.001 | 0.070 | 1.265 | 1.859 | 0.594 | 0.551 |
| 3.75 | VW93 | 0.062 | 1.242 | 1.854 | 0.611 | 0.526 | |
| 3.75 | VW93 | 0.001 | 0.062 | 1.242 | 1.854 | 0.611 | 0.526 |
| 3.75 | B95 | 0.001 | 0.079 | 1.178 | 1.784 | 0.606 | 0.532 |
| 4.00 | B95 | 0.008 | 0.462 | 0.891 | 0.429 | 0.762 | |
| 4.00 | B95 | 0.001 | 0.063 | 1.204 | 1.801 | 0.597 | 0.584 |
| 4.50 | B95 | 0.0 | 0.275 | 0.120 | 0.016 | 0.104 | 0.004 |
| 4.50 | B95 | 0.023 | 0.471 | 0.900 | 0.429 | 0.807 | |
| 5.00 | VW93 | 0.0 | 0.540 | 0.852 | 0.205 | 0.647 | 0.149 |
| 5.00 | B95 | 0.0 | 0.240 | 0.106 | 0.013 | 0.093 | 0.004 |
| 5.50 | B95 | 0.0 | 0.182 | 0.071 | 0.008 | 0.062 | 0.002 |
| 6.00 | B95 | 0.0 | 0.148 | 0.054 | 0.006 | 0.049 | 0.001 |
| 6.50 | B95 | 0.0 | 0.131 | 0.046 | 0.004 | 0.042 | 0.000 |
| 7.00 | VW93 | 0.0 | 0.166 | 0.065 | 0.004 | 0.061 | 0.001 |
| 7.00 | B95 | 0.0 | 0.099 | 0.033 | 0.002 | 0.031 | 0.000 |
The effect of a partial mixing zone and the (,n) neutron source on the operation of the -process is particularly noticeable for the 4.5 model. This model has the minimum mass with efficient HBB, with more nitrogen production compared to carbon, and is the maximum mass where we include a pocket. Models with no pocket only release neutrons from the e(,n)g reaction operating during thermal pulses. The e source results in more Rb than Zr, evidenced by the [Rb/Zr] ratio of 0.28 and little heavy -elements (e.g., Ba) or Pb. In contrast, the model with a pocket show a strong over-production of -process elements, with a final [Ba/Fe] and [Pb/Fe] . The ratio of [Rb/Zr] shows a mix of e and neutron sources, unlike the lower mass models which have [Rb/Zr] ratios that are strongly negative.
5.3 The effect of mass-loss on the nucleosynthesis
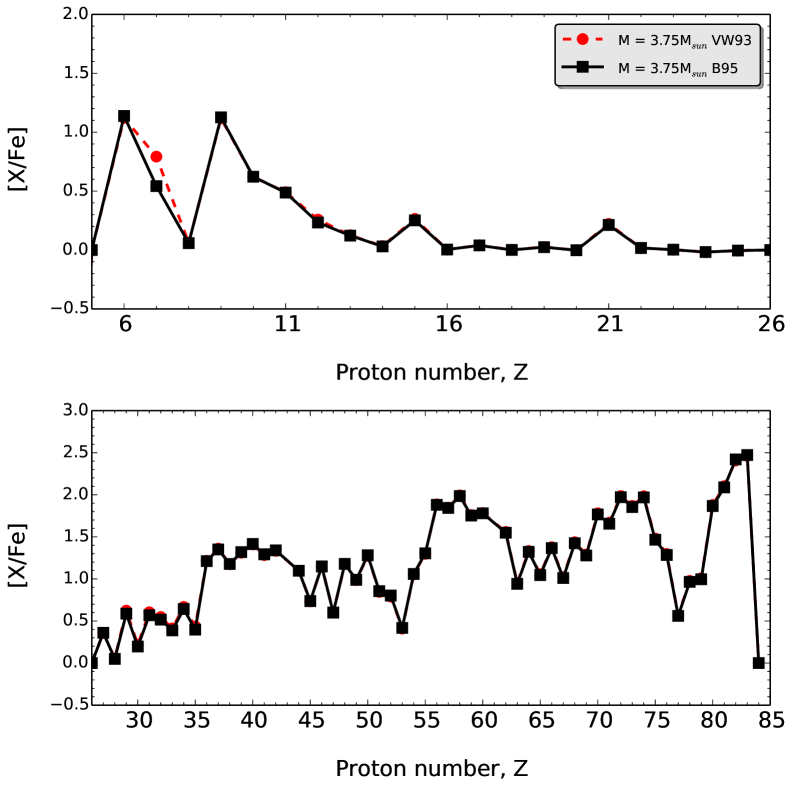
We perform nucleosynthesis calculations for the 3.75, 5 and 7 models on the evolutionary sequences that use Vassiliadis & Wood (1993, hereafter VW93) and Blöcker (1995, hereafter B95) mass-loss on the AGB. The 3.75 model show mild HBB but also strong third dredge-up (e.g., in Fig. 3) compared to the other intermediate-mass models. This model becomes strongly enriched in carbon and -process elements regardless of the number of thermal pulses. Indeed, the VW93 model only experiences an extra 5 TPs compared to the B95 model. The resulting nucleosynthesis and yields are therefore similar as shown in Fig. 10.
The 5 and 7 models with B95 mass-loss show strong HBB on the evolution of the light elements and little increase in the heavy elements produced by the -process. This is because the number of thermal pulses are considerably lower, as shown in Fig. 2. In contrast, in Fig. 11 shows that the production of heavy-elements increases dramatically in the 5 model with VW93 mass-loss. In particular, the final surface [Rb/Fe] in the VW93 model compared to 0.43, an increase of an order of magnitude. Similar results, although less dramatic, are also observed for the 7 model where the final [Rb/Fe] in the VW93 model compared to [Rb/Fe] in the model with B95 mass-loss (e.g., see results in Table 2).
Note that the 5 and 7 models become C-rich once the superwind begins, however as shown in Fig. 6 for most (%) of the thermally-pulsing AGB phase the surface composition is oxygen rich where C/O . This result holds regardless of the AGB mass-loss rate used in the calculation.
In summary, the choice of AGB mass-loss rate is most important for intermediate-mass AGB models with strong HBB. A stronger mass-loss rate such as B95 favours stronger HBB on the surface composition and yields, while VW93 favours a strong overproduction of heavy elements formed by the -process along with considerable primary nitrogen.
6 Discussion
In this section we discuss observations of AGB stars and their progeny that are found with a similar metallicity to the AGB models presented here. We also discuss the issue of the light-element abundances observed in Galactic Globular Clusters, in comparison to our intermediate-mass model results. We start with barium stars, which are the product of mass transfer from an AGB companion.
6.1 Barium stars
Models of AGB stars at [Fe/H] 0.7 are necessary to interpret the composition of Barium (Ba) stars because these stars are s-process element enhanced first giant branch stars and dwarfs with spectral classes from G to K in the metallicity range [Fe/H] 0.3 to 1.
Bidelman & Keenan (1951) identified first the strong spectral features at specific wavelengths of elements heavier than iron (e.g. BaII at 4554 Å, SrII at 4077 Å, CH, CN, C2 molecular bands) in the spectra of these stars. Later McClure et al. (1980) and McClure (1983) pointed out the binary nature of Ba stars – radial velocity observations showed that about 85% of these stars belong to a binary system. Based on the evolutionary phase of the Ba stars and considering that s-process elements are synthesized in the interior of AGB stars, the overabundance of s-elements in Ba stars cannot be intrinsic. McClure (1984) suggested that the primary star – now a white dwarf – during the AGB phase transferred s-process enhanced material to the secondary, which is now observed as a Ba star. Because the temperature range of Ba stars is higher than that of AGB stars, their spectra are easier to model, which allows a more straightforward derivation of the abundances. Consequently Ba stars are an ideal laboratory to test AGB s-process models.
Models at metallicity [Fe/H] 0.7 are crucial to compare to the observations because within the current scenario of the neutron source we expect the maximum production of the second peak s-process elements at this metallicity. This is because this neutron source is primary, meaning that the number of free neutrons increases with decreasing Z. For higher metallicities the first peak is produced and for lower metallicities the third peak at lead is produced (see e.g., Gallino et al., 1998; Busso et al., 2001). With the models presented here, together with the earlier published yields at different metallicities (Karakas & Lugaro, 2016 and Fishlock et al., 2014b) we are now able to cover the whole range of the observed metallicities for Ba stars. Work is in progress (Cseh et al., in prep.) on a detailed comparison to the largest self-consistent sample of high resolution spectroscopic observations of Ba stars (de Castro et al., 2016) as well as to the set of AGB predictions from the FRUITY database (see Cristallo et al., 2009, 2011; Piersanti et al., 2013; Cristallo et al., 2015).
6.2 AGB stars
Optical spectroscopic surveys of visually bright AGB stars in the Small Magellanic Cloud show a lack of high luminosity (brighter than Mbol6) C-rich AGB stars (Smith & Lambert, 1989, 1990; Plez et al., 1993; Smith et al., 1995). The more luminous SMC-AGB stars (7 Mbol 6) are O-rich and display s-process overabundances (as suggested by the strong ZrO and La II spectral features present in their optical spectra); 80% of them are Lithium-rich with log(Li)1.03.5 (e.g., Smith et al., 1995). Their Li and s-process enrichments confirm that these stars are experiencing HBB and third dredge-up; i.e., HBB-AGB stars. In a sample of five HBB-AGB stars in the SMC, Smith & Lambert (1989) used plane-parallel model atmospheres and found average values of [Y/Fe]=0.760.30 and [Zr/Fe]=0.590.24, which are similar to those found in higher metallicity Galactic S-type AGB stars. A more detailed/reliable chemical abundance analysis (using spherical model atmospheres more appropriate for giant stars and extending the spectral coverage to the near-IR) of seven SMC HBB-AGB stars was carried out by Plez et al. (1993). They found an average metallicity of [z/H]=0.520.13 and their study included for the first time other s-process elements like Rb and Nd as well as the 12C/13C ratio. The Li-rich HBB-AGB stars in the SMC are C-poor ([12C/H]-, but quite uncertain) and display very low C isotopic ratios (12C/13C=6.51.9), as expected from HBB models. However, these stars are not enriched in Rb ([Rb/z]) but rich in other s-process elements such as Zr ([Zr/z]=0.120.25) and Nd ([Nd/z]=0.700.21). The unexpectedly low Rb abundances coupled with the Zr and Nd enhancements, led these authors to suggest that these low-metallicity HBB-AGB stars produce s-process elements at low neutron density via the 13C neutron source (see also Abia et al., 2001).
In strong contrast with the visually bright SMC HBB-AGB stars, higher metallicity Li-rich HBB-AGB (OH/IR) stars in our Galaxy are more obscured by dust, Rb-rich and Zr-poor, and show very high [Rb/Zr] ratios more typical of high neutron density and the 22Ne neutron source (García-Hernández et al., 2006; García-Hernández et al., 2007). García-Hernández et al. (2009) carried out a high-resolution optical spectroscopic survey of the most obscured (and luminous) O-rich stars (including most of the known OH/IR stars) in the Magellanic Clouds (MC) and uncovered the low-metallicity Rb-rich AGB counterparts (both in the LMC and SMC); because of HBB flux excess, the MC Rb-rich AGB stars are even brighter than Mbol7. García-Hernández et al. (2009) suggest that they might have progenitor masses of at least , while the visually bright Rb-poor HBB-AGB stars should have lower masses (say ).
The large uncertainty affecting the Rb abundance and the possibility of non-LTE effects means a direct comparison with model predictions is not straight forward. In addition, the Rb I lines can be strongly affected by circumstellar effects (especially in the obscured Rb-rich AGB stars) and exploratory pseudo-dynamical models show that the derived Rb abundances might be much lower (by 12 dex) when using extended model atmospheres (Zamora et al., 2014; Pérez-Mesa et al., 2017). Thus a quantitative comparison with the model predictions should be restricted to the Li, Zr, and Nd abundances and 12C/13C ratios observed in the visually bright SMC HBB-AGB stars by Plez et al. (1993), while a qualitative comparison may still be applicable to Rb and the most extreme and obscured (OH/IR) Rb-rich stars.
Most of the intermediate-mass AGB models with HBB we have calculated here do not produce a strong -process enrichment at the surface. These models would not be able to match the abundances measured by Plez et al. (1993). The models with a strong enhancement in -process abundances are the 4.5 model with a pocket and the 5 model with Vassiliadis & Wood (1993) mass-loss on the AGB (and to a lesser extent the 7 with VW93 mass-loss). In the Plez et al. (1993) sample the average [Zr/z] , which is lower than the final [Zr/Fe] predicted at the end of the TP-AGB in both the 4.5 and 5 models ([Zr/Fe] ). We are likely observing the real AGB stars some time during their TP-AGB phase, not at the end. Examining the 5 in more detail, at thermal pulse number #55, the [Zr/Fe] , C/O , / , which matches the observations of the Plez stars quite well. The predicted [Nd/Fe] at thermal pulse #55 is much lower than the average of 0.70. Note that the final [Nd/Fe] = 0.1 in the 5 model, which is consistent with expectations from the e source but at odds with the observations. Furthermore, the Li abundance at pulse #55 is much lower than observed (see above), where (Li) , down from the peak value of (Li) = 4.25 at pulse #10.
The high abundance of Nd points to a contribution from the neutron source, so we examine the 4.5 model with a pocket. At the 16th thermal pulse [Zr/Fe] and [Nd/Fe] , which is much more promising compared to observations. However, the C/O ratio at this stage although / , which indicates that HBB is just getting going. By the 20th thermal pulse, C/O ratio has dropped to , while the -process elements are still increasing, to [Zr/Fe] = 0.33 and [Nd/Fe] = 0.61, respectively. We also note that the model star is enhanced in Li at this stage, with (Li) = 3.2, which is in better agreement with the observations mentioned above.
We conclude that -process rich, intermediate-mass stars observed by Plez et al. (1993) are of lower mass than suggested in the paper, and are closer to 4.5 than 5 or 7, and show evidence of the neutron source (see also García-Hernández et al., 2006; García-Hernández et al., 2009). While we are unable to make a definitive conclusion as to the best AGB mass-loss rate the predictions for Li and the -process elements point toward the Blöcker (1995) mass-loss rate. Indeed, the best fit model uses the Blöcker (1995) mass-loss rate, although the models with Vassiliadis & Wood (1993) result in stronger overabundances of -process elements for models with HBB.
6.3 Post-AGB stars
We now focus on objects that have evolved beyond the AGB and limit our discussion to post-AGB stars, the progeny of AGB stars. While there are many studies of planetary nebulae in the SMC, the observations are generally limited to elements lighter than iron and we refer to studies by Ventura et al. (2016a) and García-Rojas et al. (2018).
During the post-AGB phase, the warm stellar photosphere makes it possible to quantify photospheric abundances for a very wide range of elements from CNO up to some of the heaviest -process elements well beyond the Ba peak (van Winckel, 2003; Reyniers & Van Winckel, 2003) that are brought to the stellar surface during the AGB phase. This is not possible with AGB stars since molecular veiling dominates their spectra (Abia et al., 2008). Therefore post-AGB objects and in particular the single stars, can provide direct and stringent constraints on the parameters governing stellar evolution and nucleosynthesis, especially during the chemically-rich AGB phase.
The well constrained distances to the post-AGB stars in the LMC and SMC offer unprecedented tests for AGB theoretical structure and enrichment models of single low- and intermediate-mass stars. However, owing to their short lifetime these objects are rare. So far, the photospheric chemistry of only a few single post-AGB stars in the LMC and SMC have been studied in detail (De Smedt et al., 2012; van Aarle et al., 2013; De Smedt et al., 2015; Kamath et al., 2017). The study by De Smedt et al. (2012) revealed the most -process enriched post-AGB star, J004441.04-732136.4, in the SMC. This object is a single, luminous (L/ 7000) post-AGB object with a low metallicity ([Fe/H] = 1.340.32) compared to the mean metallicity of the young stars in the SMC. The estimated photospheric C/O ratio (C/O = 1.9 0.7) indicates that it is a C-rich source while the high -process overabundances (e.g., [Y/Fe] = 2.15, [La/Fe] = 2.84) show that this star is extremely -process enriched. Furthermore, J004441.04-732136.4 also shows the presence of the 21 micron feature in its mid-infrared (mid-IR) spectra (Volk et al., 2011). The luminosity and chemistry of J004441.04-732136.4 point toward a star of initial mass that is self-enriched in carbon and -process elements.
The most unusual features of J004441.04-732136.4 from a nucleosynthesis point of view is its Pb abundance and C/O ratio. Though the theoretical stellar models presented in De Smedt et al. (2012) predict an -process distribution very similar to the observed one, the predicted Pb abundance is significantly higher than the observed Pb upper limit. Furthermore, while the predicted C overabundance is compatible with the observations, the predicted O abundance is significantly lower resulting in a predicted C/O ratio of 18 20, which is clearly too high. This indicates that the star obtained large enrichments of heavy elements, while keeping a low C/O ratio. No isotopic abundances could be estimated, but the models predicted a very high 12C/13C ratio ( 1800), which is not yet constrained by observations.
Other post-AGB stars in the LMC have also been found to have low-Pb abundances, relative to AGB model predictions (van Aarle et al., 2013; De Smedt et al., 2014; De Smedt et al., 2015). A systematic study of 14 post-AGB stars in the Galaxy (De Smedt et al., 2016) combined with the results for the MC objects find that the Pb discrepancy seems to occur in stars with [Fe/H] but is not present in more metal-rich post-AGB stars with [Fe/H] . This cut-off is the metallicity of the current models. From Fig. 9 and Table 2 we can see that the high [Pb/Fe] abundances predicted for the low-mass AGB stars is consistent with standard calculations of the -process (Busso et al., 2001; Cristallo et al., 2015) of a metallicity around [Fe/H] . If we take the 1.25 model as an example, the final C/O = 2.33, [Ba/Fe] = 1.1, and [Pb/Fe] = 1.9 when is adopted. It is clear that our models produce high [Pb/Ba] in contrast to the observations of J004441.04-732136.4 and the other low-metallicity post-AGB stars.
The cause of the low-Pb abundance in these post-AGB stars has not been identified but stellar rotation and/or a non-standard neutron-capture nucleosynthesis have been invoked (Lugaro et al., 2015). The high O abundance of J004441 is also a mystery and suggests a high O intershell abundance of by mass, consistent with models by Pignatari et al. (2016) which include convective-boundary mixing at the base of the He-flash driven convective pocket (see also Herwig, 2000).
Another single post-AGB star in the SMC is J005252.87-722842.92, which was revealed by Kamath et al. (2017) to be chemically peculiar. Their detailed chemical abundance analysis revealed that J005252 shows an intriguing photospheric composition with no confirmed carbon-enhancement (upper limit of [C/Fe] 0.50) nor any traces of -process elements. They derived an oxygen abundance of [O/Fe] = 0.29 0.1. An upper limit for the nitrogen abundance could not be determined since there were no useful nitrogen lines within their existing spectral coverage. The derived stellar parameters (i.e., luminosity, metallicity) of J005252.87-722842.92 indicate it is a single post-AGB star with a luminosity of and metallicity [Fe/H] = . The progenitor would have been a star of , which should become carbon and -process rich according to standard stellar evolutionary models such as those presented here (see also models by Fishlock et al., 2014b; Ventura et al., 2015; Cristallo et al., 2015). However, the observations are in contrast with these predictions. Kamath et al. (2017) concluded that J005252-722842.9 very likely reveals a new stellar evolutionary channel whereby a star evolves without any of the chemical enrichments associated with third dredge-up episodes.
The above studies show that single post-AGB stars are chemically diverse and a few significant discrepancies exist between the observed and predicted abundances, especially in the case of Pb, and possibly the 12C/13C ratio. To fully understand the observed chemical diversity of post-AGB stars and its implications on AGB evolution and nucleosynthesis, detailed abundance studies of a larger population of post-AGB stars with well constrained distances that cover a spread in luminosities and metallicity is needed.
6.4 Globular cluster abundances
Star-to-star abundance variations of the light elements Li, C, N, O, Na, Mg and Al have been observed in every well studied globular cluster (GC) and indeed the anti-correlation between O and Na is considered a definitive signature that differentiates globular clusters from open clusters and field stars (Carretta, 2006; Carretta et al., 2009). The origin of the light element anti-correlations is not known but various hypotheses have been proposed including pollution from rapidly rotating massive stars (Decressin et al., 2007), intermediate-mass AGB stars (e.g., Ventura & D’Antona, 2009), massive binary stars (de Mink et al., 2009), and supermassive stars (Denissenkov & Hartwick, 2014). Yields from these sources have been used in various chemical evolution and dynamical models in order to test these hypotheses, with various levels of success (Fenner et al., 2004; D’Ercole et al., 2008, 2010, 2012; Bekki et al., 2017). See also Bastian & Lardo (2018) for a recent review of formation scenarios.
One of the most discussed hypotheses is that a generation of low-metallicity intermediate-mass AGB stars polluted the clusters when they were forming, which can qualitatively explain the signature of hot hydrogen burning that has been observed (see e.g. Ventura et al., 2016b). Coupled with the fact that AGB stars have slow winds that can be retained by the clusters and the ejecta does not lead to variations of the iron-peak elements is also in their favour. Detailed AGB models have either failed (Herwig, 2004; Karakas et al., 2006) or have had success in matching the some of the abundance trends observed in GCs but generally not all (D’Orazi et al., 2013; Ventura et al., 2014, 2016b; Dell’Agli et al., 2018). AGB models provide such a variety of results, successful or not, because the nucleosynthesis is very much dependent on the efficiency of convection in AGB envelopes and on the AGB mass-loss rate (Ventura & D’Antona, 2005a, b; Karakas & Lattanzio, 2014; D’Antona et al., 2016).
Here we discuss the impact of the AGB mass-loss rate on the predictions for O and Na for models of metallicity [Fe/H] . We limit our discussion to models because these stars experience hot bottom burning and have short lifetimes ( Myr) such that they could pollute a forming globular cluster.
Figs 9 and 11 show that the final surface composition of the 5 and 7 models are C and N rich, however the ejecta of the 7 is overall carbon-poor (for both the VW93 and B95 models). The ejecta of the 5 models are C-rich. If we examine the full mass range, models between 5.5 and 7 result in C-poor and N-rich ejecta, consistent with the observed C-N anti-correlation observed in GCs.
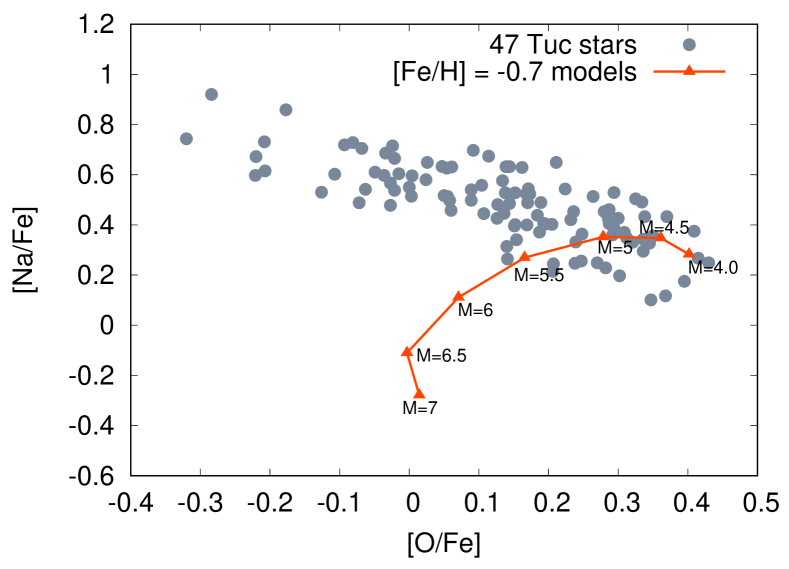
In Fig. 12 we show average [O/Fe] versus [Na/Fe] in the ejecta of the intermediate-mass models. We also compare our results to data from Carretta et al. (2009) for 47 Tucanae, which has the same mean metallicity of [Fe/H] as our models. While the data span a similar range in O abundance as the 47 Tuc stars the predicted trend between O and Na does not match the observations. This arises because in the most massive models, both O and Na are depleted together, a problem discussed previously by Ventura & D’Antona (2008).
We compare our theoretical predictions to the models by Ventura et al. (2016a), who present models spanning a similar range in initial mass with a similar metallicity (). The models by Ventura et al. (2016a) have the same mass-loss as the models shown in Fig. 12 but more efficient convection owing to the Full Spectrum of Turbulence model to describe convection in stellar interiors (c.f. we use the Mixing Length Theory with ).
We compare the range of O surface abundance predictions from our models compared to the models of Ventura et al. (2016a). Using Fig. 1 from Ventura et al. (2016a), we see that their 6 model ranges from O/H = 8 to 7, spanning an order of magnitude whereas in comparison our model of the same mass varies from O/H = 8 to 7.7. The 4.5 model from Ventura et al. also shows evidence of HBB, with a significant decline in O with a final O/H = 7.4. Our 4.5 in contrast shows no decline in O (see Fig. 12) owing to efficient TDU and less efficient HBB at this mass.
In our models we have employed the e(p,)a reaction rate from Iliadis et al. (2010), however, recent experimental data from the Laboratory for Underground Nuclear Astrophysics have provided a re-evaluation of this rate up to 20 times higher (Cavanna et al., 2015). A full discussion on its impact on AGB models in relation to GC observations can be found in Slemer et al. (2017).
6.5 Mg isotopes
Magnesium isotopic observations are important because they can trace stellar and galactic evolution on timescales ranging from the very short to the long timescales involved with AGB stars. That is because the dominant isotope, g, is predominantly produced in short-lived core collapse supernova explosions while the neutron-rich isotopes g and g are produced in massive stars and in intermediate-mass AGB stars (e.g., Karakas & Lattanzio, 2003a).
From the point of view of galaxy archeology theoretical yields are important to galactic chemical evolution models, which when compared to observations can set characteristics of our galaxy. Several studies have investigated magnesium isotopic abundances in order to shed light on stellar and galactic chemical evolution (Barbuy, 1985, 1987; Barbuy et al., 1987; Yong et al., 2003a; Yong et al., 2003b; Yong et al., 2004; Gay & Lambert, 2000; Meléndez & Cohen, 2007).
It is possible to find in the literature observations of stars with metallicities similar to [Fe/H] , such as Yong et al. (2006), Meléndez & Cohen (2009) and Thygesen et al. (2016), for the M71 and 47 Tucanae globular clusters. The study of Meléndez & Cohen (2009) of nine giant M71 stars shows two different populations, CN-weak (pristine) giants with low magnesium isotopic ratios (g/Mg ) and CN-rich (polluted) giants with higher magnesium isotopic ratios (g/Mg ) suggest that a second generation of stars was polluted by a generation of intermediate-mass AGB stars. The recent analysis of Mg isotopes in 13 RGB stars by Thygesen et al. (2016) examine the pollution mechanisms in order to explain the multiple population phenomenon present in the 47 Tuc. However, in contrast with the study of Meléndez & Cohen (2009), Thygesen et al. (2016) do not find evidence of different magnesium isotopic ratios for the pristine population in comparison with the polluted one. If we consider AGB stars as the main source of heavy Mg isotopes, the yields are therefore crucial in order to understand the multiple population scenario (e.g., see also discussion in §6.4).
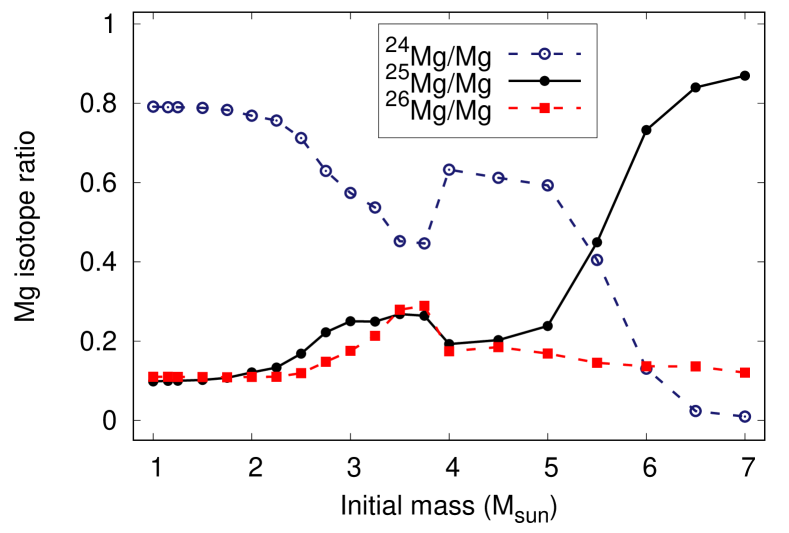
In Fig. 13 we show the Mg isotopic ratios relative to the total Mg content at the surface as a function of stellar mass for all of the models. This figure illustrates that low-mass AGB stars below do not result in observable variations to the Mg isotope ratios from solar. In contrast, models with third dredge-up and neutron-capture nucleosynthesis (but not HBB) range from 2-4 and show significant variations. Here the neutron-rich Mg isotopes are produced by g(n,)g(n,)g. Models between 4-5 experience mild HBB but do not dredge-up as much material from the He-shell as models, hence their neutron-rich Mg isotopic ratios are above solar but not significantly so. The most dramatic changes are for the intermediate-mass AGB models above 5 as a result of strong HBB. Here the variations are caused by proton-captures involving the Mg-Al chain reactions, including a strong depletion of g (see also Izzard et al., 2007). Our predictions show strong enhancements in g and little variation to g, in contrast observations which show enhancements of g and no variation to g (e.g., Yong et al., 2003a).
7 Conclusions
In this study we present new theoretical models of low and intermediate-mass stars between 1 to 7 with a metallicity or [Fe/H] . We present new evolutionary sequences, surface abundances (both elemental and isotopic), and stellar yields for all stable elements between C and Bi.
The stellar models have been calculated with updated input physics compared to the models in Karakas (2010), which are widely used in studies of Galactic chemical evolution (e.g., Romano et al., 2010; Kobayashi et al., 2011). For the AGB mass-loss rate, we continue to use the Vassiliadis & Wood (1993) mass-loss rate for low-mass AGB stars that do not experience HBB, although for intermediate-mass stars we perform evolutionary calculations with both Vassiliadis & Wood (1993) and the Blöcker (1995) mass-loss rate, and adopt the latter for post-processing nucleosynthesis calculations. We calculate nucleosynthesis models for three intermediate-masses () using both mass-loss prescriptions. We find that the mass-loss rate does not play a strong role in the final surface abundances and yields for stars but can have a dramatic effect on stars around 5.
We discuss some of the relevant observations that the new predictions can be compared with including AGB and post-AGB stars in the Small Magellanic Clouds, barium stars, and globular clusters. In particular, we discuss our models against the observations by Plez et al. (1993) and conclude that those stars are of lower mass than originally thought (closer to 4.5 than 5 or 7) and the stars show evidence of both the and e neutron source in their surface compositions. While we are hesitant to make a definitive conclusion it does seem that the Blöcker (1995) mass-loss rate produces AGB models that better match the bright O-rich stars in the Plez et al. (1993) sample.
Finally the new yields will also be useful for studies of specific populations of meteoritic stardust grains that originated in AGB stars (see Appendix A) and of Galactic chemical evolution, providing a missing link between the yields of solar metallicity presented in Karakas & Lugaro (2016) and the lower metallicity yields presented by Fishlock et al. (2014b) and Shingles et al. (2015).
Acknowledgements
The authors thank the referee for providing comments that have helped improve the discussion in the paper. AIK acknowledges financial support from the Australian Research Council (DP170100521 and FT110100475), and thanks Kenji Bekki for interesting discussions about globular clusters. ML is a Momentum (“Lendület-2014” Programme) project leader of the Hungarian Academy of Sciences. This research was supported in part by the National Science Foundation under Grant No. PHY-1430152 (JINA Center for the Evolution of the Elements). MC would like to acknowledge support from the Capes/PDSE Grant (88881.135113/2016-01). BC was supported by a STSM Grant from COST Action CA16117. DAGH acknowledges support provided by the Spanish Ministry of Economy and Competitiveness (MINECO) under grants AYA–2014–58082–P and AYA–2017–88254–P.
References
- Abia et al. (2001) Abia C., Busso M., Gallino R., Domínguez I., Straniero O., Isern J., 2001, ApJ, 559, 1117
- Abia et al. (2002) Abia C., et al., 2002, ApJ, 579, 817
- Abia et al. (2008) Abia C., de Laverny P., Wahlin R., 2008, A&A, 481, 161
- Amari et al. (2001) Amari S., Nittler L. R., Zinner E., Gallino R., Lugaro M., Lewis R. S., 2001, ApJ, 546, 248
- Amari et al. (2012) Amari S., Zinner E., Gallino R., 2012, in Kubono S., Hayakawa T., Kajino T., Miyatake H., Motobayashi T., Nomoto K., eds, AIP Conference Proceedings Vol. 1484, Origin of Matter and Evolution of Galaxies 2011. pp 57–62
- Asplund et al. (2009) Asplund M., Grevesse N., Sauval A. J., Scott P., 2009, ARA&A, 47, 481
- Barbuy (1985) Barbuy B., 1985, A&A, 151, 189
- Barbuy (1987) Barbuy B., 1987, A&A, 172, 251
- Barbuy et al. (1987) Barbuy B., Spite F., Spite M., 1987, A&A, 178, 199
- Bastian & Lardo (2018) Bastian N., Lardo C., 2018, ARAA, in press
- Bekki et al. (2017) Bekki K., Jeřábková T., Kroupa P., 2017, MNRAS, 471, 2242
- Bernard-Salas et al. (2008) Bernard-Salas J., Pottasch S. R., Gutenkunst S., Morris P. W., Houck J. R., 2008, ApJ, 672, 274
- Bidelman & Keenan (1951) Bidelman W. P., Keenan P. C., 1951, ApJ, 114, 473
- Blöcker (1995) Blöcker T., 1995, A&A, 297, 727
- Buntain et al. (2017) Buntain J. F., Doherty C. L., Lugaro M., Lattanzio J. C., Stancliffe R. J., Karakas A. I., 2017, MNRAS, 471, 824
- Busso et al. (1999) Busso M., Gallino R., Wasserburg G. J., 1999, ARA&A, 37, 239
- Busso et al. (2001) Busso M., Gallino R., Lambert D. L., Travaglio C., Smith V. V., 2001, ApJ, 557, 802
- Cantiello et al. (2014) Cantiello M., Mankovich C., Bildsten L., Christensen-Dalsgaard J., Paxton B., 2014, ApJ, 788, 93
- Carretta (2006) Carretta E., 2006, AJ, 131, 1766
- Carretta et al. (2009) Carretta E., et al., 2009, A&A, 505, 117
- Cavanna et al. (2015) Cavanna F., et al., 2015, Physical Review Letters, 115, 252501
- Cole et al. (2005) Cole A. A., Tolstoy E., Gallagher III J. S., Smecker-Hane T. A., 2005, AJ, 129, 1465
- Constantino et al. (2014) Constantino T., Campbell S., Gil-Pons P., Lattanzio J., 2014, ApJ, 784, 56
- Cristallo et al. (2009) Cristallo S., Straniero O., Gallino R., Piersanti L., Domínguez I., Lederer M. T., 2009, ApJ, 696, 797
- Cristallo et al. (2011) Cristallo S., et al., 2011, ApJS, 197, 17
- Cristallo et al. (2015) Cristallo S., Straniero O., Piersanti L., Gobrecht D., 2015, ApJS, 219, 40
- D’Antona et al. (2016) D’Antona F., Vesperini E., D’Ercole A., Ventura P., Milone A. P., Marino A. F., Tailo M., 2016, MNRAS, 458, 2122
- D’Ercole et al. (2008) D’Ercole A., Vesperini E., D’Antona F., McMillan S. L. W., Recchi S., 2008, MNRAS, 391, 825
- D’Ercole et al. (2010) D’Ercole A., D’Antona F., Ventura P., Vesperini E., McMillan S. L. W., 2010, MNRAS, 407, 854
- D’Ercole et al. (2012) D’Ercole A., D’Antona F., Carini R., Vesperini E., Ventura P., 2012, MNRAS, 423, 1521
- D’Orazi et al. (2013) D’Orazi V., Campbell S. W., Lugaro M., Lattanzio J. C., Pignatari M., Carretta E., 2013, MNRAS, 433, 366
- De Smedt et al. (2012) De Smedt K., Van Winckel H., Karakas A. I., Siess L., Goriely S., Wood P. R., 2012, A&A, 541, A67
- De Smedt et al. (2014) De Smedt K., Van Winckel H., Kamath D., Karakas A. I., Siess L., Goriely S., Wood P., 2014, A&A, 563, L5
- De Smedt et al. (2015) De Smedt K., Van Winckel H., Kamath D., Wood P. R., 2015, A&A, 583, A56
- De Smedt et al. (2016) De Smedt K., Van Winckel H., Kamath D., Siess L., Goriely S., Karakas A. I., Manick R., 2016, A&A, 587, A6
- Decressin et al. (2007) Decressin T., Charbonnel C., Meynet G., 2007, A&A, 475, 859
- Decressin et al. (2009) Decressin T., Charbonnel C., Siess L., Palacios A., Meynet G., Georgy C., 2009, A&A, 505, 727
- Dell’Agli et al. (2018) Dell’Agli F., et al., 2018, MNRAS, 475, 3098
- Denissenkov & Hartwick (2014) Denissenkov P. A., Hartwick F. D. A., 2014, MNRAS, 437, L21
- Denissenkov & Tout (2003) Denissenkov P. A., Tout C. A., 2003, MNRAS, 340, 722
- Doherty et al. (2014) Doherty C. L., Gil-Pons P., Lau H. H. B., Lattanzio J. C., Siess L., Campbell S. W., 2014, MNRAS, 441, 582
- Dopita et al. (1997) Dopita M. A., et al., 1997, ApJ, 474, 188
- Evans et al. (2011) Evans C. J., et al., 2011, A&A, 530, A108
- Fenner et al. (2004) Fenner Y., Campbell S., Karakas A. I., Lattanzio J. C., Gibson B. K., 2004, MNRAS, 353, 789
- Fishlock et al. (2014a) Fishlock C. K., Karakas A. I., Stancliffe R. J., 2014a, MNRAS, 438, 1741
- Fishlock et al. (2014b) Fishlock C. K., Karakas A. I., Lugaro M., Yong D., 2014b, ApJ, 797, 44
- Frogel et al. (1990) Frogel J. A., Mould J., Blanco V. M., 1990, ApJ, 352, 96
- Gallino et al. (1998) Gallino R., Arlandini C., Busso M., Lugaro M., Travaglio C., Straniero O., Chieffi A., Limongi M., 1998, ApJ, 497, 388
- García-Hernández et al. (2006) García-Hernández D. A., García-Lario P., Plez B., D’Antona F., Manchado A., Trigo-Rodríguez J. M., 2006, Science, 314, 1751
- García-Hernández et al. (2007) García-Hernández D. A., García-Lario P., Plez B., Manchado A., D’Antona F., Lub J., Habing H., 2007, A&A, 462, 711
- García-Hernández et al. (2009) García-Hernández D. A., et al., 2009, ApJ, 705, L31
- García-Hernández et al. (2013) García-Hernández D. A., Zamora O., Yagüe A., Uttenthaler S., Karakas A. I., Lugaro M., Ventura P., Lambert D. L., 2013, A&A, 555, L3
- García-Rojas et al. (2018) García-Rojas J., Delgado-Inglada G., García-Hernández D. A., Dell’Agli F., Lugaro M., Karakas A. I., Rodríguez M., 2018, MNRAS, 473, 4476
- Gay & Lambert (2000) Gay P. L., Lambert D. L., 2000, ApJ, 533, 260
- Gordon et al. (2011) Gordon K. D., et al., 2011, AJ, 142, 102
- Goriely & Siess (2004) Goriely S., Siess L., 2004, A&A, 421, L25
- Goriely & Siess (2018) Goriely S., Siess L., 2018, A&A, 609, A29
- Groenewegen et al. (2009) Groenewegen M. A. T., Sloan G. C., Soszyński I., Petersen E. A., 2009, A&A, 506, 1277
- Gullieuszik et al. (2012) Gullieuszik M., et al., 2012, A&A, 537, A105
- Habing & Olofsson (2004) Habing H. J., Olofsson H., 2004, Asymptotic Giant Branch Stars. Springer
- Herwig (2000) Herwig F., 2000, A&A, 360, 952
- Herwig (2004) Herwig F., 2004, ApJS, 155, 651
- Herwig (2005) Herwig F., 2005, ARA&A, 43, 435
- Herwig et al. (2003) Herwig F., Langer N., Lugaro M., 2003, ApJ, 593, 1056
- Hoppe & Ott (1997) Hoppe P., Ott U., 1997, in Bernatowicz T. J., Zinner E., eds, American Institute of Physics Conference Series Vol. 402, American Institute of Physics Conference Series. pp 27–58, doi:10.1063/1.53314
- Hoppe et al. (1997) Hoppe P., Annen P., Strebel R., Eberhardt P., Gallino R., Lugaro M., Amari S., Lewis R. S., 1997, ApJ, 487, L101
- Idiart et al. (2007) Idiart T. P., Maciel W. J., Costa R. D. D., 2007, A&A, 472, 101
- Iliadis et al. (2010) Iliadis C., Longland R., Champagne A. E., Coc A., Fitzgerald R., 2010, Nuclear Physics A, 841, 31
- Izzard et al. (2007) Izzard R. G., Lugaro M., Karakas A. I., Iliadis C., van Raai M., 2007, A&A, 466, 641
- Kalirai et al. (2014) Kalirai J. S., Marigo P., Tremblay P.-E., 2014, ApJ, 782, 17
- Kamath et al. (2010) Kamath D., Wood P. R., Soszyński I., Lebzelter T., 2010, MNRAS, 408, 522
- Kamath et al. (2012) Kamath D., Karakas A. I., Wood P. R., 2012, ApJ, 746, 20
- Kamath et al. (2014) Kamath D., Wood P. R., Van Winckel H., 2014, MNRAS, 439, 2211
- Kamath et al. (2015) Kamath D., Wood P. R., Van Winckel H., 2015, MNRAS, 454, 1468
- Kamath et al. (2017) Kamath D., Van Winckel H., Wood P. R., Asplund M., Karakas A. I., Lattanzio J. C., 2017, ApJ, 836, 15
- Karakas (2010) Karakas A. I., 2010, MNRAS, 403, 1413
- Karakas (2014) Karakas A. I., 2014, MNRAS, 445, 347
- Karakas & Lattanzio (2003a) Karakas A. I., Lattanzio J. C., 2003a, PASA, 20, 279
- Karakas & Lattanzio (2003b) Karakas A. I., Lattanzio J. C., 2003b, PASA, 20, 393
- Karakas & Lattanzio (2007) Karakas A. I., Lattanzio J. C., 2007, PASA, 24, 103
- Karakas & Lattanzio (2014) Karakas A. I., Lattanzio J. C., 2014, PASA, 31, 30
- Karakas & Lugaro (2016) Karakas A. I., Lugaro M., 2016, ApJ, 825, 26
- Karakas et al. (2002) Karakas A. I., Lattanzio J. C., Pols O. R., 2002, PASA, 19, 515
- Karakas et al. (2006) Karakas A. I., Lugaro M., Wiescher M., Goerres J., Ugalde C., 2006, ApJ, 643, 471
- Karakas et al. (2007) Karakas A. I., Lugaro M., Gallino R., 2007, ApJ, 656, L73
- Karakas et al. (2012) Karakas A. I., García-Hernández D. A., Lugaro M., 2012, ApJ, 751, 8
- Kobayashi et al. (2011) Kobayashi C., Karakas A. I., Umeda H., 2011, MNRAS, 414, 3231
- Kraemer et al. (2017) Kraemer K. E., Sloan G. C., Wood P. R., Jones O. C., Egan M. P., 2017, ApJ, 834, 185
- Lebzelter & Wood (2007) Lebzelter T., Wood P. R., 2007, A&A, 475, 643
- Lebzelter et al. (2008) Lebzelter T., Lederer M. T., Cristallo S., Hinkle K. H., Straniero O., Aringer B., 2008, A&A, 486, 511
- Lederer et al. (2009) Lederer M. T., Lebzelter T., Cristallo S., Straniero O., Hinkle K. H., Aringer B., 2009, A&A, 502, 913
- Leisy & Dennefeld (2006) Leisy P., Dennefeld M., 2006, A&A, 456, 451
- Lewis et al. (2013) Lewis K. M., Lugaro M., Gibson B. K., Pilkington K., 2013, ApJ, 768, L19
- Lugaro et al. (2003) Lugaro M., Davis A. M., Gallino R., Pellin M. J., Straniero O., Käppeler F., 2003, ApJ, 593, 486
- Lugaro et al. (2012) Lugaro M., Karakas A. I., Stancliffe R. J., Rijs C., 2012, ApJ, 747, 2
- Lugaro et al. (2015) Lugaro M., Campbell S. W., Van Winckel H., De Smedt K., Karakas A. I., Käppeler F., 2015, A&A, 583, A77
- Lugaro et al. (2017) Lugaro M., et al., 2017, Nature Astronomy, 1, 0027
- Maceroni et al. (2002) Maceroni C., Testa V., Plez B., García Lario P., D’Antona F., 2002, A&A, 395, 179
- Mackey et al. (2008) Mackey A. D., Broby Nielsen P., Ferguson A. M. N., Richardson J. C., 2008, ApJ, 681, L17
- Marigo & Aringer (2009) Marigo P., Aringer B., 2009, A&A, 508, 1539
- Marigo et al. (1999) Marigo P., Girardi L., Bressan A., 1999, A&A, 344, 123
- Marigo et al. (2003) Marigo P., Bernard-Salas J., Pottasch S. R., Tielens A. G. G. M., Wesselius P. R., 2003, A&A, 409, 619
- Marigo et al. (2013) Marigo P., Bressan A., Nanni A., Girardi L., Pumo M. L., 2013, MNRAS, 434, 488
- Marigo et al. (2017) Marigo P., et al., 2017, ApJ, 835, 77
- Mazzitelli et al. (1999) Mazzitelli I., D’Antona F., Ventura P., 1999, A&A, 348, 846
- McClure (1983) McClure R. D., 1983, ApJ, 268, 264
- McClure (1984) McClure R. D., 1984, Publ. Astron. Soc. Pac., 96, 117
- McClure et al. (1980) McClure R. D., Fletcher J. M., Nemec J. M., 1980, ApJ, 238, L35
- McSaveney et al. (2007) McSaveney J. A., Wood P. R., Scholz M., Lattanzio J. C., Hinkle K. H., 2007, MNRAS, in press
- Melbourne & Boyer (2013) Melbourne J., Boyer M. L., 2013, ApJ, 764, 30
- Meléndez & Cohen (2007) Meléndez J., Cohen J. G., 2007, ApJ, 659, L25
- Meléndez & Cohen (2009) Meléndez J., Cohen J. G., 2009, ApJ, 699, 2017
- Milone et al. (2009) Milone A. P., Bedin L. R., Piotto G., Anderson J., 2009, A&A, 497, 755
- Milone et al. (2016) Milone A. P., Marino A. F., D’Antona F., Bedin L. R., Da Costa G. S., Jerjen H., Mackey A. D., 2016, MNRAS, 458, 4368
- Mucciarelli (2014) Mucciarelli A., 2014, Astronomische Nachrichten, 335, 79
- Mucciarelli et al. (2006) Mucciarelli A., Origlia L., Ferraro F. R., Maraston C., Testa V., 2006, ApJ, 646, 939
- Mucciarelli et al. (2008) Mucciarelli A., Carretta E., Origlia L., Ferraro F. R., 2008, AJ, 136, 375
- Nittler et al. (1997) Nittler L. R., Alexander C. M. O., Gao X., Walker R. M., Zinner E., 1997, ApJ, 483, 475
- Palmerini et al. (2011) Palmerini S., La Cognata M., Cristallo S., Busso M., 2011, ApJ, 729, 3
- Parisi et al. (2016) Parisi M. C., Geisler D., Carraro G., Clariá J. J., Villanova S., Gramajo L. V., Sarajedini A., Grocholski A. J., 2016, AJ, 152, 58
- Pérez-Mesa et al. (2017) Pérez-Mesa V., Zamora O., García-Hernández D. A., Plez B., Manchado A., Karakas A. I., Lugaro M., 2017, A&A, 606, A20
- Piersanti et al. (2013) Piersanti L., Cristallo S., Straniero O., 2013, ApJ, 774, 98
- Pignatari et al. (2016) Pignatari M., et al., 2016, ApJS, 225, 24
- Plez et al. (1993) Plez B., Smith V. V., Lambert D. L., 1993, ApJ, 418, 812
- Reddy et al. (2006) Reddy B. E., Lambert D. L., Allende Prieto C., 2006, MNRAS, 367, 1329
- Reyniers & Van Winckel (2003) Reyniers M., Van Winckel H., 2003, A&A, 408, L33
- Reyniers et al. (2007) Reyniers M., Abia C., van Winckel H., Lloyd Evans T., Decin L., Eriksson K., Pollard K. R., 2007, A&A, 461, 641
- Romano et al. (2010) Romano D., Karakas A. I., Tosi M., Matteucci F., 2010, A&A, 522, A32
- Russell & Dopita (1992) Russell S. C., Dopita M. A., 1992, ApJ, 384, 508
- Shaw et al. (2010) Shaw R. A., et al., 2010, ApJ, 717, 562
- Shingles et al. (2015) Shingles L. J., Doherty C. L., Karakas A. I., Stancliffe R. J., Lattanzio J. C., Lugaro M., 2015, MNRAS, 452, 2804
- Siess et al. (2004) Siess L., Goriely S., Langer N., 2004, A&A, 415, 1089
- Slemer et al. (2017) Slemer A., et al., 2017, MNRAS, 465, 4817
- Sloan et al. (2008) Sloan G. C., Kraemer K. E., Wood P. R., Zijlstra A. A., Bernard-Salas J., Devost D., Houck J. R., 2008, ApJ, 686, 1056
- Smith & Lambert (1989) Smith V. V., Lambert D. L., 1989, ApJ, 345, L75
- Smith & Lambert (1990) Smith V. V., Lambert D. L., 1990, ApJ, 361, L69
- Smith et al. (1995) Smith V. V., Plez B., Lambert D. L., Lubowich D. A., 1995, ApJ, 441, 735
- Stanghellini et al. (2000) Stanghellini L., Shaw R. A., Balick B., Blades J. C., 2000, ApJ, 534, L167
- Stephan et al. (2016) Stephan T., Trappitsch R., Davis A. M., Pellin M. J., Rost D., Savina M. R., Yokochi R., Liu N., 2016, International Journal of Mass Spectrometry, 407, 1
- Thygesen et al. (2016) Thygesen A. O., et al., 2016, A&A, 588, A66
- Trippella et al. (2016) Trippella O., Busso M., Palmerini S., Maiorca E., Nucci M. C., 2016, ApJ, 818, 125
- Vassiliadis & Wood (1993) Vassiliadis E., Wood P. R., 1993, ApJ, 413, 641
- Vassiliadis et al. (1996) Vassiliadis E., et al., 1996, ApJS, 105, 375
- Ventura & D’Antona (2005a) Ventura P., D’Antona F., 2005a, A&A, 431, 279
- Ventura & D’Antona (2005b) Ventura P., D’Antona F., 2005b, A&A, 439, 1075
- Ventura & D’Antona (2008) Ventura P., D’Antona F., 2008, A&A, 479, 805
- Ventura & D’Antona (2009) Ventura P., D’Antona F., 2009, A&A, 499, 835
- Ventura & Marigo (2010) Ventura P., Marigo P., 2010, MNRAS, 408, 2476
- Ventura et al. (2000) Ventura P., D’Antona F., Mazzitelli I., 2000, A&A, 363, 605
- Ventura et al. (2013) Ventura P., Di Criscienzo M., Carini R., D’Antona F., 2013, MNRAS, 431, 3642
- Ventura et al. (2014) Ventura P., Criscienzo M. D., D’Antona F., Vesperini E., Tailo M., Dell’Agli F., D’Ercole A., 2014, MNRAS, 437, 3274
- Ventura et al. (2015) Ventura P., Karakas A. I., Dell’Agli F., Boyer M. L., García-Hernández D. A., Di Criscienzo M., Schneider R., 2015, MNRAS, 450, 3181
- Ventura et al. (2016a) Ventura P., Stanghellini L., Di Criscienzo M., García-Hernández D. A., Dell’Agli F., 2016a, MNRAS, 460, 3940
- Ventura et al. (2016b) Ventura P., et al., 2016b, ApJ, 831, L17
- Volk et al. (2011) Volk K., et al., 2011, ApJ, 735, 127
- Wallner et al. (2016) Wallner A., et al., 2016, Phys. Rev. C, 93, 045803
- Weiss & Ferguson (2009) Weiss A., Ferguson J. W., 2009, A&A, 508, 1343
- Wood et al. (1983) Wood P. R., Bessell M. S., Fox M. W., 1983, ApJ, 272, 99
- Yong et al. (2003a) Yong D., Grundahl F., Lambert D. L., Nissen P. E., Shetrone M. D., 2003a, A&A, 402, 985
- Yong et al. (2003b) Yong D., Lambert D. L., Ivans I. I., 2003b, ApJ, 599, 1357
- Yong et al. (2004) Yong D., Lambert D. L., Allende Prieto C., Paulson D. B., 2004, ApJ, 603, 697
- Yong et al. (2006) Yong D., Aoki W., Lambert D. L., Paulson D. B., 2006, ApJ, 639, 918
- Zamora et al. (2014) Zamora O., García-Hernández D. A., Plez B., Manchado A., 2014, A&A, 564, L4
- Zinner (2014) Zinner E., 2014, in Davis A. M., ed., Microphysics of Cosmic Plasmas. pp 181–213
- Zinner et al. (2006) Zinner E., Nittler L. R., Gallino R., Karakas A. I., Lugaro M., Straniero O., Lattanzio J. C., 2006, ApJ, 650, 350
- de Castro et al. (2016) de Castro D. B., Pereira C. B., Roig F., Jilinski E., Drake N. A., Chavero C., Sales Silva J. V., 2016, MNRAS, 459, 4299
- de Mink et al. (2009) de Mink S. E., Pols O. R., Langer N., Izzard R. G., 2009, A&A, 507, L1
- van Aarle et al. (2013) van Aarle E., Van Winckel H., De Smedt K., Kamath D., Wood P. R., 2013, A&A, 554, A106
- van Loon et al. (1999a) van Loon J. T., Zijlstra A. A., Groenewegen M. A. T., 1999a, A&A, 346, 805
- van Loon et al. (1999b) van Loon J. T., Groenewegen M. A. T., de Koter A., Trams N. R., Waters L. B. F. M., Zijlstra A. A., Whitelock P. A., Loup C., 1999b, A&A, 351, 559
- van Raai et al. (2012) van Raai M. A., Lugaro M., Karakas A. I., García-Hernández D. A., Yong D., 2012, A&A, 540, A44
- van Winckel (2003) van Winckel H., 2003, ARA&A, 41, 391
Appendix A Examples of the on-line only supplementary data tables
In this section we provide examples of the data-files available for download. In Tables 3 and 4 we show an example of the elemental and isotopic surface abundances for the 3.5, model with . In Table 5 we show an example of the stellar yields available for download for the 2, model with .
| # | ||||||
|---|---|---|---|---|---|---|
| # Initial mass = 3.500, Z = 0.0028, Y = 0.250, = 1.00E-03 | ||||||
| # | ||||||
| # Initial abundances | ||||||
| #El | [X/H] | [X/Fe] | [X/O] | |||
| … | ||||||
| # TP Mass Mcore Menv log L | ||||||
| # 103.499160 0.844551 2.654610 4.303790 | ||||||
| #El | [X/H] | [X/Fe] | [X/O] | |||
| p | 1 | 12.000000 | 0.022522 | 0.733065 | 0.732485 | 2.62931E-01 |
| c | 6 | 8.285793 | 0.184207 | 0.526336 | 0.525756 | 1.69944E-03 |
| n | 7 | 7.610781 | 0.259219 | 0.451324 | 0.450744 | 4.18853E-04 |
| o | 8 | 8.024012 | 0.705988 | 0.004555 | 0.000000 | 1.23891E-03 |
| f | 9 | 4.203442 | 0.256558 | 0.453985 | 0.449430 | 2.22374E-07 |
| … | ||||||
| # Elemental abundance ratios: | ||||||
| # He/H = 8.9644E-02, C/O = 1.8271E+00, N/O = 3.86162E-01 | ||||||
| # | |||||
| # Initial mass = 3.500, Z = 0.0028, Y = 0.250, = 1.00E-03 | |||||
| # | |||||
| #Initial isotopic abundance ratios: | |||||
| # c12/c13 | n14/n15 | o16/o17 | o16/o18 | mg24/mg25 | … |
| 8.940E+01 | 4.476E+02 | 2.632E+03 | 4.988E+02 | 7.899E+00 | … |
| # | |||||
| # During TP-AGB | |||||
| # | |||||
| 1.876E+01 | 2.874E+03 | 2.023E+02 | 7.599E+02 | 8.021E+00 … | |
| 1.889E+01 | 2.846E+03 | 2.033E+02 | 7.579E+02 | 8.020E+00 … | |
| 1.993E+01 | 2.845E+03 | 2.034E+02 | 7.577E+02 | 8.020E+00 … | |
| 2.532E+01 | 2.846E+03 | 2.039E+02 | 7.585E+02 | 8.014E+00 … | |
| 3.480E+01 | 2.867E+03 | 2.050E+02 | 7.613E+02 | 7.977E+00 … | |
| … | |||||
| # Initial mass = 2.000, Z = 0.0028, Y = 0.250, = 2.00E-03 | |||||||
|---|---|---|---|---|---|---|---|
| # Final mass = 0.659, Mass expelled = 1.3410 | |||||||
| #El | [X/H] | [X/Fe] | Net M() | Mass() | |||
| p | 1 | 12.000000 | 0.000000 | 0.000000 | 7.06606E-01 | 6.24086E-02 | 9.47559E-01 |
| he | 2 | 11.007096 | 0.077096 | 0.769786 | 2.85232E-01 | 4.70099E-02 | 3.82497E-01 |
| c | 6 | 9.061618 | 0.591618 | 1.284307 | 9.70318E-03 | 1.23319E-02 | 1.30120E-02 |
| n | 7 | 7.602188 | 0.267812 | 0.424878 | 3.92871E-04 | 3.27618E-04 | 5.26840E-04 |
| o | 8 | 8.145969 | 0.584030 | 0.108660 | 1.56957E-03 | 4.78468E-04 | 2.10479E-03 |
| f | 9 | 5.112539 | 0.652539 | 1.345229 | 1.72569E-06 | 2.20903E-06 | 2.31416E-06 |
| … | |||||||
Appendix B Relevance of low-metallicity AGB models to the interpretation of meteoritic stardust grains
Predictions from AGB models of SMC metallicity are also essential for the interpretation of the composition and the origin of meteoritic stardust grains because this metallicity is currently believed the lower boundary for the parents stars from which they originated. The grains are recovered from primitive meteorites and represent tiny dust particles (m and sub-m sized) that formed around stars, novae, and supernovae. They kept their individuality as microcrystals from their stellar source site, throughout their residence time in the interstellar medium, during their incorporation in the proto-solar cloud, and inside meteorites (Zinner, 2014). As such, they give us direct information about the isotopic composition produced by nuclear reaction and mixing in their parent stars.
The vast majority of stardust grains originated in AGB stars, mostly of metallicity around solar (Hoppe & Ott, 1997; Nittler et al., 1997; Lugaro et al., 2003; Lugaro et al., 2017). However, peculiar populations exist that appear to show the signature of C-rich AGB stars of metallicity down to the SMC metallicity. The most famous example are silicon carbide (SiC) grains belonging to the so-called Z population (Hoppe et al., 1997; Zinner et al., 2006). These represent only roughly 1% of the whole stardust SiC inventory and are, on average, of smaller size then the mainstream grains (90% of all SiC grains), believed instead to have originated in C-rich AGB stars of metallicity around solar. Their isotopic composition can be analysed with very high precision and its interpretation gives us information on AGB nucleosynthesis at low metallicity, independently complementing spectroscopic data. However, the first step is to pinpoint the exact origin of the grains, in terms of the mass and metallicity of the parent stars. The Z grains show deficits in i and excess in i, relative to i and to the solar composition. These are interpreted as the signature of AGB stars of low metallicity because the low i/i ratio is a signature of the initial composition of the star, where i is -enhanced relative to i, a secondary isotope. On the other hand, i can be efficiently produced by neutron captures in low-metallicity stars particularly via the (n,)(n,)i chain, starting at the abundant . One main issue is related to the / ratios measured in the grains. These are lower than solar, in the same range, roughly 20 to 90, as shown by the mainstream grains believed to have originated in AGB stars of metallicity roughly solar. This is particularly puzzling since another small population of SiC, the Y grains (also 1% only of all SiC) believed to come from AGB stars of metallicity in-between the mainstream and the Z grains show instead / ratios higher than solar (Amari et al., 2001). One interpretation is that extra mixing processes in low-mass AGB stars reduce the / ratio and that these processes are more efficient in the parent star of the Z grains (Hoppe et al., 1997; Palmerini et al., 2011). On the other hand, via the interpretation the Si isotopic ratios on the basis of GCE and AGB models Lewis et al. (2013) concluded that type Z grains appear to have originated from AGB stars of higher mass, on average, than mainstream and Y grains. In this case, HBB could be responsible for the low / ratios. One way to disentangle this issue would be to compare model prediction for the elements heavier than Fe in AGB stars low-metallicity to the composition of these elements in SiC-Z. While such data is not available yet, it will become in the near future as technical progress is making analysis of stardust more efficient, for example, using the new Chicago Instrument for Laser Ionization (CHILI) instrument (Stephan et al., 2016). Comparison to model predictions such as those reported here will allow us to better constraint the origin of Z grains and the processes occurring in their parent stars.
Another type of stardust grain of which a large fraction appears to show the signature of low metallicity AGB stars are high-density graphite grains (Amari et al., 2012). This conclusion is mostly based on comparing the carbon and Kr isotopic compositions. It is expected that as the metallicity decreases, the production of graphite in AGB stars is favoured with respect to that of SiC (Sloan et al., 2008). Complementary analysis and interpretations of the features and composition of SiC-Z and high-density graphite grains can also help us shed light on the efficiency of dust formation for different types of dust and how this varies with the stellar metallicity. Future work will be dedicated to a detailed comparison between our models and the composition of SiC-Z and high-density grains, and to provide detailed predictions for the isotopic ratios of elements heavier than Fe that can be measured in the grains.
Finally, a minor fraction of oxide grains are rich in with respect to and with respect to solar (they are known as the Group III grains Nittler et al., 1997). This composition has been taken as the indication of an origin in low-mass low-metallicity AGB stars, due to the -enhancement of relatively to the secondary isotopes , as in the case of Si in SiC-Z. The low-mass origin is required for the star to keep the signature of such initial composition until the AGB phase when the dust forms, i.e., with no effect of dredge-up episodes on the O isotopes. Also for these grains AGB models of low-metallicity are required to confirm the current picture.