figure0em1in \cftpagenumbersofffigure \cftsetpnumwidth0em \cftsetrmarg0em
DNA Base Pair Mismatches Induce Structural Changes and Alter the Free Energy Landscape of Base Flip
Running Title: DNA Mismatches and Structural Properties
Keywords: DNA structure, Mismatch Repair, Base flip, Metadynamics
Abstract
Double-stranded DNA may contain mismatched base pairs beyond the Watson-Crick pairs guanine-cytosine and adenine-thymine. Such mismatches bear adverse consequences for human health. We utilize molecular dynamics and metadynamics computer simulations to study the equilibrium structure and dynamics for both matched and mismatched base pairs. We discover significant differences between matched and mismatched pairs in structure, hydrogen bonding, and base flip work profiles. Mismatched pairs shift further in the plane normal to the DNA strand and are more likely to exhibit non-canonical structures, including the e-motif. We discuss potential implications on mismatch repair enzymes’ detection of DNA mismatches.
Introduction
Bases in double-stranded DNA occur in complementary pairs: adenine (A) matches with thymine (T), and cytosine (C) matches with guanine (G). This exact pairing allows for DNA duplication during mitosis and cell growth. DNA replication, however, is susceptible to errors and mutations at a frequency of 1 per 107 base pairs per mitosis cycle; (1) this creates base pair mismatches, such as guanine-thymine (GT). DNA mismatches induce negative consequences on human health, including higher mutation rates, (2) genetic defects, (3, 4, 5) and cancer. (5, 6, 7, 8)
We study the effects of base pair mismatches on DNA structure at the molecular level. We employ molecular dynamics computer simulations to quantify the differences in structure between DNA strands with matched and mismatched base pairs. Our focus is on geometric order parameters describing base pair structure, (9) hydrogen bonding between opposing bases, and flipping DNA bases out of the helix. For a subset of these observables matched and mismatched base pairs deviate significantly, especially those which report on in-plane geometries.
To elucidate the physical properties of mismatched base pairs, we compute the work required to rotate a single base out of the DNA double helix. This rotation, called base flip, (10) is a crucial process by which enzymes detect and selectively repair post-replicative errors. Proteins of the Mismatch Repair (MMR) system proofread the DNA; upon encountering a mismatch, an MMR enzyme flips the offending nucleotide out of the DNA double helix and into its active site before proceeding with the repair pathway. (11, 7, 12, 5, 13) MMR proteins decrease the mutation rate between 50-1000 times, to a rate of 1 per 109-1010 base pairs per cell division.(1, 14)
Base flip requires an activation energy exceeding thermal fluctuations, and is unlikely to occur on the timescale of typical molecular dynamics simulations. To overcome this obstacle, we utilize the well-tempered metadynamics algorithm; driving the simulation away from the ground state. The free energy profiles in some mismatched pairs demonstrate a metastable state in which both bases flip out of the DNA strand and nest in the minor groove. This may contribute to MMR proteins’ ability to recognize mismatches. Our results do not indicate a systematic trend in free energy difference between the flipped-in and flipped-out states as a quantitative predictor of mismatch recognition, largely due to this unusual minor-groove-nested structure. The presence of this structure does not predict MMR recognition, which highlights the importance of analyzing additional physical properties such as DNA bending. (15, 16, 13, 17, 18)
Methods
Model Building
We construct atomistic models of B-DNA containing twelve base pairs by employing the 3DNA software. (19) The sequence is of the form CTGA ACXA ATGT, where the placeholder X represents any one of the four nucleotides. Bases 1-6 and 8-12 pair with matched nucleotides, whereas X pairs with either a matched or a mismatched base, denoted Y. We use the notation XY to identify our considered sequence. We study a total of eleven systems, four matched () and seven with a single mismatch (). We do not include the GG mismatch because steric influences prevent a hybridized equilibrium state.
We minimize each model for 200 steps of steepest descent by applying the CHARMM27 Force Field, (20) which we employed throughout. We solvated the structures with explicit TIP3P water (21) in a dodecahedral simulation box extending at least 1 nm beyond the DNA polymer in all directions. We randomly substituted 22 water molecules for Na+ counter-ions to neutralize the system. The solvent was minimized for 200 steps of steepest descent and equilibrated for 100 ps. We equilibrated each full system for 1 ns.
Molecular Dynamics Simulations
We performed simulations at 300 K in the NVT ensemble with stochastic velocity rescaling, (22) periodic boundary conditions, and a 2 fs timestep employing the Gromacs simulation suite. (23) We utilized the SHAKE algorithm (24) to constrain covalent bonds that include a hydrogen atom, and treated long-range electrostatic interactions with the Particle Mesh Ewald method (25) with a non-bonded cutoff of 1.2 nm. After equilibration, we performed unbiased simulations for 100 ns and saved trajectory coordinates every 10 ps. To identify representative configurations, we applied the Biopython (26) module cluster.kmedoids.
Structure, Hydrogen Bonding, and Base Flip
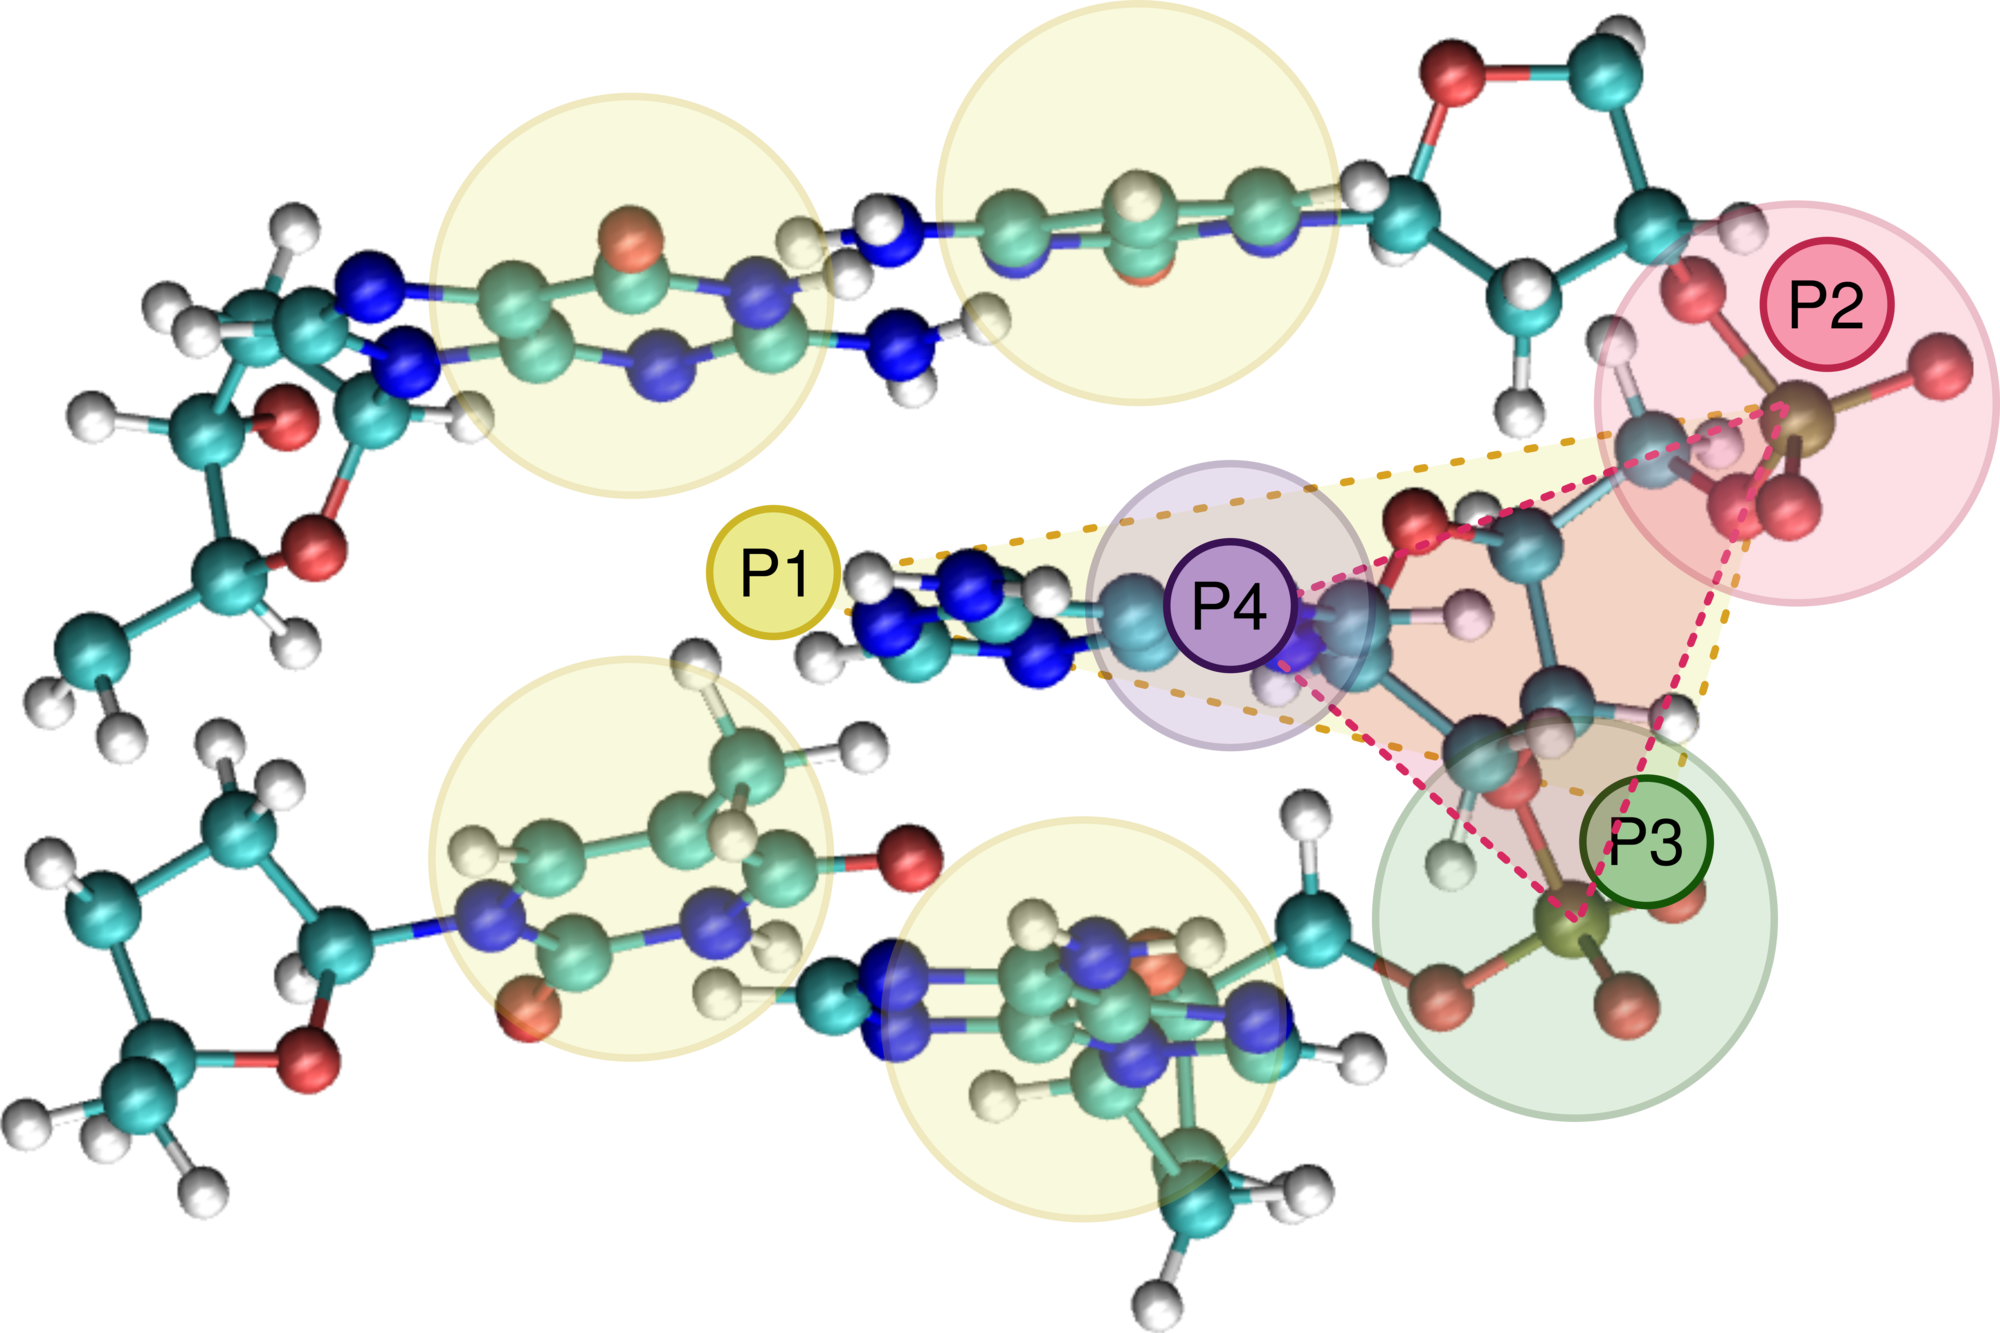
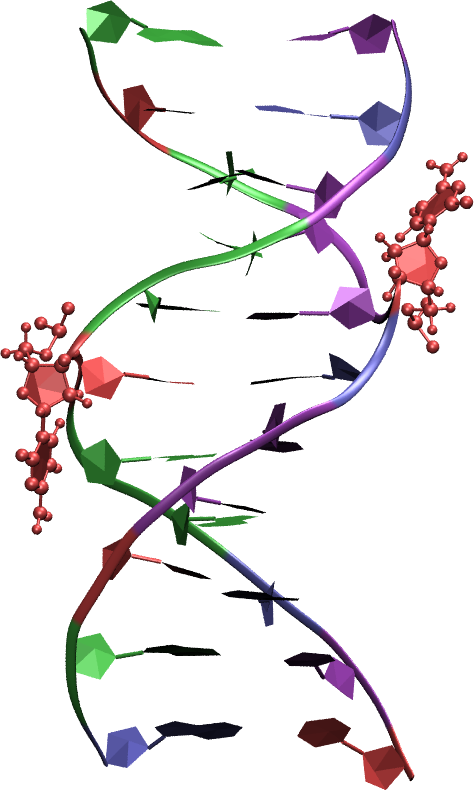
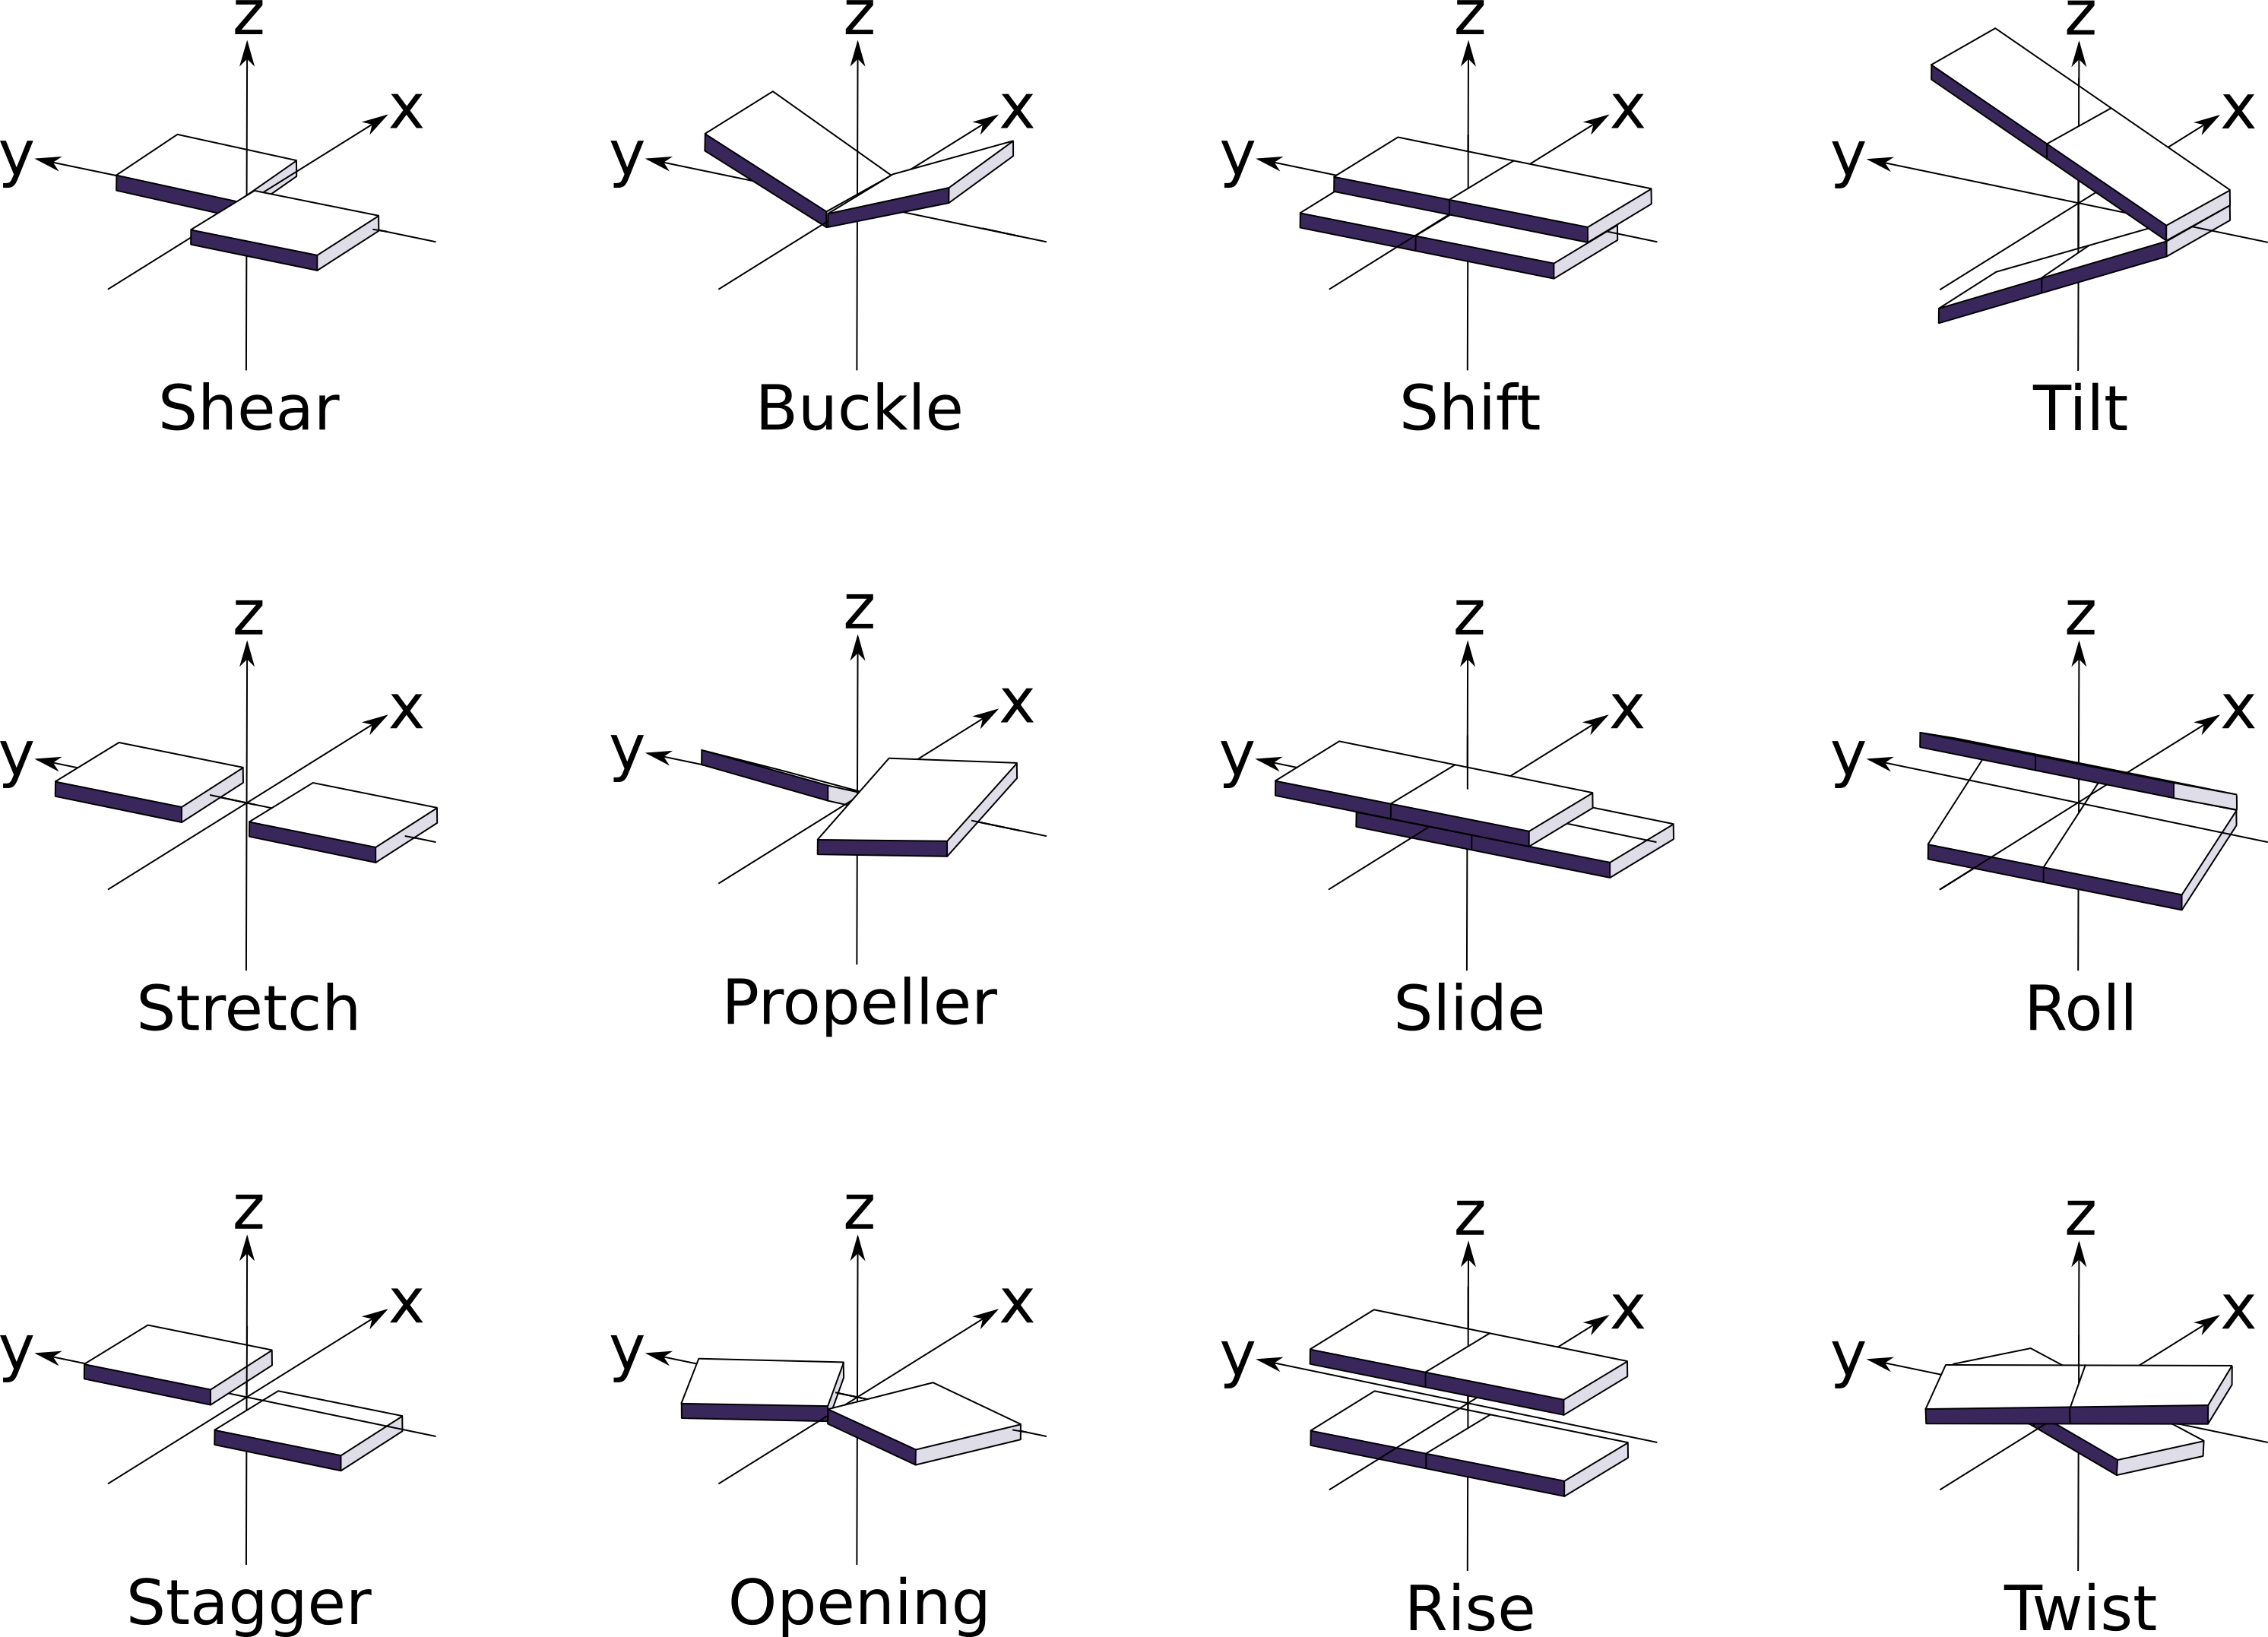
Roll, tilt, twist, slide, rise, shift, buckle, propeller, opening, stagger, shear, stretch, (pictured in Fig. S1) and inter-base hydrogen bonding were calculated using 3DNA; (19) probability distributions and free energy profiles were determined by in-house computer code. We measure bend as presented by Sharma et. al.: (16) we section the DNA into three (bases 2-4/21-31, 5-8/17-20, and 9-11/14-16) and calculate the angle between the centers of mass of the heavy atoms. To measure base flip, we adopt a pseudo-dihedral angle first described by Song et. al., (10) defined as the dihedral angle between points P1, P2, P3, and P4 where P1 is the center of mass of the two neighboring base pairs, P2 and P3 are the centers of mass of the phosphates which flank the flipping base, and P4 is the center of mass of the pyrimidine ring, or the five-membered ring of the purine. (Fig. 1) Changes in base flip angle are positive if X crosses into the major groove or if Y crosses into the minor groove, and negative otherwise.
Metadynamics Simulations
We employ well-tempered metadynamics simulations with two collective variables: the base flip angle of X and the base flip angle of Y. For comparison, we perform simulations in which we bias only one of these two base flip angles as a collective variable. Using the PLUMED plug-in, (27) we add Gaussian biasing potentials to the collective variable(s) with a height of 3 kJ/mol, width of 0.08 radians, a deposition rate of 1 ps, and a well-tempered bias factor of 6, for a total simulation length of at least 700 ns per system. We reconstruct the 2D free energy surface as the inverse of the potential energy added to the system as described in Ref. (28). We pinned the base pairs terminating the DNA strand and the base pairs neighboring the flipping bases by their inter-pair hydrogen bonds to prevent the system from artificially melting. We constrain each hydrogen bond to a distance of 0.2 nm with a harmonic constant of 40 kJ mol-1 nm-2.
Evaluating Correlations
For any two order parameters and , we calculated the covariance as
| (1) |
where
| (2) |
Here, the angular brackets denote the equilibrium average,
| (3) |
where the probability distribution, , is proportional to the exponent of the negative free energy:
| (4) |
For well-tempered metadynamics simulations, we reconstructed free energy diagrams for structural order parameters utilizing the re-weighing method described by Bonomi et. al. (29)
Calculating free energy differences
We convert two-dimensional free energy profiles to one-dimensional free energy profiles by integrating:
| (5) |
where is the free energy function, is the variable integrated out of the profile, is the remaining variable, and is the Boltzmann constant multiplied by the simulation temperature.
We calculate the free energy difference, , by subtracting the free energy of the hybridized conformation from that of the solvent-facing conformation. To calculate the free energy of each state, we evaluate
| (6) |
where and are the left and right boundaries of the state, defined by the flanking free energy maxima.
Results and Discussion
Structural Order Parameters
For each system, we calculate the probability distributions of the DNA order parameters buckle, opening, propeller, rise, roll, shear, shift, slide, stagger, stretch, tilt, and twist from unbiased molecular dynamics simulations. These distributions (and the corresponding free energy profiles) give valuable information regarding the structures of the hybridized ground state and of the base pair of interest. Imhof and Zahran (30) calculated these distributions for the AT and GC matches as well as the GT mismatch. For these base pairs, our results agree with theirs, despite our employing different DNA sequences.
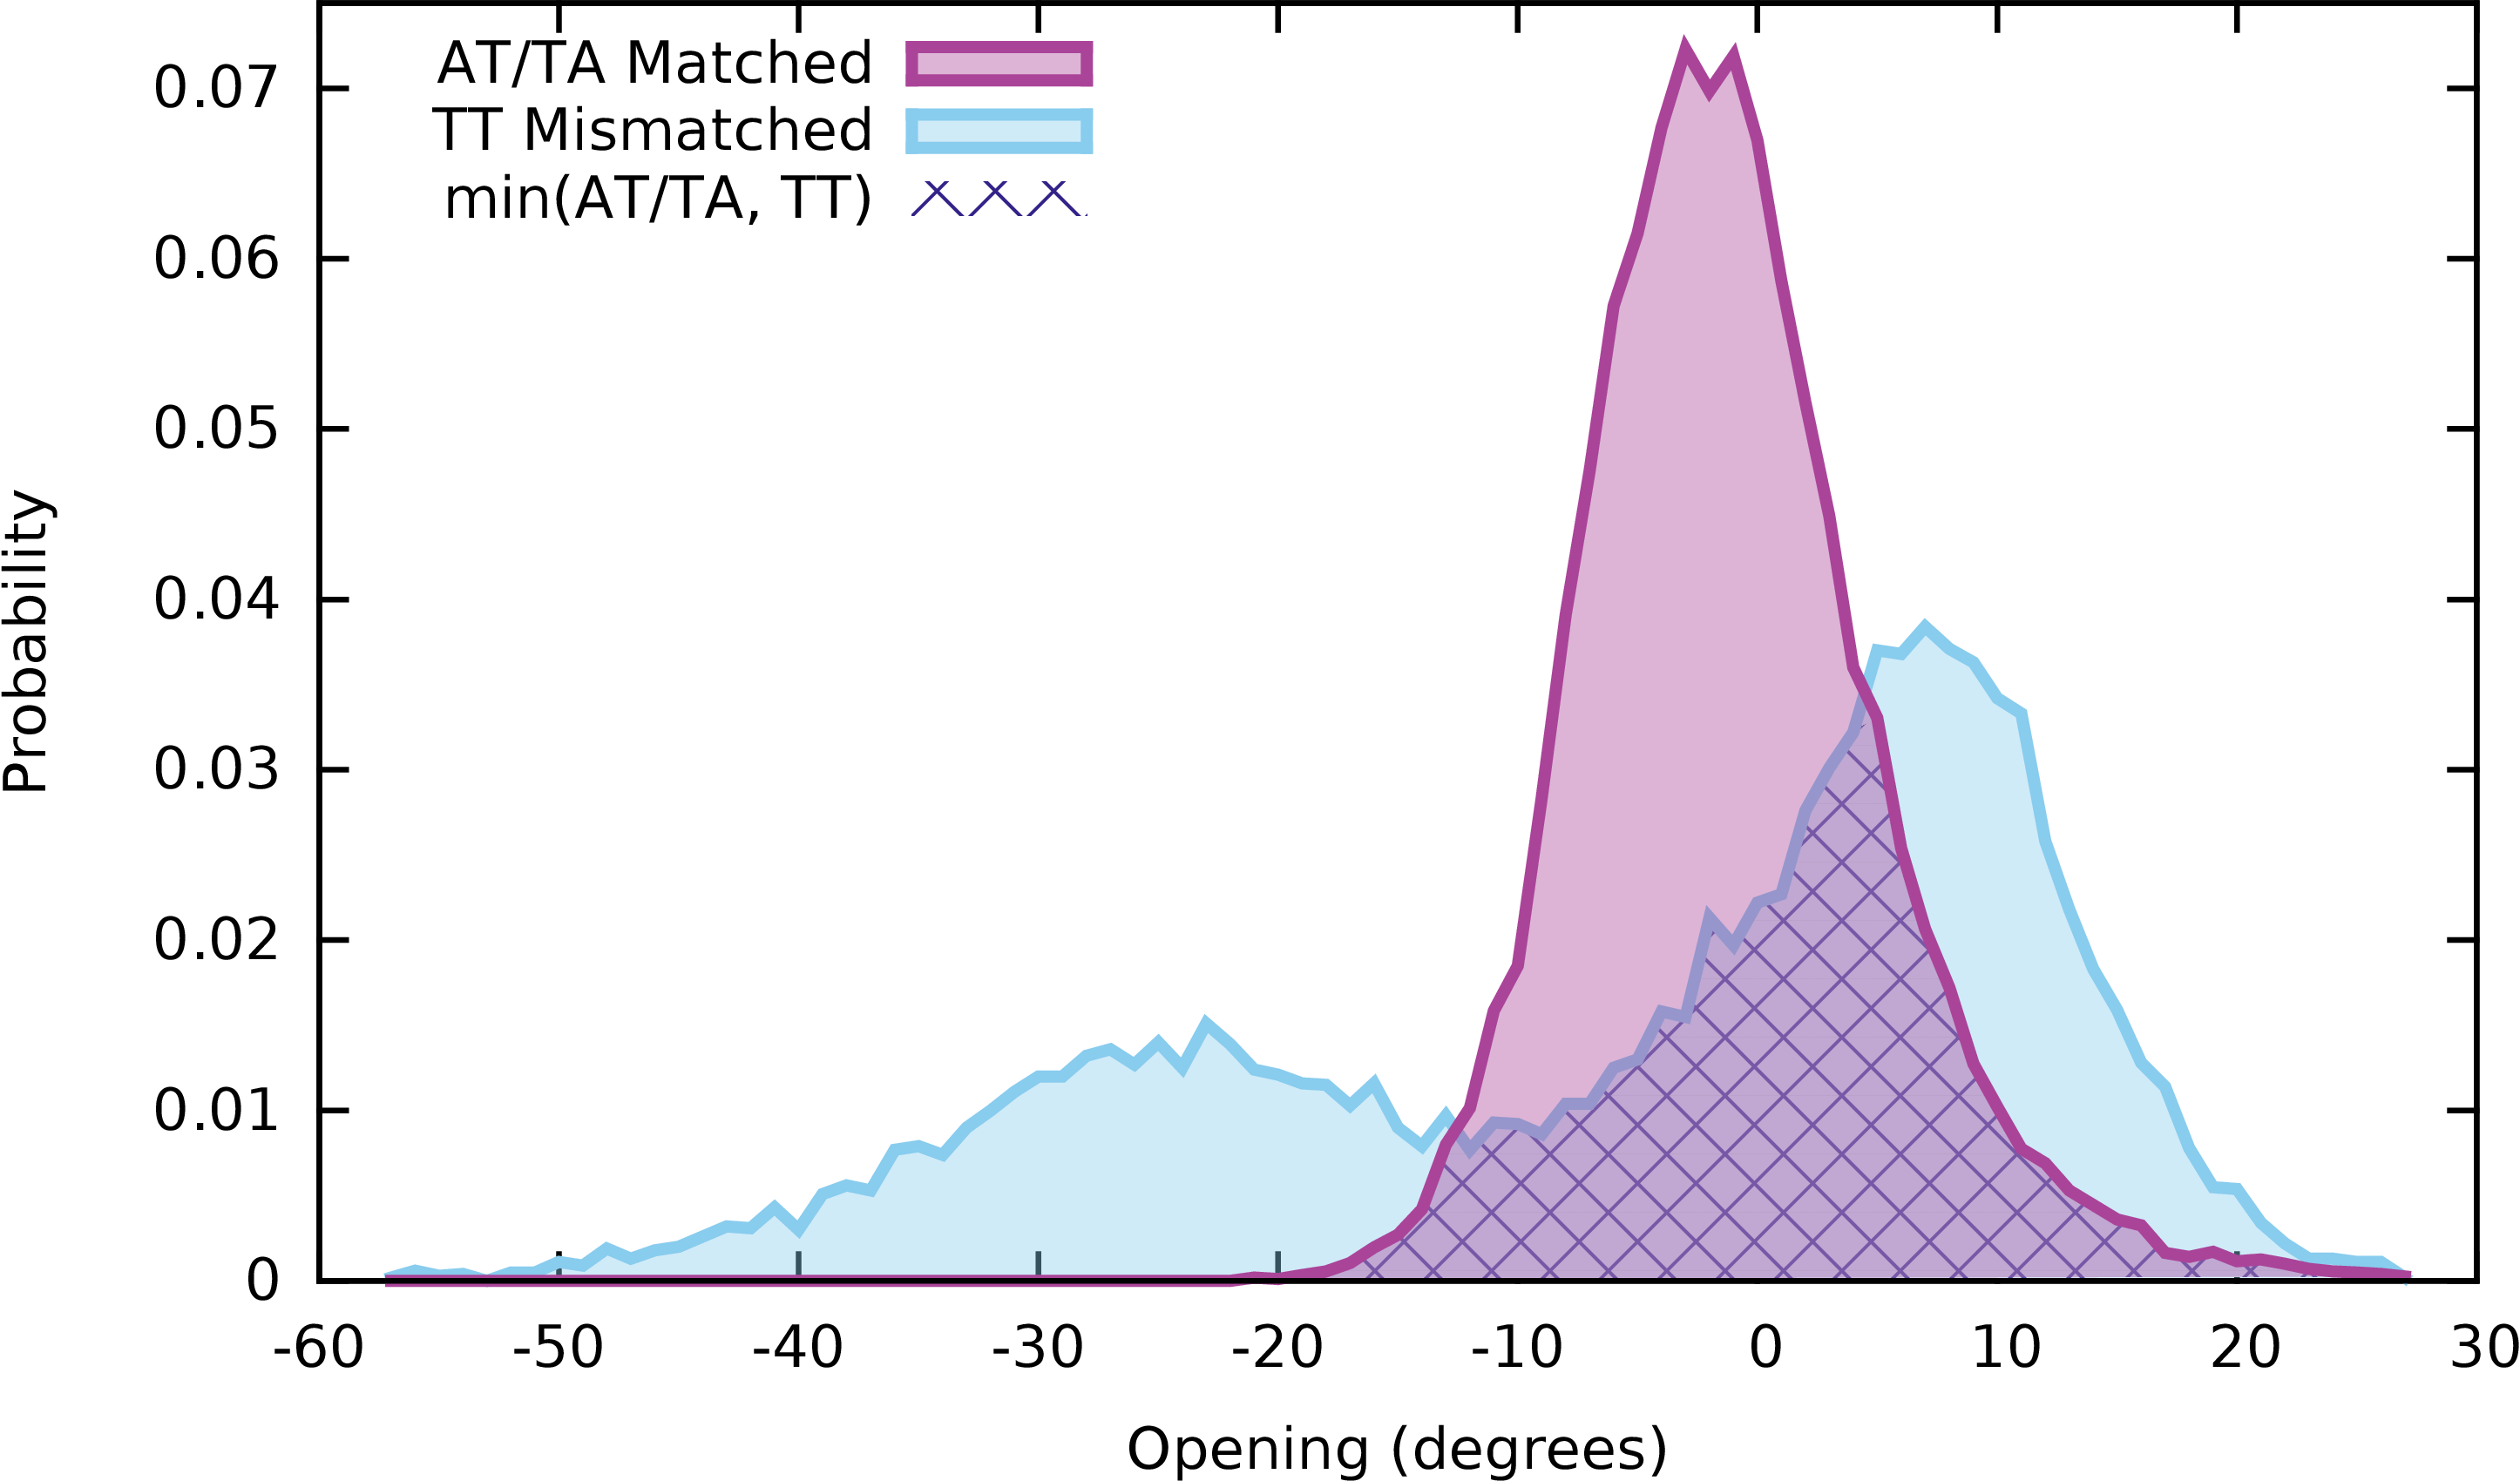
For all studied base pairs, we measure the similarity in structure of matches and mismatches by calculating the probability overlap:
| (7) |
which is the integrated area of the minimum of the mismatched probability density () and the mean of the corresponding matched probability densities (). This measure of overlap ranges from 0 to 1, where 0 indicates complete dissimilarity of structure and 1 indicates exact similarity. We provide an illustrative example in Figure S2.
| AA | CC | TT | AG | AC | CT | GT | avg. | |
| stretch | 0.00 | 0.03 | 0.01 | 0.00 | 0.18 | 0.05 | 0.09 | 0.05 |
| shear | 0.00 | 0.02 | 0.00 | 0.76 | 0.00 | 0.64 | 0.00 | 0.20 |
| opening | 0.35 | 0.38 | 0.47 | 0.21 | 0.53 | 0.41 | 0.72 | 0.44 |
| twist | 0.29 | 0.34 | 0.23 | 0.91 | 0.46 | 0.96 | 0.44 | 0.52 |
| shift | 0.54 | 0.45 | 0.86 | 0.59 | 0.64 | 0.67 | 0.77 | 0.65 |
| tilt | 0.29 | 0.85 | 0.74 | 0.52 | 0.84 | 0.61 | 0.93 | 0.68 |
| slide | 0.37 | 0.62 | 0.77 | 0.64 | 0.90 | 0.80 | 0.85 | 0.71 |
| stagger | 0.50 | 0.78 | 0.79 | 0.56 | 0.80 | 0.71 | 0.80 | 0.71 |
| propeller | 0.63 | 0.80 | 0.83 | 0.85 | 0.78 | 0.63 | 0.67 | 0.74 |
| buckle | 0.73 | 0.76 | 0.93 | 0.88 | 0.86 | 0.78 | 0.94 | 0.84 |
| rise | 0.85 | 0.70 | 0.77 | 0.91 | 0.93 | 0.92 | 0.95 | 0.86 |
| roll | 0.86 | 0.87 | 0.95 | 0.84 | 0.84 | 0.89 | 0.93 | 0.88 |
| bend | 0.93 | 0.92 | 0.95 | 0.77 | 0.88 | 0.92 | 0.95 | 0.90 |
| avg. | 0.49 | 0.58 | 0.64 | 0.65 | 0.66 | 0.69 | 0.70 |
We calculate overlap values and present the results in Table 1. Our data demonstrate that, on average, GT is the most similar to its matched counterparts. This is an unintuitive result, as GT is one of the easiest mismatches for MMR proteins to identify.(31, 32, 33, 34) In a similar vein, CC is one of the most difficult for MMR proteins to recognize, (31, 32, 33, 34) but it possesses one of the structures most dissimilar from matched configurations. This trend holds for bend, which has previously been determined to correlate with base flip, (15, 16) and is thus a likely mechanism for MMR recognition.
Our data reveal that the distributions of stretch, shear, opening, twist, and shift vary the most when we compare mismatched with matched base pairs. These order parameters are within the plane perpendicular to the DNA. Order parameters presenting negligible differences include roll, rise, buckle, propeller, and stagger; all defined outside of the perpendicular plane. These results indicate that replacing a matched base by a mismatched one distorts the DNA mostly within the plane of the base pair, not along the length of the molecule. These distortions do not appear to correlate with MMR enzymes’ ability to identify mismatches. (31, 32, 33, 34)
Hydrogen Bonding
We calculate the mean number of hydrogen bonds between the two bases of interest, X and Y. We present our results in the second column of Table 2. As expected, the average number of hydrogen bonds for the matched pairs AT and TA is approximately two, and for pairs CG and GC it is approximately three. Mismatched base pairs contain a consistently lower number of hydrogen bonds than their matched counterparts. Because hydrogen bonding between opposing bases determines DNA stability, (35, 36, 37, 38, 39, 40) these results indicate decreased stability in the presence of mismatches; a result well-known experimentally. (41, 42, 43, 44)
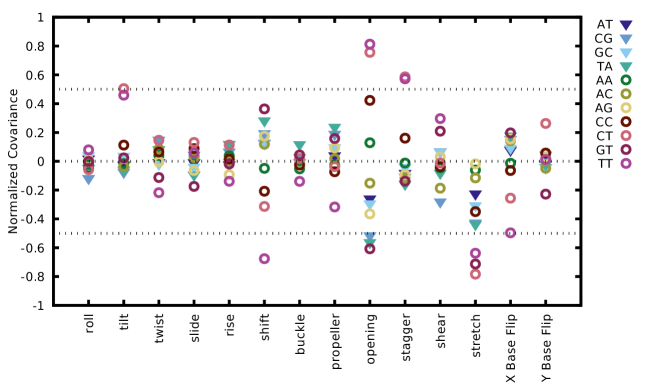
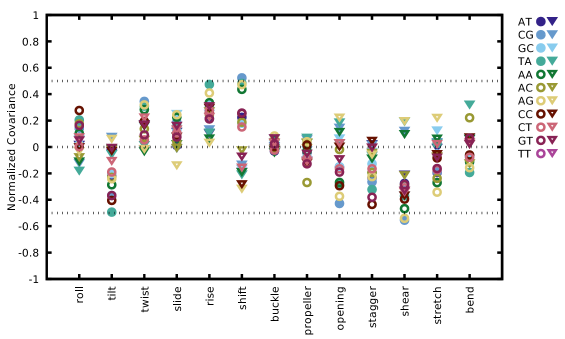
According to our results, hydrogen bonds do not systematically correlate with any of the analyzed structural parameters (Fig. S3), though weak trends are discernible. The correlation with stretch, if present, is always negative. This is an expected result; as bases drift from one another, their ability to hydrogen bond decreases. Interestingly, the structures of mismatched pairs CT, GT, and TT correlate more with hydrogen bonding than any other pair.
| Unbiased MD | Metadynamics | |||||
| Time | Mean | Time | ||||
| (ns) | # Hbonds | (ns) | (kJ/mol) | (kJ/mol) | ||
| Matched | AT | 100 | 1.99 | 700 | 29 | 26 |
| TA | 100 | 1.95 | 700 | 28 | 71 | |
| CG | 100 | 2.97 | 700 | 22 | 68 | |
| GC | 100 | 2.98 | 700 | 11 | 7 | |
| Mismatched | AA | 100 | 1.01 | 1000 | 40 | 60 |
| AC | 100 | 1.96 | 700 | -1 | -1 | |
| AG | 100 | 1.08 | 700 | 19 | 56 | |
| CC | 100 | 1.08 | 700 | 8 | 8 | |
| CT | 100 | 2.41 | 700 | 23 | 16 | |
| GT | 100 | 1.97 | 700 | 8 | 21 | |
| TT | 100 | 1.62 | 700 | 10 | 3 | |
Base Flip
Unbiased simulations are insufficient to determine the free energy of base flip. The free energy barrier to flip out of the DNA double helix and into solution is too immense to overcome on the simulation time scale. To ameliorate this complication, we applied the well-tempered metadynamics algorithm (45, 28) which computes the free energy surfaces (FES) of base flip over the entire domain. This technique continually adds Gaussian-shaped biasing potentials to each reaction coordinate, driving the system toward previously unexplored configurations.
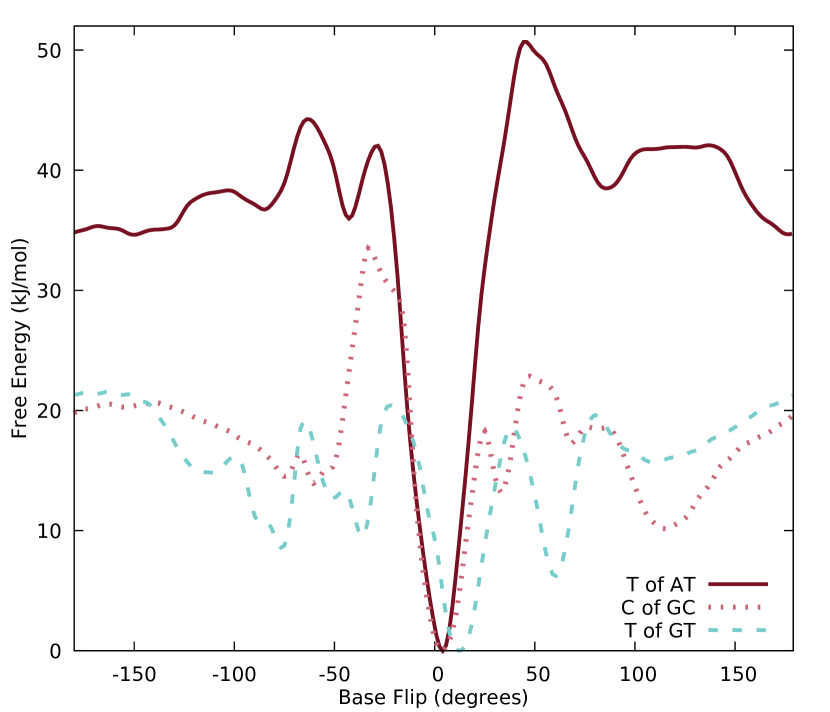
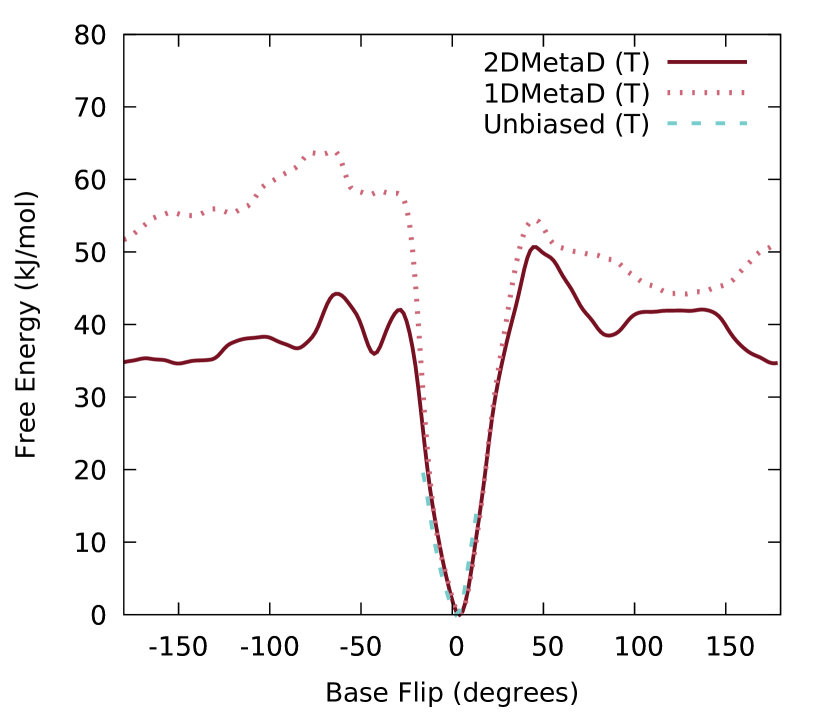
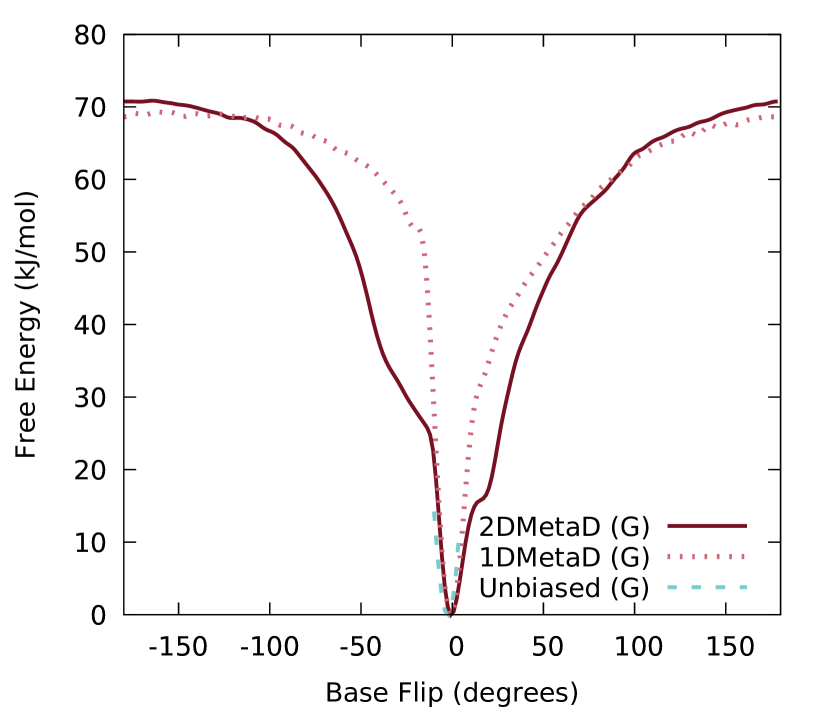
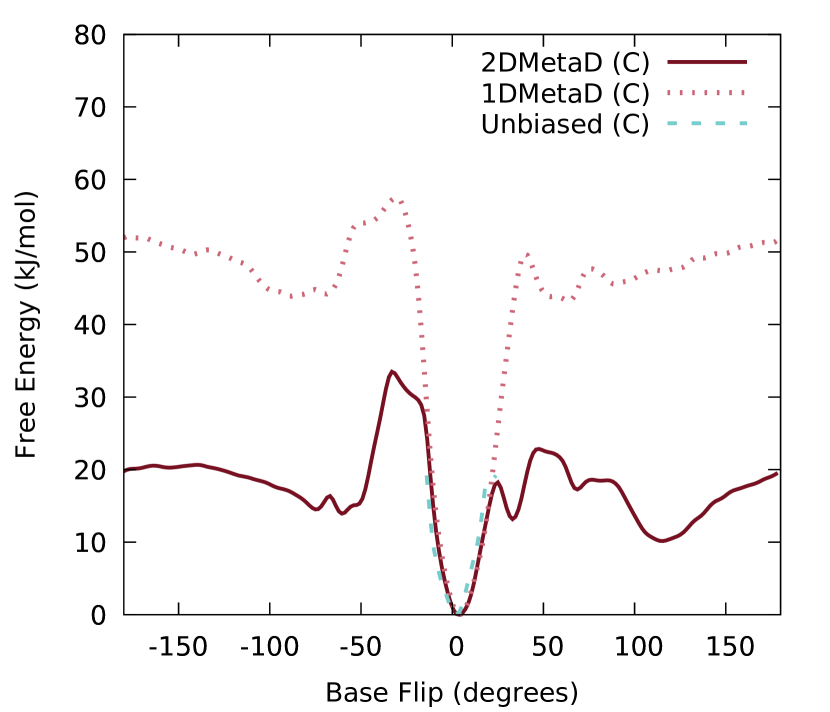
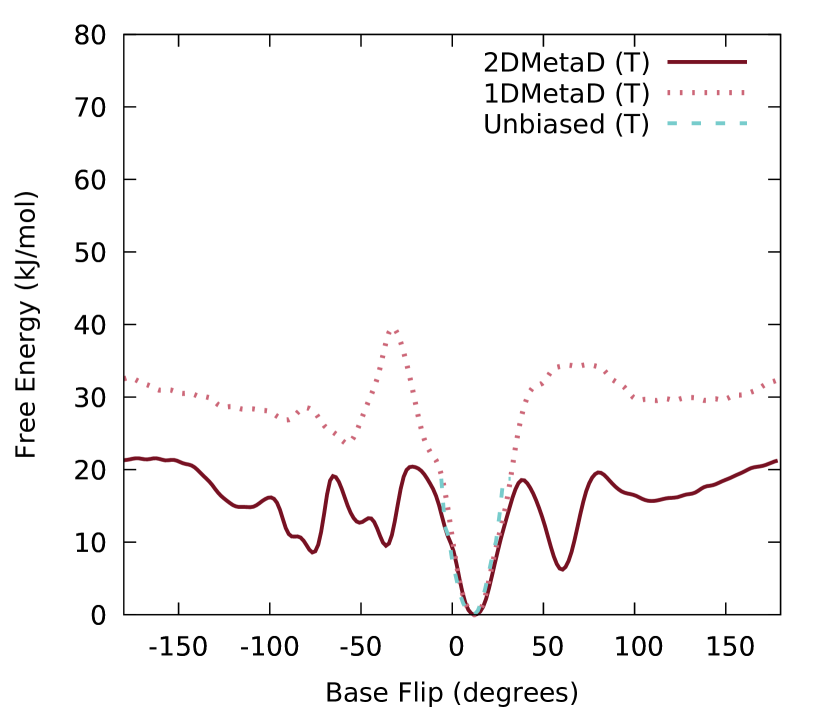
We compute an FES of base flip for each matched and mismatched pair. We illustrate a representative result in Figure 2, which compares the free energies of flipping a T base in a GT mismatch with those of the corresponding T base in an AT matched pair and the C base of a matched GC pair. We calculate these one-dimensional profiles from 2-CV metadynamics simulations by Eq. 5. Each of these bases possess the same local environment as the others. For each system, we identify a global minimum in the FES corresponding to the hybridized ground state. Extrahelical conformations form local minima separated from the principal minimum by activation barriers. Similar results have been reported in the literature for a subset of the base pairs considered in this study (46, 30, 47).
Base flip may resemble other order parameters when a base rotates into the DNA polymer; indeed, it correlates weakly with twist and shear in unbiased simulation. Once the base rotates out of the DNA strand it does not correlate with any of the other order parameters. (Fig. S4) We therefore conclude that base flip is a useful descriptor of base pair structure, building on the thirteen order parameters listed in Table 1. Despite no significant correlations, slight trends appear. For most structural parameters, the first and second bases of a pair have opposing correlations. For example, the parameter “shift” correlates positively with the base flip of the first base and negatively with the second. This is consistent with the opposing symmetries of hybridized DNA strands.
Calculations of base flip free energy profiles are difficult to converge due to long relaxation timescales; Imhof et. al. (30) observed a notable (10∘) shift of the minimum from unbiased to biased simulation of the TG mismatched system. They hypothesize that the long timescale of flipping and re-stacking causes the free energy to converge slowly. We notice a similar shift when testing their base flip reaction coordinate, first defined by MacKerell et. al., (46) with 50 ns metadynamics simulations and biasing only one base, but no such shift when adopting the updated base flip coordinate (10) with a bias potential applied to two bases. To differentiate if this results from the definition of base flip or from the number of biased coordinates, we performed a simulation biasing only one base with the updated base flip coordinate and found still no shift of the minimum. This would indicate that the choice of base flip coordinate is crucial not only for accuracy, as discussed in ref. (10), but also for convergence.
Simulations which bias two bases exhibit lower free energies than those which bias only one base. (Fig. S5) Because a lower free energy is favorable, this indicates the 2D biasing potentials possess greater accuracy than their 1D counterparts. The 2D potentials allow the system to explore other favorable states, and better represent the probability landscape of the force field. With our 2D potential we identify configurations we would otherwise not observe biasing only one base; this explains why our results disagree with previous studies: they each bias one base where we bias two. (46, 48, 10, 30, 13)
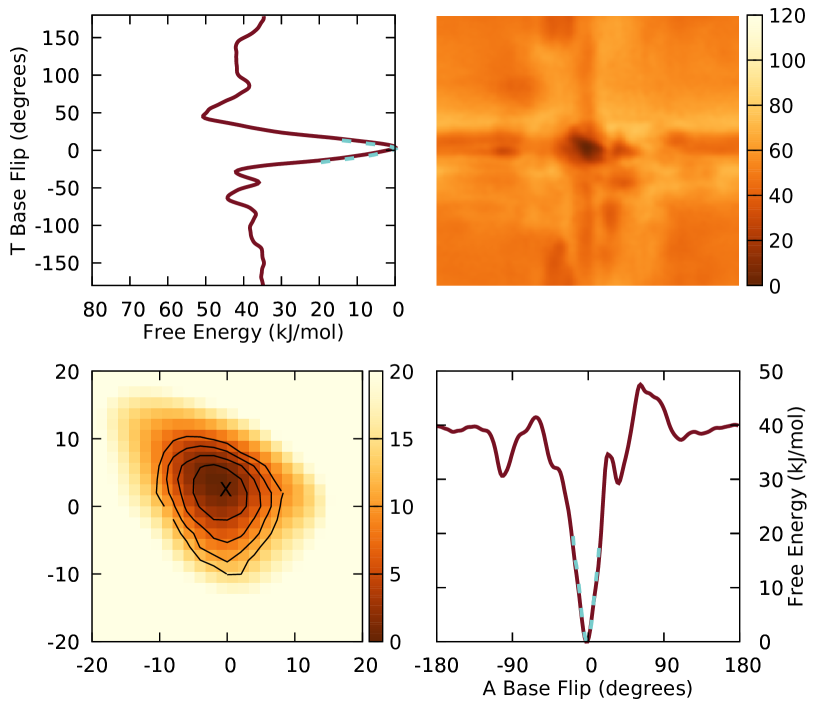
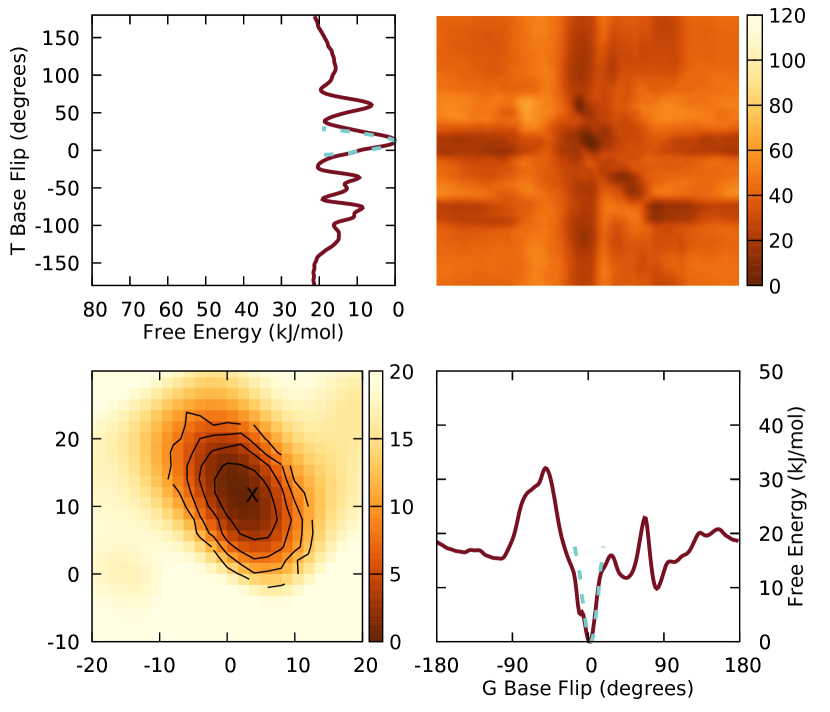
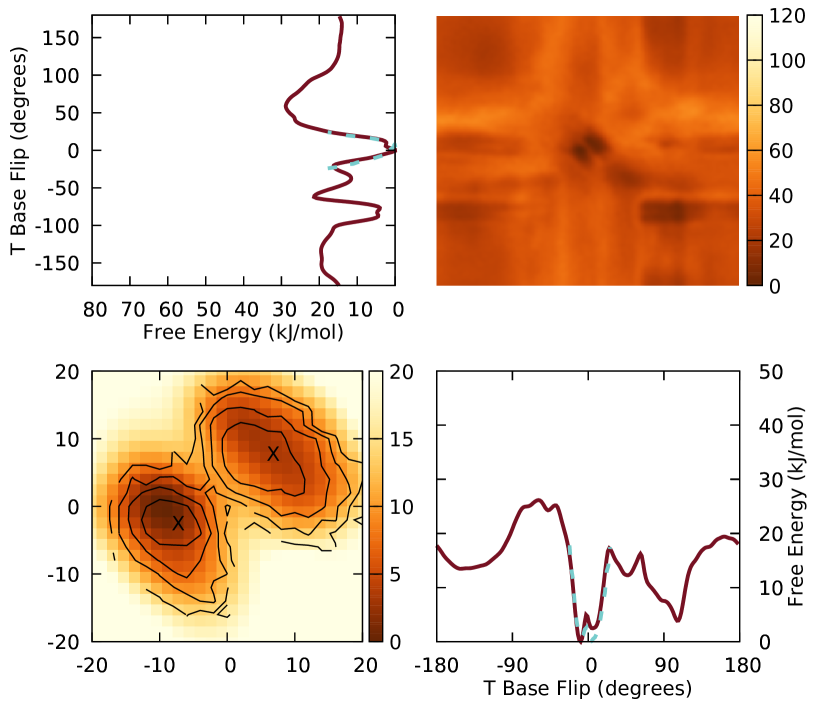
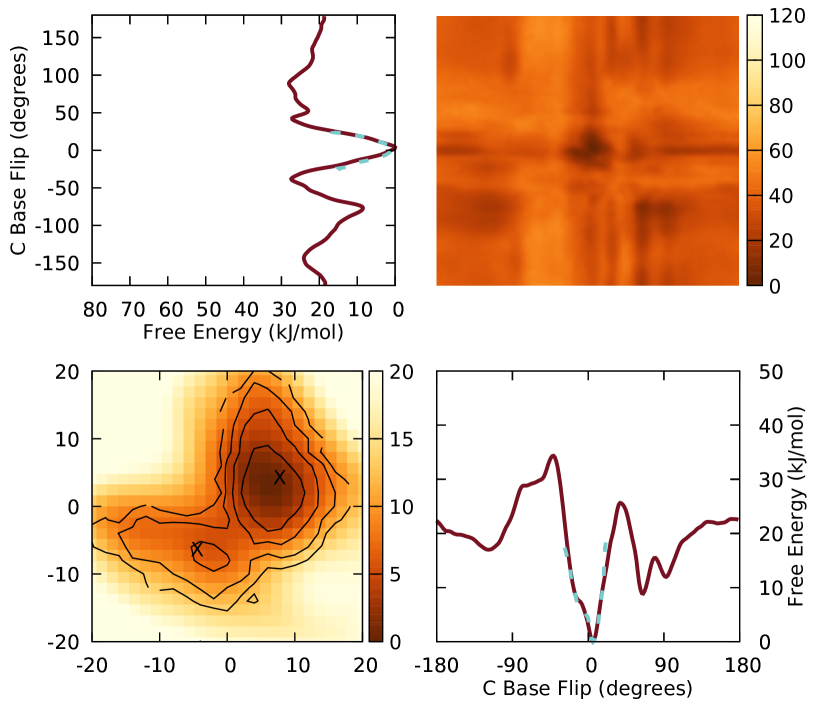
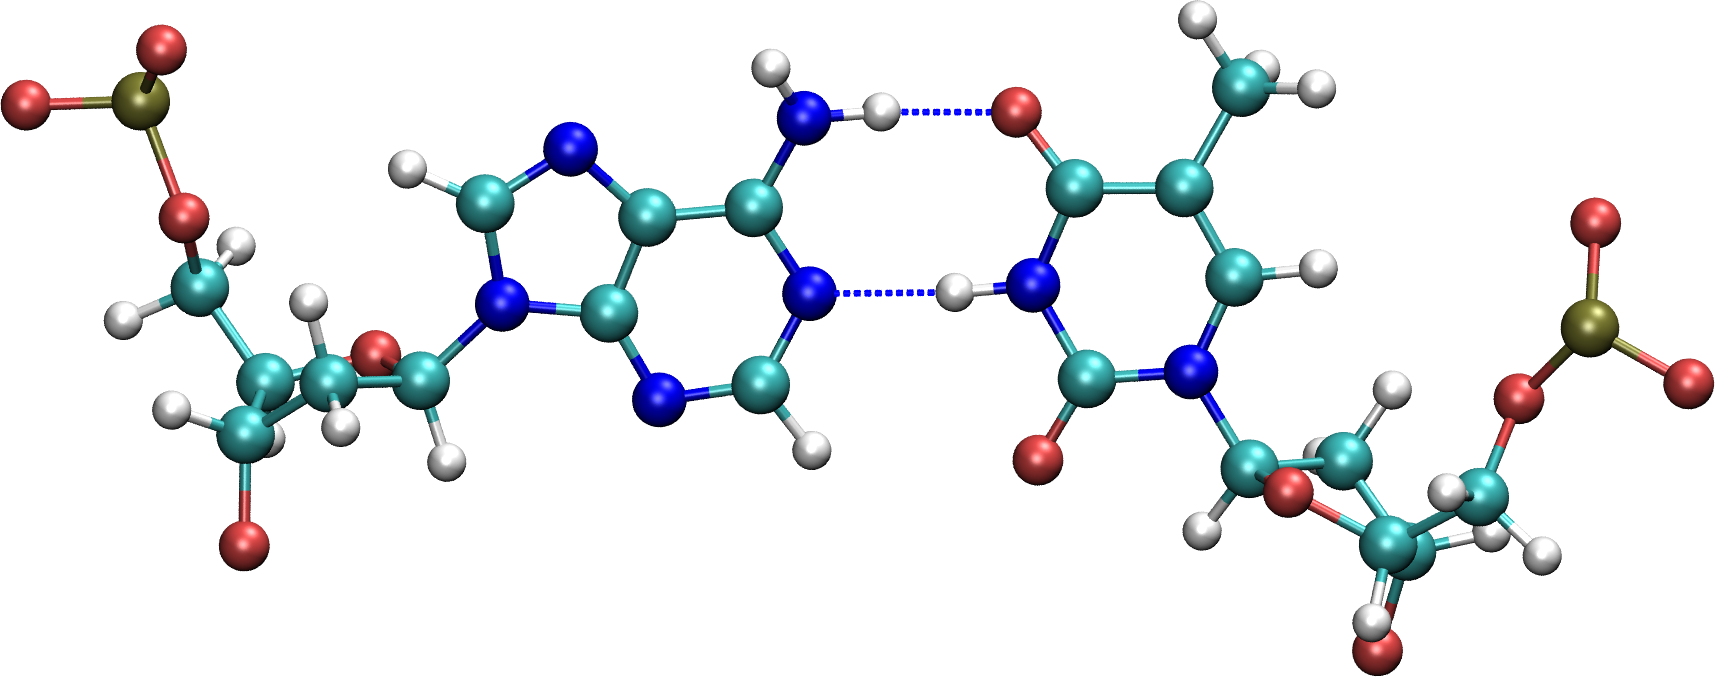
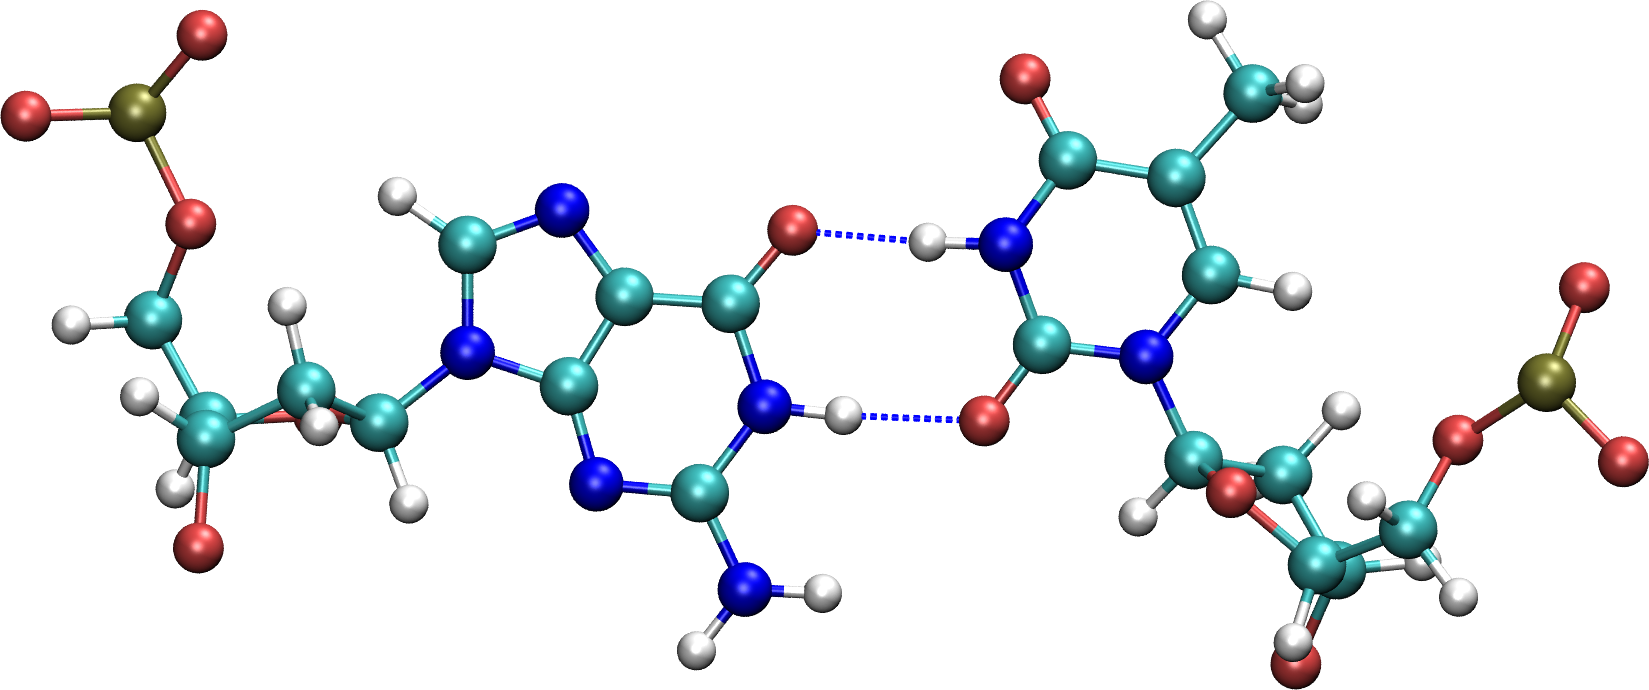
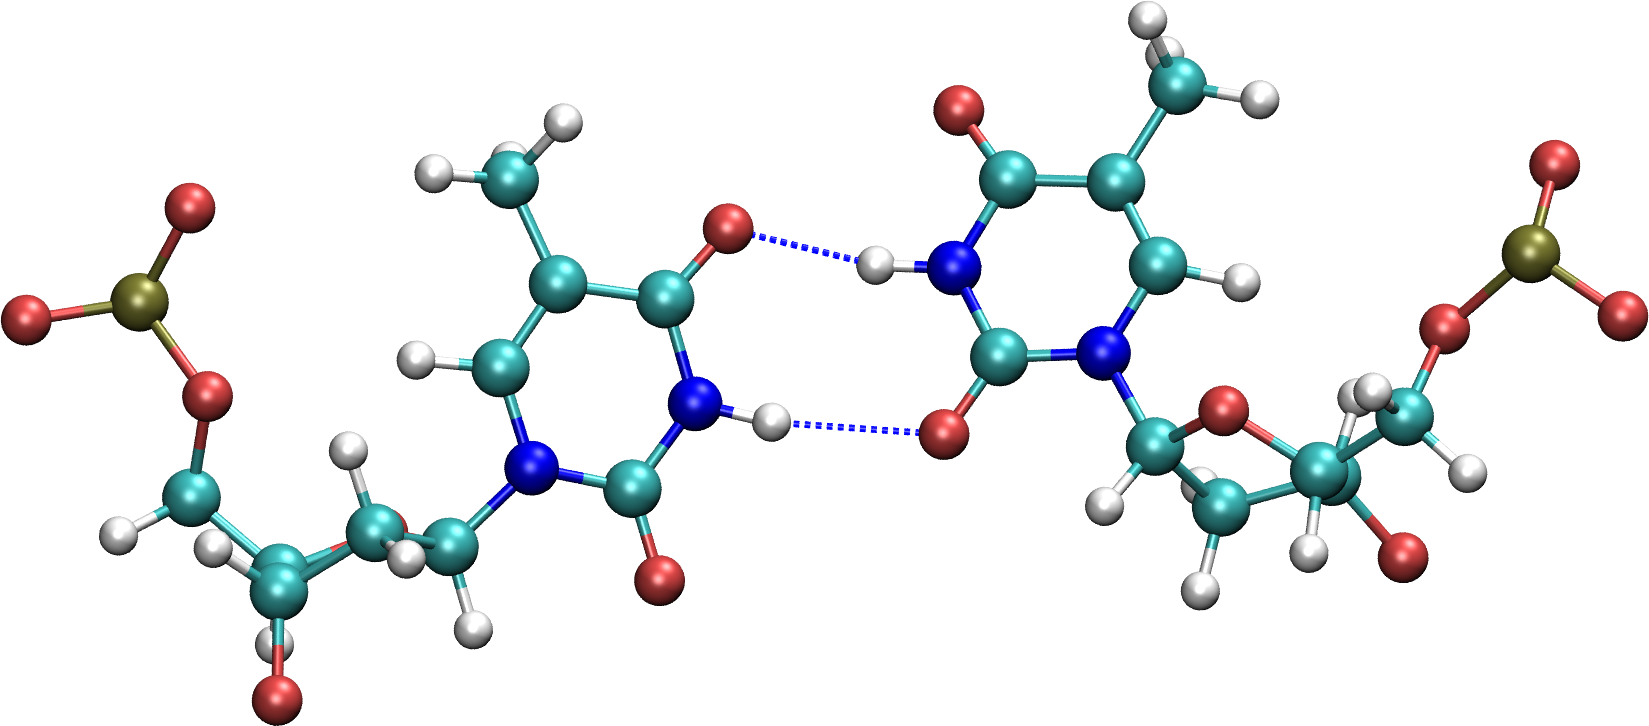
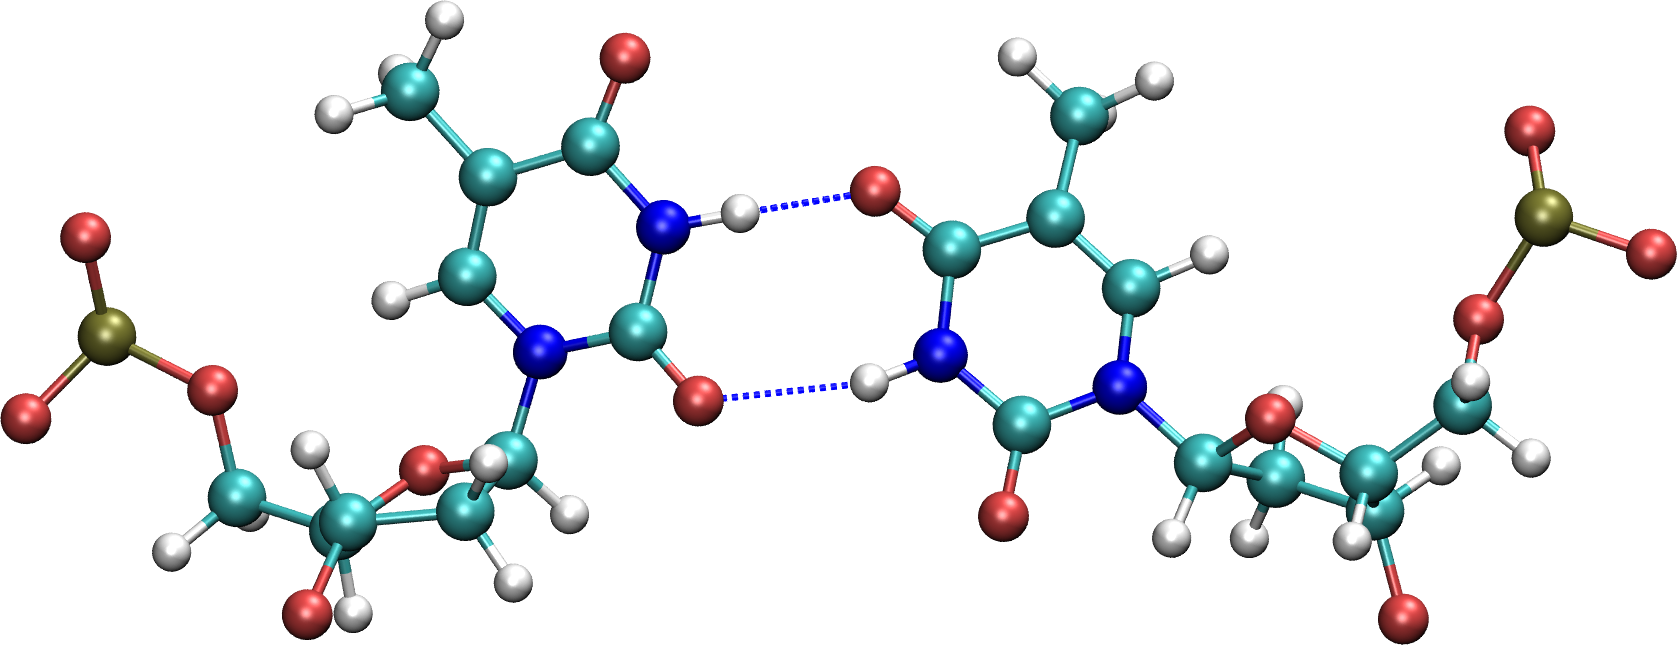
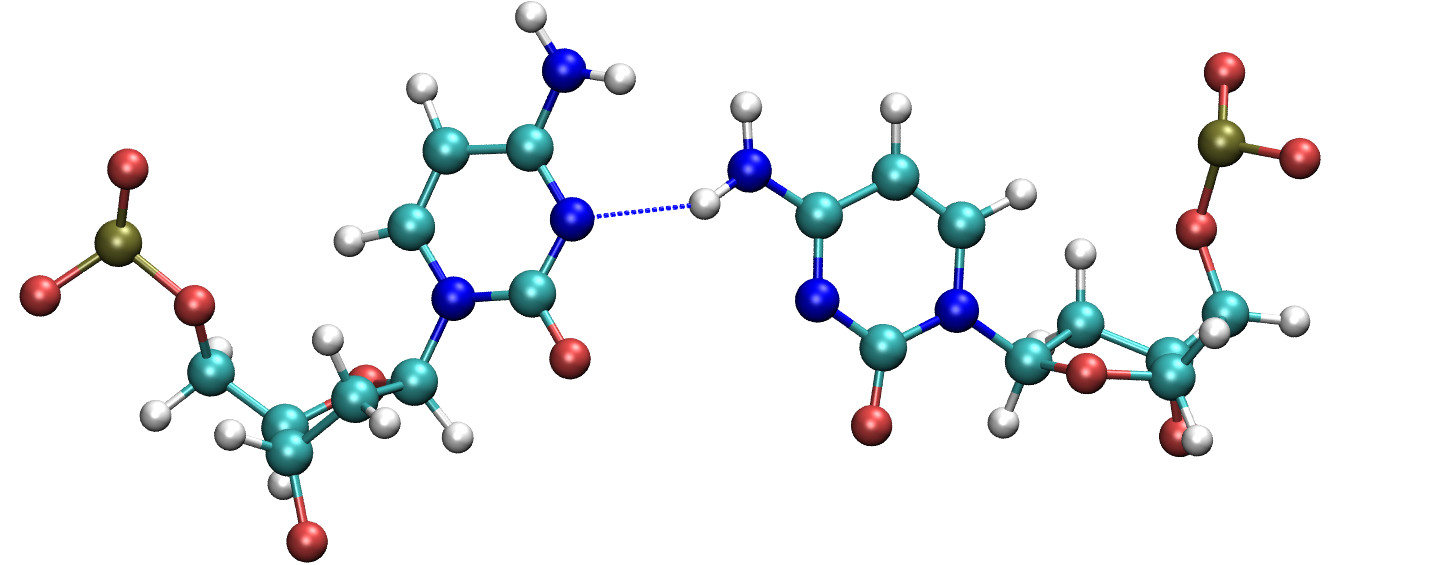
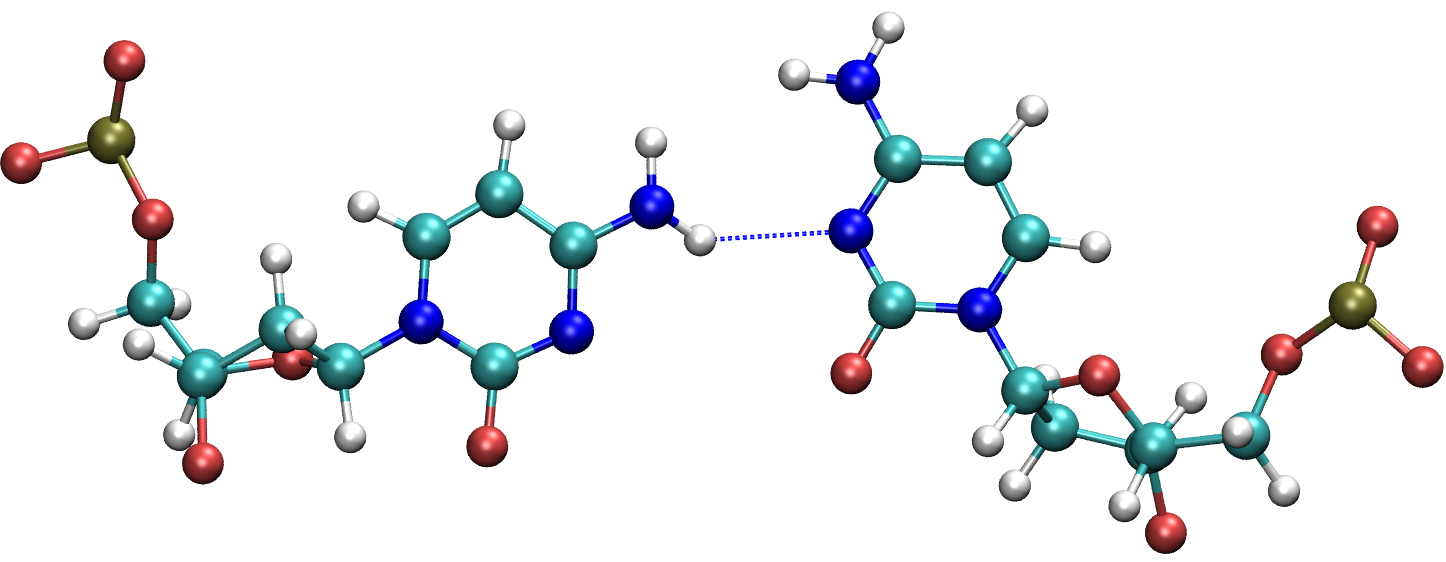
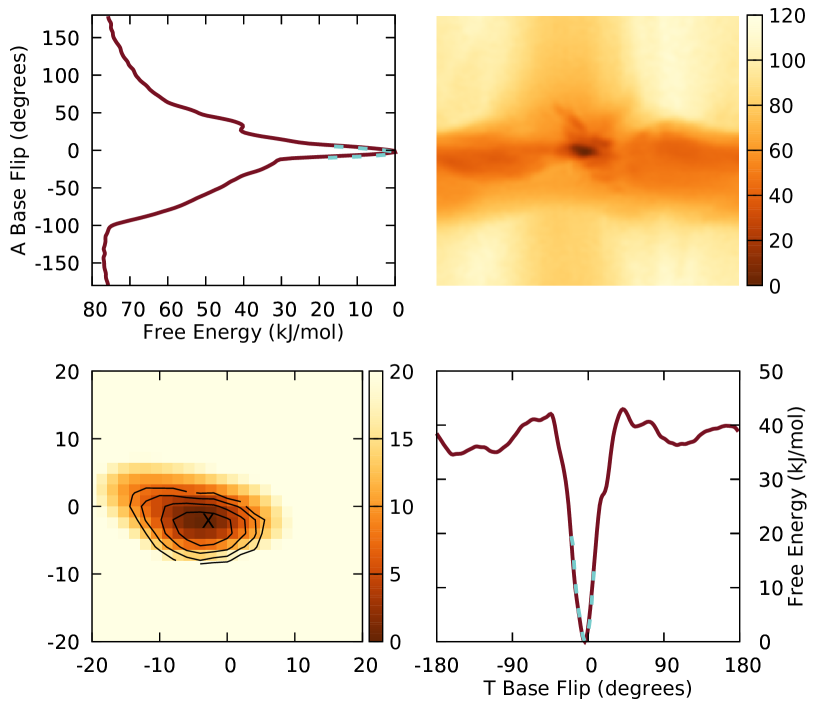
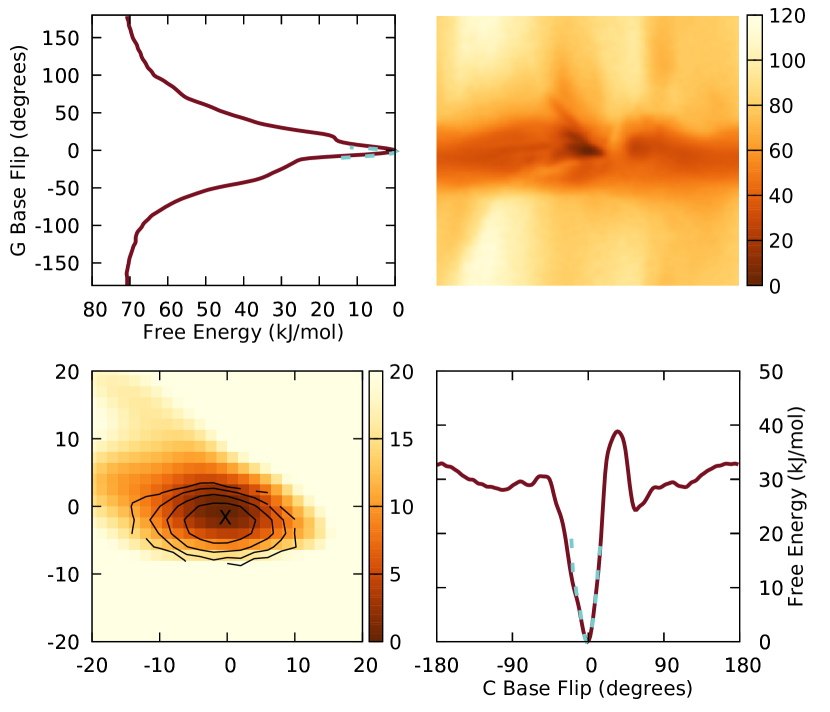
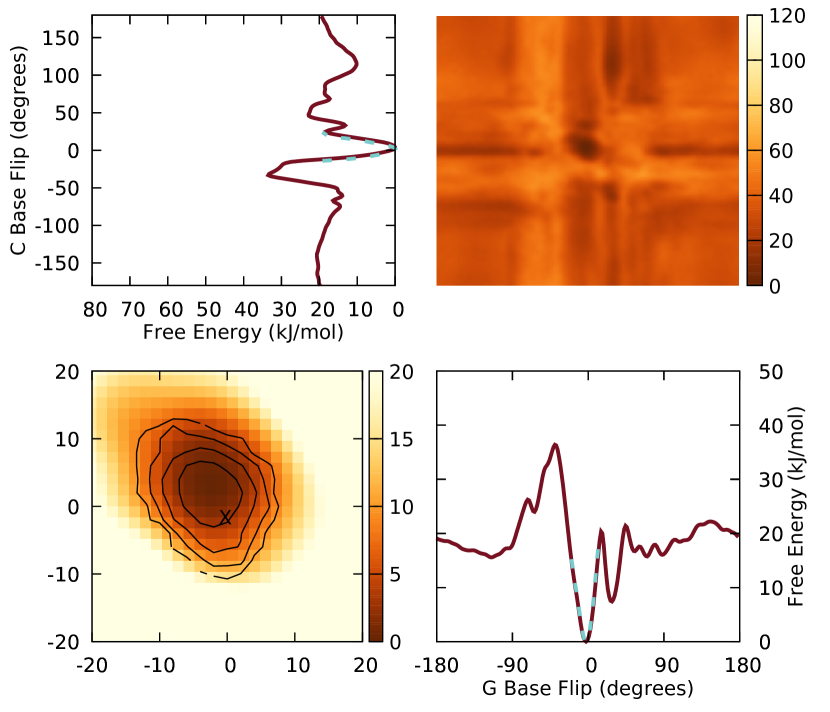
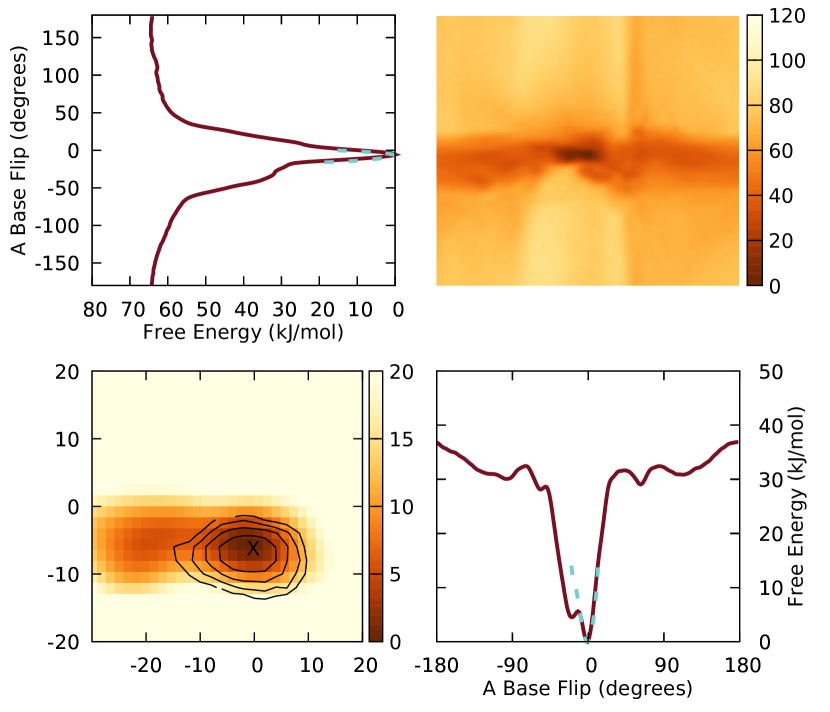
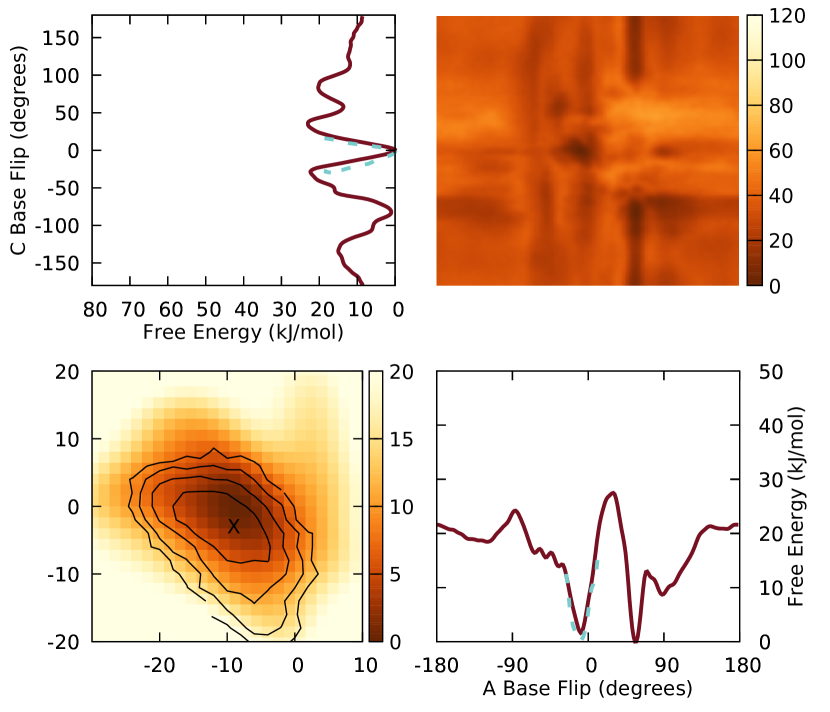
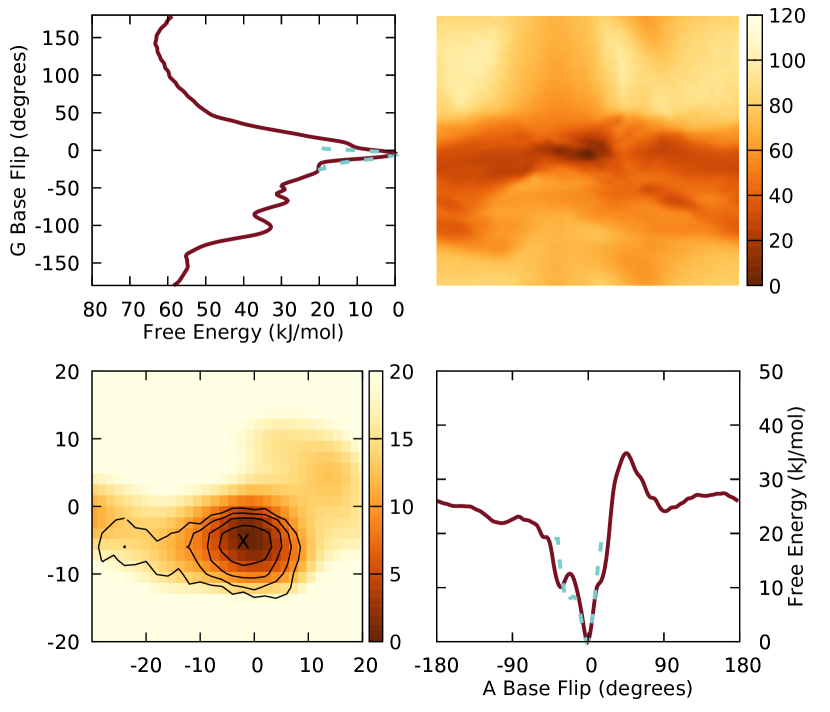
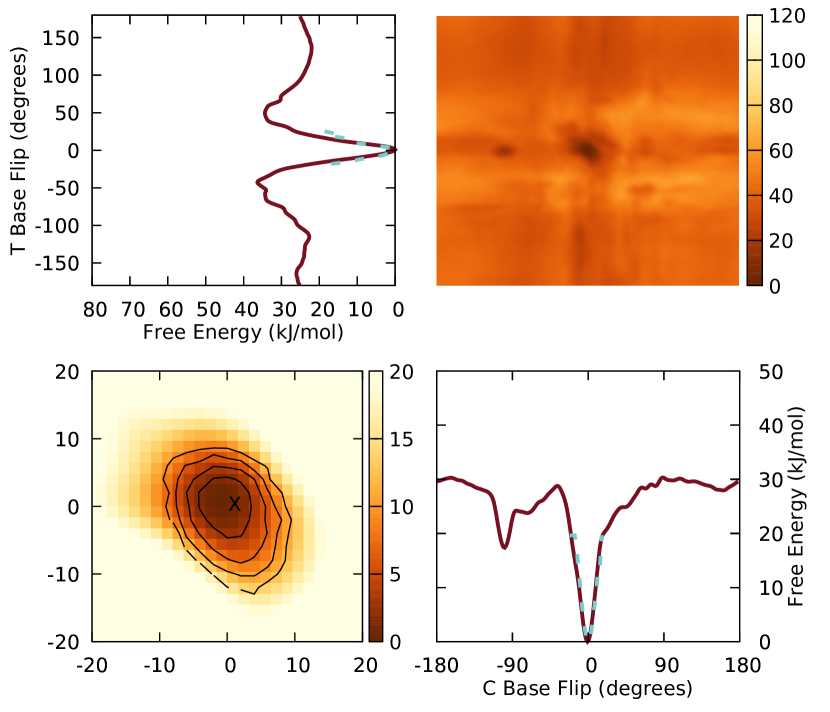
For most configurations studied, a lower-energy “plus” shape is apparent in the 2D FES, with low-energy states extending both vertically and horizontally from the global minimum. We display representative free energies in Fig. 3; the remaining profiles are shown in Figs. S6 and S7. This result indicates it is easier to flip only one base out of the polymer, rather than both simultaneously. The pairs CC and TT both exhibit two minima at the flipped-in ground states. We clustered the unbiased trajectories to identify molecular geometries corresponding to these minima: different hydrogen bonding configurations illustrated in Fig. 4. These “wobble” structures have been observed experimentally, not only for TT and CC, but for AA, CT, and GG as well. (49, 50, 51, 41, 52) In contrast, all matched pairs include a single relevant stable state with a nearly-isotropic free energy minimum. Unlike previous works (46, 48, 10, 30, 13) which calculated the free energy profiles of one flipping base, we observe a local minimum at roughly (90∘, 100∘) in most free energy profiles. This minimum is largely unexpected, especially as it produces a large impact on the difference in free energy, , between the hybridized and solvent-facing states. (Eq. 6) We display our results in Table 2. For the AC pair this secondary minimum is so prominent its free energy is lower than for the hybridized state. We cluster our metadynamics simulations from this minimum and generate a representative image. (Fig. 5) Both bases flip out of the DNA polymer and nestle into the minor groove, pointing toward the 5’ termini of the DNA. Because both bases are solvent-facing in this motif, base flip studies biasing only one base could not observe this structure.
This metastable arrangement could be an artifact of the CHARMM27 force field, as it was not parameterized to accurately describe such a structure. Nevertheless, our arrangement is consistent with the e-motif proposed by Gao et. al. (53) in their NMR study of mismatched CC pairs; this gives the possibility of our structure being an experimental possibility more weight. Previous works have investigated the e-motif for mismatch CC pairs in strands with the sequence CCG, typically in triplet repeats i.e. (CCG)N. (53, 54, 55, 56, 57, 58, 59, 60, 61) Several of these works identified intrastrand cross-linking stabilizing the motif, (57, 58, 59, 61) suggesting our restraint of neighboring base pairs increases the likelihood of observing this motif. In their molecular dynamics simulation study, Zhang et. al. (56) demonstrate the e-motif is better stacked, more compact, and allows for better packing than a structure not presenting the motif. We found the e-motif to be stable; a 100 ns unbiased simulation with the e-motif as an initial condition remained in the motif for the entire length of the simulation. Edfeldt et. al. (62) demonstrated on intrinsic sequence-dependence of the e-motif; we speculate our DNA sequence affects which pairs express or don’t express the motif. CC mismatches are some of the most difficult to be recognized by MMR proteins, (32, 33) but are the most likely to exhibit the e-motif. (55, 56, 58) One might speculate whether there is an inverse relationship between presence of the e-motif and MMR recognition.
Conclusion
Our results demonstrate large structural differences between matched and mismatched DNA base pairs. The distributions of order parameters, especially those that measure structure perpendicular to the DNA, differ more for mismatched base pairs than for the corresponding matched pairs. These parameters include stretch, shear, opening, twist, and shift. Mismatched base pairs retain fewer inter-base hydrogen bonds than matched ones. Surprisingly, we observe that structural order parameters do not seem to follow experimentally-determined MMR recognition trends. (31, 32, 33, 34) This is a qualitative result; the studies cited employ different DNA sequences and experimental methodologies, both of which could precipitate significant changes of their observed results.
Enzymes which recognize and repair base pair mismatches flip mismatched bases into their active sites. For this reason, we rotate bases out of the double helix and into solution as measured by the base flip order parameter. Our results reveal the base flip angle to be mostly uncorrelated with traditional measures of DNA structure, especially at large flipping angles.
To quantify the work required to flip a base, we compute the free energy profiles of base flip by utilizing the well-tempered metadynamics technique. Unlike previous works which bias only one base, (46, 30, 47) we encounter no systematic difference in the free energy between the hybridized and solvent-facing state for mismatched base pairs than for the corresponding matched pairs. Instead, by analyzing the base flip of both bases simultaneously, we demonstrate the presence of the rare e-motif, in which both bases are solvent-facing, nestled within the minor groove of the DNA.
Multidimensional free energy surfaces reveal the existence of diverse metastable hybridized conformations for some mismatched base pairs. These states correspond to different hydrogen bonding geometries. As expected, we do not observe multiple metastable states for the matched Watson-Crick base pairs.
Our metadynamics simulations revealed the presence of the e-motif, but our results illustrate its presence does not correlate directly with experimentally-determined binding affinities of mismatch repair enzymes, (31, 32, 33, 34) implying this motif is not sufficient to quantitatively determine the efficacy of mismatch detection. Effects contributing to mismatch detection not incorporated into our study include the direct interaction of DNA and MMR enzymes, as well as enzyme-induced DNA conformations such as bending. (15, 16, 13, 18, 17) The local DNA sequence could greatly alter the free energy landscapes, especially when determining the presence or absence of the e-motif. (62) Future research will focus on the free energy of flipping mismatched bases in the presence of repair enzymes, and with multiple DNA sequences.
Acknowledgments
The authors wish to thank Jim Pfaendtner and Patrick Burney for advice on metadynamics simulations. This work was facilitated though the use of advanced computational, storage, and networking infrastructure provided by the Hyak supercomputer system and funded by the STF at the University of Washington.
References
- Hu et al. (2017) Hu, C., Y. Zhao, H. Sun, and Y. Yang, 2017. Synergism of Dam, MutH, and MutS in methylation-directed mismatch repair in Escherichia coli. Mutat. Res.-Fund. Mol. M. 795:31–33.
- de Wind et al. (1999) de Wind, N., M. Dekker, N. Claij, L. Jansen, Y. van Klink, M. Radman, G. Riggins, M. van der Valk, K. van’t Wout, and H. te Riele, 1999. HNPCC-like cancer predisposition in mice through simultaneous loss of Msh3 and Msh6 mismatch-repair protein functions. Nat. Genet. 23:359–362.
- Kunkel and Erie (2005) Kunkel, T. A., and D. A. Erie, 2005. DNA mismatch repair. Annu. Rev. Biochem. 74:681–710.
- Iyer et al. (2006) Iyer, R. R., A. Pluciennik, V. Burdett, and P. L. Modrich, 2006. DNA mismatch repair: Functions and mechanisms. Chem. Rev. 106:302–323.
- Li (2008) Li, G.-M., 2008. Mechanisms and functions of DNA mismatch repair. Cell Res. 18:85–98.
- Kolodner et al. (1994) Kolodner, R. D., N. R. Hall, J. Lipford, M. F. Kane, M. R. S. Rao, P. Morrison, L. Wirth, P. J. Finan, J. Burn, P. Chapman, C. Earabino, E. Merchant, D. T. Bishop, J. Garber, C. E. Bronner, S. M. Baker, G. Warren, L. G. Smith, A. Lindblom, P. Tannergard, R. J. Bollag, A. R. Godwin, D. C. Ward, M. Nordenskjold, R. M. Liskay, N. Copeland, N. Jenkins, M. K. Lescoe, A. Ewel, S. Lee, J. Griffith, and R. Fishel, 1994. Human mismatch repair genes and their association with hereditary non-polyposis colon cancer. Cold Spring Harb. Sym. 59:331–338.
- Harfe and Jinks-Robertson (2000) Harfe, B. D., and S. Jinks-Robertson, 2000. DNA mismatch repair and genetic instability. Annu. Rev. Genet. 34:359–399.
- Stivers and Jiang (2003) Stivers, J. T., and Y. L. Jiang, 2003. A mechanistic perspective on the chemistry of DNA repair glycosylases. Chem. Rev. 103:2729–2760.
- Yoon et al. (1988) Yoon, C., G. G. Privé, D. S. Goodsell, and R. E. Dickerson, 1988. Structure of an alternating-B DNA helix and its relationship to A-tract DNA. Proc. Natl. Acad. Sci. USA 85:6332–6336.
- Song et al. (2009) Song, K., A. J. Campbell, C. Bergonzo, C. de los Santos, A. P. Grollman, and C. Simmerling, 2009. An improved reaction coordinate for nucleic acid base flipping studies. J. Chem. Theory Comput. 5:3105–3113.
- Lau et al. (2000) Lau, A. Y., M. D. Wyatt, B. J. Glassner, L. D. Samson, and T. Ellenberger, 2000. Molecular basis for discriminating between normal and damaged bases by the human alkyladenine glycosylase, AAG. Proc. Natl. Acad. Sci. USA 97:13573–13578.
- Stivers (2008) Stivers, J. T., 2008. Extrahelical damaged base recognition by DNA glycosylase enzymes. Chem-Eur. J. 14:786–793.
- Law and Feig (2011) Law, S., and M. Feig, 2011. Base-flipping mechanism in postmismatch recognition by MutS. Biophys. J. 101:2223–2231.
- Drake (1999) Drake, J. W., 1999. The distribution of rates of spontaneous mutation over viruses, prokaryotes, and eukaryotes. Ann. NY. Acad. Sci. 870:100–107.
- Sharma et al. (2014) Sharma, M., A. Predeus, N. Kovacs, and M. Feig, 2014. Differential mismatch recognition specificities of eukaryotic MutS homologs, MutS and MutS. Biophys. J. 106:2483–2492.
- Sharma et al. (2013) Sharma, M., A. V. Predeus, S. Mukherjee, and M. Feig, 2013. DNA bending propensity in the presence of base mismatches: Implications for DNA repair. J. Phys. Chem. B 117:6194–6205.
- Erie and Weninger (2014) Erie, D. A., and K. R. Weninger, 2014. Single molecule studies of DNA mismatch repair. DNA Repair 20:71–81.
- Vafabakhsh and Ha (2012) Vafabakhsh, R., and T. Ha, 2012. Extreme bendability of DNA less than 100 base pairs long revealed by single-molecule cyclization. Science 337:1097–1101.
- Lu and Olson (2008) Lu, X.-J., and W. K. Olson, 2008. 3DNA: A versatile, integrated software system for the analysis, rebuilding and visualization of three-dimensional nucleic-acid structures. Nat. Protoc. 3:1213–1227.
- MacKerell et al. (2000) MacKerell, A. D., N. Banavali, and N. Foloppe, 2000. Development and current status of the CHARMM force field for nucleic acids. Biopolymers 56:257–265.
- Jorgensen et al. (1983) Jorgensen, W. L., J. Chandrasekhar, J. D. Madura, R. W. Impey, and M. L. Klein, 1983. Comparison of simple potential functions for simulating liquid water. J. Chem. Phys. 79:926–935.
- Bussi et al. (2007) Bussi, G., D. Donadio, and M. Parrinello, 2007. Canonical sampling through velocity rescaling. J. Chem. Phys. 126:014101.
- Abraham et al. (2015) Abraham, M. J., T. Murtola, R. Schulz, S. Páll, J. C. Smith, B. Hess, and E. Lindahl, 2015. GROMACS: High performance molecular simulations through multi-level parallelism from laptops to supercomputers. SoftwareX 1–2:19–25.
- Miyamoto and Kollman (1992) Miyamoto, S., and P. A. Kollman, 1992. Settle: An analytical version of the SHAKE and RATTLE algorithm for rigid water models. J. Comput. Chem. 13:952–962.
- Essmann et al. (1995) Essmann, U., L. Perera, M. L. Berkowitz, T. Darden, H. Lee, and L. G. Pedersen, 1995. A smooth particle mesh Ewald method. J. Chem. Phys. 103:8577–8593.
- Cock et al. (2009) Cock, P. J. A., T. Antao, J. T. Chang, B. A. Chapman, C. J. Cox, A. Dalke, I. Friedberg, T. Hamelryck, F. Kauff, B. Wilczynski, and M. J. L. d. Hoon, 2009. Biopython: Freely available python tools for computational molecular biology and bioinformatics. Bioinformatics 25:1422–1423.
- Tribello et al. (2014) Tribello, G. A., M. Bonomi, D. Branduardi, C. Camilloni, and G. Bussi, 2014. PLUMED 2: New feathers for an old bird. Comput. Phys. Commun. 185:604–613.
- Barducci et al. (2008) Barducci, A., G. Bussi, and M. Parrinello, 2008. Well-tempered metadynamics: A smoothly converging and tunable free-energy method. Phys. Rev. Lett. 100:020603.
- Bonomi et al. (2009) Bonomi, M., A. Barducci, and M. Parrinello, 2009. Reconstructing the equilibrium Boltzmann distribution from well-tempered metadynamics. J. Comput. Chem. 30:1615–1621.
- Imhof and Zahran (2013) Imhof, P., and M. Zahran, 2013. The effect of a G:T mispair on the dynamics of DNA. PLoS ONE 8:e53305.
- Kramer et al. (1984) Kramer, B., W. Kramer, and H.-J. Fritz, 1984. Different base/base mismatches are corrected with different efficiencies by the methyl-directed DNA mismatch-repair system of E. coli. Cell 38:879–887.
- Su et al. (1988) Su, S. S., R. S. Lahue, K. G. Au, and P. Modrich, 1988. Mispair specificity of methyl-directed DNA mismatch correction in vitro. J. Biol. Chem. 263:6829–6835.
- Thomas et al. (1991) Thomas, D. C., J. D. Roberts, and T. A. Kunkel, 1991. Heteroduplex repair in extracts of human HeLa cells. J. Biol. Chem. 266:3744–3751.
- Kunkel and Erie (2015) Kunkel, T. A., and D. A. Erie, 2015. Eukaryotic mismatch repair in relation to DNA replication. Annu. Rev. Genet. 49:291–313.
- Turner et al. (1987) Turner, D. H., N. Sugimoto, R. Kierzek, and S. D. Dreiker, 1987. Free energy increments for hydrogen bonds in nucleic acid base pairs. J. Am. Chem. Soc. 109:3783–3785.
- Šponer et al. (2001) Šponer, J., J. Leszczynski, and P. Hobza, 2001. Electronic properties, hydrogen bonding, stacking, and cation binding of DNA and RNA bases. Biopolymers 61:3–31.
- Kool (2001) Kool, E. T., 2001. Hydrogen bonding, base stacking, and steric effects in DNA replication. Annu. Rev. Bioph. Biom. 30:1–22.
- Yakovchuk et al. (2006) Yakovchuk, P., E. Protozanova, and M. D. Frank-Kamenetskii, 2006. Base-stacking and base-pairing contributions into thermal stability of the DNA double helix. Nucleic Acids Res. 34:564–574.
- Khakshoor et al. (2012) Khakshoor, O., S. E. Wheeler, K. N. Houk, and E. T. Kool, 2012. Measurement and theory of hydrogen bonding contribution to isosteric DNA base pairs. J. Am. Chem. Soc. 134:3154–3163.
- Shankar et al. (2012) Shankar, A., A. Jagota, and J. Mittal, 2012. DNA base dimers are stabilized by hydrogen-bonding interactions including non-Watson–Crick pairing near graphite surfaces. J. Phys. Chem. B 116:12088–12094.
- Peyret et al. (1999) Peyret, N., P. A. Seneviratne, H. T. Allawi, and J. SantaLucia, 1999. Nearest-neighbor thermodynamics and NMR of DNA sequences with internal AA, CC, GG, and TT mismatches. Biochemistry 38:3468–3477.
- SantaLucia Jr. and Hicks (2004) SantaLucia Jr., J., and D. Hicks, 2004. The thermodynamics of DNA structural motifs. Annu. Rev. Bioph. Biom. 33:415–C–2.
- Harris and Kiang (2006) Harris, N. C., and C.-H. Kiang, 2006. Defects can increase the melting temperature of DNA-nanoparticle assemblies. J. Phys. Chem. B 110:16393–16396.
- Geyer et al. (2003) Geyer, C. R., T. R. Battersby, and S. A. Benner, 2003. Nucleobase pairing in expanded Watson-Crick-like genetic information systems. Structure 11:1485–1498.
- Laio and Gervasio (2008) Laio, A., and F. L. Gervasio, 2008. Metadynamics: A method to simulate rare events and reconstruct the free energy in biophysics, chemistry and material science. Rep. Prog. Phys. 71:126601.
- Banavali and MacKerell Jr. (2002) Banavali, N. K., and A. D. MacKerell Jr., 2002. Free energy and structural pathways of base flipping in a DNA GCGC containing sequence. J. Mol. Biol. 319:141–160.
- Yin et al. (2014) Yin, Y., L. Yang, G. Zheng, C. Gu, C. Yi, C. He, Y. Q. Gao, and X. S. Zhao, 2014. Dynamics of spontaneous flipping of a mismatched base in DNA duplex. Proc. Natl. Acad. Sci. USA 111:8043–8048.
- O’Nei and Wiest (2008) O’Nei, L. L., and O. Wiest, 2008. Structures and energetics of base flipping of the thymine dimer depend on DNA sequence. J. Phys. Chem. B 112:4113–4122.
- Kouchakdjian et al. (1988) Kouchakdjian, M., B. F. L. Li, P. F. Swann, and D. J. Patel, 1988. Pyrimidine pyrimidine base-pair mismatches in DNA. J. Mol. Biol. 202:139–155.
- Gervais et al. (1995) Gervais, V., J. A. H. Cognet, M. Le Bret, L. C. Sowers, and G. V. Fazakerley, 1995. Solution structure of two mismatches AA and TT in the K-ras gene context by nuclear magnetic resonance and molecular dynamics. Eur. J. Biochem. 228:279–290.
- Boulard et al. (1997) Boulard, Y., J. A. H. Cognet, and G. V. Fazakerley, 1997. Solution structure as a function of pH of two central mismatches, CT and CC, in the 29 to 39 K-ras gene sequence, by nuclear magnetic resonance and molecular dynamics. J. Mol. Biol. 268:331–347.
- He et al. (2011) He, G., C. K. Kwok, and S. L. Lam, 2011. Preferential base pairing modes of TT mismatches. FEBS Lett. 585:3953–3958.
- Gao et al. (1995) Gao, X., X. Huang, G. K. Smith, M. Zheng, and H. Liu, 1995. New antiparallel duplex motif of DNA CCG repeats that is stabilized by extrahelical bases symmetrically located in the minor groove. J. Am. Chem. Soc. 117:8883–8884.
- Zheng et al. (1996) Zheng, M., X. Huang, G. K. Smith, X. Yang, and X. Gao, 1996. Genetically unstable CXG repeats are structurally dynamic and have a high propensity for folding. An NMR and UV spectroscopic study. J. Mol. Biol. 264:323–336.
- Yu et al. (1997) Yu, A., M. D. Barron, R. M. Romero, M. Christy, B. Gold, J. Dai, D. M. Gray, I. S. Haworth, and M. Mitas, 1997. At physiological pH, d(CCG)15 forms a hairpin containing protonated cytosines and a distorted helix. Biochemistry 36:3687–3699.
- Zhang et al. (2017) Zhang, Y., C. Roland, and C. Sagui, 2017. Structure and dynamics of DNA and RNA double helices obtained from the GGGGCC and CCCCGG hexanucleotide repeats that are the hallmark of C9FTD/ALS diseases. ACS Chem. Neurosci. 8:578–591.
- Chou et al. (2003) Chou, S.-H., K.-H. Chin, and A. H.-J. Wang, 2003. Unusual DNA duplex and hairpin motifs. Nucleic Acids Res. 31:2461–2474.
- Romero et al. (1999) Romero, R. M., M. Mitas, and I. S. Haworth, 1999. Anomalous cross-linking by mechlorethamine of DNA duplexes containing C–C mismatch pairs. Biochemistry 38:3641–3648.
- Edfeldt et al. (2004a) Edfeldt, N. B. F., E. A. Harwood, S. T. Sigurdsson, P. B. Hopkins, and B. R. Reid, 2004. Solution structure of a nitrous acid induced DNA interstrand cross‐link. Nucleic Acids Res. 32:2785–2794.
- Renc̆iuk et al. (2011) Renc̆iuk, D., J. Kypr, and M. Vorlíc̆ková, 2011. CGG repeats associated with fragile X chromosome form left-handed Z-DNA structure. Biopolymers 95:174–181.
- Rojsitthisak et al. (2001) Rojsitthisak, P., R. M. Romero, and I. S. Haworth, 2001. Extrahelical cytosine bases in DNA duplexes containing d[GCC]nd[GCC]n repeats: detection by a mechlorethamine crosslinking reaction. Nucleic Acids Res. 29:4716–4723.
- Edfeldt et al. (2004b) Edfeldt, N. B. F., E. A. Harwood, S. T. Sigurdsson, P. B. Hopkins, and B. R. Reid, 2004. Sequence context effect on the structure of nitrous acid induced DNA interstrand cross‐links. Nucleic Acids Res. 32:2795–2801.
DNA Base Pair Mismatches Induce Structural Changes and Alter the Free Energy Landscape of Base Flip:
SUPPLEMENTARY INFORMATION
A. Kingsland1 and L. Maibaum1
1Department of Chemistry, University of Washington, Seattle, WA, USA
Supplementary References
-
1.
Lu, X.-J., and W. K. Olson, 2008. 3DNA: A versatile, integrated software system for the analysis, rebuilding and visualization of three-dimensional nucleic-acid structures. Nat. Protoc. 3:1213-1227.