Profiling MOOCs from viewing perspective
Zheng Xie1,♯ Xiao Xiao2 Jianping Li1 Jinying Su1
1 College of Arts and Sciences, National University of Defense Technology, Changsha, China
2 iCourse, Higher Education Press, Beijing, China
♯ xiezheng81@nudt.edu.cn
The authors have contributed equally to this work.
Abstract
We profiled three aspects of MOOCs from the perspective of viewing behaviors, the most prominent and common ones of MOOC learning. They were learner classification, course attraction, teaching order and learning order. Based on viewing behavior data, we provided a non-parametric algorithm to categorize learners, which helped to narrow the scope of finding potential all-rounders, and a method to measure the correlations between teaching order and learning order, which helped to assign teaching contents. Using information entropy, we provided an index to measure course attraction, which integrated the viewing time invested on courses and the number of viewed course videos. This index describes the diminishing marginal utility of repeated viewing and the increasing information of viewing new videos. It has potential to be an auxiliary method of assessing course achievements.
Introduction
Massive open online courses (MOOCs) have emerged from the integration of education and the Internet[1]. They break the boundaries of time and space, expanding traditional education due to their transmission of information by the Internet technology. And they have been viewed as an accelerator for learning and a solution to educational resource imbalance[2, 3]. Differences between traditional courses and MOOCs lie in several dimensions, involving conditions of admission (pretesting vs. no-condition), student motivations (homogeneous vs. heterogeneous), classroom management (supervised vs. unsupervised), interactions (face-to-face vs. online), dropout rates (low vs. high)[4, 5]. Moreover, MOOCs are featured as learner-centered, which is different from the knowledge-centered feature of traditional education. Therefore, understanding MOOC learning behaviors helps to assess MOOC achievements, to find methods of improving MOOC quality, and so on.
Analyzing MOOC learning behaviors has become a hot topic in the MOOC community, which includes learning motivations, learning achievements, and so on[6, 7, 8, 9]. MOOC learners are motivated not just to pass exams which involve understanding particular concepts, or some parts of course contents[10, 11, 12, 13]. Their diversified expectations and motivations to learn MOOCs result in high course dropout rates and low exam participation rates[18, 14, 15, 16, 17]. Viewing behaviors are the most prominent and common in MOOC learning, compared with other behaviors such as doing exercises, discussing and testing. Therefore, profiling MOOCs from viewing perspective can involve as many learners as possible.
We profiled MOOCs from viewing perspective in following three aspects. Firstly, we provided a method to categorize learners into two types, which helped to narrow the search range of potential all-rounders. Secondly, we provided an index to measure course attraction based on course learners’ the number of viewed videos (calculated in a continuous way) and their relative viewing time length compared with video length. Thirdly, we provided a method to measure the correlations between teaching order and learning order based on learners’ viewing order and video labels, which helped to optimize teaching content assignment.
MOOC learners’ behavior data cannot inherently pose answers to assess courses because the causal relationship between learning more and learning better is unclear[33]. So our results might not be the exact MOOC contributions to learners. However, the low values of those indexes can help us to find some imperfect aspects of some MOOCs. Note that the order correlation cannot be applied to humanities courses, but can to natural science courses.
This paper is organized as follows. The data are described in Section 2. The indexes such as entropy are described in Section 3. The indexes of attractions and those of the correlations between teaching order and learning order are described in Sections 4 and 5. The conclusion is drawn in Section 6.
Viewing behavior data
MOOC platform iCourse (http://www.icourse163.org) provided the viewing behavior data of eight courses (01/01/2017–10/11/2017). The courses were selected from natural sciences, social sciences, humanities and engineering technology. Each course had substantial registrants so that our results were statistically meaningful. The data included time length of each video. For each learner, the data included the viewing start time and the viewing time length of each video he viewed.
Since some selected courses were not finished before 10/11/2017, our discussions focused on the measurements of course attractions on the level of videos, and on the measurements of correlations between teaching order and viewing order, to which the data of some weeks were adequate. Videos could only be downloaded by iCourse app. If the app disconnected to the Internet, the information of viewing downloaded videos cannot be collected. Accordingly, our discussions only involved online viewing behaviors of MOOCs.
| Course | Course Id | ||||||
|---|---|---|---|---|---|---|---|
| Calculus | 1002301004 | 2,955 | 129 | 8.081 | 0.998 | 0.189 | 2 |
| Game theory | 1002223009 | 4,764 | 38 | 7.141 | 2.238 | 0.427 | 66 |
| Finance | 1002301014 | 6,380 | 63 | 5.368 | 1.310 | 0.330 | 2 |
| Psychology | 1002301008 | 3,827 | 26 | 5.008 | 0.913 | 0.204 | 59 |
| Spoken English | 1002299019 | 11,719 | 46 | 3.032 | 0.321 | 0.106 | 7 |
| Etiquette | 1002242007 | 3,846 | 41 | 7.787 | 1.271 | 0.205 | 22 |
| C Language | 1002303013 | 17,541 | 81 | 12.47 | 1.541 | 0.142 | 39 |
| Python | 1002235009 | 13,417 | 53 | 10.32 | 0.896 | 0.087 | 28 |
Index : the number of learners, : the number of videos, : the number of videos viewed by per learner, : the viewing time length per learner (unit: hour), : the time length per video (unit: hour), and : the number of all-rounders.
Specific statistical indexes of viewing behaviors were listed in Table 1, which can be used to measure the influence of video lengths on completion rates of viewing videos. Suppose learners view a course with videos . For each leaner (), denote the label set of he viewed videos as . For each video (), denote the label set of learners who viewed it as . Denote the time length of video as , the time length of learner viewing as .
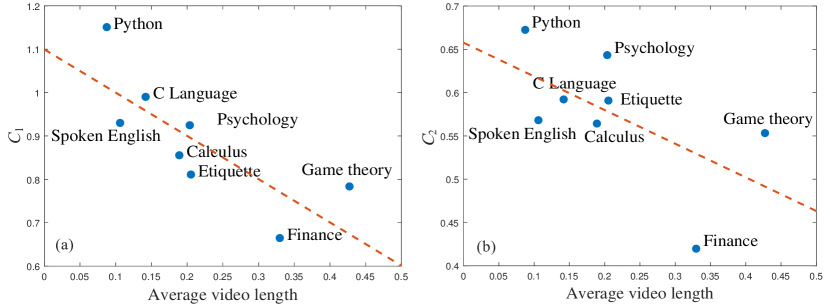
Calculate the relative viewing time length (compared with video lengths) per learner, and the number of videos viewed by per learner. Under the hypothesis that learners tend to view whole videos, the ratio between these two averages measures the completion rate of viewing videos per learner. This rate can also be measured by at the same hypothesis. Both and negatively correlate to average video length (Fig. 1). In fact, human attention spans are limited. A long video is hard to attract learner attentions from beginning to end. It means a long video’s content should be carefully designed if its length cannot be shortened.
Categorization of learners
Learners’ attention spans related to a course are different. Some are motivated to learn the whole courses, and others part of contents[19, 20, 21]. Therefore, learners can be sketchily categorized as two viewing types, namely segment-learners and potential all-rounders. Discussing the factors of dropout and engagement for segment-learners has limited insight, but is meaningful for potential all-rounders. To narrow the scope of finding potential all-rounders, we provided a non-parametric method of categorizing learners based on their viewing time length.
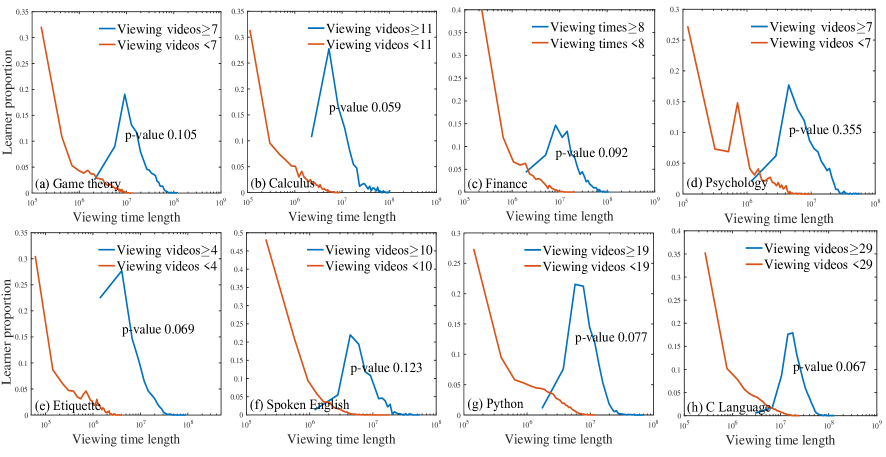
Table 1 showed the number of all-rounders is very small for each course. However, even the learners, who decided to complete a course, might not view all videos. For such a learner, his tenacity of viewing videos could be compared to a unit whose failure mode is of a fatigue-stress nature. The life of such a unit follows a lognormal distribution[22]. And the tenacity of a learner could be measured by his viewing time length. We labelled the learners whose viewing time length follows a lognormal distribution as lognormal-rounders. In Table 2, we provided an algorithm to recognize them. Fig. 2 showed the results of the algorithm applied to the empirical data. Specific statistical indexes of the two types of learners were listed in Table 3.
| Input: the viewing time length and the number of viewed videos of learners . |
|---|
| For from to do: |
| Do KS test for of the learners satisfying with the null hypothesis that |
| they follow a lognormal distribution; |
| Break if the test cannot reject the null hypothesis at significance level . |
| Output: the current (denoted as ). |
The unit of time is millisecond. If then is labelled as a lognormal-rounder.
| Course | Category | ||||||
|---|---|---|---|---|---|---|---|
| Calculus | 569 | 28.120 | 3.848 | 4.078 | 23.06 | ||
| 2,386 | 3.302 | 0.319 | 1.083 | 2.385 | |||
| Game theory | 1,522 | 16.86 | 5.919 | 3.578 | 14.13 | ||
| 3,242 | 2.581 | 0.510 | 0.872 | 1.689 | |||
| Finance | 1,057 | 21.54 | 5.501 | 3.820 | 16.20 | ||
| 5,323 | 2.157 | 0.478 | 0.602 | 1.276 | |||
| Psychology | 799 | 15.30 | 3.100 | 3.531 | 13.30 | ||
| 3,028 | 2.294 | 0.336 | 0.648 | 1.643 | |||
| Spoken English | 583 | 19.61 | 2.426 | 3.724 | 18.45 | ||
| 11,136 | 2.164 | 0.211 | 0.636 | 1.670 | |||
| Etiquette | 2,084 | 12.95 | 2.213 | 3.084 | 10.80 | ||
| 1,762 | 1.683 | 0.157 | 0.469 | 1.035 | |||
| C Language | 2,367 | 46.57 | 6.609 | 5.161 | 43.24 | ||
| 15,174 | 7.147 | 0.750 | 1.827 | 5.833 | |||
| Python | 2,549 | 28.76 | 2.748 | 4.475 | 28.75 | ||
| 10,868 | 5.600 | 0.461 | 1.791 | 5.243 |
: lognormal-learners, : other learners, : the number of learners, : the number of videos viewed by per learner, : the viewing time length per learner (unit: hour), : the entropy per learner, and : the geometric mean (2) per learner.
MOOC attraction measurements
When a learner views a course, we can regard the video he chooses to view as a random event, and so the label of the chosen video as a random variable. When the order of course contents is ignored, the more videos a learner views, the more even his viewing time distributes, then the higher the uncertainty of which video is viewed in a viewing event is. Entropy can be used to measure the uncertainty[23]. Denote to be the label of the video chosen by a viewing event of learner . The probability of choosing video is , and so the entropy of is
| (1) |
We can see that if views a new video in a short time, then increases a little. Therefore, the number of videos viewed by can be measured by in a continuous way, which overcomes the shortcoming brought by the discreteness of counting viewed videos.
The entropy is free of the viewing time length . However, the attraction of a course to a learner often positively correlates to the time he spent on the course. We should integrate his entropy and viewing time length into one index to measure the attraction to him. If the lengths of all videos are equal, the unit of and that of the relative viewing time length are the same, namely the length of one video. Hence we can use their geometric mean as an index of measuring course attraction:
| (2) |
The reasonability of the formula (2) could be illustrated through following examples.
Learner viewed video with time length , then his entropy , and geometric mean . If he viewed and with time length , , then , . If , , then , . If he viewed , with time length , , then , . As above schematic examples showed, the geometric mean profiles the diminishing marginal utility in learning, because . Formula (2) also profiles the increasing process of information in the process of viewing new videos, because .
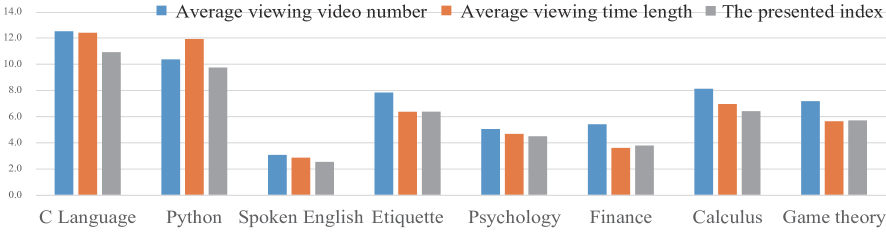
The eight courses were selected from different fields. Some popular courses, such as Python, Spoken English, can attract numerous learners. Meanwhile, some theoretical courses, e. g. Calculus, can hardly attract the learners without corresponding prior knowledge. Hence, to compare attractions of courses from different fields, it is suitable to use the average of the geometric means over all learners , which removes the heterogeneity of course learner numbers. Fig. 3 showed that this average positively correlated to the number of videos viewed by per learner and to the viewing time length per learner, which fits the common sense: view more and longer, be attracted deeper.
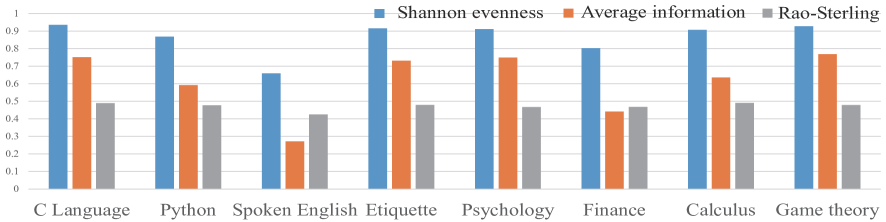
Now let us discuss the balance of a course’s attraction over videos. Consider a course with videos , and denote to be the length of viewing time spent by course learners on (). Then the entropy profiles the attraction balance of the course (Fig. 4), where . However, courses could have different video numbers. Suppose two courses’ viewing time are all distributed uniformly on videos. Then the entropy of the course with more videos is larger than that of the course with fewer videos. Therefore, to compare the attraction balances of courses, we should remove the heterogeneity of the video numbers of courses, which can be achieved by Shannon evenness [24], or by (Fig. 5).
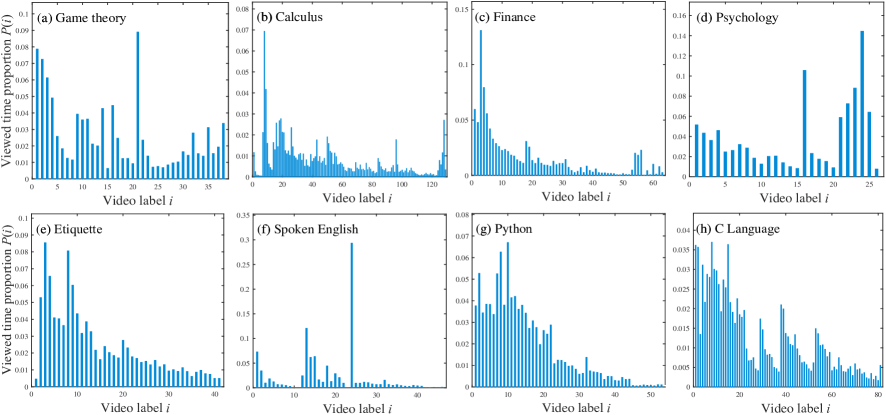
The two indexes of balance remove the heterogeneity of learner numbers and that of video numbers. These indexes of Spoken English were relatively low, which is due to that 30% viewing time was attracted by one video (Fig. 3(f)). For a course, low indexes of balance imply that the course cannot attract learners persistently, and so its teachers could improve the contents of less viewed videos. Rao-Sting operator [25] (where for all possible and ) can also portray the balance of a viewing time distribution, but it does not take into account the difference of course video numbers.
Correlation between teaching order and viewing order
Designing teaching order is fundamental in pedagogy. MOOC education is learner-driven rather than knowledge-oriented. The correlation between teaching order and learning order affects course quality. Learning order can be reflected by viewing order, especially when learners are unsupervised. Teaching order can be expressed by video labels. If nearly viewed videos have close labels, the learning order is consistent with the teaching order. Surely, the order correlation is not meaningful to some humanities courses such as Spoken English, but is important to some natural science courses such as Calculus.
We provided a method to measure the order correlation. For each leaner , we measured the viewing correlation between any two videos and (the set of videos he viewed) through , where is a nonnegative and decreasing function, and are the start times of viewing and respectively. A small value of implies it is likely to exist a viewing order between and . For each video , we calculated the weighted summation
| (3) |
The correlation coefficient between video label and the weighted summation (3) measures the correlation between teaching order and viewing order. Here we let , and calculated three widely used correlation coefficients[26, 27] for the eight courses. Fig. 6 showed that the three correlation coefficients of Spoken English were relatively low, which is consistent with common senses. However, if these correlation coefficients of a mathematic course are low, then the teaching order of the course needs to be redesigned.
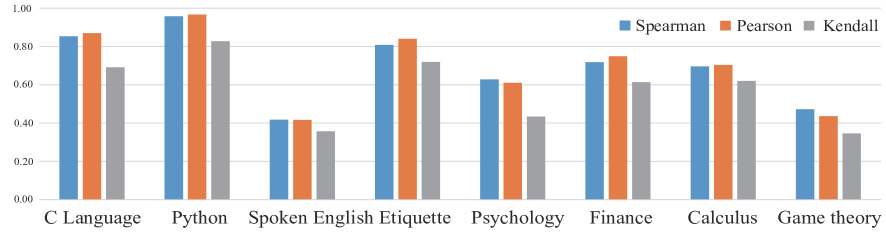
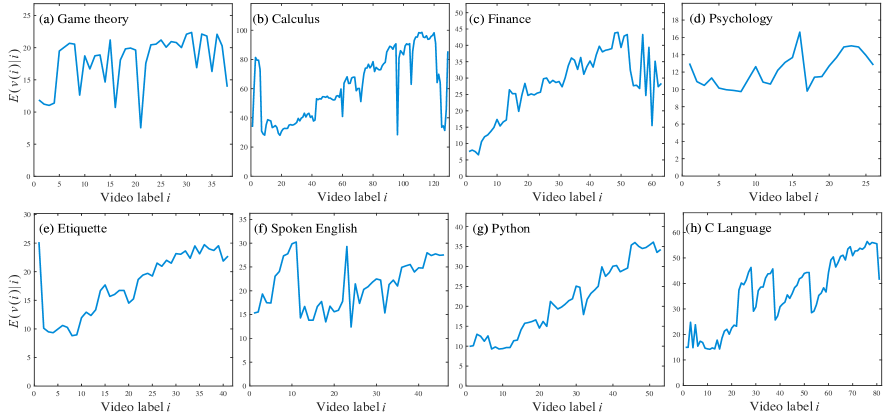
Note that the Pearson coefficient indicates the strength of a linear relationship between two variables and , unless the conditional expected value of given (denoted as ) is linear or approximate linear in , and verse vice. The visual examinations shown in Fig. 7 guaranteed the effectiveness of correlation analysis addressed here.
Discussion and conclusions
MOOCs are examples of learner-centered and autonomous learning. MOOC learning behaviors tend to be individual, unsupervised, and nonintervened. Human behaviors in such situations often reveal what they are. Therefore, one could have faith in the reliability of viewing behavior data. We employed viewing behavior data to categorize learners, to assess course attractions and the correlations between teaching order and learning order. The practicability of our methods is validated with the empirical data provided by iCourse. Our results help to understand the rules of human cognition behaviors on the Internet.
Our methods need further improvement. In terms of data application, learning preferences should be addressed in learning pattern recognition, which helps teachers to implement individualized education. In terms of pedagogy, studying autonomous and learner-centered MOOC learning helps the development of constructivism theory[28, 29] and provides cases for online pedagogy. In terms of data fusion, testing and certificating behaviors should be considered in MOOC profile, which contribute to assess learning achievements. The analysis of correlations between these behaviors and viewing behaviors helps to inference the achievements of the learners without certifications and test scores.
We finished our study by asking a question: How to assess MOOCs. The indexes to assess traditional courses are inappropriate for profiling MOOC quality such as course completion rate[30]. It is, therefore, necessary to design new indexes to assess MOOCs in their own way. Assessing a course is in essence to determine the degree to which its teaching reaches its goal[31], and so inextricably connects with learning quality of its learners[32], learner engagements[33, 34], learning patterns[35, 36, 37], and achievements[38, 39]. Therefore, learning achievements contributes to MOOC quality, and so our results have potential to be indexes of MOOC assessments.
Funding
ZX acknowledges support from National Science Foundation of China (NSFC) Grant No. 61773020.
References
- 1. Breslow L, Pritchard DE, DeBoer J, Stump GS, Ho AD, Seaton DT (2013) Studying learning in the worldwide classroom research into edx’s first MOOC. Res Pract Assess 8: 13-25.
- 2. Reich J (2015) Rebooting MOOC research. Science 347(6217): 34-35.
- 3. Emanuel EJ (2013) Online education: MOOCs taken by educated few. Nature 503(7476), 342-342.
- 4. Murphy R, Gallagher L, Krumm A, Mislevy J, Hafter A, Research on the use of Khan Academy in schools (SRI Education, Menlo Park, CA, 2014).
- 5. Anderson A, Huttenlocher D, Kleinberg J, Leskovec J (2014, April) Engaging with massive online courses. In Proceedings of the 23rd international conference on World wide web (pp. 687-698). ACM.
- 6. Hew KF, Cheung WS (2014) courses (MOOCs): Motivations and challenges. Educ Res Rev 12, 45-58.
- 7. Meyer JP, Zhu S (2013) Fair and equitable measurement of student learning in MOOCs: An introduction to item response theory, scale linking, and score equating. Res Pract Assess 8: 26-39.
- 8. DeBoer J, Ho AD, Stump GS, Breslow L (2014) Changing “course” reconceptualizing educational variables for massive open online courses. Educ Res 43(2): 74-84.
- 9. Jona K, Naidu S (2014) MOOCs: emerging research. Dist Educ 35(2): 141-144.
- 10. de Barba PG, Kennedy GE, Ainley MD (2016) The role of students’ motivation and participation in predicting performance in a MOOC. J Comput Assist Learn 32(3), 218-231.
- 11. Watted A, Barak M (2018) Motivating factors of mooc completers: comparing between university-affiliated students and general participants. Int High Educ 37, 11-20.
- 12. Zheng S, Rosson MB, Shih PC, Carroll JM (2015) Understanding student motivation, behaviors and perceptions in MOOCs. Proceedings of the 18th ACM conference on computer supported cooperative work & social computing (pp. 1882-1895). ACM.
- 13. Barak M, Watted A, Haick H (2016) Motivation to learn in massive open online courses: Examining aspects of language and social engagement. Comput Educ 94, 49-60
- 14. Onah DF, Sinclair J, Boyatt R (2014) Dropout rates of massive open online courses: behavioural patterns. EDULEARN14 proceedings 5825-5834.
- 15. de Freitas SI, Morgan J, Gibson D (2015) Will MOOCs transform learning and teaching in higher education? Engagement and course retention in online learning provision. Br J Educ Technol 46(3), 455-471.
- 16. Greene JA, Oswald CA, Pomerantz J (2015) Predictors of retention and achievement in a massive open online course. Am Educ Res J 52(5), 925-955.
- 17. Liyanagunawardena TR, Adams AA, Williams SA (2013). MOOCs: A systematic study of the published literature 2008-2012. Int Rev Res Open Dist Learn 14(3), 202-227.
- 18. Hone KS, Said GRE (2016) Exploring the factors affecting MOOC retention: A survey study. Comput Educ 98, 157-168.
- 19. Wang Y, Baker R (2015) Content or platform: Why do students complete MOOCs? MERLOT Journal of Online Learning and Teaching 11, 17-30.
- 20. Jordan K (2014) Initial trends in enrolment and completion of massive open online courses. Int Rev Res Open d Dist Learn 15, 133-160.
- 21. Alraimi KM, Zo H, Ciganek AP (2015) Understanding the moocs continuance: the role of openness and reputation. Comput Educ 80, 28-38.
- 22. Gaddum JH (1945) Lognormal distributions. Nature 156(3964), 463.
- 23. Shannon CE, Weaver W. Mathematical theory of communication. University of Illinois press. 2002.
- 24. Pielou E (1969) An introduction to mathematical ecology. New York, NY: Wiley.
- 25. Stirling A (2007) A general framework for analyzing diversity in science, technology and society. J Roy Soc Interf 4(5), 707-719.
- 26. Kendall MG (1934) Rank correlation methods. Br J Psychol 25(1), 86-91.
- 27. Hollander M, Wolfe DA (1973) Nonparametric Statistical Methods. Wiley.
- 28. Tobias S, Duffy TM (2009) Constructivist instruction: Success or failure? Routledge.
- 29. Huang HM (2002) Toward constructivism for adult learners in online learning environments. Br J Educ Technol 33(1), 27-37.
- 30. Sandeen C (2013) Assessment’s Place in the New MOOC World. Res Pract Assess 8: 5-12.
- 31. Tyler RW. Basic principles of curriculum and instruction. University of Chicago press. 2013.
- 32. Allen MJ, Yen WM (1979). Introduction to measurement theory. Monterey, CA: Brooks/Cole.
- 33. Henrie CR, Halverson LR, Graham CR (2015) Measuring student engagement in technology-mediated learning: A review. Comput Educ 90, 36-53.
- 34. Hew KF (2016) Promoting engagement in online courses: What strategies can we learn from three highly rated MOOCs. Br J Educ Technol 47(2), 320-341.
- 35. Li LY, Tsai CC (2017) Accessing online learning material: Quantitative behavior patterns and their effects on motivation and learning performance. Comput Educ 114: 286-297.
- 36. Kizilcec RF, Piech C, Schneider E (2013, April). Deconstructing disengagement: analyzing learner subpopulations in massive open online courses. In Proceedings of the third international conference on learning analytics and knowledge (pp. 170-179). ACM.
- 37. Evans BJ, Baker RB, Dee TS (2016) Persistence patterns in massive open online courses (MOOCs). J High Educ, 87, 206-242.
- 38. Cheng G, Chau J (2016) Exploring the relationships between learning styles, online participation, learning achievement and course satisfaction: An empirical study of a blended learning course. Br J Educ Technol 47(2), 257-278.
- 39. Coetzee D, Fox A, Hearst, MA, Hartmann B (2014, February) Should your MOOC forum use a reputation system?. In Proceedings of the 17th ACM conference on Computer supported cooperative work & social computing (pp. 1176-1187). ACM.