Reducing detrimental electrostatic effects in Casimir-force measurements and Casimir-force-based microdevices
Abstract
It is well known that residual electrostatic forces create significant difficulties to precise measurements of the Casimir force and to wide use of Casimir-operated microdevices. We experimentally demonstrate that with the help of Ar-ion cleaning of the surfaces it is possible to make electrostatic effects negligibly small as compared to the Casimir interaction. Our experimental setup consists of the dynamic atomic force microscope supplemented with an Ar-ion gun and argon reservoir. The residual potential difference between the Au-coated surfaces of a sphere and a plate was measured both before and after the in situ Ar-ion cleaning. It is shown that this cleaning decreases the magnitude of the residual potential by up to an order of magnitude and makes it almost independent on separation. The gradient of the Casimir force was measured using ordinary samples subjected to the Ar-ion cleaning. The obtained results are shown to be in good agreement with both previous precision measurements using the specially selected samples and with theoretical predictions of the Lifshitz theory. The conclusion is made that the suggested method of in situ Ar-ion cleaning is effective in reducing the electrostatic effects and therefore is a great resource for experiments on measuring the Casimir interaction and for Casimir-operated microdevices.
I Introduction
During the last few years a great progress has been made in precision measurements of the Casimir interaction caused by the zero-point and thermal fluctuations of the electromagnetic field (see the most precision experiments with conductor test bodies 23 ; 24 ; 25 ; 25a ; 25b ; 26 ; 27 ; 28 ; 29 ; 30 and reviews 36 ; 37 ). This has raised a question on the possibility of using the Casimir force in various micro- and nanoelectromechanical devices which find expanding applications in fundamental science, engineering and industry. As was understood decades ago 1 ; 2 , with shrinking dimensions of microdevices to hundreds and tens nanometers the fluctuation-induced van der Waals 3 and Casimir 4 forces should make a pronounced effect on their functionality. However, fifteen years have passed after publication of Refs. 1 ; 2 before the first microdevices driven by the Casimir force were demonstrated 5 ; 6 . This gave impetus to research devoted to the role of stiction 7 ; 8 , electrostatic effects 9 , surface roughness 10 ; 11 ; 12 , geometry and dielectric properties of materials 13 ; 14 , and phase transformations 15 in nanotechnological systems exploiting the Casimir force for their functionality. Various possibilities to create the Casimir switch have also been discussed 16 ; 17 . Finally, Casimir forces acting on a micromechanical chip and between silicon nanostructures were experimentally demonstrated 18 ; 19 . Hence, the engineering and industrial applications of the Casimir microdevices are within sight.
There is, however, a fundamental problem that plagued both the investigation of the Casimir forces and their application in nanodevices. It is connected with the existence of the residual electrostatic forces acting between two grounded metallic bodies in vacuum. They originate from the surface patches due to the polycrystal structure of a metal, impurities, dust, surface contaminants and resulting work-function inhomogeneities, and may significantly distort the magnitude of the Casimir force. In fact the electric forces caused by the distribution of patch potentials depend critically on the surface preparation and may at times be negligibly small and at other times relatively large, as compared to the measured force (see Refs. 20 ; 21 and literature therein). They should be taken into account in any measurement of small forces between the closely spaced metallic surfaces, e.g., the gravitational force 22 .
In measurements of the Casimir interaction the electrostatic force due to surface patches manifests itself as a dependence of the residual potential difference on the separation between the surfaces. In the most precise experiments on measuring the gradient of the Casimir force between a sphere and a plate (or the effective Casimir pressure between two parallel plates) made of Au 23 ; 24 ; 25 ; 26 or Au and Ni 27 ; 28 ; 29 the residual potential difference was demonstrated to be independent of separation. This was achieved through the rejection of all samples possessing the separation-dependent residual potentials. Note that in the difference measurement of the Casimir force 30 (experiments of this kind have been proposed in Refs. 31 ; 32 ; 33 ) the role of surface patches was largely eliminated. In fact a rejection of many of the prepared samples is a plausible strategy when speaking about some unique fundamental experiment. Such an approach is, however, not acceptable in the day-to-day fabrication and operation of microdevices driven by the Casimir force. Thus, the problem of surface patches in Casimir physics calls for further investigation.
In this paper, we demonstrate the method allowing nearly full elimination of the electrostatic effects in the Casimir-operated microdevices. We use the experimental setup on measuring the gradient of the Casimir force between two Au-coated surfaces of a sphere and a plate by means of dynamic atomic force microscope described in Refs. 26 ; 27 ; 28 ; 29 . The main modification we made in this setup is that the vacuum chamber was equipped for doing the cleaning of sphere and plate surfaces by means of argon ion beam. It has been known that an interaction with a controlled ionized Ar beam can be used for an improvement of the surface quality including the removal of impurities and contaminants 34 . The ion beam cleaning is commonly used in the manufactoring of electronic devices. According to our results, the multistep Ar-ion cleaning of the ordinary (contaminated) plate and sphere surfaces leads to up to an order of magnitude decrease of the residual potential and significantly weakens its dependence on separation. As a consequence, the electrostatic force becomes negligibly small comparing to the Casimir force and not detrimental for the functionality of a microdevice. We also perform measurements of the gradient of the Casimir force and the effective Casimir pressure between two parallel plates using the cleaned samples and demonstrate good agreement with both experimental and theoretical results of Refs. 23 ; 24 ; 25 ; 26 ; 27 ; 28 ; 29 obtained with specially selected samples. Thus, the suggested method opens up novel avenues in measuring the Casimir interaction and for application of the Casimir force in nanotechnology.
The paper is organized as follows. In Sec. II we present the brief description of the experimental setup. Section III contains the experimental results and their comparison with theory. In Sec. IV the reader will find our conclusions and discussion.
II The experimental setup
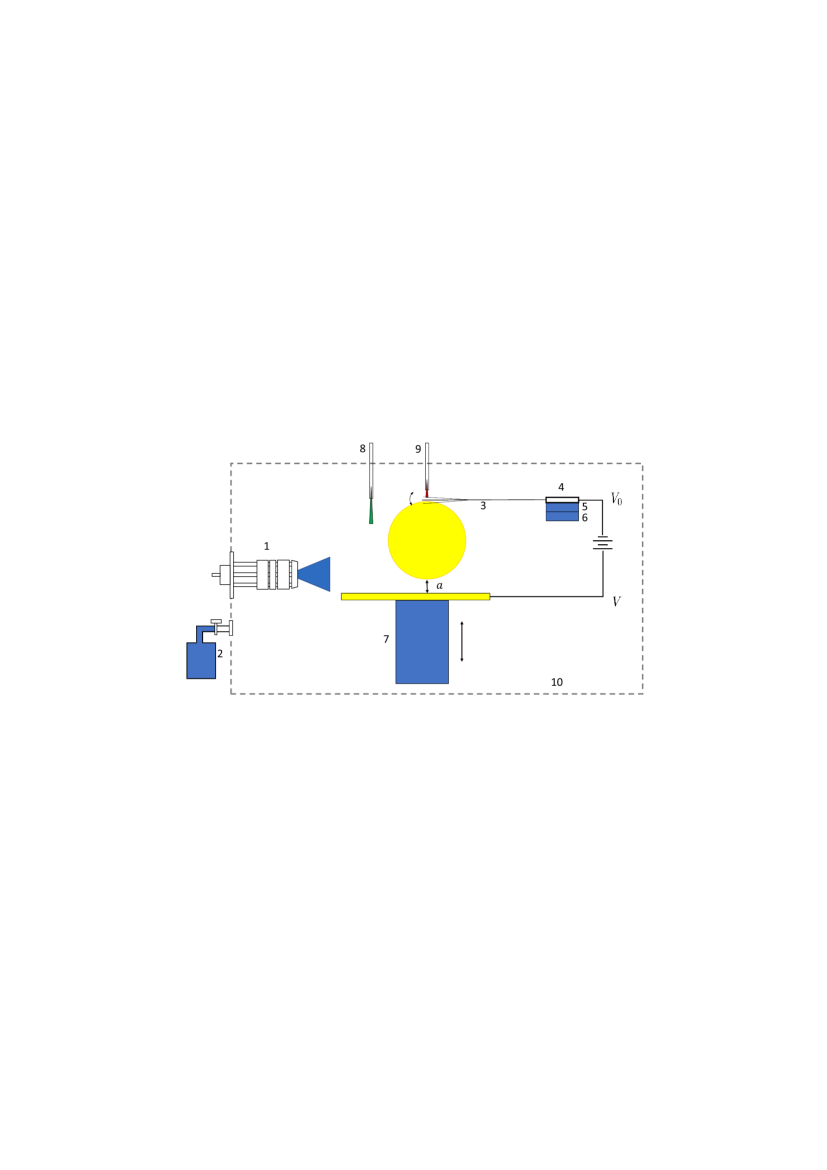
The general scheme of the experimental setup is shown in Fig. 1. It includes (1) the Ar-ion gun (RBD Model 04-165), (2) the reservoir of Ar gas, and (3) the cantilever of an atomic force microscope with attached Au-coated sphere of m radius. The chip 4 holding the cantilever is mounted on two piezoelectric actuators 5 and 6 using a clip. In the dynamic regime employed in this experiment they are used to drive oscillations of the cantilever at its resonant frequency with a constant amplitude. The Au-coated plate is mounted on top of a tube piezoelectric actuator 7 capable of travelling a distance of m. The first fiber optic interferometer 8 monitores the displacements of the Au plate mounted on the piezoelectric actuator 7. The second fiber interferometer 9 records the cantilever oscillations. The experiments were done in a high-vacuum chamber with pressure down to Torr. For the frequency demodulation the phase locked loop has been used. All details of the experimental setup and its calibration are described in Ref. 26 . Because of this, below we concentrate only on the novel elements represented by the Ar-ion cleaning system.
As mentioned in Sec. I, the Ar-ion cleaning has long been used for improvement of the quality of surfaces particularly in surface science. It was applied by many authors for different purposes as a method which does not change an alignment and does not modify the structures in the experiments 34 ; 38 ; 39 ; 40 ; 41 ; 42 ; 43 ; 44 ; 45 . In our setup (see Fig. 1) the Ar ion gun is mounted horizontally to the left of the sphere and plate with a 2.75 inch CF flange. The distance of the sphere to the output of the Ar-ion gun nose cone is about 15 cm. There is a clear line of sight from the Ar-ion gun to both a sphere and a plate. The horizontal mounting of the Ar-ion gun leads to the grazing incidence of Ar ions on the plate surface. This reduces the sputtering of Au 40 . To reduce its outgassing rate, the ion gun was wrapped with a heat tape and baked to over 100C for 24 hours. The source of the Ar ions is from an Ar gas reservoir filled to 2 atm of Ar which is mounted below the gun using a 1.3 inch CF flange.
To operate the Ar-ion gun, the main vacuum chamber was backfilled with Ar gas to a static pressure of Torr using the Ar gas reservoir. The Ar atoms were ionized by electron impact within the ion source’s dual filament ionization chamber. In the Ar-ion gun assembly, the dual tungsten filaments were arranged off-axis to minimize the impurity content of the Ar-ion beam. The ionized Ar ions were then extracted from the ionization chamber, accelerated through the focus lens, and directed to the sphere and the plate. To reduce the negative impact of Ar ions, both the kinetic energy, as well as the ion flux, were controlled. High ion kinetic energies lead to Au atoms sputtering off the sphere and plate surfaces as well as to burial of Ar ions due to their deep penetration 38 . The burial of Ar ions in the Au can be monitored as a change of the residual potential when the ion gun is turned off. Various ion kinetic energies from 2000 to 500 eV were tried. The higher ion kinetic energy leads to rapidly time varying residual potential immediately after the Ar-ion cleaning due to the aforementioned buried Ar ions in the Au. As a result, the Ar-ion kinetic energy of 500 eV and flux of A have been used. The different Ar-ion cleaning times have been probed under these conditions.
The extent of contamination of Au surfaces as a function of the Ar-ion cleaning time was monitored through the change in the residual potential difference. This is essentially equivalent to the commonly used surface science probes such as the Auger electron spectroscopy and X-ray photoelectron spectroscopy.
III The experimental results and comparison with theory
The first measurements have been made with an ordinary (uncleaned) sphere and plate exposed during some time to an ambient environment. These data were taken using the procedure described in detail in Ref. 26 . Specifically, the absolute separations were determined as , where is the distance traveled by the plate due to the voltage applied to the piezoelectric actuator situated under the plate, and is the closest separation between the Au sphere and Au plate. Then 11 different voltages have been applied to the plate and the corresponding frequency shift have been measured. Any drift of the frequency shift signal due to the mechanical drift of the piezo actuator was subtracted using the procedure described in Ref. 26 .
The obtained frequency shift has a parabolic dependence on the applied voltage 26
| (1) |
where is the Casimir force, is expressed via the natural frequency of the oscillator and the spring constant of the cantilever , and the coefficient is given by
| (2) | |||
Here, is the permittivity of a free space, , and is the sphere radius. Equation (2) is obtained by differentiation with respect to separation of the exact expression for the electrostatic force in the sphere-plate geometry 26 ; 4 ; 38a .
The residual potential difference , corresponding to the position of the parabola maximum, was found from Eq. (1) using fitting procedure over the entire measurement range from to 700 nm. In a similar way the data for the curvature of the parabola were obtained. The quantities and were found by fitting the data for as function of the separation distance to the theoretical expression (2).
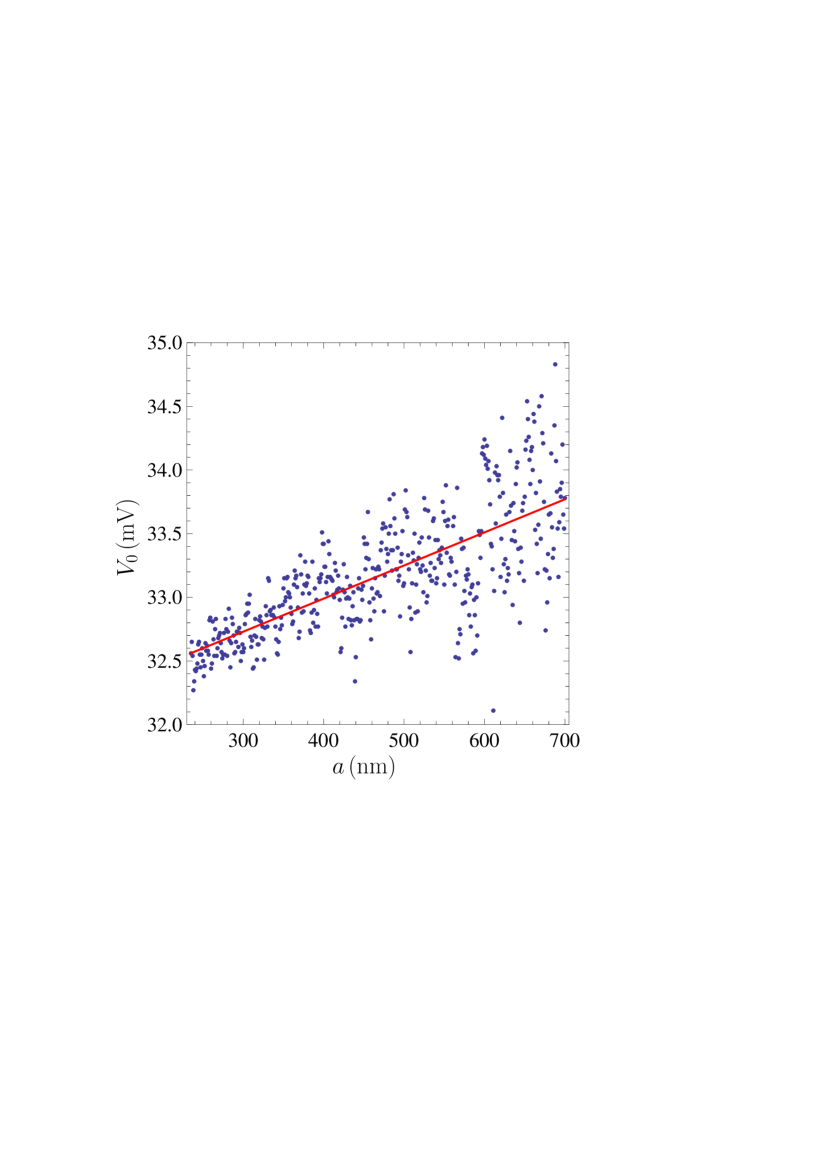
In Fig. 2 the resulting values of the residual potential difference are shown as dots at each absolute separation from 235 to 700 nm with a step of 1 nm. As is seen in Fig. 2, for an uncleaned sample takes rather high values exceeding 32 mV. In Fig. 2 we also show the best fit of the obtained values of to the straight line leaving its slope and an initial point as free parametrs. This line is described by the equation
| (3) |
where is measured in nm. From Fig. 2 one can conclude that substantially depends on separation. The change of between final and initial points of the straight line is equal to approximately 1.3 mV.
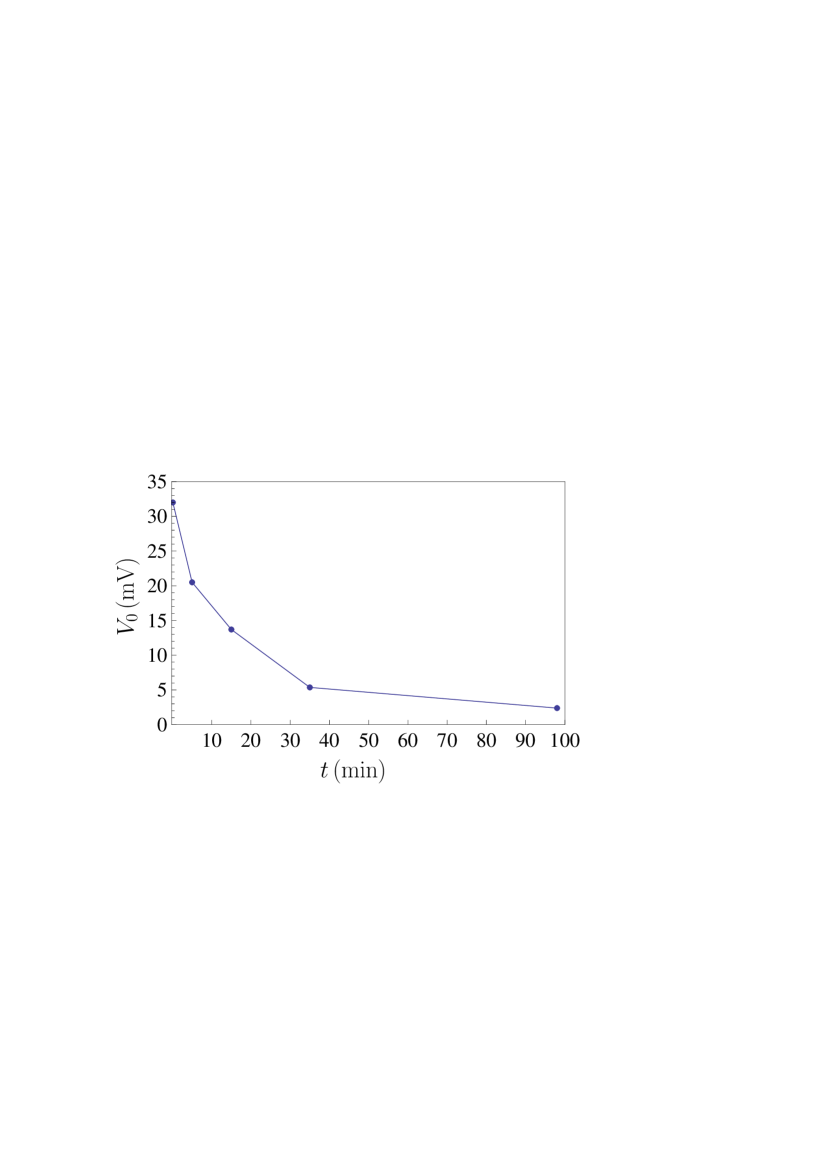
Next we performed several measurements of at the closest separation in order to demonstrate the effect of Ar-ion cleaning qualitatively. To simplify the procedure, in these measurements the small corrections due to mechanical drift of the piezo actuator have been disregarded. The initial measurement performed before starting the cleaning resulted in mV. Then we did the Ar-ion cleaning of the sphere and plate surfaces during 5 min and again determined the value of the residual potential difference at the closest separation mV. After that we have performed three more Ar-ion cleaning procedures, with the durations 10, 20, and 63 min, and after each of them determined the value of . Thus, after the total pariod of 98 min of Ar-ion cleaning the value of mV was obtained. In Fig. 3 the residual potential diffrence is plotted as a function of the cleaning time. As is seen in this figure, for smaller its value decreases more slowly with the cleaning time. After 98 min of the Ar-ion cleaning we observe a decrease of by the factor of 13.
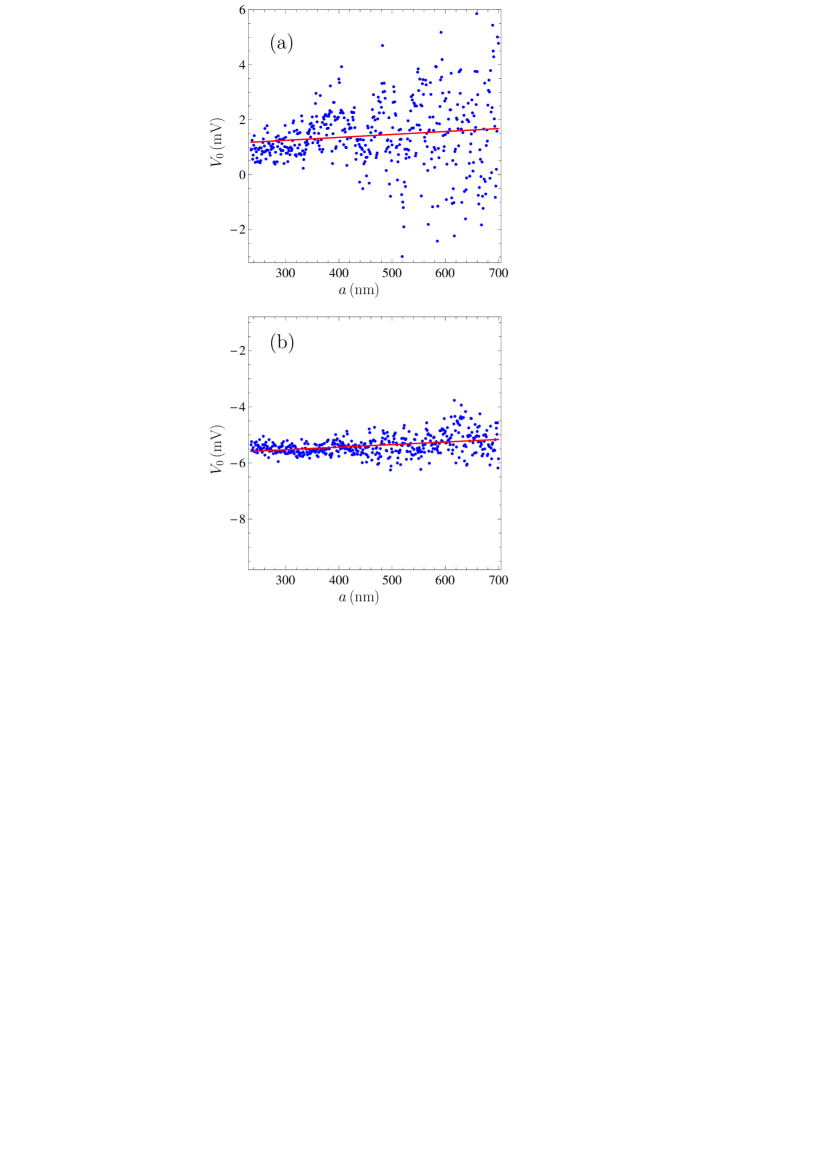
For a full quantitative investigation of the effect of Ar-ion cleaning on we have done additional Ar-ion cleaning of the surface for 100 min. Thereafter the accurate measurements of for cleaned surfaces as a function of separation have been performed with a step of 1 nm taking into account the drift of the piezo actuator. The obtained results are shown as dots in Fig. 4(a). As is seen in this figure, an additional Ar-ion cleaning resulted in further decrease of (up to a factor of 30 at the shortest separation as compared with the case of an uncleaned sample in Fig. 2). The best fit of the data for to the straight line, which is also shown in Fig. 4(a), results in
| (4) |
From the comparison of this equation with Eq. (3) one finds that the slope of the straight line decreased by a factor of 2.43. The respective drop of between final and initial separation distances is equal to 0.50 mV, i.e., became smaller by a factor of 2.60.
After finishing of this measurement, we have performed one more Ar-ion cleaning of the surface with a duration of 60 min. Then the residual potential difference was measured again as a function of separation. The measurement results are shown as dots in Fig. 4(b) as well as the best fit to the straight line
| (5) |
As a result of one more Ar-ion cleaning, the slope of this line has decreased further [by a factor of 2.84 in comparison with an uncleaned sample in Eq. (3) and by a factor of 1.17 compared to Eq. (4)]. Note also that the dispersion of dots in Fig. 4(b) is much smaller than in Fig. 4(a).
Finally, we have determined the experimental values of the gradient of the Casimir force for the measurement set of Fig. 4(b) obtained after the longest Ar-ion cleaning. This was done using Eq. (1) where the applied voltage was put equal to the mean residual voltage mV as is in Eq. (5) and Fig. 4(b). At each separation the voltage was applied 11 times and the mean value of the gradient of the Casimir force was obtained. Then it was recalculated into the effective Casimir pressure between two parallel Au plates using the proximity force approximation 4
| (6) |
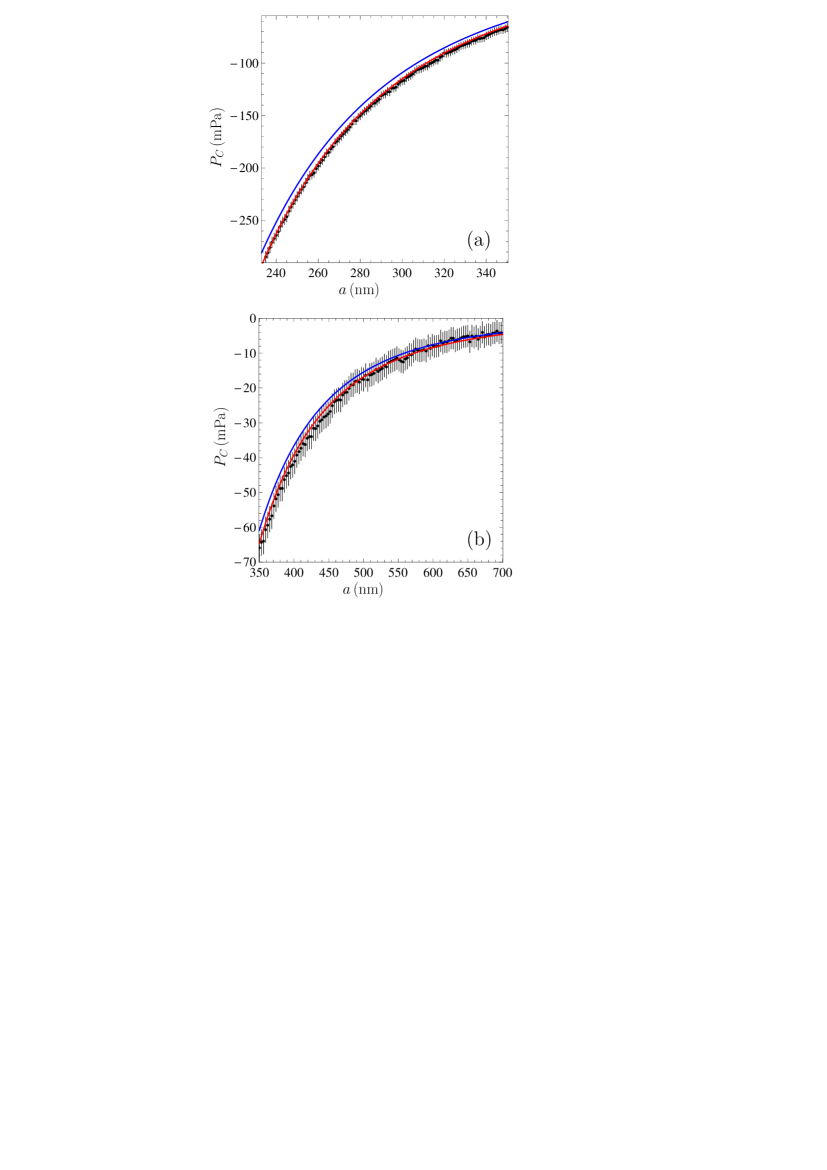
which is sufficiently precise for our purposes. As was shown recently 38b ; 38c ; 38d , the relative correction to the proximity force approximation is approximately equal to , i.e., varies from 0.19% to 0.33% when the separation increases from 235 to 400 nm. In Fig. 5 the obtained values of the Casimir pressure are indicated as crosses over the separation regions (a) from 235 to 350 nm with a step of 1 nm and (b) from 350 to 700 nm with a step of 3 nm for better visualization. The arms of the crosses show the total experimental errors determined at a 67% confidence level. The absolute error in the measurements of separation is equal to 0.5 nm. The relative error in the Casimir pressures at nm is equal to approximately 2% and increases with increasing separation. Thus, it is an order of magnitude larger than that introduced from using the proximity force approximation. Note that in Ref. 26 , where all measurements have been performed using selected samples which have independent of separation, the error in the Casimir pressure at the shortest separation was equal to 0.75%.
We have also compared the measured values of the effective Casimir pressures with theoretical predictions of the Lifshitz theory computed using the tabulated optical data for the complex index of refraction of Au 35 . It has long been known that there is the outstanding problem in the comparison of the Lifshitz theory with experiment connected with an extrapolation of the available optical data to zero frequency by either the Drude or the plasma model (see, e.g., Refs. 4 ; 36 ; 37 ). The point is that all precise experiments on measuring the Casimir interaction between metallic test bodies exclude the predictions of the Lifshitz theory if this extrapolation is made by the Drude model taking into account the relaxation properties of conduction electrons 23 ; 24 ; 25 ; 26 ; 27 ; 28 ; 29 ; 30 . The same experiments are in a very good agreement with the theoretical predictions when the extrapolation is made by the lossless plasma model. This result has been conclusively confirmed by the differential force measurement of Ref. 30 , where the difference in theoretical predictions using two different extrapolations was up to a factor of .
We have computed the Casimir pressure between two parallel plates made of Au at the laboratory temperature K using the Drude and plasma extrapolations of the optical data to zero frequency in the same way as in Ref. 26 . The obtained results are shown in Fig. 5 by the upper and lower solid lines, respectively. As is seen in this figure, the predictions of the Lifshitz theory using the plasma model for an extrapolation of the optical data (the lower line) are in a very good agreement with the measurement data over the entire measurement range. The theoretical predictions using an extrapolation by means of the Drude model (the upper line) are excluded by the data over the separation region from 235 to 400 nm. Thus, the use of ordinary (not especially selected) a sphere and a plate, which were subjected to the Ar-ion cleaning, leads to qualitatively the same conclusions concerning a comparison between experiment and theory as the most precise experiments performed previously. The drawback of using the Ar-ion cleaned ordinary samples lies in the somewhat larger measurement errors, but this point is of more importance for fundamental research rather than for the manufacture and functionality of microdevices.
Taking into account that in Fig. 5(b) some dependence of on separation still persists, it is interesting to compare the remaining noncompensated electric force with the Casimir force. Calculations using Eq. (4) show that at separations , 300, 400, and 700 nm the electric pressure constitutes only 0.9, 1.3, 2.1, and 5.2% of the Casimir pressure, respectively. Thus, one can neglect the role of residual electric forces when considering the functionality of microdevices using the Ar-ion cleaned samples. Quite to the contrary, before the Ar-ion cleaning it was mV (see Fig. 2) and the noncompensated electric force was equal to 30, 46, 77, and 222% of the Casimir pressure at the same respective separations. This means that the use of regular samples with no cleaning for manufacturing the microdevices driven by the Casimir force and for measuring the Casimir interaction is seriously hindered by electric forces due to the surface patches, contaminants etc.
IV Conclusions and discussion
In the foregoing, we have investigated the impact of Ar-ion cleaning on the electrostatic effects arising between two closely spaced metallic surfaces in measurements of the Casimir interaction. For this purpose, the previously created experimental setup using the dynamic atomic force microscope was supplemented with an Ar-ion gun and the Ar reservoir. Our experimental results demonstrate that when using regular uncleaned surfaces of a sphere and a plate the residual potential difference between these surfaces is rather large in magnitude and depends considerably on the separation distance, as it was repeatedly reported in previous literature (see Ref. 21 and references therein). We have also shown that sufficiently long Ar-ion cleaning diminishes the residual potential difference by up to an order of magnitude and makes it less dependent on separation. Thus, for uncleaned surfaces the residual electric pressures were determined to vary from 30% to 222% of the Casimir pressure when separation varies from 235 to 700 nm. This is a serious obstacle for a regular application of microdevices driven by the Casimir force and for measuring the Casimir interaction. By contrast, after the Ar-ion cleaning the residual electric pressures vary from only 0.9% to 5.2% of the Casimir pressure in the same range of separations which leaves the Casimir pressure as the dominant driver.
We have also measured the gradients of the Casimir force between Au surfaces of a sphere and a plate and determined the respective Casimir pressures between two parallel plates for the Ar-ion cleaned samples. The obtained results have been compared with the previously performed most precise measurements using specially selected clean samples and with theoretical predictions of the Lifshitz theory. It was found that, although the measurement data from the Ar-ion cleaned samples are characterized by somewhat larger experimental errors than that of the most precise experiments, it is in agreement with the latter and with the Lifshitz theory using the plasma model for extrapolation of the optical data to zero frequency. The theoretical predictions of the Lifshitz theory using the Drude model for the extrapolation of the optical data are excluded by our measurements with the Ar-ion cleaned samples over a wide separation region from 235 to 400 nm.
One can conclude that the method of in situ Ar-ion cleaning of the interacting surfaces is effective in reducing the residual potential difference and related electrostatic effects and therefore is a great resource for measuring the Casimir interaction and the wide use of microdevices operated by the Casimir force.
Acknowledgments
The work of J.X. and U.M. was partially supported by the NSF grant PHY-1607749. The work of V.M.M. was partially supported by the Russian Government Program of Competitive Growth of Kazan Federal University.
References
- (1) R. S. Decca, D. López, E. Fischbach, G. L. Klimchitskaya, D. E. Krause, and V. M. Mostepanenko, Precise comparison of theory and new experiment for the Casimir force leads to stronger constraints on thermal quantum effects and long-range interactions, Ann. Phys. (N.Y.) 318, 37 (2005).
- (2) R. S. Decca, D. López, E. Fischbach, G. L. Klimchitskaya, D. E. Krause, and V. M. Mostepanenko, Tests of new physics from precise measurements of the Casimir pressure between two gold-coated plates, Phys. Rev. D 75, 077101 (2007).
- (3) R. S. Decca, D. López, E. Fischbach, G. L. Klimchitskaya, D. E. Krause, and V. M. Mostepanenko, Novel constraints on light elementary particles and extra-dimensional physics from the Casimir effect, Eur. Phys. J. C 51, 963 (2007).
- (4) C.-C. Chang, A. A. Banishev, G. L. Klimchitskaya, V. M. Mostepanenko, and U. Mohideen, Reduction of the Casimir force from indium tin oxide film by UV treatment, Phys. Rev. Lett. 107, 090403 (2011).
- (5) A. A. Banishev, C.-C. Chang, R. Castillo-Garza, G. L. Klimchitskaya, V. M. Mostepanenko, and U. Mohideen, Modifying the Casimir force between indium tin oxide film and Au sphere, Phys. Rev. B 85, 045436 (2012).
- (6) C.-C. Chang, A. A. Banishev, R. Castillo-Garza, G. L. Klimchitskaya, V. M. Mostepanenko, and U. Mohideen, Gradient of the Casimir force between Au surfaces of a sphere and a plate measured using an atomic force microscope in a frequency-shift technique, Phys. Rev. B 85, 165443 (2012).
- (7) A. A. Banishev, C.-C. Chang, G. L. Klimchitskaya, V. M. Mostepanenko, and U. Mohideen, Measurement of the gradient of the Casimir force between a nonmagnetic gold sphere and a magnetic nickel plate, Phys. Rev. B 85, 195422 (2012).
- (8) A. A. Banishev, G. L. Klimchitskaya, V. M. Mostepanenko, and U. Mohideen, Demonstration of the Casimir force between ferromagnetic surfaces of a Ni-coated sphere and a Ni-coated plate, Phys. Rev. Lett. 110, 137401 (2013).
- (9) A. A. Banishev, G. L. Klimchitskaya, V. M. Mostepanenko, and U. Mohideen, Casimir interaction between two magnetic metals in comparison with nonmagnetic test bodies, Phys. Rev. B 88, 155410 (2013).
- (10) G. Bimonte, D. López, and R. S. Decca, Isoelectronic determination of the thermal Casimir force, Phys. Rev. B 93, 184434 (2016).
- (11) G. L. Klimchitskaya, U. Mohideen, and V. M. Mostepanenko, The Casimir force between real materials: Experiment and theory, Rev. Mod. Phys. 81, 1827 (2009).
- (12) L. M. Woods, D. A. R. Dalvit, A. Tkatchenko, P. Rodriguez-Lopez, A. W. Rodriguez, and R. Podgornik, Materials perspective on Casimir and van der Waals interactions, Rev. Mod. Phys. 88, 045003 (2016).
- (13) Y. Srivastava, A. Widom, and M. H. Friedman, Microchips as precision quantum-electrodynamic probes, Phys. Rev. Lett. 55, 2246 (1985).
- (14) Y. Srivastava and A. Widom, Quantum electrodynamic processes in electrical-engineering circuits, Phys. Rep. 148, 1 (1987).
- (15) V. A. Parsegian, Van der Waals Forces: A Handbook for Biologists, Chemists, Engineers, and Physicists (Cambridge University Press, Cambridge, 2005).
- (16) M. Bordag, G. L. Klimchitskaya, U. Mohideen, and V. M. Mostepanenko, Advances in the Casimir Effect (Oxford University Press, Oxford, 2015).
- (17) H. B. Chan, V. A. Aksyuk, R. N. Kleiman, D. J. Bishop, and F. Capasso, Quantum mechanical actuation of microelectromechanical system by the Casimir effect, Science 291, 1941 (2001).
- (18) H. B. Chan, V. A. Aksyuk, R. N. Kleiman, D. J. Bishop, and F. Capasso, Nonlinear micromechanical Casimir oscillator, Phys. Rev. Lett. 87, 211801 (2001).
- (19) E. Buks and M. L. Roukes, Stiction, adhesion, and the Casimir effect in micromechanical systems, Phys. Rev. B 63, 033402 (2001).
- (20) E. Buks and M. L. Roukes, Metastability and the Casimir effect in micromechanical systems, Europhys. Lett. 54, 220 (2001).
- (21) G. Palasantzas, Contact angle influence on the pull-in voltage of microswitches in the presence of capillary and quantum vacuum effects, J. Appl. Phys. 101, 053512 (2007).
- (22) G. Palasantzas, Pull-in voltage of microswitch rough plates in the presence of electromagnetic and acoustic Casimir forces, J. Appl. Phys. 101, 063548 (2007).
- (23) W. Broer, G. Palasantzas, J. Knoester, and V. B. Svetovoy, Significance of the Casimir force and surface roughness for actuation dynamics of MEMS, Phys. Rev. B 87, 125413 (2013).
- (24) W. Broer, H. Waalkens, V. B. Svetovoy, J. Knoester, and G. Palasantzas, Nonlinear actuation dynamics of driven Casimir oscillators with rough surfaces, Phys. Rev. Applied 4, 054016 (2015).
- (25) J. Barcenas, L. Reyes, and R. Esquivel-Sirvent, Scaling of micro- and nanodevices actuated by the Casimir force, Appl. Phys. Lett. 87, 263106 (2005).
- (26) R. Esquivel-Sirvent and R. Pérez-Pascual, Geometry and charge carrier induced stability in Casimir actuated nanodevices, Eur. Phys. J. B 86, 467 (2013).
- (27) M. Sedighi, W. Broer, G. Palasantzas, and B. J. Kooi, Sensitivity of micromechanical actuation on amorphous to crystalline phase transformations under the influence of Casimir forces, Phys. Rev. B 88, 165423 (2013).
- (28) Xi-fang Liu, Yong Li, and H. Jing, Casimir switch: steering optical transparancy with vacuum forces, Scientific Reports 6, 27102 (2016).
- (29) N. Inui, Optical switching of a graphene mechanical switch using the Casimir effect, J. Appl. Phys. 122, 104501 (2017).
- (30) J. Zou, Z. Marcet, A. W. Rodriguez, M. T. H. Reid, A. P. McCauley, I. I. Kravchenko, T. Lu, Y. Bao, S. G. Johnson, and H. B. Chan, Casimir forces on a silicon micromechanical chip, Nature Commun. 4, 1845 (2013).
- (31) L. Tang, M. Wang, C. Y. Ng, M. Nicolic, C. T. Chan, A. W. Rodriguez, and H. B. Chan, Measurement of non-monotonic Casimir forces between silicon nanostructures, Nature Photonics 11, 97 (2017).
- (32) R. O. Behunin, D. A. R. Dalvit, R. S. Decca, C. Genet, I. W. Jung, A. Lambrecht, A. Liscio, D. López, S. Reynaud, G. Schnoering, G. Voisin, and Y. Zeng, Kelvin probe force microscopy of metallic surfaces used in Casimir force measurements, Phys. Rev. A 90, 062115 (2014).
- (33) J. L. Garrett, D. Somers, and J. N. Munday, The effect of patch potentials in Casimir force measurements determined by heterodyne Kelvin probe force microscopy, J. Phys.: Condens. Matter 27, 214012 (2015).
- (34) R. O. Behunin, D. A. R. Dalvit, R. S. Decca, and C. C. Speake, Limits on the accuracy of force sensing at short separations due to patch potentials, Phys. Rev. D 89, 051301(R) (2014).
- (35) G. Bimonte, Hide it to see its better: A robust setup to probe the thermal Casimir force, Phys. Rev. Lett. 112, 240401 (2014).
- (36) G. Bimonte, Apparatus for measuring the thermal Casimir force at large distances, Phys. Rev. Lett. 113, 240405 (2014).
- (37) G. Bimonte, Isoelectronic apparatus to probe the thermal Casimir force, Phys. Rev. B 91, 205443 (2015).
- (38) Handbook of Adhesive Technology, eds. A. Rizzi and K. L. Mittal (CRC Press, Boca Raton, 2003).
- (39) Handbook of Optical Constants of Solids, ed. E. D. Palik (Academic, New York, 1985).
- (40) G. J. Ogilvie, The surface structure of silver crystals after argon-ion bombardment, J. Phys. Chem. Solids 10, 222 (1959).
- (41) W. R. Smythe, Electrostatics and Electrodynamics (McGraw-Hill, New York, 1950).
- (42) G. Bimonte, T. Emig, and M. Kardar, Material dependence of Casimir force: gradient expansion beyond proximity, Appl. Phys. Lett. 100, 074110 (2012).
- (43) M. Hartmann, G.-L. Ingold, and P. A. Maia Neto, Plasma versus Drude modeling in the Casimir force: Beyond the proximity force approximation, Phys. Rev. Lett. 119, 043901 (2017).
- (44) G. Bimonte, Going beyond PFA: A precise formula for the sphere-plate Casimir force, Europhys. Lett. 118, 20002 (2017).
- (45) K. S. Kim and N. Winograd, X-ray photoelectron spectroscopic studies of nickel-oxygen surfaces using oxygen and argon ion-bombardment, Surf. Sci. 43, 625 (1974).
- (46) V. S. Smentkowski, Trends in sputtering, Progr. Surf. Sci. 64, 1 (2000).
- (47) D. A. Hite, Y. Colombe, A. C. Wilson, K. R. Brown, U. Warring, R. Jördens, J. D. Jost, K. S. McKay, D. P. Pappas, D. Liebfried, and D. J. Wineland, 100-fold reduction of electric-field noise in an ion trap cleaned with in suti argon-ion-beam, Phys. Rev. Lett. 109, 103001 (2012).
- (48) Hai-Bo Zhang, Xiao-Chuan Hu, Rui Wang, Meng Cao, Na Zhang, and Wan-Zhao Cui, Note: Measuring effects of Ar-ion cleaning on the secondary electron yield of copper due to electron impact, Rev. Sci. Instrum. 83, 066105 (2012).
- (49) D. A. Hite, Y. Colombe, A. C. Wilson, D. T. C. Allcock, D. Liebfried, D. J. Wineland, and D. P. Pappas, Surface science for improved ion traps, Mrs Bulletin 38, 826 (2013).
- (50) H. Lüth, Surfaces and Interfaces of Solid Materials (Springer, Berlin, 2015).
- (51) R. Schafer, Jun Xu, and U. Mohideen, In suti ion gun cleaning of surface adsorbates and its effect on electrostatic forces, Int. J. Mod. Phys. A 31, 1641025 (2016).