DRUNET: A Dilated-Residual U-Net Deep Learning Network to Digitally Stain Optic Nerve Head Tissues in Optical Coherence Tomography Images
Abstract
Given that the neural and connective tissues of the optic nerve head (ONH) exhibit complex morphological changes with the development and progression of glaucoma, their simultaneous isolation from optical coherence tomography (OCT) images may be of great interest for the clinical diagnosis and management of this pathology. A deep learning algorithm was designed and trained to digitally stain (i.e. highlight) 6 ONH tissue layers by capturing both the local (tissue texture) and contextual information (spatial arrangement of tissues). The overall dice coefficient (mean of all tissues) was when assessed against manual segmentations performed by an expert observer. We offer here a robust segmentation framework that could be extended for the automated parametric study of the ONH tissues.
1 Introduction
The development and progression of glaucoma is characterized by complex 3D structural changes within the optic nerve head (ONH) tissues. These include the thinning of the retinal nerve fiber layer (RNFL) [1, 2, 3], changes in the minimum-rim-width [4], choroidal thickness [5, 6], lamina cribrosa (LC) depth [7, 8, 9], and posterior scleral thickness [10]; and migration of the LC insertion sites [11, 12]. If these parameters (and their changes) could be extracted automatically from optical coherence tomography (OCT) images, this could assist clinicians in their day-to-day management of glaucoma.
While there exist several tools to automatically segment the ONH tissues [13, 14, 15, 16, 17, 18, 19, 20, 21], and thus extract these parameters, each tissue currently requires a different algorithm (tissue-specific). In our previous study, we developed a histogram-based [22] approach that was able to ‘digitally stain’ (isolate) the connective and neural tissues of the ONH. Following this, we proposed a more accurate deep-learning (patch-based) [23] approach to isolate these tissues.
Tissue-specific segmentation tools are computationally expensive [24] and are often prone to segmentation errors in images with pathologies [25](e.g, age-related macular degeneration, optic disc edema). The segmentation accuracy of these tools is also affected by the reduced deep-tissue visibility and shadow artifacts [26] in the OCT images. Combining compensation technology (to remove the deleterious effects of light attenuation) [27] with our recently proposed methods, we were able to isolate the ONH tissues more accurately. Yet, the histogram-based approach was limited as it required an initial manual input and could not fully separate different tissues (e.g. sclera from choroid). On the other hand, the patch-based approach failed to offer precise tissue boundaries, failed to separate the LC from the sclera, and presented artificial LC-scleral insertions.
In this study, we present DRUNET (Dilated-Residual U-Net), a novel deep-learning approach capturing both the local (tissue texture) and contextual information (spatial arrangement of the tissues) to digitally stain neural and connective tissues of the ONH. We present a comparison with our earlier deep-learning (patch-based) approach to assert the robustness of DRUNET. Our long-term goal is to offer a framework for the automated extraction of neural and connective tissue structural parameters from OCT images of the ONH.
2 Methods
2.1 Patient Recruitment
A total of 100 subjects were recruited at the Singapore National Eye Center. All subjects gave written informed consent. This study adhered to the tenets of the Declaration of Helsinki and was approved by the institutional review board of the hospital. The cohort consisted of 40 normal (healthy) controls, 41 subjects with primary open angle glaucoma (POAG) and 19 subjects with primary angle closure glaucoma (PACG). The inclusion criteria for normal controls were: an intraocular pressure (IOP) less than 21 mmHg, healthy optic nerves with a vertical cup-disc ratio (VCDR) less than or equal to 0.5 and normal visual fields test. Primary open angle glaucoma was defined as glaucomatous optic neuropathy (GON; characterized as loss of neuroretinal rim with a VCDR and/or focal notching with nerve fiber layer defect attributable to glaucoma and/or asymmetry of VCDR between eyes ) with glaucomatous visual field defects. Primary angle closure glaucoma was defined as the presence of GON with compatible visual field loss, in association with a closed anterior chamber angle and/or peripheral anterior synechiae in at least one eye. A closed anterior chamber angle was defined as the posterior trabecular meshwork not being visible in at least of anterior chamber angle.
2.2 Optical Coherence Tomography Imaging
The subjects were seated and imaged under dark room conditions after dilation with tropicamide solution. The images were acquired by a single operator (TAT), masked to diagnosis with the right ONH being imaged in all the subjects, unless the inclusion criteria were met only in the left eye, in which case the left eye was imaged. A horizontal B-scan (0°) of 8.9 mm (composed of 768 A-scans) was acquired through the center of the ONH for all the subjects using spectral-domain OCT (Spectralis, Heidelberg Engineering, Heidelberg, Germany). Each OCT image was averaged 48x and enhanced depth imaging (EDI) was used for all scans.
2.3 Shadow Removal and Light Attenuation: Adaptive Compensation
We used adaptive compensation (AC) to remove the deleterious effects of light attenuation [27]. AC can help mitigate blood vessel shadows and enhance the contrast of OCT images of the ONH [27, 28]. A threshold exponent of 12 (to limit noise over-amplification at high depth) and a contrast exponent of 2 (for improving the overall image contrast) were used for all the B-scans [28].
2.4 Manual Segmentation
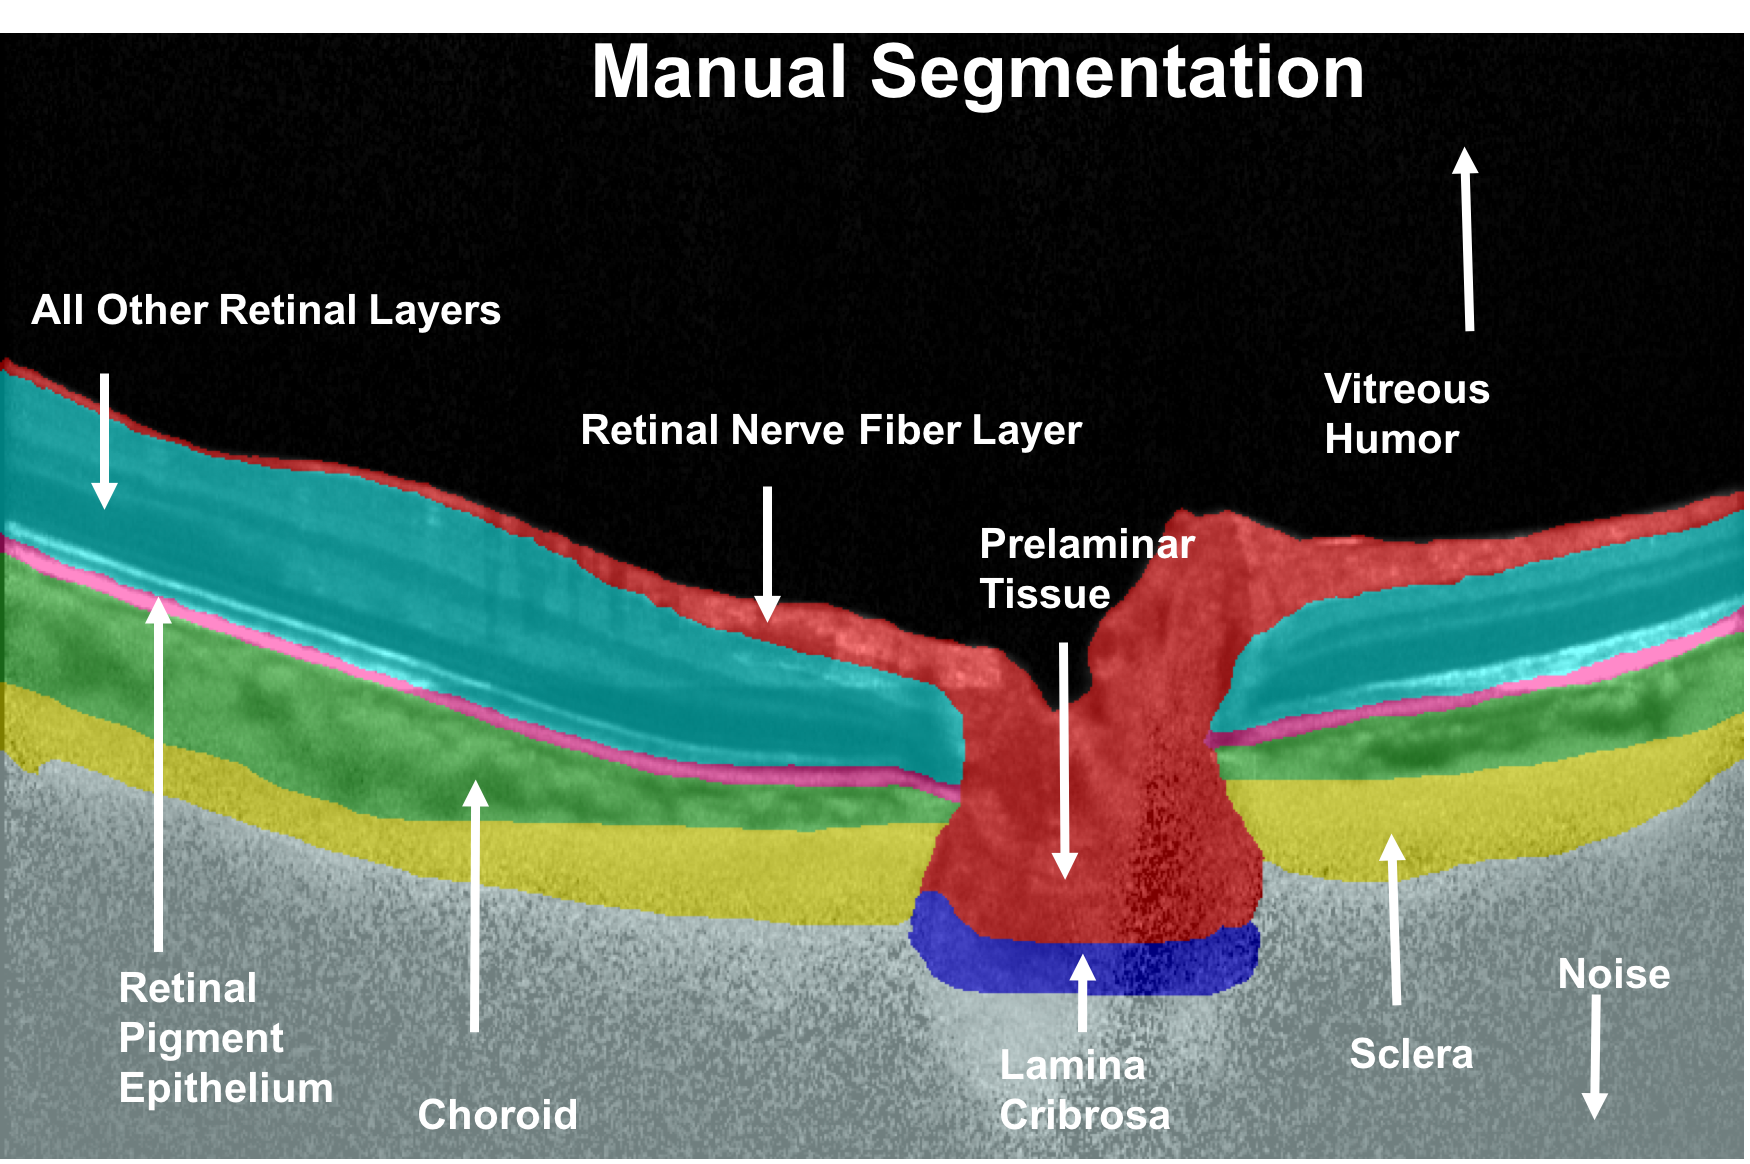
An expert observer (SD) performed manual segmentation of all OCT images using Amira (version 5.4, FEI, Hillsboro, OR). This was done to 1) train our algorithm to identify and isolate the ONH tissues; and to 2) validate the accuracy of digital staining. Each OCT image was segmented into the following classes: (refer Figure 1):(1) the RNFL and the prelamina (in red); (2) the retinal pigment epithelium (RPE; in pink); (3) all other retinal layers (in cyan); (4) the choroid (in green); (5) the peripapillary sclera (in yellow); and (6) the (LC) (in blue). Noise (in gray) and the vitreous humor (in black) were also isolated. Note that we were unable to obtain a full thickness segmentation of the peripapillary sclera and the LC due to limited visibility [28]. Only their visible portions were segmented.
2.5 Digital Staining of the ONH
In this study, we developed the architecture DRUNET (Dilated-Residual U-Net): a fully convolutional neural network inspired by the widely used U-Net [29], to digitally stain the ONH tissues. DRUNET exploits the inherent advantages of the U-Net skip connections [30], residual learning [31] and dilated convolutions [32] to offer a robust digital staining with a minimal number of trainable parameters. The U-Net skip connections allowed capturing both the local and contextual information [30, 29], while the residual connections allowed a better flow of the gradient information through the network. Using the dilated convolutional filters, we were able to better exploit the contextual information: this was crucial as we believe local information (i.e. tissue texture) is insufficient to delineate precise tissue boundaries. DRUNET was trained with OCT images of the ONH and their corresponding manually segmented ground truths.
2.6 Network Architecture
The DRUNET architecture was composed of a downsampling and an upsampling tower Figure 2, connected to each other via skip-connections. Each tower consisted of one standard block and two residual blocks. Both the standard and the residual blocks were constructed using two dilated convolution layers, with 16 filters (size 3x3) each. The identity connection in the residual block was implemented using a 1x1 convolution layer, as described in Figure 2. In the downsampling tower, the input image of size 496x768 was fed to a standard block with a dilation rate of 1 followed by two residual blocks with dilation rates of 2 and 4 respectively. After every block in the downsampling tower, a max-pooling layer of size 2x2 was used to reduce the dimensionality and exploit the contextual information. A residual block with a dilation rate of 8 was used to transfer the features from the downsampling to the upsampling tower. These features were then passed through two residual blocks with dilation rates of 4 and 2 respectively. A standard block with a dilation rate of 1 was used to restore the image to its original resolution. After every block in the upsampling tower, a 2x2 upsampling layer was used to sequentially restore the image to its original resolution. The output layer was implemented as a 1x1 convolution layer with a number of filters equal to the number of classes (8 = 6 tissues + noise + vitreous humour). We then applied a softmax activation to this output layer to obtain the class-wise probabilities for each pixel. Finally, each pixel was assigned the class of the highest probability. Skip connections [30] were established between the downsampling and upsampling towers to recover the spatial information lost during the downsampling.
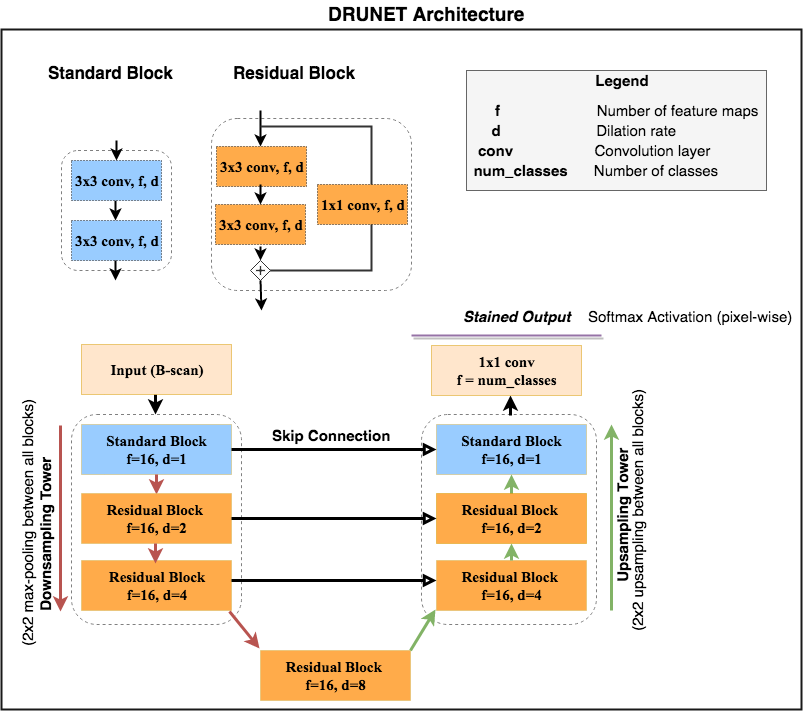
In both towers, all the layers except the last output layer were batch normalized and activated by an exponential linear unit function ELU [33]. In each residual block, the residual layers were batch normalized and ELU activated before their addition.
The entire network was trained end-to-end using stochastic gradient descent with nesterov momentum (momentum=0.9). An initial learning rate of 0.1 (halved when the validation loss failed to improve over two consecutive epochs) was used to train the network and the model with the best validation loss was chosen for all the experiments in this study. The loss function was based on the mean of Jaccard-type Index calculated for each tissue,
where denotes the total number of classes, the notation denotes the component-wise multiplication between the matrices and , the quantity is the predicted pixel-wise probability of belonging to class and is the ground truth segmentation matrix (or map). The final network consisted of 40,000 trainable parameters. The proposed architecture was trained and tested on a NVIDIA GTX 1080 founder’s edition GPU with CUDA v8.0 and cuDNN v5.1 acceleration. With the given hardware configuration, each OCT image was digitally stained in 80 ms.
2.7 Data Augmentation
An extensive online data augmentation was performed to overcome the sparsity of our training data. Data augmentation consisted of random rotation (8 degrees clockwise and anti-clockwise), horizontal flipping, nonlinear intensity shifts, addition of white noise and multiplicative speckle noise [34], elastic deformations [35] and occluding patches.
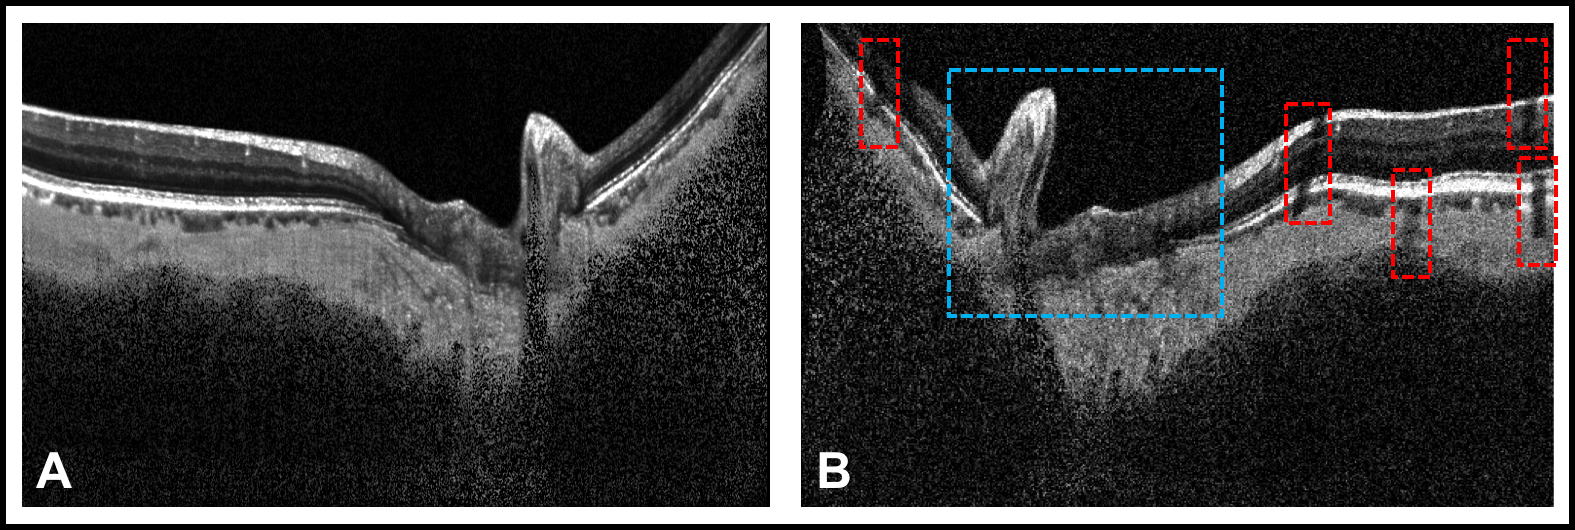
Nonlinear intensity shifts were of the type , for a random (non-linear) function , where the quantities and denote intensities (pixel-wise) before and after the nonlinear intensity shift respectively. This made the network invariant to intensity inhomogeneity within/between tissue layers (a common problem in OCT images affecting the performance of automated segmentation tools [36]). The elastic deformations [35] can be viewed as an image warping technique to produce the combined effects of shearing and stretching. This was done in an attempt to make our network invariant to images with atypical morphology (i.e., ONH tissue deformations as seen in glaucoma [37]). Twenty occluding patches of size 60x20 pixels were also added at random locations to reduce the visibility in certain tissues, in an effort to make our network invariant to blood vessel shadowing that is common in OCT images. Each occluding patch resulted in the reduction of intensity in the entire occluded region by a random factor (random number between 0.2 and 0.8). An example of data augmentation performed on a single OCT image is shown in Figure 3.
2.8 Training and Testing of our network
The dataset of 100 B-scans (40 healthy, 60 glaucoma) was split into training and testing datasets. The training set was composed of an equal number of compensated glaucoma and healthy OCT images of the ONH, along with their corresponding manual segmentations. The trained network was then evaluated on the unseen testing set (composed of the remaining compensated OCT images of the ONH and their corresponding manual segmentations). A training set of 40 images (60 testing images) were chosen for all the experiments discussed in this study.
To assess the consistency of the proposed methodology, the model was trained on five training sets of 40 images each and tested on their corresponding testing sets. Given the limitation of a total of only 100 OCT images, it was not possible to obtain five distinct training sets, thus each training set had some images repeated. To study the effect of compensation on digital staining, the entire process (training and testing) was repeated with the baseline (uncompensated) images. A comparative study was also performed between the DRUNET architecture and our previously published patch-based digital staining approach [23]. For this, we trained and tested both the techniques with the same dataset.
2.9 Digital Staining: Qualitative Analysis
All the digitally stained images obtained were manually reviewed by an expert observer (SD) and qualitatively compared with their corresponding manual segmentations.
2.10 Digital Staining: Quantitative Analysis
We used the following metrics to assess the accuracy of the digital staining: (1) the dice coefficient (); (2) Specificity (); and (3) (). For each image, the metrics were computed for the following classes: (1) RNFL and prelamina, (2) RPE, (3) all other retinal layers, and (4) choroid. Note that the metrics could not be applied directly to the peripapillary sclera and the LC as their true thickness could not be obtained from the manual segmentation. However, digital staining of the peripapillary sclera and of the LC was qualitatively assessed. Noise and vitreous humor were also exempted from such a quantitative analysis.
The dice coefficient was used to measure the spatial overlap between the manual segmentation and the digital staining. It is defined between 0 and 1, where 0 represents no overlap and 1 represents a complete overlap. For each image in the testing set, the dice coefficient was calculated for each tissue as follows,
where is the set of pixels representing the tissue in the manual segmentation, while represents the same in the digitally stained image.
Specificity was used to assess the true negative rate of the proposed method.
where and are the set of all the pixels not belonging to class in the digitally stained and the corresponding manually segmented image respectively. Sensitivity was used to assess the true positive rate of the proposed method as is defined as:
Both specificity and sensitivity were reported on a scale of 0–1. To assess the performance of the digital staining between glaucoma and healthy OCT images, for each experiment, the metrics were calculated separately for the two groups.
3 Results
3.1 Qualitative Analysis
The baseline, compensated, manually segmented, and the digitally-stained images for 4 selected subjects (12: POAG, 3: Healthy, 4: PACG) are shown in Figure 4.
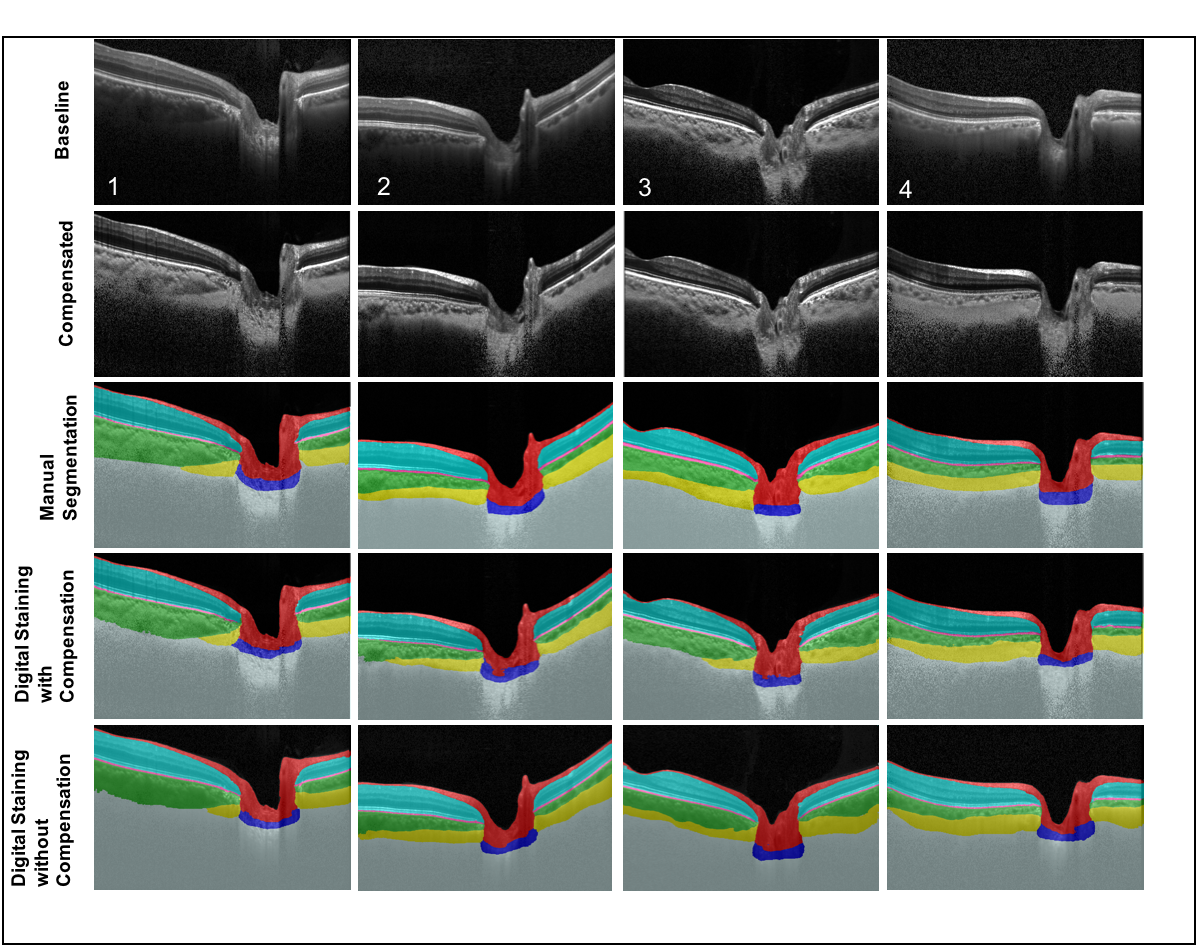
When trained with the compensated images (Figure 4, 4th Row) or the uncompensated images (Figure 4, 5th Row), DRUNET was able to simultaneously isolate the different ONH tissues, i.e. the RNFL prelamina (in red), the RPE (in pink), all other retinal layers (in cyan), the choroid (in green), the sclera (in yellow) and the LC (in blue). Noise and vitreous humor were isolated in gray and black respectively. In both cases, the digital staining of the ONH tissues were qualitatively similar, comparable and consistent with the manual segmentation. A smooth delineation of the choroid-sclera interface was obtained in both cases.
Irregular (Figure 4, Subject 2 and 4) LC boundaries that were inconsistent with the manual segmentations were obtained in few images irrespective of the training data (compensated/uncompensated images).
When validated against the respective manual segmentations, there was no visual difference in the performance of digital staining on healthy or glaucoma OCT images across all experiments.
3.2 Quantitative Analysis
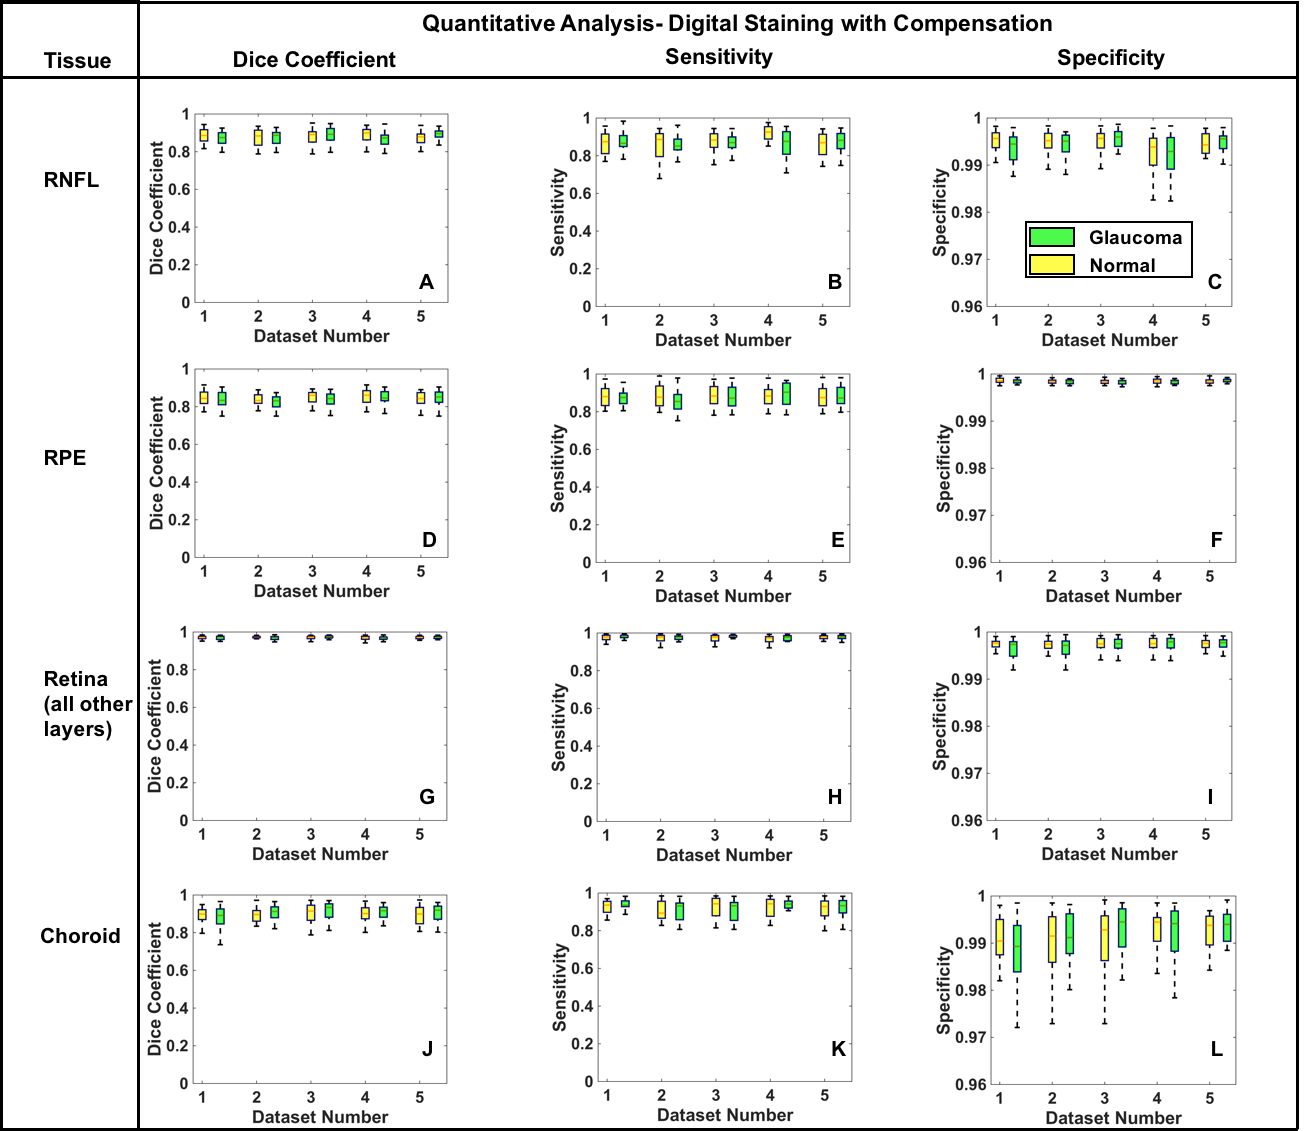
When trained with compensated images, across all the five testing sets, the mean dice coefficients for the healthy/glaucoma OCT images were: for the RNFL + prelamina, for the RPE, for all other retina layers, and for the choroid. The mean sensitivities for the healthy/glaucoma OCT images were for the RNFL + prelamina, for the RPE, for all other retina layers, and for the choroid respectively. For all the tissues, the mean specificities were always above for both glaucoma and healthy subjects. In all experiments, there were no significant differences (mean dice coefficients, specificities and sensitivities) in the performance of digital staining between glaucoma and healthy OCT images (Figure 5).
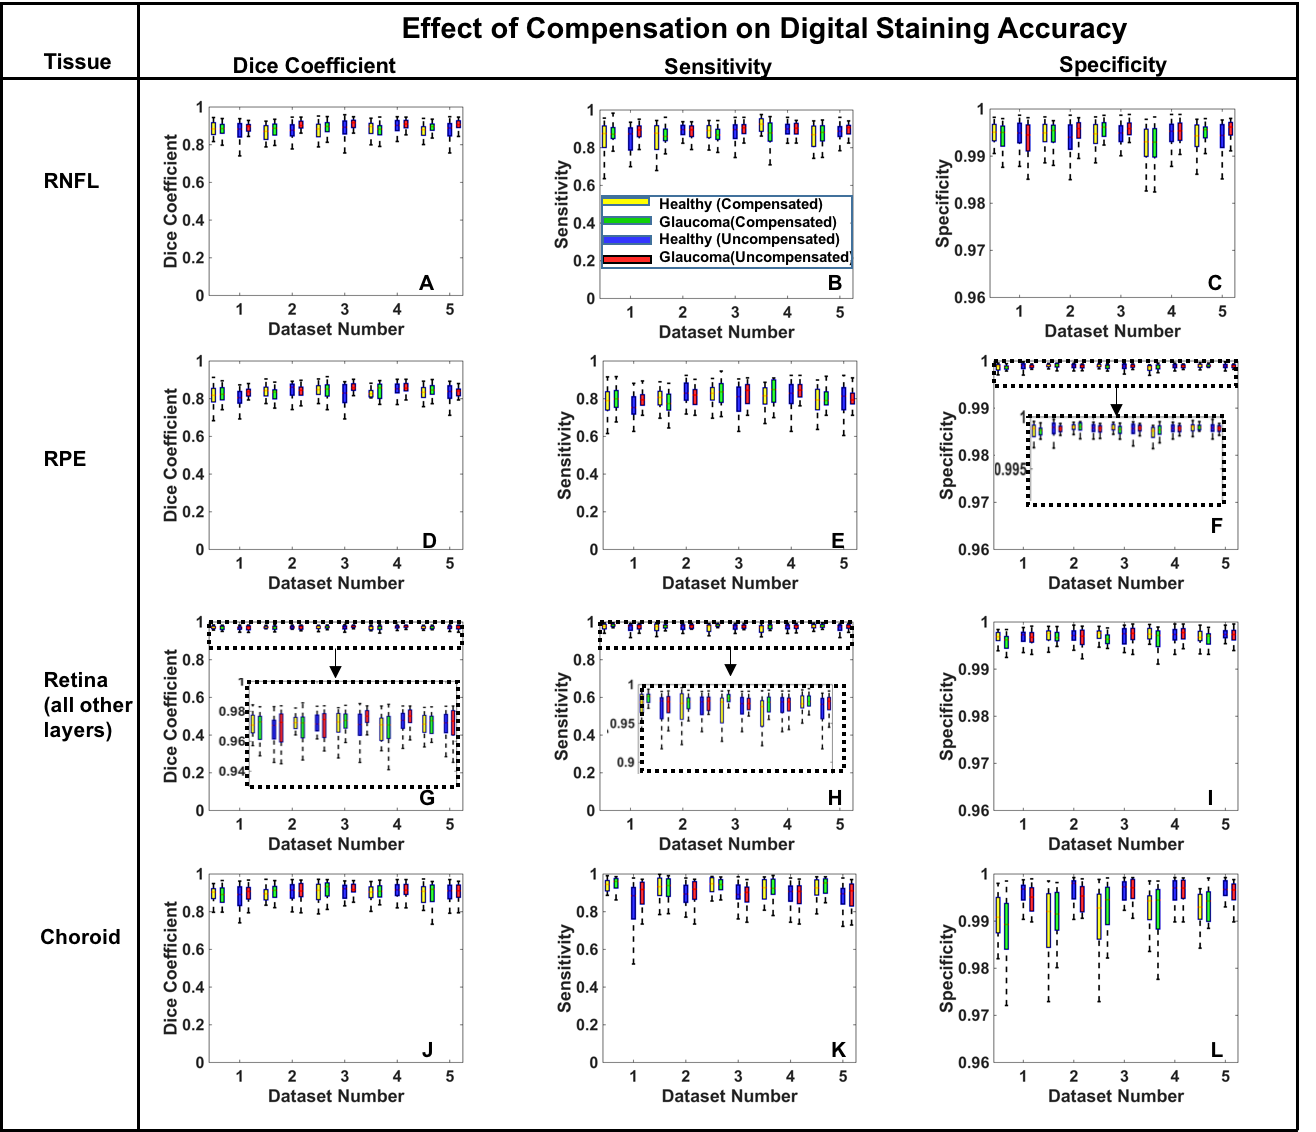
Further, the performance of the digital staining did not significantly improve when using compensation (Figure 6).
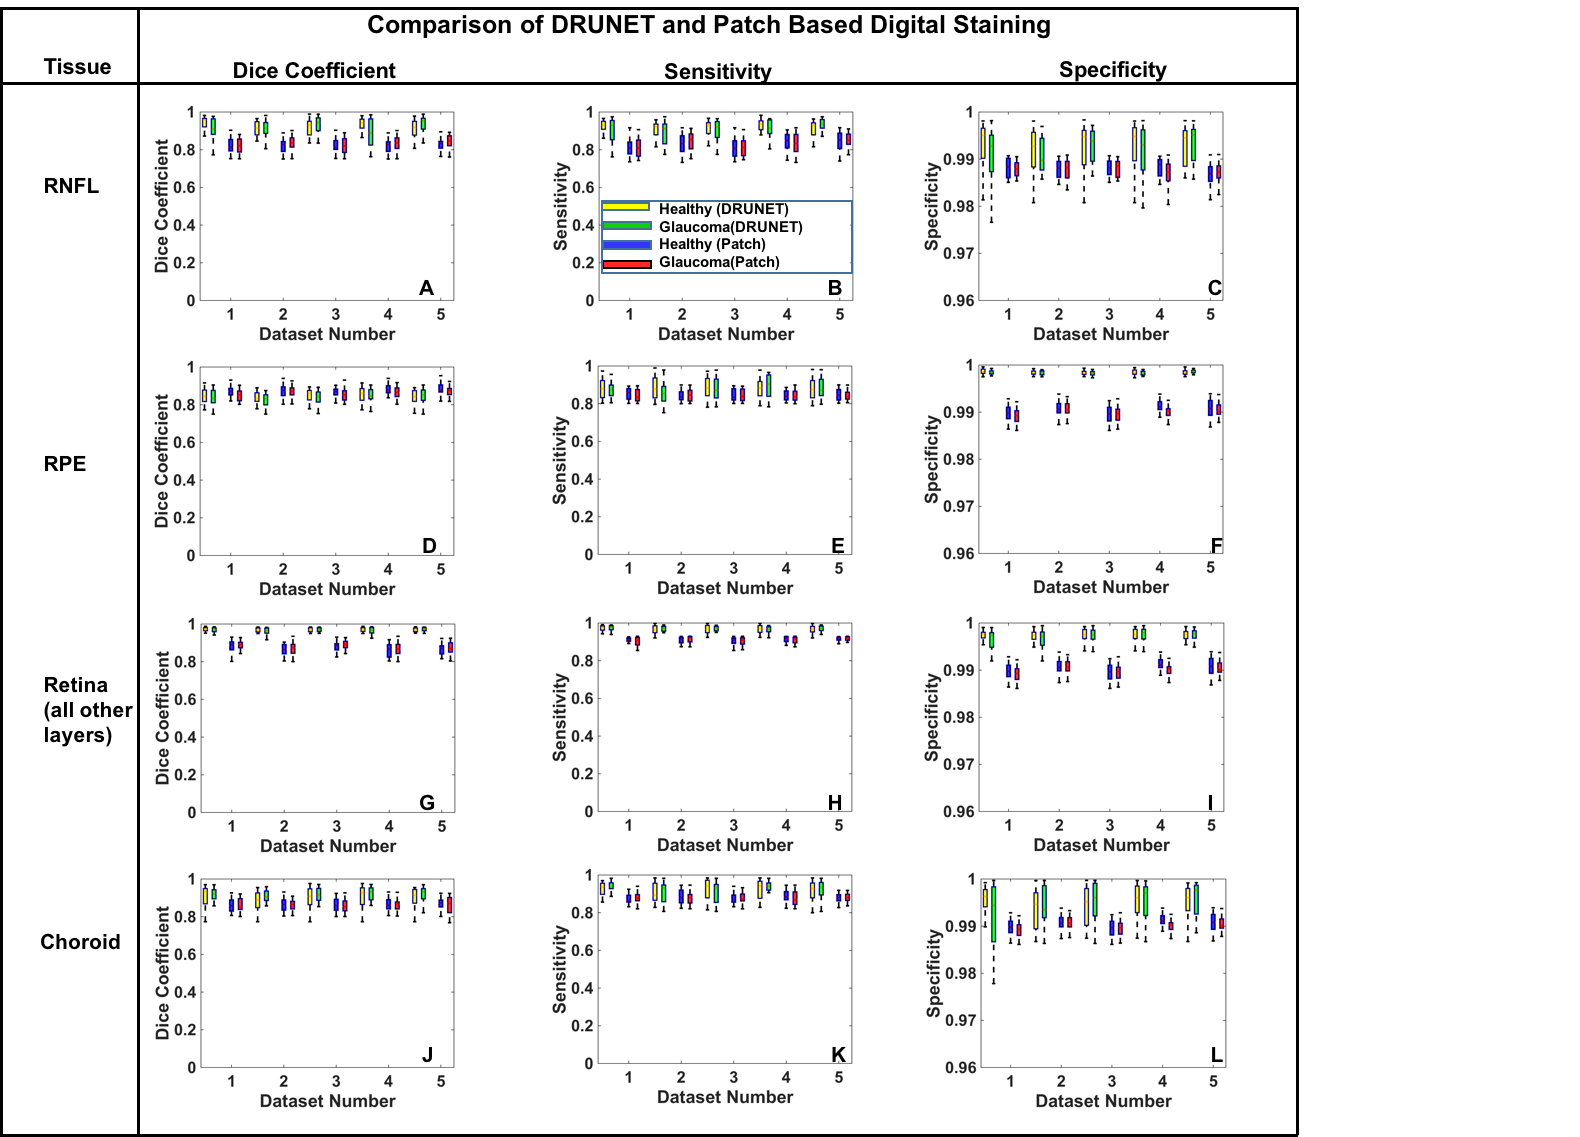
Overall, the DRUNET performed significantly better for all the tissues compared to the patch-based approach, except for the RPE, in which case it performed similar (Figure 7).
4 Discussion
In this study, we present DRUNET, a deep learning approach that is able to capture both local and contextual features to simultaneously stain (i.e. highlight) connective and neural tissues in OCT images of the ONH. The proposed study leverages on the inherent advantages of skip connections, residual learning and dilated convolutions. Having successfully trained, tested and validated on the OCT images from 100 subjects, we were able to consistently achieve a good qualitative and quantitative digital staining. Thus, we may be able to offer a robust segmentation framework, for the automated parametric study of the ONH tissues.
Using DRUNET, we were able to simultaneously isolate the RNFL+prelamina, the RPE, all other retinal layers, the choroid, the peripapillary sclera, the LC, noise and the vitreous humor with good accuracy. When trained and tested on compensated images, there was good agreement with manual segmentation, with the overall dice coefficient (mean of all tissues) being and for glaucoma and healthy subjects respectively. The mean sensitivities for all the tissues were and for glaucoma and healthy subjects respectively while the mean specificities were always higher than for all cases.
We observed that DRUNET offered no significant differences in the performance of digital staining when tested upon compensated (blood vessel shadows removed), or uncompensated images, as opposed to our previous patch-based method [23], that performed better on compensated images. This may be attributed to the extensive online data augmentation we used herein that also included occluding patches to mimic the presence of blood vessel shadows. In uncompensated images, the presence of retinal blood vessel shadows typically affects the automated segmentation of the RNFL [38, 39], that can yield incorrect RNFL thickness measurements. This phenomenon may be more pronounced in glaucoma subjects that exhibit very thin RNFL. Our DRUNET framework, being invariant to the presence of blood vessel shadows, could potentially be extended to provide an accurate and reliable measurement of RNFL thickness. We believe this could improve the diagnosis and management of glaucoma. However, given the benefits of compensation in enhancing deep tissue visibility [28], and contrast [27], it may be advised to digitally stain compensated images for a reliable clinical interpretation of the isolated ONH tissues.
When trained and tested with the same cohort, DRUNET offered smooth and accurate delineation of tissue boundaries with reduced false predictions. Thus, it performed significantly better than the patch-based approach for all the tissues, except for the RPE, in which case it performed similarly. This may be attributed to DRUNET’s ability in capturing both local (tissue texture) and contextual features (spatial arrangement of tissues), compared to the patch-based approach that captured only the local features.
DRUNET consisted of 40,000 trainable parameters as opposed to the patch-based approach that required 140,000 parameters. Besides, DRUNET also eliminated the need for multiple convolutions on similar sets of pixels as seen in patch-based approach. Thus, DRUNET offers a computationally inexpensive and faster segmentation framework that only takes 80 ms to digitally stain one OCT image. This could be extended for the real time segmentation of OCT images as well. We are currently exploring such an approach.
We found that DRUNET was able to dissociate the LC from the peripapillary sclera. This provides an advantage as opposed to previous techniques that were able to segment only the LC [40, 41], or the LC fused with the peripapillary sclera [23]. To the best of our knowledge, no automated segmentation techniques have been proposed to simultaneously isolate all individual ONH connective tissues. We believe our network was able to achieve this because we used the Jaccard Index as part of the loss function. During training, by computing the Jaccard Index for each tissue, the network was able to learn the representative features equally for all tissues. This reduced the inherent bias in learning features of a tissue represented by a large number of pixels (e.g., retinal layers) as opposed to a tissue represented by a small number of pixels (e.g., LC/RPE).
We observed no significant differences in the performance of digital staining when tested on glaucoma or healthy images. The progression of glaucoma is characterized by thinning of the RNFL [1, 2, 3] and decreased reflectivity (attenuation) of the RNFL axons [42], thus reducing the contrast of the RNFL boundaries. Existing automated segmentation tools for the RNFL rely on these boundaries for their segmentation and are often prone to segmentation artifacts [43, 44, 45, 46] (incorrect ILM/ posterior RNFL boundary), resulting in inaccurate RNFL measurements. This error increases with the thinning of the RNFL [39]. Thus, glaucomatous pathology increases the likelihood of errors in the automated segmentation of the RNFL, leading to under- or over-estimated RNFL measurements that may affect the diagnosis of glaucoma [39]. An automated segmentation tool that is invariant to the pathology is thus highly needed to robustly measure RNFL thickness. We believe DRUNET may be a solution for this problem, and we aim to test this hypothesis in future works.
With the proposed methodology, one could extract key structural parameters from the isolated tissues as an immediate clinical application of our technique. For instance, the peripapillary RNFL/choroidal thickness could be computed from digitally stained images as the number of vertical coloured pixels representing it, multiplied by a physical scaling factor. Upon isolation of the RPE from the central scan, the Bruch’s membrane opening (BMO) points can be identified its end tips. The minimum-rim width can then be computed as the minimum distance between the BMO points and the inner limiting membrane [47] (also obtained from digital staining). Further, one could also obtain key connective tissue parameters such as anterior LC insertion distance [48], LC surface depth [49], prelaminar thickness [50] and prelaminar depth [50] in a similar manner from the isolated sclera and LC. We believe, obtaining these parameters can improve the diagnosis, management and risk profiling of glaucoma. We are currently working on such a clinical translation of the proposed approach.
There are several limitations to this study that warrant further discussion.
-
•
The accuracy of the algorithm was validated against the manual segmentations provided by a single expert observer (SD). The future scope of this study would be to provide a validation against multiple expert observers. Nevertheless, we offer a proof of concept for the simultaneous digital staining of the ONH tissues in OCT images.
-
•
The algorithm was trained with the images from a single machine (Spectralis). Currently, it is unknown if the algorithm would perform the same way if tested on images from multiple OCT devices. We are exploring other options to develop a device-independent digital staining approach.
-
•
We observed irregular LC boundaries that were inconsistent with that of the manual segmentations in few images. When extended for the automated parametric study, this could affect the LC parameters such as LC depth [51], LC curvature [48], and the global shape index [52]. Given the significance of LC morphology in glaucoma [12, 51, 52, 53, 54, 55, 56, 57, 58], a more accurate delineation of the LC boundary would be required to obtain reliable parameters for a better understanding of glaucoma. This could be addressed using transfer learning [59, 60] by incorporating more information about LC morphology within the network. We are currently exploring such an approach.
-
•
A quantitative validation of the peripapillary sclera and the LC could not be performed as their true thickness could not be obtained from the manual segmentations due to limited visibility [28].
-
•
We were unable to provide further validation to our algorithm by comparing it with data obtained from histology. This is a challenging task, given that one would need to image a human ONH with OCT, process it with histology and register both datasets. However, it is important to bear in mind that the understanding of OCT ONH anatomy stemmed from a single comparison of a normal monkey eye scanned in vivo at an IOP of 10 mm Hg and then perfusion fixed at time of sacrifice at the same IOP [61]. Our algorithm produced tissue classification results that match the expected relationships obtained in this above-mentioned work. The absence of published experiments matching human ONH histology to OCT images, at the time of writing this paper, inhibits an absolute validation of our proposed methodology.
-
•
A robust and accurate isolation of the ganglion cell complex (GCC) [62] and the photoreceptor layers [63], whose structural changes are associated with the progression of glaucoma was not possible in both compensated and uncompensated images. The limitation of an accurate intra-retinal layer segmentation from ONH images can be attributed to the inherent speckle noise and intensity inhomogeneity [15] which affects the robust delineation of the intra-retinal layers. This could be resolved by using advanced pre-processing techniques for image denoising (e.g. deep learning based) or a multi-stage tissue isolation approach (i.e., extraction of retinal layer followed by the isolation of intra-retinal layers).
-
•
Given the limitation of a small dataset (100 images), and the need for performing multiple experiments (repeatability), we were able to use only 40 images for training (60 images for testing) in each experiment. It is currently unknown if the performance of digital staining would improve when trained upon a larger dataset. Also, we would also like to emphasize again that there was no mixing of the training and testing sets in a given experiment. However, across all the experiments, there was indeed a small leakage of the testing/training sets. Nevertheless, we offer a proof of principle for a robust deep learning approach to digital stain ONH tissues that could be used by other groups for further validation.
In conclusion, we have developed a deep learning algorithm for the simultaneous isolation of the connective and neural tissues in OCT images of the ONH. Given that the ONH tissues exhibit complex changes in their morphology with the progression of glaucoma, their simultaneous isolation may be of great interest for the clinical diagnosis and management of glaucoma.
Funding
Singapore Ministry of Education Academic Research Funds Tier 1 (R-155-000-168-112 [AHT]); National University of Singapore (NUS) Young Investigator Award Grant (NUSYIAFY16P16; R-155-000-180-133; AHT); National University of Singapore Young Investigator Award Grant (NUSYIAFY13P03; R-397-000-174-133 [MJAG]); Singapore Ministry of Education Tier 2 (R-397-000-280-112 [MJAG]);National Medical Research Council (Grant NMRC/STAR/0023/2014 [TA]).
Disclosures
The authors declare that there are no conflicts of interest related to this article.
References
- [1] C. Bowd, R. N. Weinreb, J. M. Williams, and L. M. Zangwill. The retinal nerve fiber layer thickness in ocular hypertensive, normal, and glaucomatous eyes with optical coherence tomography. Archives of Ophthalmology, 118(1):22–26, 2000.
- [2] Atsuya Miki, Felipe A. Medeiros, Robert N. Weinreb, Sonia Jain, Feng He, Lucie Sharpsten, Naira Khachatryan, Na’ama Hammel, Jeffrey M. Liebmann, Christopher A. Girkin, Pamela A. Sample, and Linda M. Zangwill. Rates of retinal nerve fiber layer thinning in glaucoma suspect eyes. Ophthalmology, 121(7):1350–1358.
- [3] Tomonari Ojima, Teruyo Tanabe, Masanori Hangai, Saiyuu Yu, Shiho Morishita, and Nagahisa Yoshimura. Measurement of retinal nerve fiber layer thickness and macular volume for glaucoma detection using optical coherence tomography. Japanese Journal of Ophthalmology, 51(3):197–203, 2007.
- [4] Jonas M. D. Gmeiner, Wolfgang A. Schrems, Christian Y. Mardin, Robert Laemmer, Friedrich E. Kruse, and Laura M. Schrems-Hoesl. Comparison of bruch’s membrane opening minimum rim width and peripapillary retinal nerve fiber layer thickness in early glaucoma assessmentbmo-mrw and rnflt in early glaucoma assessment. Investigative Ophthalmology and Visual Science, 57(9):OCT575–OCT584, 2016.
- [5] Jost B. Jonas. Glaucoma and choroidal thickness. Journal of Ophthalmic and Vision Research, 9(2):151–153, 2014.
- [6] Zhongjing Lin, Shouyue Huang, Bing Xie, and Yisheng Zhong. Peripapillary choroidal thickness and open-angle glaucoma: A meta-analysis. Journal of Ophthalmology, 2016:12, 2016.
- [7] Sung Chul Park, John Brumm, Rafael L. Furlanetto, Camila Netto, Yiyi Liu, Celso Tello, Jeffrey M. Liebmann, and Robert Ritch. Lamina cribrosa depth in different stages of glaucoma. Investigative Ophthalmology and Visual Science, 56(3):2059–2064, 2015.
- [8] H. A. Quigley and E. M. Addicks. Regional differences in the structure of the lamina cribrosa and their relation to glaucomatous optic nerve damage. Archives of Ophthalmology, 99(1):137–143, 1981.
- [9] H. A. Quigley, E. M. Addicks, W. Green, and A. E. Maumenee. Optic nerve damage in human glaucoma: Ii. the site of injury and susceptibility to damage. Archives of Ophthalmology, 99(4):635–649, 1981.
- [10] J. Crawford Downs, Michael E. Ensor, Anthony J. Bellezza, Hilary W. Thompson, Richard T. Hart, and Claude F. Burgoyne. Posterior scleral thickness in perfusion-fixed normal and early-glaucoma monkey eyes. Investigative Ophthalmology and Visual Science, 42(13):3202–3208, 2001.
- [11] Kyoung Min Lee, Tae-Woo Kim, Robert N. Weinreb, Eun Ji Lee, Michaël J. A. Girard, and Jean Martial Mari. Anterior lamina cribrosa insertion in primary open-angle glaucoma patients and healthy subjects. PLOS ONE, 9(12):e114935, 2014.
- [12] Hongli Yang, Galen Williams, J. Crawford Downs, Ian A. Sigal, Michael D. Roberts, Hilary Thompson, and Claude F. Burgoyne. Posterior (outward) migration of the lamina cribrosa and early cupping in monkey experimental glaucoma. Investigative Ophthalmology and Visual Science, 52(10):7109–7121, 2011.
- [13] B. Al-Diri, A. Hunter, and D. Steel. An active contour model for segmenting and measuring retinal vessels. IEEE Trans Med Imaging, 28(9):1488–97, 2009.
- [14] Faisal A. Almobarak, Neil O’Leary, Alexandre S. C. Reis, Glen P. Sharpe, Donna M. Hutchison, Marcelo T. Nicolela, and Balwantray C. Chauhan. Automated segmentation of optic nerve head structures with optical coherence tomographysegmentation of optic nerve head structures. Investigative Ophthalmology and Visual Science, 55(2):1161–1168, 2014.
- [15] Raheleh Kafieh, Hossein Rabbani, and Saeed Kermani. A review of algorithms for segmentation of optical coherence tomography from retina. Journal of Medical Signals and Sensors, 3(1):45–60, 2013.
- [16] Andrew Lang, Aaron Carass, Matthew Hauser, Elias S. Sotirchos, Peter A. Calabresi, Howard S. Ying, and Jerry L. Prince. Retinal layer segmentation of macular oct images using boundary classification. Biomedical Optics Express, 4(7):1133–1152, 2013.
- [17] Markus A. Mayer, Joachim Hornegger, Christian Y. Mardin, and Ralf P. Tornow. Retinal nerve fiber layer segmentation on fd-oct scans of normal subjects and glaucoma patients. Biomedical Optics Express, 1(5):1358–1383, 2010.
- [18] S. Naz, A. Ahmed, M. U. Akram, and S. A. Khan. Automated segmentation of rpe layer for the detection of age macular degeneration using oct images. In 2016 Sixth International Conference on Image Processing Theory, Tools and Applications (IPTA), pages 1–4.
- [19] Sijie Niu, Qiang Chen, Luis de Sisternes, Daniel L. Rubin, Weiwei Zhang, and Qinghuai Liu. Automated retinal layers segmentation in sd-oct images using dual-gradient and spatial correlation smoothness constraint. Computers in Biology and Medicine, 54:116–128, 2014.
- [20] Jing Tian, Pina Marziliano, Mani Baskaran, Tin Aung Tun, and Tin Aung. Automatic segmentation of the choroid in enhanced depth imaging optical coherence tomography images. Biomedical Optics Express, 4(3):397–411, 2013.
- [21] Li Zhang, Kyungmoo Lee, Meindert Niemeijer, Robert F. Mullins, Milan Sonka, and Michael D. Abràmoff. Automated segmentation of the choroid from clinical sd-oct. Investigative Ophthalmology and Visual Science, 53(12):7510–7519, 2012.
- [22] Jean-Martial Mari, Tin Aung, Ching-Yu Cheng, Nicholas G. Strouthidis, and Michaël J. A. Girard. A digital staining algorithm for optical coherence tomography images of the optic nerve head. Translational Vision Science and Technology, 6(1):8, 2017.
- [23] S. K. Devalla, K. S. Chin, J. M. Mari, T. A. Tun, N. G. Strouthidis, T. Aung, A. H. Thiery, and M. J. A. Girard. A deep learning approach to digitally stain optical coherence tomography images of the optic nerve head. Invest Ophthalmol Vis Sci, 59(1):63–74, 2018.
- [24] David Alonso-Caneiro, Scott A. Read, and Michael J. Collins. Automatic segmentation of choroidal thickness in optical coherence tomography. Biomedical Optics Express, 4(12):2795–2812, 2013.
- [25] John J. Chen and Randy H. Kardon. Avoiding clinical misinterpretation and artifacts of optical coherence tomography analysis of the optic nerve, retinal nerve fiber layer, and ganglion cell layer. Journal of Neuro-Ophthalmology, 36(4):417–438, 2016.
- [26] Michaël J. A. Girard, Nicholas G. Strouthidis, C. Ross Ethier, and Jean Martial Mari. Shadow removal and contrast enhancement in optical coherence tomography images of the human optic nerve head. Investigative Ophthalmology and Visual Science, 52(10):7738–7748, 2011.
- [27] Jean Martial Mari, Nicholas G. Strouthidis, Sung Chul Park, and Michaël J. A. Girard. Enhancement of lamina cribrosa visibility in optical coherence tomography images using adaptive compensationimproving lamina cribrosa visibility in oct images. Investigative Ophthalmology and Visual Science, 54(3):2238–2247, 2013.
- [28] Michaël J. A. Girard, Tin A. Tun, Rahat Husain, Sanchalika Acharyya, Benjamin A. Haaland, Xin Wei, Jean M. Mari, Shamira A. Perera, Mani Baskaran, Tin Aung, and Nicholas G. Strouthidis. Lamina cribrosa visibility using optical coherence tomography: Comparison of devices and effects of image enhancement techniqueslamina cribrosa visibility in oct. Investigative Ophthalmology and Visual Science, 56(2):865–874, 2015.
- [29] Philipp Fischer Olaf Ronneberger and Thomas Brox. U-net: Convolutional networks for biomedical image segmentation. Medical Image Computing and Computer-Assisted Intervention (MICCAI), Springer, LNCS, 9351:234–241, 2015.
- [30] Gabriel Chartrand Samuel Kadoury Chris Pal Michal Drozdzal, Eugene Vorontsov. The importance of skip connections in biomedical image segmentation. arXiv:1608.04117 [cs.CV], 2016.
- [31] Kaiming He Sun, Xiangyu Zhang, Shaoqing Ren, and Jian. Deep residual learning for image recognition. arXiv preprint arXiv:1512.03385, 2015.
- [32] Fisher Yu Koltun and Vladlen. Multi-scale context aggregation by dilated convolutions. ICLR.
- [33] Djork-Arné Clevert and, Thomas Unterthiner and, and Sepp Hochreiter. Fast and accurate deep network learning by exponential linear units(elus). CoRR, abs/1511.07289, 2015.
- [34] M. J. Girard, N. G. Strouthidis, A. Desjardins, J. M. Mari, and C. R. Ethier. In vivo optic nerve head biomechanics: performance testing of a three-dimensional tracking algorithm. J R Soc Interface, 10(87):20130459, 2013.
- [35] John C. Platt Patrice Y. Simard, Dave Steinkraus. Best practices for convolutional neural networks applied to visual document analysis. Proceedings of the Seventh International Conference on Document Analysis and Recognition (ICDAR 2003), 2003.
- [36] A. Lang, A. Carass, B. M. Jedynak, S. D. Solomon, P. A. Calabresi, and J. L. Prince. Intensity inhomogeneity correction of macular oct using n3 and retinal flatspace. Proc IEEE Int Symp Biomed Imaging, 2016:197–200, 2016.
- [37] Z. Wu, G. Xu, R. N. Weinreb, M. Yu, and C. K. Leung. Optic nerve head deformation in glaucoma: A prospective analysis of optic nerve head surface and lamina cribrosa surface displacement. Ophthalmology, 122(7):1317–29, 2015.
- [38] Cong Ye, Marco Yu, and Christopher Kai-shun Leung. Impact of segmentation errors and retinal blood vessels on retinal nerve fibre layer measurements using spectral-domain optical coherence tomography. Acta Ophthalmologica, 94(3):e211–e219, 2016.
- [39] Steven L. Mansberger, Shivali A. Menda, Brad A. Fortune, Stuart K. Gardiner, and Shaban Demirel. Automated segmentation errors when using optical coherence tomography to measure retinal nerve fiber layer thickness in glaucoma. American Journal of Ophthalmology, 174:1–8, 2017.
- [40] Ian C. Campbell, Baptiste Coudrillier, Johanne Mensah, Richard L. Abel, and C. Ross Ethier. Automated segmentation of the lamina cribrosa using frangi’s filter: a novel approach for rapid identification of tissue volume fraction and beam orientation in a trabeculated structure in the eye. Journal of The Royal Society Interface, 12(104), 2015.
- [41] Mei Hui Tan, Sim Heng Ong, Sri Gowtham Thakku, Ching-Yu Cheng, Tin Aung, and Michael Girard. Automatic feature extraction of optical coherence tomography for lamina cribrosa detection. Journal of Image and Graphics, 3(2), 2015.
- [42] Stuart K. Gardiner, Shaban Demirel, Juan Reynaud, and Brad Fortune. Changes in retinal nerve fiber layer reflectance intensity as a predictor of functional progression in glaucoma. Investigative Ophthalmology and Visual Science, 57(3):1221–1227, 2016.
- [43] Y. Liu, H. Simavli, C. J. Que, J. L. Rizzo, E. Tsikata, R. Maurer, and T. C. Chen. Patient characteristics associated with artifacts in spectralis optical coherence tomography imaging of the retinal nerve fiber layer in glaucoma. Am J Ophthalmol, 159(3):565–76.e2, 2015.
- [44] S. Asrani, L. Essaid, B. D. Alder, and C. Santiago-Turla. Artifacts in spectral-domain optical coherence tomography measurements in glaucoma. JAMA Ophthalmol, 132(4):396–402, 2014.
- [45] Rayan A. Alshareef, Sunila Dumpala, Shruthi Rapole, Manideepak Januwada, Abhilash Goud, Hari Kumar Peguda, and Jay Chhablani. Prevalence and distribution of segmentation errors in macular ganglion cell analysis of healthy eyes using cirrus hd-oct. PLOS ONE, 11(5):e0155319, 2016.
- [46] K. E. Kim, J. W. Jeoung, K. H. Park, D. M. Kim, and S. H. Kim. Diagnostic classification of macular ganglion cell and retinal nerve fiber layer analysis: differentiation of false-positives from glaucoma. Ophthalmology, 122(3):502–10, 2015.
- [47] Alexandre S. C. Reis, Neil O’Leary, Hongli Yang, Glen P. Sharpe, Marcelo T. Nicolela, Claude F. Burgoyne, and Balwantray C. Chauhan. Influence of clinically invisible, but optical coherence tomography detected, optic disc margin anatomy on neuroretinal rim evaluation. Investigative Ophthalmology and Visual Science, 53(4):1852–1860, 2012.
- [48] Yong Woo Kim, Jin Wook Jeoung, Dai Woo Kim, Michael J. A. Girard, Jean Martial Mari, Ki Ho Park, and Dong Myung Kim. Clinical assessment of lamina cribrosa curvature in eyes with primary open-angle glaucoma. PLOS ONE, 11(3):e0150260, 2016.
- [49] Eliesa Ing, Kevin M. Ivers, Hongli Yang, Stuart K. Gardiner, Juan Reynaud, Grant Cull, Lin Wang, and Claude F. Burgoyne. Cupping in the monkey optic nerve transection model consists of prelaminar tissue thinning in the absence of posterior laminar deformation. Investigative Ophthalmology and Visual Science, 57(6):2914–2927, 2016.
- [50] S. Moghimi, M. Afzali, M. Akbari, K. B. Ebrahimi, A. Khodabande, A. R. Yazdani-Abyaneh, S. N. H. Ghafouri, P. Coh, S. Okhravi, and M. A. Fard. Crowded optic nerve head evaluation with optical coherence tomography in anterior ischemic optic neuropathy. Eye (Lond), 31(8):1191–1198, 2017.
- [51] Yu Sawada, Masanori Hangai, Katsuyuki Murata, Makoto Ishikawa, and Takeshi Yoshitomi. Lamina cribrosa depth variation measured by spectral-domain optical coherence tomography within and between four glaucomatous optic disc phenotypeslamina cribrosa depth in glaucomatous phenotypes. Investigative Ophthalmology and Visual Science, 56(10):5777–5784, 2015.
- [52] S. G. Thakku, Y. C. Tham, M. Baskaran, J. M. Mari, N. G. Strouthidis, T. Aung, C. Y. Cheng, and M. J. Girard. A global shape index to characterize anterior lamina cribrosa morphology and its determinants in healthy indian eyes. Invest Ophthalmol Vis Sci, 56(6):3604–14, 2015.
- [53] J. Y. You, S. C. Park, D. Su, C. C. Teng, J. M. Liebmann, and R. Ritch. Focal lamina cribrosa defects associated with glaucomatous rim thinning and acquired pits. JAMA Ophthalmol, 131(3):314–20, 2013.
- [54] J. C. Han, D. Y. Choi, Y. K. Kwun, W. Suh, and C. Kee. Evaluation of lamina cribrosa thickness and depth in ocular hypertension. Jpn J Ophthalmol, 60(1):14–9, 2016.
- [55] M. J. Girard, M. R. Beotra, K. S. Chin, A. Sandhu, M. Clemo, E. Nikita, D. S. Kamal, M. Papadopoulos, J. M. Mari, T. Aung, and N. G. Strouthidis. In vivo 3-dimensional strain mapping of the optic nerve head following intraocular pressure lowering by trabeculectomy. Ophthalmology, 123(6):1190–200, 2016.
- [56] Eun Ji Lee, Tae-Woo Kim, Mijin Kim, Michaël J. A. Girard, Jean Martial Mari, and Robert N. Weinreb. Recent structural alteration of the peripheral lamina cribrosa near the location of disc hemorrhage in glaucomarecent alteration of lc and disc hemorrhage. Investigative Ophthalmology and Visual Science, 55(4):2805–2815, 2014.
- [57] Ian A. Sigal, Hongli Yang, Michael D. Roberts, Jonathan L. Grimm, Claude F. Burgoyne, Shaban Demirel, and J. Crawford Downs. Iop-induced lamina cribrosa deformation and scleral canal expansion: Independent or related? Investigative Ophthalmology and Visual Science, 52(12):9023–9032, 2011.
- [58] Ricardo Y. Abe, Carolina P. B. Gracitelli, Alberto Diniz-Filho, Andrew J. Tatham, and Felipe A. Medeiros. Lamina cribrosa in glaucoma: Diagnosis and monitoring. Current ophthalmology reports, 3(2):74–84, 2015.
- [59] E. Hosseini-Asl, M. Ghazal, A. Mahmoud, A. Aslantas, A. M. Shalaby, M. F. Casanova, G. N. Barnes, G. Gimel’farb, R. Keynton, and A. El-Baz. Alzheimer’s disease diagnostics by a 3d deeply supervised adaptable convolutional network. Front Biosci (Landmark Ed), 23:584–596, 2018.
- [60] N. Tajbakhsh, J. Y. Shin, S. R. Gurudu, R. T. Hurst, C. B. Kendall, M. B. Gotway, and Liang Jianming. Convolutional neural networks for medical image analysis: Full training or fine tuning? IEEE Trans Med Imaging, 35(5):1299–1312, 2016.
- [61] Nicholas G. Strouthidis, Jonathan Grimm, Galen A. Williams, Grant A. Cull, David J. Wilson, and Claude F. Burgoyne. A comparison of optic nerve head morphology viewed by spectral domain optical coherence tomography and by serial histology. Investigative Ophthalmology and Visual Science, 51(3):1464–1474, 2010.
- [62] Purvi Raj Bhagat, Kalyani Vivek Deshpande, and Bhagyashree Natu. Utility of ganglion cell complex analysis in early diagnosis and monitoring of glaucoma using a different spectral domain optical coherence tomography. Journal of Current Glaucoma Practice, 8(3):101–106, 2014.
- [63] Ning Fan, Nina Huang, Dennis Shun Chiu Lam, and Christopher Kai-shun Leung. Measurement of photoreceptor layer in glaucoma: A spectral-domain optical coherence tomography study. Journal of Ophthalmology, 2011:264803, 2011.