The radius of the quiescent neutron star in the globular cluster M13
Abstract
X-ray spectra of quiescent low-mass X-ray binaries containing neutron stars can be fit with atmosphere models to constrain the mass and the radius. Mass-radius constraints can be used to place limits on the equation of state of dense matter. We perform fits to the X-ray spectrum of a quiescent neutron star in the globular cluster M13, utilizing data from ROSAT, Chandra and XMM-Newton, and constrain the mass-radius relation. Assuming an atmosphere composed of hydrogen and a 1.4 neutron star, we find the radius to be km, a significant improvement in precision over previous measurements. Incorporating an uncertainty on the distance to M13 relaxes the radius constraints slightly and we find km (for a 1.4 neutron star with a hydrogen atmosphere), which is still an improvement in precision over previous measurements, some of which do not consider distance uncertainty. We also discuss how the composition of the atmosphere affects the derived radius, finding that a helium atmosphere implies a significantly larger radius.
keywords:
globular clusters: general – globular clusters: individual: M13– stars: neutron – X-rays: binaries1 Introduction
One of the unanswered questions in astrophysics concerns the interior physics of neutron stars (NSs), primarily the equation of state (EOS) of dense matter. The EOS, which also defines the relationship between mass and radius, is universal across all NSs (Lattimer & Prakash, 2001). However, constraining this relation is difficult due to the complications involved with measuring NS radii. It is possible to derive constraints on the radius of a NS () from spectral fits to their thermal X-ray emission, for example through spectroscopic observations of thermonuclear bursts (e.g. Özel et al., 2009, 2012; Poutanen et al., 2014; Özel et al., 2016a; Nättilä et al., 2017). Pulse profile modelling of rotation-powered pulsars can also provide an independent, non-spectroscopic method of constraining (Watts et al., 2016; Özel et al., 2016b). One key method of deriving EOS constraints has been through the fitting of X-ray spectra of quiescent low mass X-ray binaries (qLMXBs) containing NSs.
These systems typically exhibit soft X-ray spectra consisting of a thermal, blackbody-like component, sometimes with a harder, non-thermal component (Campana et al., 1998). The nature of the thermal component has been debated over the last few decades. Brown et al. (1998) claimed that the soft X-ray component can be explained by the ‘leakage’ of heat deposited in the core during accretion episodes. This ‘deep crustal heating’ model can predict the thermal spectrum of many qLMXBs (e.g. Rutledge et al., 2001a), though not for those which exhibit short accretion episodes, in which case the heat must be released at a shallower depth (Degenaar et al., 2011). Some qLMXBs may continue to accrete at a low level, somewhat mimicking the spectrum of deep crustal heating (Zampieri et al., 1995).
Regardless of the mechanism powering the soft component, the X-rays originate from the atmosphere of the NS. After accretion ceases, the elements stratify very quickly, leaving the lightest at the top (Alcock & Illarionov, 1980; Romani, 1987). Thus, studies of qLMXBs have often found that the soft X-ray spectra can be well described by a hydrogen atmosphere (e.g. Rutledge et al., 2001a, b; Heinke et al., 2006) and can therefore provide valuable constraints on NS masses and radii.
However, the derived radius constraints are heavily dependent on distance measurements, which are not well known for many LMXBs. Instead, we turn to qLMXBs located in globular clusters, whose distances are known to within (Brown et al., 1998; Rutledge et al., 2002a). With accurate distance measurements, constraints on the NS EOS have been derived from studies of a number of globular cluster qLMXBs. Of the known qLMXBs in globular clusters, a relatively small fraction have sufficient flux, and low enough extinction for dedicated studies of the NS EOS. These include qLMXBs in 47 Tuc (X5 and X7; Heinke et al., 2003, 2006; Bogdanov et al., 2016), M13 (Gendre et al., 2003b; Webb & Barret, 2007; Catuneanu et al., 2013), Cen (Rutledge et al., 2002b; Gendre et al., 2003a; Webb & Barret, 2007; Heinke et al., 2014), M28 (source 26; Becker et al., 2003; Servillat et al., 2012), NGC 6397 (U24; Grindlay et al., 2001; Guillot et al., 2011a; Heinke et al., 2014), NGC 6304 (Guillot et al., 2009a, b, 2013), NGC 2808 (Webb & Barret, 2007; Servillat et al., 2008), NGC 6553 (Guillot et al., 2011b) and M30 (Lugger et al., 2007; Guillot & Rutledge, 2014).
Many previous studies have assumed that the atmosphere of the NS in a qLMXB is purely hydrogen (e.g. Guillot et al., 2013, and references therein). This is a reasonable assumption for typical LMXBs with main sequence donors, as once accretion stops the accreted elements will stratify (Alcock & Illarionov, 1980; Romani, 1987). However, it has been noted that between 28 and 44% of observed bright globular cluster LMXBs are ultracompact sources (i.e. they have orbital periods hr; see Bahramian et al., 2014), suggesting that they require degenerate white dwarf companions devoid of hydrogen, as main sequence stars are not compact enough to exist in such a small orbit. If this fraction transfers to the quiescent population, then it is likely that a significant number of qLMXBs in globular clusters contain NSs with atmospheres composed of heavier elements (He, C, O).
If this is the case, then an X-ray spectrum incorrectly modelled with a hydrogen atmosphere will underestimate the radius, as spectral fits with heavier element atmospheres give larger radii than H atmospheres (Ho & Heinke, 2009). The atmosphere of the NS therefore has important consequences for the EOS and must be considered (e.g. Servillat et al., 2012; Steiner et al., 2018). Unfortunately, it is difficult to determine the correct atmosphere to use without utilising optical observations to detect (or not) hydrogen in the optical spectrum of LMXBs (e.g. Haggard et al., 2004; Degenaar et al., 2010) or identifying the orbital period (e.g. Heinke et al., 2003). We note here that low-level accretion can work to prevent the stratification of elements (Rutledge et al., 2002a), which would introduce additional uncertainties in X-ray spectral models. However, the lack of variability in the majority of globular cluster qLMXBs suggests that the accretion is not a dominant process, and therefore the accretion rate is low enough to allow the atmosphere to stratify (Walsh et al., 2015; Bahramian et al., 2015).
We focus here on the qLMXB source located in the globular cluster M13, discovered by ROSAT (Fox et al., 1996; Verbunt, 2001) and further studied by the XMM-Newton and Chandra X-ray observatories (Gendre et al., 2003b; Webb & Barret, 2007; Servillat et al., 2011; Catuneanu et al., 2013). Since its discovery, there have been a number of attempts to constrain through X-ray observations. This has resulted in a wide range of measurements, from a relatively compact NS ( km Webb & Barret, 2007; Guillot et al., 2013), to a much larger one (, dependent on the chosen atmosphere; Catuneanu et al., 2013).
In this paper we utilise a new, deep observation of M13 with XMM-Newton, deriving the tightest constraints on for this NS yet. We target M13 as the NS has a sufficiently high flux and low hydrogen absorption column () where a modest XMM-Newton observation can make the largest impact in reducing uncertainty on . We discuss our results in the context of the NS EOS and comment on the nature of the NS atmosphere in this particular qLMXB.
2 Observations and Data Reduction
In this work, we utilize data from ROSAT, Chandra and XMM-Newton, focusing in particular on a 2016 ks observation of M13 with the European Photon Imaging Counter (EPIC) detectors on board XMM-Newton. We also use two XMM-Newton observations of the cluster from 2002, a pair of archival Chandra observations from 2006 and a 1992 ROSAT pointing mode observation (see Table LABEL:obs-table).
The reduction of the ROSAT data and subsequent extraction of the spectrum is described by Webb & Barret (2007) and Catuneanu et al. (2013). However, we reprocessed the Chandra and XMM-Newton data using a more recent calibration. The Chandra data were reduced using ciao (Chandra Interactive Analysis of Observations) v4.9 and the Chandra Calibration Database (CALDB) v4.7.3 (Fruscione et al., 2006). The data were reprocessed with the chandra_repro script to apply the latest calibration updates and bad pixel files. We filtered the data in the energy range 0.3–10 keV and found no evidence for background flaring. The spectra were extracted from circles of radius centred on the qLMXB using the ciao script specextract which also generated the corresponding response matrices.
The XMM-Newton data were processed with the Science Analysis System (sas) v15.0.0. For all observations, we extracted events from the EPIC pn (Strüder et al., 2001) and MOS (Turner et al., 2001) detectors using epproc and emproc, respectively. All three XMM-Newton observations revealed signs of background flaring and were therefore filtered to remove the data affected by the periods of the strongest flaring activity. We use filters of 1, 2 and 0.25 count s-1 (MOS) and 4.5, 5 and 0.4 count s-1 (pn), for the 2002 Jan 28, Jan 30 and 2016 Feb 2 observations, respectively.
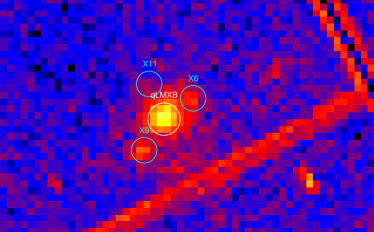
Circular regions with radii of 9.5 were used to extract the spectra of the NS qLMXB. This ensured that photons from nearby X-ray sources (X6, X9 and X11; Servillat
et al., 2011) were excluded (Fig. 1). Response matrices were generated using rmfgen and arfgen and the spectra were grouped such that they contained at least 20 counts per bin. To achieve better statistics, the two MOS spectra from each observation were combined using the heasoft v6.19 tool addspec.
| Mission | ObsID | Date | Detector | GTI |
|---|---|---|---|---|
| (s) | ||||
| ROSAT | RP300181N00 | 1992 Sep | PSPCB | 45872 |
| XMM-Newton | 0085280301 | 2002 Jan 28 | MOS1+MOS2 | 35222 |
| PN | 14033 | |||
| XMM-Newton | 0085280801 | 2002 Jan 30 | MOS1+MOS2 | 30868 |
| PN | 12032 | |||
| Chandra | 7290 | 2006 Mar 9 | ACIS-S | 27894 |
| Chandra | 5436 | 2006 Mar 11 | ACIS-S | 26800 |
| XMM-Newton | 0760750101 | 2016 Feb 2 | MOS1+MOS2 | 96653 |
| PN | 81587 |
3 Data Analysis and Results
3.1 Spectral fits
All spectral fits were performed using xspec v12.9.1p (Arnaud, 1996) which uses the minimisation technique to determine the best fit model. The interstellar absorption is accounted for by the tbabs model with Wilms et al. (2000) abundances and photo-ionisation cross-sections described by Verner et al. (1996). In all models we assume a distance to M13 of kpc (McLaughlin & van der Marel, 2005). We choose this distance as it is consistent with (and between) kpc as calculated by Sandquist et al. (2010) and kpc determined by Recio-Blanco et al. (2005), as well as to be able to draw comparisons with Webb & Barret (2007) and Catuneanu et al. (2013), who both use kpc. We used a normalization constant to account for the cross-calibration differences between each detector, allowing the constant to vary relative to the MOS detectors, for which it was fixed to unity. In all fits, in addition to the relevant NS atmosphere model, we also included a thermal bremsstrahlung model for the fit to the ROSAT data, to account for the cataclysmic variable (CV) source X6 (Servillat et al., 2011), which was not resolved as an individual point source by ROSAT. We fixed of the bremsstrahlung model to 4.5 keV (Webb & Barret, 2007; Catuneanu et al., 2013). All uncertainties are quoted at the 90% confidence level, unless otherwise stated.
3.1.1 Hydrogen atmosphere model
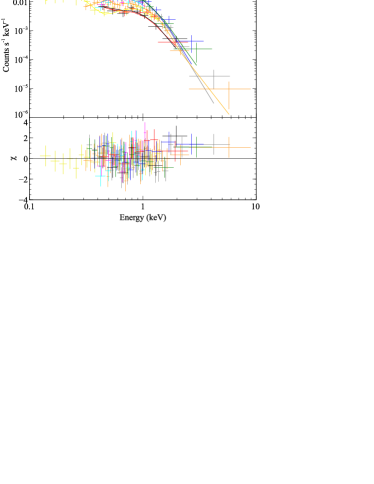
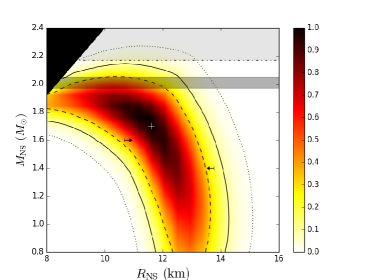
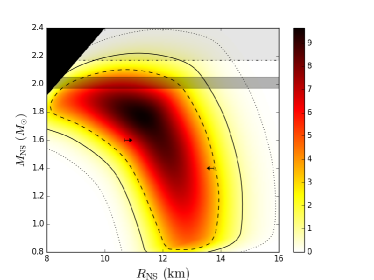
We fit the XMM-Newton, Chandra and ROSAT spectra simultaneously with an absorbed hydrogen atmosphere model nsatmos (Heinke et al., 2006). The spectra are plotted in Fig. 2 and the best-fit model parameters are displayed in Table LABEL:fits, assuming a fixed NS mass of . The resulting absorption column is consistent with cm-2 in the direction of M13, which is inferred from the extinction, 111http://physwww.mcmaster.ca/%7Eharris/mwgc.ref, derived by Harris 1996 (2010 edition), and using Bahramian et al. (2015) to convert between and . We determine a best fit NS radius km. The determined radius is consistent with that of Catuneanu et al. (2013), km, with tighter constraints. Allowing the mass to vary gives a best fit with and km. To visualise the derived mass-radius relationship we calculate the contours with the steppar command in xspec and convert this to a probability distribution , shown in Fig. 3 (see e.g. Steiner et al., 2018).
3.1.2 Helium atmosphere model
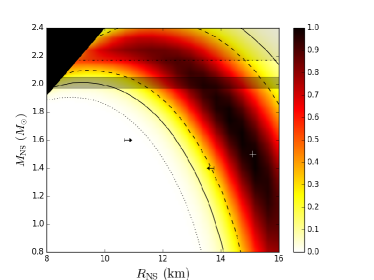
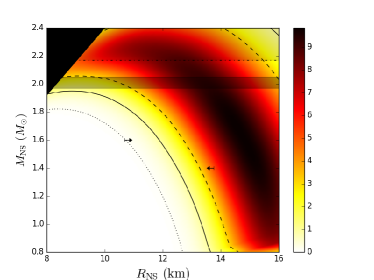
We also fit the spectra with an absorbed helium-atmosphere model nsx (Ho & Heinke, 2009). The best-fit model parameters, assuming a NS, are presented in Table LABEL:fits. For a NS, the helium atmosphere model determines a best-fit NS radius of km, km larger than that implied by a hydrogen atmosphere. As with the H-atmosphere fits, the inferred absorption column is consistent with that in the direction of M13 (Harris, 1996, 2010 edition). If we allow the mass to vary we find a best fit km with a . The mass-radius probability distribution is plotted in Fig. 4.
| Parameter | nsatmos | nsx |
|---|---|---|
| cm-2 | cm-2 | |
| km | km | |
| 128.6/148 | 123.3/148 |
The helium atmosphere model provides a slightly better fit to the spectra ( for the same degrees of freedom) than the hydrogen model. However, both models are considered an acceptable fit to the data. Therefore it is not possible to determine from the fitting which atmosphere model is the correct one.
4 Discussion
4.1 The effect of distance uncertainty
We have computed our spectral fits assuming a distance to M13 kpc (McLaughlin & van der Marel, 2005). However, this did not include its associated uncertainty, which can have an effect on the inferred mass-radius relation. We can incorporate this into the probability distribution by integrating over the distance uncertainty (following the method of Steiner et al., 2018). Using a conservative uncertainty of kpc (Sandquist et al., 2010), we find km and km for a NS with a H and He atmosphere, respectively. As expected, introducing an uncertainty on distance increases the radius uncertainties accordingly. The density distributions are plotted in Fig. 5, and show a similar increase in the mass-radius contours.
4.2 Hydrogen vs. helium atmosphere
We have shown that the NS mass and radius constraints are highly dependent on the chosen atmosphere model. If we fix , we find that increases by km if the atmosphere is composed of helium versus hydrogen. It is therefore important to distinguish the nature of the companion in order to choose the correct model. Steiner et al. (2018) model the spectra of eight qLMXBs in globular clusters, and combine them to place constraints on the EOS, based on the knowledge that all NSs must have the same EOS (Lattimer & Prakash, 2001). Steiner et al. (2018) calculate the probability of the qLMXB in M13 having a helium atmosphere to be , but with the tighter constraints provided by this work, this probability is likely to be even lower, despite the lower for a helium atmosphere model (compared to hydrogen) suggesting a better fit. However, the only reliable way to distinguish between hydrogen and helium atmospheres in NS LMXBs is through direct optical/NIR observations of the counterpart.
4.3 Neutron star equation of state
Our results tighten the constraints on the mass and radius of the NS presented by Catuneanu et al. (2013), which has implications for the NS EOS. Previous studies of M13 claim tighter constraints on and (Gendre et al., 2003b; Webb & Barret, 2007) than this work, but these results were not reproduced in later studies (Catuneanu et al., 2013; Guillot et al., 2013). Our results are consistent with Catuneanu et al. (2013) and our derived radius (for a NS) falls within the preferred range of 10–14 km for NSs, calculated from observations of multiple qLMXBs and taking into account the effects that a number of uncertainties (e.g. distance, atmosphere composition) have on the inferred mass-radius relation (Steiner et al., 2018).
A previous study fitting spectra of M13 and other qLMXBs by Guillot et al. (2013) preferred a smaller km (where indicates that the parameter was pegged at the hard limit of the model) for M13. However, in that study, a smaller distance was chosen ( kpc; Rees, 1996) rather than the 7.7 kpc we utilise in this work (McLaughlin & van der Marel, 2005), a distance in agreement with measurements by Recio-Blanco et al. (2005) and Sandquist et al. (2010) (see also Steiner et al., 2018). We note that if we instead choose kpc, we find km, consistent with the value derived by Guillot et al. (2013).
The detection of gravitational waves (GW170817) from two merging NSs (Abbott et al., 2017a) has placed some limits on the NS EOS. The event placed an upper limit on the tidal deformability parameter (, an intrinsic NS property sensitive to the stellar compactness). Limits on the tidal deformability obtained as the two bodies approached coalescence ( for ; Abbott et al., 2017a) can be translated into an upper limit on the radius of a NS ( km; Fattoyev et al., 2017). Information from the short gamma-ray burst that followed the merger 1.7s later (e.g. Abbott et al., 2017b; Goldstein et al., 2017; Savchenko et al., 2017) can be used to infer a limit on the maximum mass of a NS of (Margalit & Metzger, 2017; Shibata et al., 2017; Rezzolla et al., 2018). We must note, however, that these calculations, though all consistent and performed independently of one another, are heavily dependent on physical assumptions about the type of compact object formed in the merger. Finally, Bauswein et al. (2017) calculated a lower limit of km (for ), also assuming that the merger did not result in a prompt collapse to a black hole - as suggested by the detection of a kilonova (Kasen et al., 2017; Pian et al., 2017; Smartt et al., 2017). Though the radius constraints inferred from GW170817 do not fully rule out the possibility of a He atmosphere in the M13 qLMXB, they are in agreement with Steiner et al. (2018) in that it is unlikely to be the case.
5 Conclusions
We have derived NS mass-radius constraints for the qLMXB located in the globular cluster M13 using archival observations and a new, deep observation of the cluster with XMM-Newton. We provide the tightest constraints on the radius of the NS ( km assuming a H atmosphere and ), which are in good agreement with the limits on the NS EOS derived by Steiner et al. (2018). We find that introducing a conservative uncertainty on distance (Sandquist et al., 2010), increases the radius uncertainties accordingly. We cannot definitively rule out a He atmosphere, but spectral fits infer a much larger km, which overlaps with the upper edge of the km range derived by Steiner et al. (2018). In addition, limits on derived from the NS-NS merger GW170817 (Abbott et al., 2017a; Fattoyev et al., 2017) disfavour a He atmosphere interpretation for the qLMXB in M13. To verify the nature of the atmosphere of the NS, we require spectroscopy of the optical/NIR counterpart, which has not yet been discovered.
Acknowledgements
We thank the anonymous referee for useful comments which helped improve the manuscript. AWS would like to thank S. Morsink, G. Sivakoff and R. Fernández for useful discussions regarding the neutron star equation of state. COH is supported by an NSERC Discovery Grant and a Discovery Accelerator Supplement. AWSteiner is supported by grant NSF PHY 1554876. WCGH acknowledges funding from STFC in the UK through grant number ST/M000931/1.
References
- Abbott et al. (2017a) Abbott B. P., et al., 2017a, Physical Review Letters, 119, 161101
- Abbott et al. (2017b) Abbott B. P., et al., 2017b, ApJ, 848, L12
- Alcock & Illarionov (1980) Alcock C., Illarionov A., 1980, ApJ, 235, 534
- Antoniadis et al. (2013) Antoniadis J., et al., 2013, Science, 340, 448
- Arnaud (1996) Arnaud K. A., 1996, in Jacoby G. H., Barnes J., eds, Astronomical Society of the Pacific Conference Series Vol. 101, Astronomical Data Analysis Software and Systems V. p. 17
- Bahramian et al. (2014) Bahramian A., et al., 2014, ApJ, 780, 127
- Bahramian et al. (2015) Bahramian A., Heinke C. O., Degenaar N., Chomiuk L., Wijnands R., Strader J., Ho W. C. G., Pooley D., 2015, MNRAS, 452, 3475
- Bauswein et al. (2017) Bauswein A., Just O., Janka H.-T., Stergioulas N., 2017, ApJ, 850, L34
- Becker et al. (2003) Becker W., et al., 2003, ApJ, 594, 798
- Bogdanov et al. (2016) Bogdanov S., Heinke C. O., Özel F., Güver T., 2016, ApJ, 831, 184
- Brown et al. (1998) Brown E. F., Bildsten L., Rutledge R. E., 1998, ApJ, 504, L95
- Campana et al. (1998) Campana S., Colpi M., Mereghetti S., Stella L., Tavani M., 1998, A&ARv, 8, 279
- Catuneanu et al. (2013) Catuneanu A., Heinke C. O., Sivakoff G. R., Ho W. C. G., Servillat M., 2013, ApJ, 764, 145
- Degenaar et al. (2010) Degenaar N., et al., 2010, MNRAS, 404, 1591
- Degenaar et al. (2011) Degenaar N., Brown E. F., Wijnands R., 2011, MNRAS, 418, L152
- Fattoyev et al. (2017) Fattoyev F. J., Piekarewicz J., Horowitz C. J., 2017, preprint, (arXiv:1711.06615)
- Fox et al. (1996) Fox D., Lewin W., Margon B., van Paradijs J., Verbunt F., 1996, MNRAS, 282, 1027
- Fruscione et al. (2006) Fruscione A., et al., 2006, in Society of Photo-Optical Instrumentation Engineers (SPIE) Conference Series. p. 62701V, doi:10.1117/12.671760
- Gendre et al. (2003a) Gendre B., Barret D., Webb N. A., 2003a, A&A, 400, 521
- Gendre et al. (2003b) Gendre B., Barret D., Webb N., 2003b, A&A, 403, L11
- Goldstein et al. (2017) Goldstein A., et al., 2017, ApJ, 848, L14
- Grindlay et al. (2001) Grindlay J. E., Heinke C. O., Edmonds P. D., Murray S. S., Cool A. M., 2001, ApJ, 563, L53
- Guillot & Rutledge (2014) Guillot S., Rutledge R. E., 2014, ApJ, 796, L3
- Guillot et al. (2009a) Guillot S., Rutledge R. E., Bildsten L., Brown E. F., Pavlov G. G., Zavlin V. E., 2009a, MNRAS, 392, 665
- Guillot et al. (2009b) Guillot S., Rutledge R. E., Brown E. F., Pavlov G. G., Zavlin V. E., 2009b, ApJ, 699, 1418
- Guillot et al. (2011a) Guillot S., Rutledge R. E., Brown E. F., 2011a, ApJ, 732, 88
- Guillot et al. (2011b) Guillot S., Rutledge R. E., Brown E. F., Pavlov G. G., Zavlin V. E., 2011b, ApJ, 738, 129
- Guillot et al. (2013) Guillot S., Servillat M., Webb N. A., Rutledge R. E., 2013, ApJ, 772, 7
- Haensel et al. (1999) Haensel P., Lasota J. P., Zdunik J. L., 1999, A&A, 344, 151
- Haggard et al. (2004) Haggard D., Cool A. M., Anderson J., Edmonds P. D., Callanan P. J., Heinke C. O., Grindlay J. E., Bailyn C. D., 2004, ApJ, 613, 512
- Harris (1996) Harris W. E., 1996, AJ, 112, 1487
- Heinke et al. (2003) Heinke C. O., Grindlay J. E., Lloyd D. A., Edmonds P. D., 2003, ApJ, 588, 452
- Heinke et al. (2006) Heinke C. O., Rybicki G. B., Narayan R., Grindlay J. E., 2006, ApJ, 644, 1090
- Heinke et al. (2014) Heinke C. O., et al., 2014, MNRAS, 444, 443
- Ho & Heinke (2009) Ho W. C. G., Heinke C. O., 2009, Nature, 462, 71
- Kasen et al. (2017) Kasen D., Metzger B., Barnes J., Quataert E., Ramirez-Ruiz E., 2017, Nature, 551, 80
- Lattimer & Prakash (2001) Lattimer J. M., Prakash M., 2001, ApJ, 550, 426
- Lugger et al. (2007) Lugger P. M., Cohn H. N., Heinke C. O., Grindlay J. E., Edmonds P. D., 2007, ApJ, 657, 286
- Margalit & Metzger (2017) Margalit B., Metzger B. D., 2017, ApJ, 850, L19
- McLaughlin & van der Marel (2005) McLaughlin D. E., van der Marel R. P., 2005, ApJS, 161, 304
- Nättilä et al. (2017) Nättilä J., Miller M. C., Steiner A. W., Kajava J. J. E., Suleimanov V. F., Poutanen J., 2017, A&A, 608, A31
- Özel et al. (2009) Özel F., Güver T., Psaltis D., 2009, ApJ, 693, 1775
- Özel et al. (2012) Özel F., Gould A., Güver T., 2012, ApJ, 748, 5
- Özel et al. (2016a) Özel F., Psaltis D., Güver T., Baym G., Heinke C., Guillot S., 2016a, ApJ, 820, 28
- Özel et al. (2016b) Özel F., Psaltis D., Arzoumanian Z., Morsink S., Bauböck M., 2016b, ApJ, 832, 92
- Pian et al. (2017) Pian E., et al., 2017, Nature, 551, 67
- Poutanen et al. (2014) Poutanen J., Nättilä J., Kajava J. J. E., Latvala O.-M., Galloway D. K., Kuulkers E., Suleimanov V. F., 2014, MNRAS, 442, 3777
- Recio-Blanco et al. (2005) Recio-Blanco A., et al., 2005, A&A, 432, 851
- Rees (1996) Rees Jr. R. F., 1996, in Morrison H. L., Sarajedini A., eds, Astronomical Society of the Pacific Conference Series Vol. 92, Formation of the Galactic Halo…Inside and Out. p. 289
- Rezzolla et al. (2018) Rezzolla L., Most E. R., Weih L. R., 2018, ApJ, 852, L25
- Romani (1987) Romani R. W., 1987, ApJ, 313, 718
- Rutledge et al. (2001a) Rutledge R. E., Bildsten L., Brown E. F., Pavlov G. G., Zavlin V. E., 2001a, ApJ, 551, 921
- Rutledge et al. (2001b) Rutledge R. E., Bildsten L., Brown E. F., Pavlov G. G., Zavlin V. E., 2001b, ApJ, 559, 1054
- Rutledge et al. (2002a) Rutledge R. E., Bildsten L., Brown E. F., Pavlov G. G., Zavlin V. E., 2002a, ApJ, 577, 346
- Rutledge et al. (2002b) Rutledge R. E., Bildsten L., Brown E. F., Pavlov G. G., Zavlin V. E., 2002b, ApJ, 578, 405
- Sandquist et al. (2010) Sandquist E. L., Gordon M., Levine D., Bolte M., 2010, AJ, 139, 2374
- Savchenko et al. (2017) Savchenko V., et al., 2017, ApJ, 848, L15
- Servillat et al. (2008) Servillat M., et al., 2008, A&A, 490, 641
- Servillat et al. (2011) Servillat M., Webb N. A., Lewis F., Knigge C., van den Berg M., Dieball A., Grindlay J., 2011, ApJ, 733, 106
- Servillat et al. (2012) Servillat M., Heinke C. O., Ho W. C. G., Grindlay J. E., Hong J., van den Berg M., Bogdanov S., 2012, MNRAS, 423, 1556
- Shibata et al. (2017) Shibata M., Fujibayashi S., Hotokezaka K., Kiuchi K., Kyutoku K., Sekiguchi Y., Tanaka M., 2017, Phys. Rev. D, 96, 123012
- Smartt et al. (2017) Smartt S. J., et al., 2017, Nature, 551, 75
- Steiner et al. (2018) Steiner A. W., Heinke C. O., Bogdanov S., Li C., Ho W. C. G., Bahramian A., Han S., 2018, MNRAS,
- Strüder et al. (2001) Strüder L., et al., 2001, A&A, 365, L18
- Turner et al. (2001) Turner M. J. L., et al., 2001, A&A, 365, L27
- Verbunt (2001) Verbunt F., 2001, A&A, 368, 137
- Verner et al. (1996) Verner D. A., Ferland G. J., Korista K. T., Yakovlev D. G., 1996, ApJ, 465, 487
- Walsh et al. (2015) Walsh A. R., Cackett E. M., Bernardini F., 2015, MNRAS, 449, 1238
- Watts et al. (2016) Watts A. L., et al., 2016, Reviews of Modern Physics, 88, 021001
- Webb & Barret (2007) Webb N. A., Barret D., 2007, ApJ, 671, 727
- Wilms et al. (2000) Wilms J., Allen A., McCray R., 2000, ApJ, 542, 914
- Zampieri et al. (1995) Zampieri L., Turolla R., Zane S., Treves A., 1995, ApJ, 439, 849