Evidence for hot clumpy accretion flow in the transitional millisecond pulsar PSR J1023+0038
Abstract
We present simultaneous optical and near-infrared (IR) photometry of the millisecond pulsar PSR J1023+0038 during its low-mass X-ray binary phase. The - and -band light curves show rectangular, flat-bottomed dips, similar to the X-ray mode-switching (active–passive state transitions) behaviour observed previously. The cross-correlation function (CCF) of the optical and near-IR data reveals a strong, broad negative anti-correlation at negative lags, a broad positive correlation at positive lags, with a strong, positive narrow correlation superimposed. The shape of the CCF resembles the CCF of black hole X-ray binaries but the time-scales are different. The features can be explained by reprocessing and a hot accretion flow close to the neutron star’s magnetospheric radius. The optical emission is dominated by the reprocessed component, whereas the near-IR emission contains the emission from plasmoids in the hot accretion flow and a reprocessed component. The rapid active–passive state transition occurs when the hot accretion flow material is channelled onto the neutron star and is expelled from its magnetosphere. During the transition the optical reprocessing component decreases resulting in the removal of a blue spectral component. The accretion of clumpy material through the magnetic barrier of the neutron star produces the observed near-IR/optical CCF and variability. The dip at negative lags corresponds to the suppression of the near-IR synchrotron component in the hot flow, whereas the broad positive correlation at positive lags is driven by the increased synchrotron emission of the outflowing plasmoids. The narrow peak in the CCF is due to the delayed reprocessed component, enhanced by the increased X-ray emission.
keywords:
binaries: close – stars: fundamental parameters – stars: individual: PSR J1023+0038 – stars: neutron – X-rays: binaries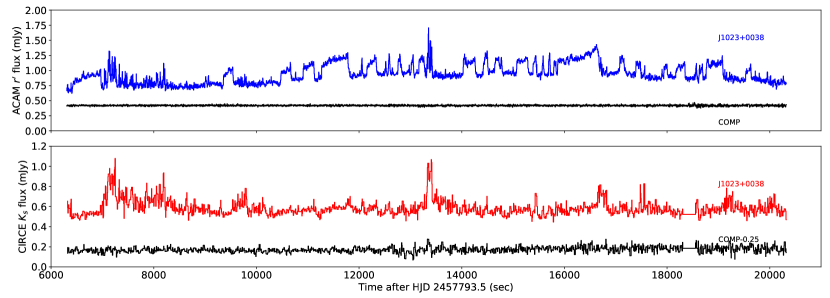

1 Introduction
Millisecond radio pulsars (MSPs) are believed to be the descendants of old, slowly rotating weakly magnetic field neutron stars that show radio, X-ray, and/or -ray pulsations, that are present in low-mass X-ray binaries (LMXBs). The theory of recycled pulsars suggests that after the neutron star turns off its radio pulsations, the transfer of angular momentum from the low-mass companion star to the neutron star via accretion is responsible for the spin-up of the initially slowly rotating neutron star (Alpar et al., 1982; Radhakrishnan & Srinivasan, 1982). During this accretion phase, X-ray pulsations at the spin frequency of the neutron star are detected and the system shows the typical features of an accreting millisecond X-ray pulsar (AMXP). The recycling scenario of MSPs discussed above was initially confirmed by PSR J1023+0038 (Archibald et al., 2009), which was the first source that showed the transition between the rotation powered state to the accretion powered state. We now know of three transitional MSPs: PSR J1023+0038 (Archibald et al., 2009), XSS J12270–4859 (Bogdanov et al., 2014) and M28I (=IGR J18245–2452) (Papitto et al., 2013).
PSR J1023+0038 transitioned from a rotation-powered to an accretion-powered LMXB state in 2013 June (Stappers et al., 2013; Patruno et al., 2014; Takata et al., 2014) and so far has remained in this state. The state transition involved the disappearance of the radio pulsed signal as well as an increase in the GeV flux by a factor 5 (Stappers et al., 2014). In the optical, the system brightened by 1 mag and showed the presence of several broad emission lines typical of an accretion disc (Halpern et al., 2013). In the LMXB state, the X-ray luminosity varied between erg s-1 showing three distinct states: (1) high “active” state with erg s-1 present 80 per cent of the time; (2) low “passive” state with 1032 erg s-1 present 20 per cent of the time; (3) and the “flare” state with erg s-1 present for about 2 per cent of the time (Archibald et al., 2015; Bogdanov, 2015). Coherent X-ray pulsations have been observed but appear only in the high state, and have been interpreted as being due to the inflowing accretion material heating the magnetic polar caps of rotating neutron star (Archibald et al., 2015). The transitions between the low and high states are very rapid with a time-scale of 10 s and results in rectangular-shaped dips in the X-ray light which seem to be ubiquitous in all of the X-ray observations. Similar variability has also been observed at optical wavelengths with rectangular dip ingress and egress times of 20 s (Shahbaz et al., 2015; Bogdanov & Halpern, 2015). However, given the limited simultaneous optical/X-ray observations, it is not clear if the X-ray and optical dips are direct counterparts of each other. Simultaneous XMM–Newton X-ray and -band optical light curves show X-ray dips that do not usually have corresponding optical dips (Bogdanov, 2015). However, the uncertaintes in the -band data are large and given that the dips in the blue are weak (Shahbaz et al., 2015). one cannot rule out if the dips are present.
In this paper we present the results of simultaneous optical/near-IR fast imaging of PSR J1023+0038. We deterimine the auto-correlation function (ACF) of the optical and near-IR light curves as well as the cross-correlation (CCF) function of the two light curves. We explain the observed features of the ACFs and CCFs as due to the hot, clumpy inner accetion flow close to the pulsar’s magnetosphere.
2 Observations and data reduction
2.1 High-speed optical photometry
Fast optical imaging of PSR J1023+0038 was carried out on the night of 2017 February 8 using ACAM on the 4.2 m William Herschel Telescope (WHT). The CCD was binned by a factor of 2 and windowed down to 200400 pixels, which reduced the dead time between exposures to only 1.85 s. The plate scale was 0.25 arcsec pixel-1. We used the filter and an exposure time of 2.0 s which resulted in a time resolution of 3.85 s. Observations were obtained from 2017 February 9 01:37:21 to 05:31:29 UT and the seeing was typically between 1.0–2.0 arcsec.
The images were first bias-subtracted and flat-fielded. The target counts were then extracted using optimal photometry with a seeing-dependent variable circular aperture tracking the centroid of the source on each image. The sky background was measured from the clipped mean in an annular aperture around the target. Relative photometry of PSR J1023+0038 was then carried out with respect to the local standard star SDSS J102343.30+003819.1 = 14.778. The mean magnitude of PSR J1023+0038 was = 16.48.
2.2 High-speed near-Infrared photometry
Fast near-Infrared imaging of PSR J1023+0038 was carried out on the night of 2017 February 8 using Canarias InfraRed Camera Experiment (CIRCE; Eikenberry et al. 2017) on the 10.4 m Gran Telescopio Canarias (GTC). The plate scale of the array was 0.1 arcsec pixel-1 and the image size was 18551365 pixels. The filter was used with an exposure time of 5.0 s and a dead-time of 1 s, resulting in a time resolution of 5 s. A five-point dither pattern was used with 5 exposures at each dither position. Observations were obtained from 2017 February 9 01:12:21 to 05:31:04 UT. Dark images were also taken with the same detector configuration and exposure time.
The CIRCE data reduction was carried out using the SuperFATBOY111SuperFATBOY is an XML-controlled GPU-enabled Python pipeline developed at the University of Florida data reduction pipeline. We first performed the linearity correction and dark subtraction on all the images. A flat-field was then generated and applied to the science images. The sky background was determined using the images in each dither pattern. Finally, bad pixels and cosmic ray events were interpolated and the images binned by 2 pixels to improve signal-to-noise.
Before extractng the counts from the stars in the field the images were first shifted and aligned. We used optimal photometry with a seeing-dependent variable circular aperture tracking the centroid of the source on each image to determine the star counts. The sky background was measured from the clipped mean in an annular aperture around the target. Relative photometry of PSR J1023+0038 was then carried out with respect to the local standard star 2MASSXJ10235051+0038163 with = 14.894 (the ACAM local standard could not be used because it occasionally fell into the cosmetic gap of the IR array). The mean magnitude of PSR J1023+0038 was = 15.14.
3 LIGHT CURVES
Figure 1 shows the observed flux - and -band light curves of PSR J1023+0038 and a comparison star of similar brightness, where we converted the magnitudes to flux density using the appropriate zero point for each band. The -band light curve clearly show the secondary star’s heated ellipsoidal modulation with superimposed flaring activity. Flares and rectangular shaped dips are present similar to previous optical light curves (Shahbaz et al., 2015; Bogdanov, 2015). We also show the light curves of the comparison stars. As one can see there is some low-level structure in the -band comparison star light curve.
Fig. 2 shows the de-reddened, de-trended - and -band flux light curves. We used a colour excess of E(B-V) = 0.073 (Shahbaz et al., 2015) and = 3.1 (Cardelli et al., 1989) to de-reddened the magnitudes and then converted the magnitudes to flux density. Finally we de-trended the light curves using a 3rd and 1st order polynomial for the - and band light curves, respectively. The passive-, active- and flare-states are clearly seen in the -band light curve rectangular, flat-bottomed dip features are apparent, which are similar to the mode-switching behaviour (passive- and active-state) that have been observed in the X-ray and optical light curves (Tendulkar et al., 2014; Bogdanov, 2015; Shahbaz et al., 2015). The histogram of the de-reddened, de-trended -band flux values (see Fig. 2) clearly show a bi-modal distribution between the passive- and active-states. Such a distribution is not so apparent in the -band light curve. This is because the rectangular dips in the -band light curve are deeper than the dips in the -band light curve; the active minus passive (active-passive) flux of the de-reddened light curves are 0.40 and 0.14 mJy for the - and band light curves, respectively.
3.1 Light curve correlations
In an attempt to understand the origin and emission mechanism of the optical and near-IR light curves, we calculate the ACF of the optical and near-IR light curves and the CCF between the observed optical and near-IR light curves. The analysis is a simple determination of the relative time-variability between the two wavelength dependent light curves and provides a clear, uncomplicated (average) comparison of the two signals with respect to time. The ACF represents a correlation of a light curve with itself, and gives a measure of the effective coherence time-scales in the data. The CCF represents the convolution of two light curve and reveals whether they have the same features and the time delay between them. To determine the ACF and CCF between two light curves (i.e. the cross-correlation coefficient versus time-delay between the light curves) we compute the discrete correlation function (DCF) using pydc222https://github.com/astronomerdamo/pydcf, which works well with unevenly sampled data (Edelson & Krolik, 1988; Robertson et al., 2015). Positive time-lags mean that the optical leads the near-IR, whereas negative time-lags means that the optical lags the near-IR. To calculate the ACF we use the whole light curve and the time-resolution of the data. To calculate the CCF between optical and near-IR light curves we only use data that are simultaneous (14000 s). Given that time-resolution of the -band data is better than the -band data, when calculating the CCF we rebin the light curves to the best time resolution of the -band data.
3.1.1 ACFs
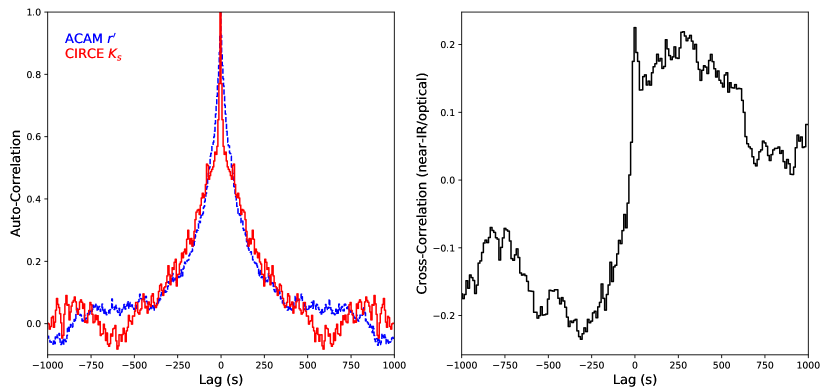
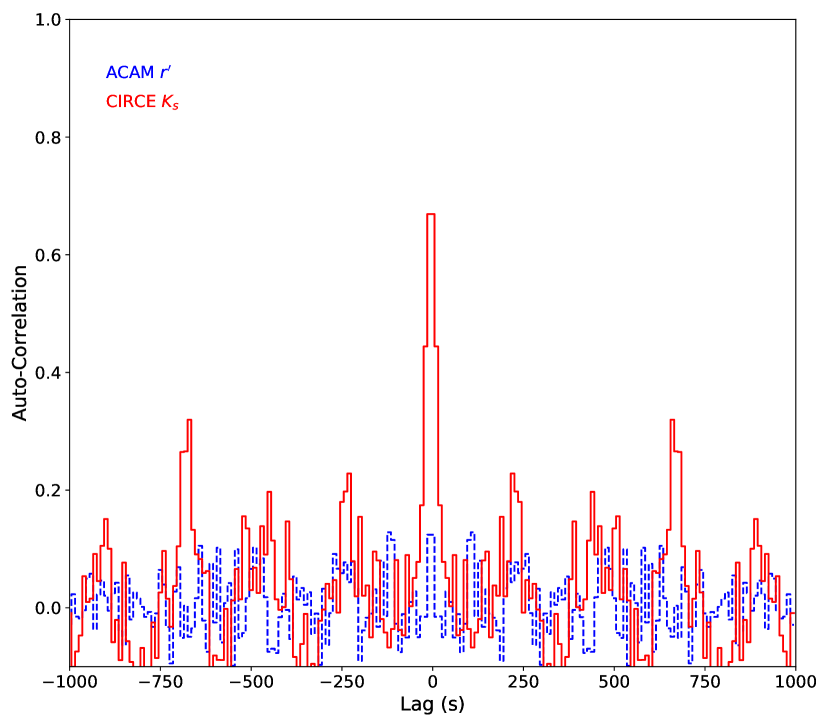
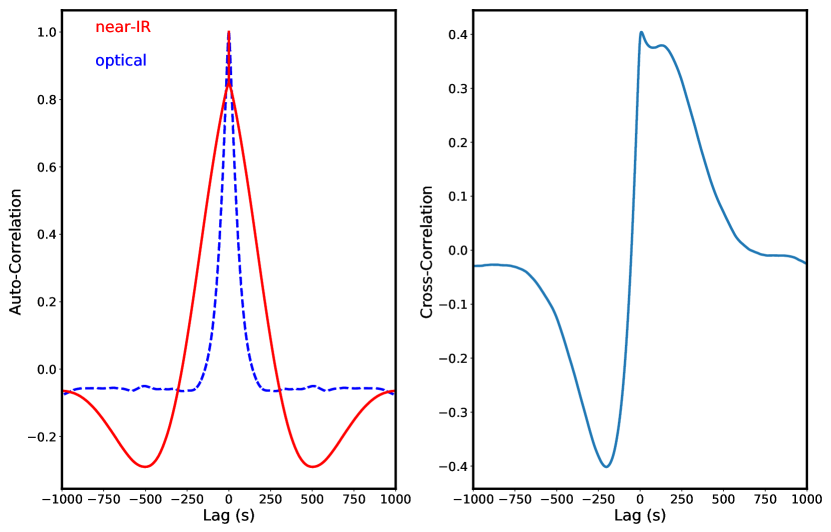
In Fig. 3 we show the ACF of entire - and -band light curves of PSR J1023+0038. The - and -band ACFs have different widths; with a full width at half maximum (FWHM) of 130 s and 90 s, respectively. Above 70 s the -band ACF is broader than the -band ACF, which argues for a reprocessing origin for the slowly-variable component, most likely in the outer regions of the accretion disc. However, very close to the core, the -band ACF is broader than the -band ACF, which argues against a simple reprocessing origin (see Section 4.3). The -band comparison star light curve (see Fig. 1) shows some low-level correlated variability. Indeed, this is seen in its ACF (see Fig. 4), which has a non-zero width, with a full width at half maximum of 40 s, similar to the time-scale of the dither pattern (see Section 2.2). In contrast, the ACF of the -band comparison star light curve does not show any peaks. This suggests that there are some low-level systematics in the data reduction of the near-IR data possibly due to under-corrected cosmetic defects in the CIRCE engineering-grade detector array. Hence, the true width of the ACF of PSR J1023+0038 is smaller.
In Fig. 3 we show the optical and near-IR CCF using all the simultaneous optical and near-IR data (14000 s). The negative lag implies the optical band is delayed with respect to the near-IR, whereas an anti-correlation implies that the variability between the near-IR and optical fluxes is out of phase. We observe a strong, broad negative anti-correlation on time-scales of -300 s, a broad positive correlation near-IR lag at +300 s and a strong, positive and narrow correlation at +5 s (see Fig. 3).
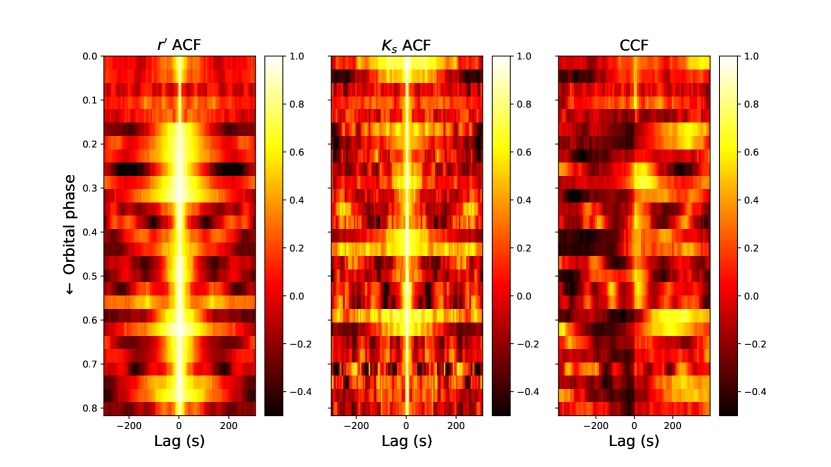
To see if there is a time-dependent evolution in the ACF and CCF we compute the dynamic ACF and CCFs (see Fig. 5) calculated using a windows size of 1000 s and a step size of 500 s, i.e. overlapping sections where every second ACF/CCF is independent. A mean CCF is then derived for each time series pair, which effectively acts as a high-pass filter, and variations with time-scales longer than 500 s do not appear. One can see, the -band ACF is not always broader than the -band ACF, the width of the ACFs change with time.
3.1.2 Light curves
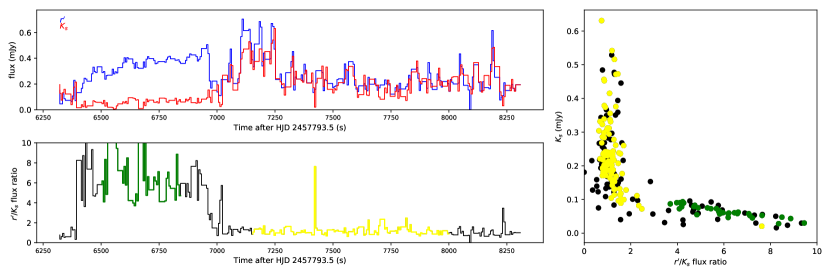
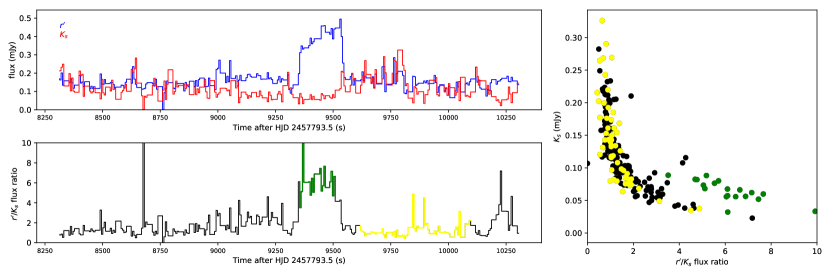
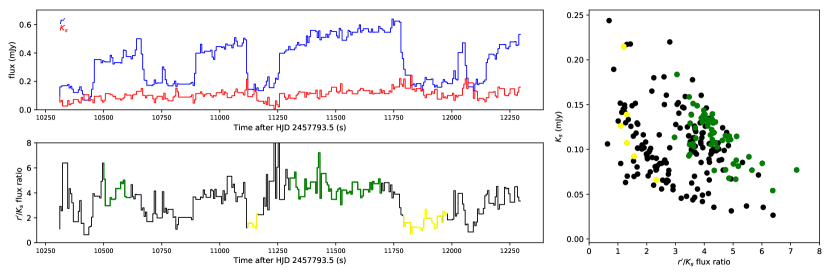
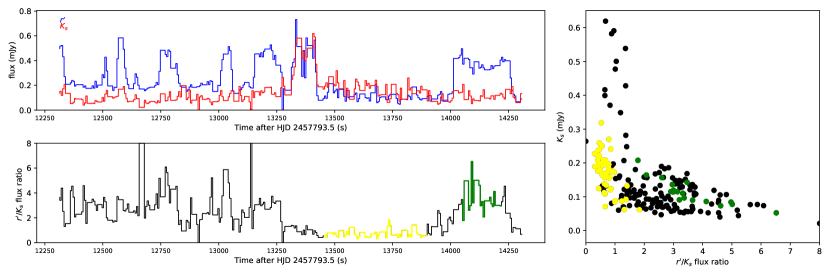
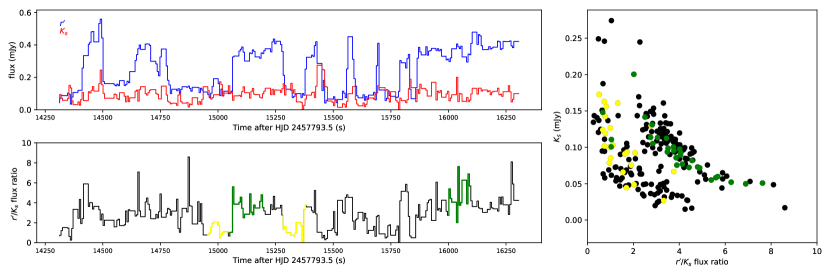
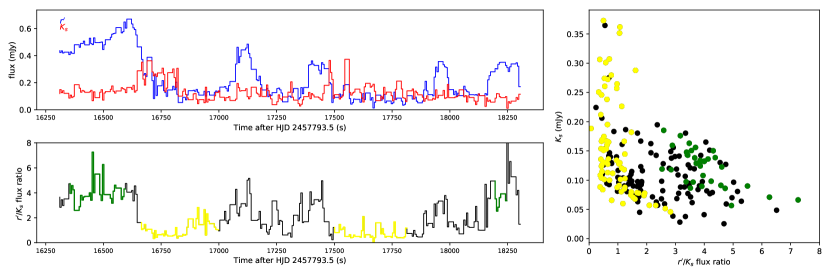
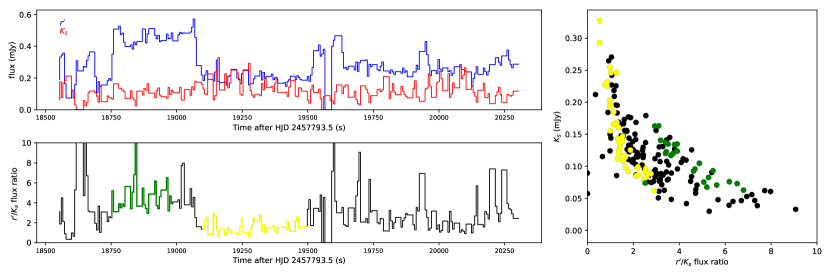
In Figs. 6 and 7 we show the de-trended light curves and the / flux ratio and the / versus -band flux ratio diagram. for each 2000 s block of data. The yellow and green points mark the passive and active-states, respectively, which are also shown in the / light curve plot. During the transition from the active to passive-state, the / flux ratio decreases because there is a larger decrease in the -band flux compared to the -band flux: there is a removal of a blue spectral component.
3.2 POWER DENSITY SPECTRUM
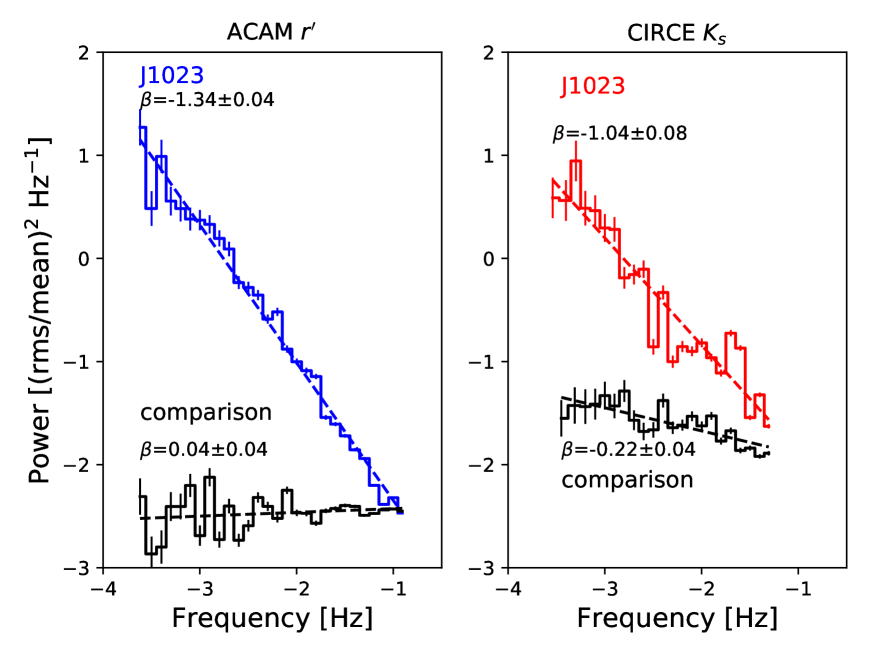
In Fig. 8 we show power density spectrum (PDS) of the de-reddened optical and near-IR light curves of PSR J1023+0038 (see Section 3). We use the Lomb-Scargle method to compute the periodograms (Press et al., 1992) with the constraints imposed by the Nyquist frequency, the typical duration of each observation and use the recipe given in Horne & Baliunas (1986) to calculate the number of independent frequencies. We then bin and fit the PDS in logarithmic space (Papadakis & Lawrence, 1993), where white noise level was subtracted by fitting the highest frequencies with a white-noise (constant) plus red-noise (power-law; ) model (only for the PSR J1023+0038 light curves). We find that the PDS of the - and -band light curve of PSR J1023+0038 is dominated by a red-noise component with a power-law index of -1.340.04 and -1.040.08, respectively, typical of aperiodic activity in X-ray binaries and X-ray transients in outburst and quiescence, which have in the range -1.0 to -2.0 (Zurita et al., 2003; Shahbaz et al., 2003; Hynes et al., 2003; Shahbaz et al., 2004, 2005; Shahbaz et al., 2010, 2013). The power-law index of the - and -band comparison star PDS =0.040.04 and -0.220.04, respectively. The -band PDS is consistent with zero, however, for the -band, the power-law index is significant, suggesting that there are systematic effects in the data (the PDS of the light curves using of a different local standard is also non-zero), possibly due to under-corrected cosmetic defects in the CIRCE engineering-grade detector array.
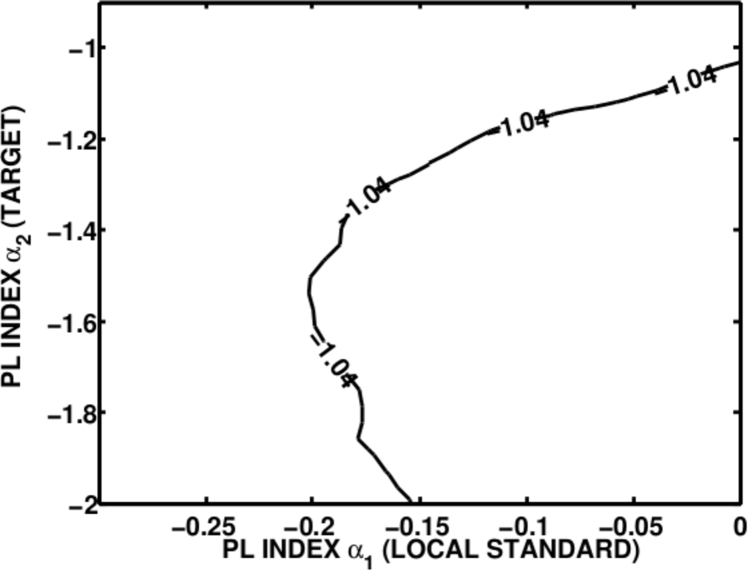
When determining the light curve of PSR J1023+0038 we divided the counts of PSR J1023+0038 into the counts of the local standard which does not vary To investigative the effects of using a red-noise dominated local standard star (which has some low level variability) when computing the differential light curve of PSR J1023+0038 and comparison star, we perform a Monte Carlo simulation where we generate light curves with exactly the same sampling and integration times as the PSR J1023+0038 data. For each Monte Carlo, we simulate two light curve (LC1 and LC2) using the method of Timmer & Koenig (1995), with different PDS power-law indices, and , respectively. We divide the two light curves (LC=LC2/LC1) and calculate the PDS. We perform 1000 simulations, bin and fit the PDS in logarithmic space (Papadakis & Lawrence, 1993), and then determine the PDS power-law index . We assume that the local standard (LC1) has low-level variability with =0.0 to 0.50, whereas, the target of interest (LC2) is dominated by red-noise, where =0.5–1.5. Our simulations show that lies between and , i.e. the red-noise dominated local standard light curve (LC1) makes power-law index of the differential light curve (LC) less steep. In Fig. 9 shows the results of a simulation where final light curve LC has =-1.04. As one can see the real PDS power-law index () of the target light curve LC2 is steeper than the power-law index of differential light curve LC, . Although we cannot determine the real power-law index of the PDS of the -band light curve because we do know the PDS power-law index of the local standard star used in the near-IR PSR J1023+0038 analysis. All we can say is we say is that the near-IR light curve of PSR J1023+0038 has a PDS of -1.040.08. Given that the PDS of the comparison star is -0.220.04, at most we expect a similar amount of variability in the local standard star. Hence, we find that -band PDS is steeper than the -band PDS. Both PDS have similar power at low-frequencies, however, the -band PDS has more variability at high frequencies.
4 DISCUSSION
4.1 The spectral energy distribution of the rectangular dips
To date there are three (PSR J1023+0038, M28I and XSS J12270–4859) transitional pulsars systems that transition between accretion-powered LMXB and rotation-powered radio pulsar states (Archibald et al., 2009; Papitto et al., 2013; Bassa et al., 2014). Of these systems PSR J1023+0038 and XSS J12270–4859 show rapid (10 s) transitions from a high X-ray luminosity active-state to a low luminosity passive-state. In PSR J1023+0038 similar optical transitions are observed but on a slightly longer time-scale (20 s. Simultaneous XMM–Newton X-ray and -band optical light curves show X-ray dips that do not usually have corresponding optical dips (Bogdanov, 2015). However, given that the -band dips are much weaker compared to in the -band (Shahbaz et al., 2015) combined with the large uncertainties in the -band data, one cannot cannot rule out if the dips are present and one cannot rule out that the X-ray and optical dips are direct counterparts of each other.
Shahbaz et al. 2015) therefore suggest that the optical analogue of the X-ray model-switching may be due to reprocessing of the X-ray signal.
During the active-state X-ray pulsations are observed, which implies that matter is being channelled onto the neutron star’s magnetic poles. However, during the passive-state there is no sign of X-ray pulsations (Bogdanov et al., 2014; Archibald et al., 2015; de Martino et al., 2013; Papitto et al., 2015). Indeed, optical pulsations have also been observed which are interpreted as being due to synchrotron emission by relativistic electrons and positrons in the pulsar magnetosphere (Ambrosino et al., 2017). In the proposed model, the particles residing at a constant fraction of the light cylinder radius have a power-law energy distribution and emit incoherent synchrotron radiation (Pacini & Salvati, 1983). The synchrotron self-absorption produces a turnover in the spectral energy distribution (SED) Indeed, in the Crab there is evidence for synchrotron self-absorption which is observed as a turnover in the SED near the -band (O’Connor et al., 2005).
Simultaneous X-ray and radio observations have revealed key features (Bogdanov et al., 2017). Firstly, an anti-correlation between the X-ray and radio flux in the active- and passive-states. During the X-ray active state and the radio luminosity is low and X-ray pulsations are observed, but when the source transitions into the passive-state, the pulsations disappear and the radio emission increases rapidly. Secondly, during the X-ray passive-state, the radio spectrum evolves from a self-absorbed to optically thin spectrum on time-scales of several minutes, reminiscent of a classical evolving synchrotron spectrum. Bogdanov et al. (2017) conclude the radio flares are due to expanding synchrotron emitting plasma arising from the inner regions of the accretion disc.
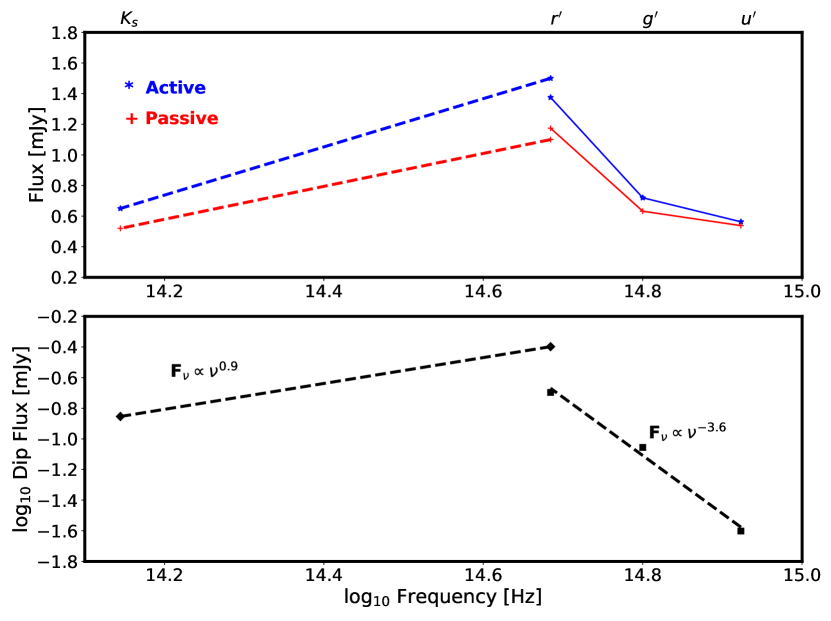
In Fig. 10 we show the SED of the -, - and -band dips observed in 2015 by Shahbaz et al. (2015) and the - and -band dips observed in 2017 (see Section 3). The SED shows a turnover which is what one expects if the synchrotron emission arises from an expanding synchrotron emitting plasma (Bogdanov et al., 2017) or synchrotron emission by relativistic electrons and positrons (Ambrosino et al., 2017). The synchrotron emission idea is also supported by the high -band PDS variability at high frequencies (inner disc regions; see Section 3.2), which is what one expects for emission is non-thermal, likely from optically thin synchrotron emission.
An alternative explanation for the turnover in the SED of the dips is from a combination of clumpy accretion and irradiation. In Figs. 6 and 7 we show the / versus -band flux ratio diagram for different sections of the data. As one can see, during the transition from the active to passive-state, the / flux ratio decreases because there is a larger decrease in the -band flux compared to the -band flux, i.e there is a disappearance of a blue component. This is what one would expect if the reprocessing optical component is removed during the active–passive state transitions while the synchrotron component remains constant (see Section 4.4). In contrast Shahbaz et al. (2015) observed the disappearance of a red spectral component and attributed it to the removal of an irradiated disc. The difference between the -band dip observed in 2015 and 2017 (see Fig. 10) is due to the different amounts of clumpy material at the time of the observations. The combination of the removal of a red and blue component with different strengths gives rise to a turnover in the SED which lies somewhere between the - and -band.
4.2 Comparison with X-ray binaries
Simultaneous optical and X-ray observations of X-ray binaries have revealed multi-component optical variability on sub-second time-scales, arising from components such as a hot inner flow, accretion disc reprocessing and a jet. These appears to be a common feature in many X-ray binaries during the hard state and resuls in as narrow positive peak is the observed in the CCF, superimposed on an anti-correlation (Durant et al., 2011; Durant et al., 2008; Gandhi et al., 2008; Malzac et al., 2003; Kanbach et al., 2001). Intense and rapid sub-second flaring is also seen and in a few systems it has been attributed to synchrotron emission from a jet (Gandhi et al., 2010; Malzac et al., 2004; Hynes et al., 2003). On time-scales of minutes Swift J1753.5−0127 has shown strong optical variations (Durant et al., 2009). Veledina et al. (2015); Veledina et al. (2017) have shown that the X-ray and optical variability in Swift J1753-0127 (Durant et al., 2008) is well reproduced by a simple model assuming that the optical variability is a mixture of X-ray reprocessing plus a hot flow synchrotron component that is exactly anti-correlated with respect to the X-rays. The hot flow model has also been used to explain the anti-correlated optical/X-ray behaviour in BW Cir (Pahari et al., 2017). Near-IR variations on time-scales of minutes have been observed in GRS 1915+105 and have been associated with synchrotron-emitting plasma (Fender et al., 1997; Eikenberry et al., 1998).
The shape of the optical/near-IR CCF of PSR J1023+0038, with the anti-correlation and a sharp rise at zero lag, resembles the optical/X-ray CCFs found in X-ray binaries, indicating an interplay of, at least, two separate components. This scenario was originally proposed for black hole X-ray binaries (Veledina et al., 2011), where the correlated component comes from the reprocessing of the incident X-ray flux, and the anti-correlated component originates from the hot accretion flow emitting in the optical via synchrotron. The time-scale of the optical and near-IR variability and correlations we observe in PSR J1023+0038 are, however, much longer than what is observed in other X-ray binaries.
A hot accretion flow can, in principle, can exist close to the pulsar magnetosphere and can be occasionally expelled away by the rotating magnetic field (Parfrey et al., 2017). Such synchrotron-emitting outflowing plasmoids arising from the inner regions of the accretion disc could then be responsible for the increased radio emission during the X-ray passive states (Bogdanov et al., 2017). Given the low luminosity, and hence, low accretion rate and electron number density in PSR J1023+0038 the hot flow synchrotron emission is likely to be optically thin down to the near-IR. The entire spectrum is thus similar to those of the outer parts of the hot flow for higher accretion rates (Veledina et al., 2013; Poutanen et al., 2014). A combination of the red synchrotron spectrum with the blue spectrum of reprocessed radiation (Veledina et al., 2018, in preparation) can produce the observed power-law (see Fig. 10).
The shape of the optical/near-IR CCF of PSR J1023+0038 somewhat resembles the optical/X-ray CCF observed in the black hole X-ray binary Swift J1753.5–0127 (Durant et al., 2008). However, the characteristic time-scales are different by an order of magnitude, and the broad positive peak at positive lags is missing in the CCF of Swift J1753.5–0127. The difference can be explained by the presence of a solid surface and neutron star magnetosphere in PSR J1023+0038. Because the accretion disc is truncated at this radius, the characteristic viscous time-scales are somewhat longer than in black hole binaries, giving broader features in the CCF. The absence of the broad peak at positive lags can be due to disappearance of the plasmoids under the event horizon, rather than their ejection, as is the case of PSR J1023+0038.
4.3 Light curve correlations
Reprocessing of high energy photons to lower energies in an extended accretion disc is thought to dominate the observed optical and near-IR fluxes. The expected cross-correlation signature is delayed because of the light travel time and smeared response of the optical and near-IR light curves with respect to the X-ray light curve. The optical and near-IR light curve is the convolution of the X-ray light curve with a broad transfer function representing the response of the extended accretion disc. The inner regions of the accretion disc reprocess high energy X-rays into the soft X-rays/UV bands. Therefore we expect the near-IR ACF to be broader than the optical CCF and the CCF to show a single strong, positive peak at positive lags (near-IR arriving after optical).
At first sight the ACFs of the entire - and -band light curves have different width cores and wings (see Section 3.1.1). Near the the -band ACF is broader than the -band ACF which argues for a reprocessing origin for the slowly-variable component, most likely in the outer regions of the accretion disc. However, very close to the core, the -band ACF is broader than the -band ACF, which argues against a simple reprocessing origin. A detailed look at the ACF for different segments in time reveals that on average the -band ACF is a factor of 3–4 times broader than the -band ACF (see Fig 5), which is not what one would expect from a reprocessing model. A broader -band ACF is expected if the -band PDS is steeper than the -band PDS (Peterson, 2001) which implies that there is more aperiodic variability from the accretion disc at low frequencies (outer disc regions) in the -band light curve compared to the -band. However, we find that the -band PDS is steeper than the -band PDS (even allowing for the systematic effects, see Section 3.1.1) and that the -band PDS has more variability at high frequencies from the inner regions of the accretion disc/pulsar magnetosphere (see Section 3.2). This is what one expects for emission from a non-thermal component such as optically thin synchrotron emission.
The CCF of the simultaneous optical and near-IR data reveals a strong, broad negative anti-correlation and negative lags and a broad positive correlation at positive lags, with a strong, positive and narrow correlation superimposed (see Fig. 3). The broad positive correlation implies that the optical leads the near-IR flux. However, the broad negative delay implies the optical band is delayed with respect to the near-IR and the anti-correlation implies that the variability between the near-IR and optical fluxes is out of phase.
The narrow correlation implies that optical leads the near-IR flux, consistent with a reprocessing origin. The +5 s correlation is similar to the time-scale we would expect for the light travel time between the binary components. The light travel times of photons arise from the differences between the time of flight of photons that are observed directly and those that are re-processed and re-emitted before travelling back to the observer. For PSR J1023+0038 with an orbital period of 4.75 h, the corresponding binary separation of 1.8 (assuming a total binary mass of 2 ) implies a light travel time of 4 light-seconds. However, given that the delay is not phase resolved, it is not always present in the CCFs (see Figs. 6 and 7), suggesting that it is not due to the reprocessing on the secondary star, but is due to reprocessing in the accretion disc.
4.4 The hot accretion flow model
The observed broad anti-correlation at negative lags implies that the optical flux is delayed with respect to the near-IR flux and the anti-correlation implies that the variability between the near-IR and optical fluxes is out of phase. These features are not due to reprocessing because a reprocessing CCF would rise quickly near zero and fall less quickly towards positive lags (O’Brien et al., 2002). The broad components of the CCF and the sudden change near zero lag are strongly indicative of at least two separate processes superposed in the light curves, such as a hot flow for the anti-correlation and a reprocessing/jet component for the positively correlated optical/near-IR components. A combination of reprocessing and the interaction of a hot flow with the pulsar magnetosphere can produce the observed optical/near-IR correlations.
Given that the reprocessed emission is expected to have a blue spectrum, we expect it to be more prominent in the -band compared to in the -band. We propose that the -band emission is totally dominated by the reprocessed component, while the -band contains both synchrotron and reprocessed emission. In the optical the reprocessing component dominates in the active–state transiton and decreases during the transition. In the near-IR, there are two components, a reprocessing component which also decreases (but not as much as in the optical) during the transition, however, the synchrotron does not, which results in the removal of the blue spectral component during the dips (see Figs. 6 and 7). If the accretion proceeds through the occasional penetration of the clumps/blobs of plasma through the magnetic barrier, the following scenario can lead to the observed near-IR/optical CCF. Consider the hot accretion flow with the inner radius close to the magnetospheric radius and emitting through the synchrotron self-Compton mechanism (similar to the hot flows in black hole X-ray binaries (Poutanen & Veledina, 2014). If there is a local increase in the mass transfer rate, then the accretion flow becomes inhomogeneous and the resulting spectrum depends on the local number density of electrons. For a higher electron number density the (near-IR) synchrotron emission is suppressed due to the increased self-absorption. The inhomogeneities in the hot accretion flow containing a higher electron number density have a higher chance to penetrate through the magnetic barrier, hence once there is a sufficiently dense plasmoid, with the near-IR synchrotron emission suppressed, the flow accretes/drifts towards the compact object causing an increase in the X-ray emission. The X-ray emission triggers the reprocessing in the disc, both in the optical and near-IR (likely without a significant delay between them). The plasmoids are then expelled by the rotating magnetic field, forming an outflow and giving rise to the increase of the synchrotron near-IR emission as the plasmoids become optically thin. At the same time, the X-ray luminosity drops and the source switches to the passive state. Indeed, these ideas are further supported by the fact that transition from the X-ray active to X-ray passive state are always accompanied by a radio brightening, which has been interpreted as being due to rapid ejections synchrotron emitting plasma by the pulsar Bogdanov et al. (2017).
The near-IR/optical CCF can be explained by two components, synchrotron emission from plasmoids and reprocessing. The dip at negative lags corresponds to the suppression of the near-IR synchrotron emission of the plasmoids in hot accretion flow, which occurs just before the X-ray switches to the active-state. The narrow peak at 5 s corresponds to the delayed reprocessed component, enhanced by the increased X-ray emission (O’Brien et al., 2002). The broad positive correlation at positive lags is driven by the increased synchrotron emission of the outflowing plasmoids, which become optically thin as they expand. The width of the anti-correlation and broad positive correlation corresponds to the characteristic time-scale for the penetration of the (entire) inhomogeneity into the magnetosphere, which is roughly comparable to the viscous time-scale at the magnetospheric radius. In the -band light curves, this corresponds to the average duration of the active-state.
In Fig. 11 we show model predictions for the optical and near-IR ACFs and CCFs expected from the hot accretion flow model. Our aim is to show that the model can indeed reproduce the main features of the CCFs. We leave the detailed modelling to a future paper, as it involves a number of unknown parameters for the disc and synchrotron components. To model the ACFs and CCFs, we simulate the light curve as mass accretion rate fluctuations from a prescribed PDS shape using the Timmer & Koenig (1995) algorithm. We assume that the X-ray light curve is proportional to the mass accretion rate light curve. We assume a zero-peak Lorentzian profile for the PDS accretion rate and equal contributions of the disc and synchrotron components. The disc to synchrotron ratio determines the relative importance of the dip and peak in the CCF (Veledina et al., 2017). The -band light-curve is obtained by convolving the X-ray light curve with the accretion disc transfer function. The synchrotron emission of the plasmoids is simulated through the mean-subtracted accretion rate light curve. For the radiation of the hot flow we take this light curve with a minus sign (similar to eq. 2 of Veledina et al. 2011) and shift it in time so that it leads the X-rays. The synchrotron emission of expanding plasmoids is modelled as the accretion rate light curve, shifted in time towards positive lags, i.e. it comes after the X-rays. The band contains the synchrotron components of the plasmoids and the reprocessed component. The main parameters effecting the shape of the CCF are the assumed PDS shape of the mass accretion rate fluctuations and relative contribution of various synchrotron/disc components. The model predictions for the optical and near-IR ACFs and CCFs expected are shown in Fig. 11. As one can see there is a remarkable agreement in the general features predicted by the model with what is observed, a broad negative anti-correlation at negative lags, a broad positive correlation at positive lags, with a strong, positive narrow correlation superimposed.
If the active-state luminosity erg s-1 (Archibald et al., 2015; Bogdanov, 2015) is due to accretion, i.e. , where the neutron star mass is (Deller et al., 2012), radius km (Nättilä et al., 2016) and is the gravitational constant, then the accretion rate is . With this mass inflow rate at the magnetospheric boundary, the active-state magnetospheric radius (the radius when the pressure of the neutron star magnetosphere is able to halt the inflowing matter) is km, assuming a dipole magnetic field with strength G (Archibald et al., 2009; Deller et al., 2012). In the passive-state, the mass inflow rate is likely smaller, leading to a higher magnetospheric radius. The corotation radius (at which the matter in Keplerian orbit co-rotates with the neutron star) is =24 km and the light cylinder radius (at which field lines anchored to the neutron star rotate at the speed of light) is = 80 km. Hence for such low X-ray luminosities, the magnetospheric radius exceeds the light cylinder radius, and by far exceeds the corotation radius. This implies that the hot flow has to be truncated outside of the light cylinder, 100 km. The viscous time-scale at this radius is of the order of a few 100 s, which is roughly consistent with the width of the negative dip and broad peak in the CCF. The magnetic field inside the flow is likely self-generated by the flow and can be much lower than at the neutron star surface. We estimate the magnetic field inside the flow using condition that the turnover frequency is close to -band and the requirement for the observed synchrotron luminosity is equal to the synchrotron luminosity at the turnover frequency. Using eq. (6) of Veledina et al. (2013) for the -band flux at a radius of 100 km and a distance of 1.368 kpc (Deller et al., 2012), we obtain a rough estimate for the magnetic field strength inside the hot flow of G, which is comparable to the magnetic field of the pulsar at this radius. We leave the detailed spectral and timing modelling of the observed characteristics to a future paper.
CONCLUSION
Below we list the main results of this paper.
-
1.
Our simultaneous - and -band light curves show rectangular, flat-bottomed dips, similar to the X-ray mode-switching (active–passive state transitons) behaviour observed previously. During the active–passive state transition, the / flux ratio decreases due to the larger decrease in the -band flux compared to the -band flux. The SED of the dips (active minus passive flux) shows a turnover between the - and -band.
-
2.
The CCF of the optical and near-IR data reveals a strong, broad negative anti-correlation and negative lags, a broad positive correlation at positive lags, with a strong, positive narrow correlation superimposed. The shape of the CCF resembles the optical/X-ray CCF observed in the black hole X-ray binary Swift J1753.5–0127, but the time-scales are different. The difference can be explained by the presence of a solid surface and the pulsar’s magnetosphere in PSR J1023+0038.
The active–passive transiton and features in the CCF can be explained by reprocessing and a hot accretion flow close to the neutron star’s magnetospheric radius. Since the accretion disc is truncated at distance comparable to the magnetospheric radius, the characteristic viscous time-scales are longer than in black hole binaries, giving broader features in the CCF. The optical emission is dominated by the reprocessed component, whereas the near-IR emission contains a component due to the emission from plasmoids in the hot accretion flow and a reprocessed component.
The rapid transitions between the active and passive states are due to the penetration of the hot accretion flow material onto the neutron star and the expelling of the blobs of synchrotron emitting plasma fed by the hot inner flow from the magnetosphere. The plasmoids are expelled by the rotating magnetic field of the neutron star, giving rise to the increase of the synchrotron near-IR emission as they expand and become optically thin. During the active–passive transition the optical reprocessing component decreases which results in the removal of a blue spectral component. The combination of the red synchrotron spectrum with the blue reprocessed spectrum also produces the observed SED. The dip at negative lags corresponds to the suppression of the near-IR synchrotron component in the hot flow, whereas the broad positive correlation at positive lags is driven by the increased synchrotron emission of the outflowing plasmoids. The narrow peak in the CCF is due to the delayed reprocessed component, enhanced by the increased X-ray emission. The accretion of clumpy material through the magnetic barrier of the neutron star produces the observed near-IR/optical CCF and variability.
ACKNOWLEDGEMENTS
TS acknowledges support from the Spanish Ministry of Economy and Competitiveness (MINECO) under the grant AYA2013-42627. AV acknowledges support from the Academy of Finland grant 309308. P.G. thanks STFC (ST/J003697/2) for support. The ACAM and CIRCE data are based on observations made with William Herschel Telescope and the Gran Telescopio Canarias, respectively, installed in the Spanish Observatorio del Roque de los Muchachos of the Instituto de Astrofísica de Canarias, in the island of La Palma. Development of CIRCE was supported by the University of Florida and the National Science Foundation (grant AST-0352664), in collaboration with IUCAA.
Facilities: WHT (ACAM), GTC (CIRCE)
References
- Alpar et al. (1982) Alpar M. A., Cheng A. F., Ruderman M. A., Shaham J., 1982, Nature, 300, 728
- Ambrosino et al. (2017) Ambrosino F., et al., 2017, preprint, (arXiv:1709.01946)
- Archibald et al. (2009) Archibald A. M., et al., 2009, Science, 324, 1411
- Archibald et al. (2015) Archibald A. M., et al., 2015, ApJ, 807, 62
- Bassa et al. (2014) Bassa C. G., et al., 2014, MNRAS, 441, 1825
- Bogdanov (2015) Bogdanov S. e. a., 2015, ApJ, 806, 148
- Bogdanov & Halpern (2015) Bogdanov S., Halpern J. P., 2015, ApJ, 803, L27
- Bogdanov et al. (2014) Bogdanov S., Patruno A., Archibald A. M., Bassa C., Hessels J. W. T., Janssen G. H., Stappers B. W., 2014, ApJ, 789, 40
- Bogdanov et al. (2017) Bogdanov S., et al., 2017, preprint, (arXiv:1709.08574)
- Cardelli et al. (1989) Cardelli J. A., Clayton G. C., Mathis J. S., 1989, ApJ, 345, 245
- Deller et al. (2012) Deller A. T., et al., 2012, ApJ, 756, L25
- Durant et al. (2008) Durant M., Gandhi P., Shahbaz T., Fabian A. P., Miller J., Dhillon V. S., Marsh T. R., 2008, ApJ, 682, L45
- Durant et al. (2009) Durant M., Gandhi P., Shahbaz T., Peralta H. H., Dhillon V. S., 2009, MNRAS, 392, 309
- Durant et al. (2011) Durant M., et al., 2011, MNRAS, 410, 2329
- Edelson & Krolik (1988) Edelson R. A., Krolik J. H., 1988, ApJ, 333, 646
- Eikenberry et al. (1998) Eikenberry S. S., Matthews K., Murphy Jr. T. W., Nelson R. W., Morgan E. H., Remillard R. A., Muno M., 1998, ApJ, 506, L31
- Eikenberry et al. (2017) Eikenberry S. S., et al., 2017, preprint, (arXiv:1709.05542)
- Fender et al. (1997) Fender R. P., Pooley G. G., Brocksopp C., Newell S. J., 1997, MNRAS, 290, L65
- Gandhi et al. (2008) Gandhi P., et al., 2008, MNRAS, 390, L29
- Gandhi et al. (2010) Gandhi P., et al., 2010, MNRAS, 407, 2166
- Halpern et al. (2013) Halpern J. P., Gaidos E., Sheffield A., Price-Whelan A. M., Bogdanov S., 2013, The Astronomer’s Telegram, 5514
- Horne & Baliunas (1986) Horne J. H., Baliunas S. L., 1986, ApJ, 302, 757
- Hynes et al. (2003) Hynes R. I., Charles P. A., Casares J., Haswell C. A., Zurita C., Shahbaz T., 2003, MNRAS, 340, 447
- Kanbach et al. (2001) Kanbach G., Straubmeier C., Spruit H. C., Belloni T., 2001, Nature, 414, 180
- Malzac et al. (2003) Malzac J., Belloni T., Spruit H. C., Kanbach G., 2003, A&A, 407, 335
- Malzac et al. (2004) Malzac J., Merloni A., Fabian A. C., 2004, MNRAS, 351, 253
- Nättilä et al. (2016) Nättilä J., Steiner A. W., Kajava J. J. E., Suleimanov V. F., Poutanen J., 2016, A&A, 591, A25
- O’Brien et al. (2002) O’Brien K., Horne K., Hynes R. I., Chen W., Haswell C. A., Still M. D., 2002, MNRAS, 334, 426
- O’Connor et al. (2005) O’Connor P., Golden A., Shearer A., 2005, ApJ, 631, 471
- Pacini & Salvati (1983) Pacini F., Salvati M., 1983, ApJ, 274, 369
- Pahari et al. (2017) Pahari M., Gandhi P., Charles P. A., Kotze M. M., Altamirano D., Misra R., 2017, MNRAS, 469, 193
- Papadakis & Lawrence (1993) Papadakis I. E., Lawrence A., 1993, MNRAS, 261, 612
- Papitto et al. (2013) Papitto A., et al., 2013, Nature, 501, 517
- Papitto et al. (2015) Papitto A., de Martino D., Belloni T. M., Burgay M., Pellizzoni A., Possenti A., Torres D. F., 2015, MNRAS, 449, L26
- Parfrey et al. (2017) Parfrey K., Spitkovsky A., Beloborodov A. M., 2017, MNRAS, 469, 3656
- Patruno et al. (2014) Patruno A., et al., 2014, ApJ, 781, L3
- Peterson (2001) Peterson B. M., 2001, in Aretxaga I., Kunth D., Mújica R., eds, Advanced Lectures on the Starburst-AGN. p. 3 (arXiv:astro-ph/0109495), doi:10.1142/9789812811318_0002
- Poutanen & Veledina (2014) Poutanen J., Veledina A., 2014, Space Sci. Rev., 183, 61
- Poutanen et al. (2014) Poutanen J., Veledina A., Revnivtsev M. G., 2014, MNRAS, 445, 3987
- Press et al. (1992) Press W. H., Teukolsky S. A., Vetterling W. T., Flannery B. P., 1992, Numerical recipes in FORTRAN. The art of scientific computing. Cambridge: University Press
- Radhakrishnan & Srinivasan (1982) Radhakrishnan V., Srinivasan G., 1982, Current Science, 51, 1096
- Robertson et al. (2015) Robertson D. R. S., Gallo L. C., Zoghbi A., Fabian A. C., 2015, MNRAS, 453, 3455
- Shahbaz et al. (2003) Shahbaz T., Dhillon V. S., Marsh T. R., Zurita C., Haswell C. A., Charles P. A., Hynes R. I., Casares J., 2003, MNRAS, 346, 1116
- Shahbaz et al. (2004) Shahbaz T., Hynes R. I., Charles P. A., Zurita C., Casares J., Haswell C. A., Araujo-Betancor S., Powell C., 2004, MNRAS, 354, 31
- Shahbaz et al. (2005) Shahbaz T., Dhillon V. S., Marsh T. R., Casares J., Zurita C., Charles P. A., Haswell C. A., Hynes R. I., 2005, MNRAS, 362, 975
- Shahbaz et al. (2010) Shahbaz T., Dhillon V. S., Marsh T. R., Casares J., Zurita C., Charles P. A., 2010, MNRAS, 403, 2167
- Shahbaz et al. (2013) Shahbaz T., Russell D. M., Zurita C., Casares J., Corral-Santana J. M., Dhillon V. S., Marsh T. R., 2013, MNRAS, 434, 2696
- Shahbaz et al. (2015) Shahbaz T., et al., 2015, MNRAS, 453, 3461
- Stappers et al. (2013) Stappers B. W., et al., 2013, The Astronomer’s Telegram, 5513
- Stappers et al. (2014) Stappers B. W., et al., 2014, ApJ, 790, 39
- Takata et al. (2014) Takata J., et al., 2014, ApJ, 785, 131
- Tendulkar et al. (2014) Tendulkar S. P., et al., 2014, ApJ, 791, 77
- Timmer & Koenig (1995) Timmer J., Koenig M., 1995, A&A, 300, 707
- Veledina et al. (2011) Veledina A., Poutanen J., Vurm I., 2011, ApJ, 737, L17
- Veledina et al. (2013) Veledina A., Poutanen J., Vurm I., 2013, MNRAS, 430, 3196
- Veledina et al. (2015) Veledina A., Revnivtsev M. G., Durant M., Gandhi P., Poutanen J., 2015, MNRAS, 454, 2855
- Veledina et al. (2017) Veledina A., Gandhi P., Hynes R., Kajava J. J. E., Tsygankov S. S., Revnivtsev M. G., Durant M., Poutanen J., 2017, MNRAS, 470, 48
- Zurita et al. (2003) Zurita C., Casares J., Shahbaz T., 2003, ApJ, 582, 369
- de Martino et al. (2013) de Martino D., et al., 2013, A&A, 550, A89